NVAB Commissionaire Structure ucturing
33
Governance of commissionaire and LRD business models Rutger Hafkenscheid OCTOBER 29, 2010 VMW TAXAND
-
Upload
rutgerhafkenscheid -
Category
Documents
-
view
264 -
download
1
Transcript of NVAB Commissionaire Structure ucturing
Governance of commissionaire and LRD business models
Rutger Hafkenscheid
OCTOBER 29, 2010
VMWTAXAND

Some trends
• Since 1990, globalization and ERP software development allowed global & centralized business functions, such as
• r&d• marketing• sourcing & procurement• manufacturing• inventory management• distribution.
• Business restructuring helped to rationalize these functions and optimize their supply chain and the efficient use of business resources.
• These business restructurings also allowed companies to optimize their tax structure and transfer pricing systems by concentrating business risks and the expected profits attached to those risks in low tax juridisctions.

Example: before restructuring
Production plants
Production plants
Sales officesSales officesSupplierSupplier CustomerCustomer
Credit
Price
Inventory
Product apetite
Sourcing
Financing
Price
Capacity
Employment cost
Employment cost
$50 $250$150
Profit $100@30%
Profit $100@30%
Profit $200@30%

Example: after restructuring
Toll Manufact.
Toll Manufact. LRDLRD
SupplierSupplier CustomerCustomer
Credit
Price
Inventory
Product apetite
Sourcing
Financing
Price
Capacity
Employment cost
Employment cost
Central Enterprene
ur
Central Enterprene
ur $250$50
Profit $20@30%
Profit $20@30%
Profit $160@10%
Profit $200@14%

A typical US MNE structure
Toll Manufact.
Toll Manufact. LRDLRD
Central Enterprene
ur(Tax haven)
Central Enterprene
ur(Tax haven)
US ParentUS Parent
Profit $20@30%
Profit $20@30%
Profit $160@10%
Profit $200@14%
Profit $200 @35%Credit @14%

Conclusion
• The IRS sees tax revenu decline• Local authorities see tax revenu decline

Relation between profit allocation and ETR?
Source: Tax Notes Services, August 16, 2010
‘The amount of profit shifted to low-tax countries is not consistent with the measurable economic activity in those countries’
2010 OECD TP Guidelines
Tax authorities may test• Arm’s length character of the restructuring• Whether the paperwork reflects reality• Whether the CE assuming the risk has actual control over it• The risk allocation
(Re)allocation of risk
TPG 9.10: Risks are of critical importance in the context of business restructurings. (….) In the open market, the assumption of increased risk would also be compensated by an increase in the expected return, although the actual return may or may not increase depending on the degree to which the risks are actually realised.
Notion: there is (or should be) an arm’s length relation between risk and return

Risk
• Inherent to risk is that one event may have two or more scenarios and thus two or more outcomes
• Economic theory uses three measurements to evaluate risk• Expected value• Variance• WACC

Expected value
• Definition: probability weighted average of all possible outcomes.• Example
• Allows to compare two investments with different returns and risk profiles.
Variance
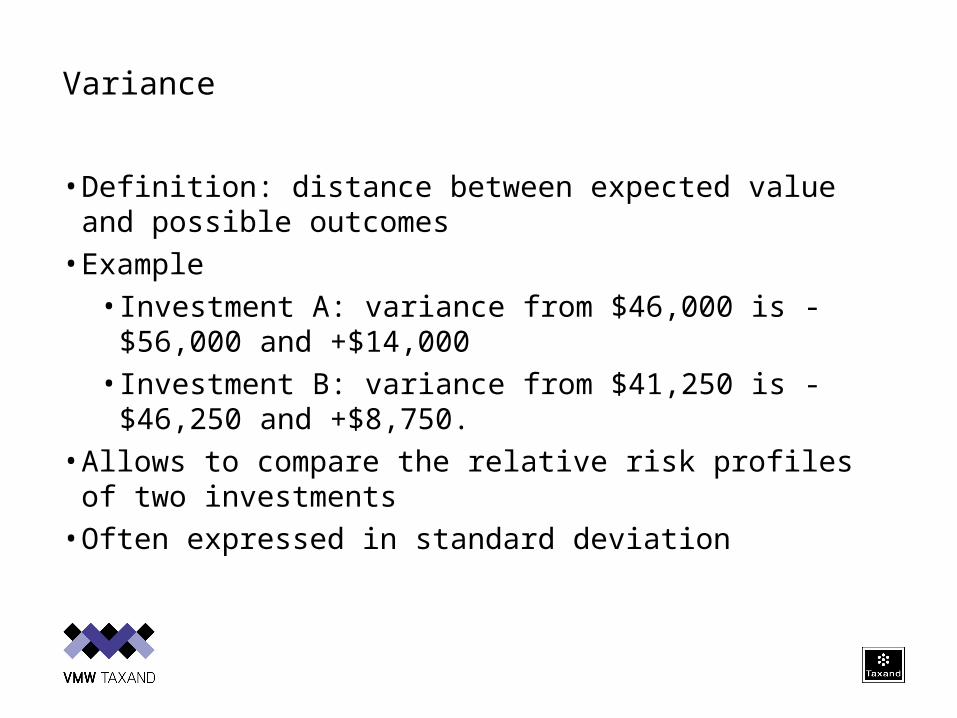
• Definition: distance between expected value and possible outcomes
• Example
• Investment A: variance from $46,000 is -$56,000 and +$14,000
• Investment B: variance from $41,250 is -$46,250 and +$8,750.
• Allows to compare the relative risk profiles of two investments
• Often expressed in standard deviation

Risk-return relation
Expected return
Expected return
VarianceVariance

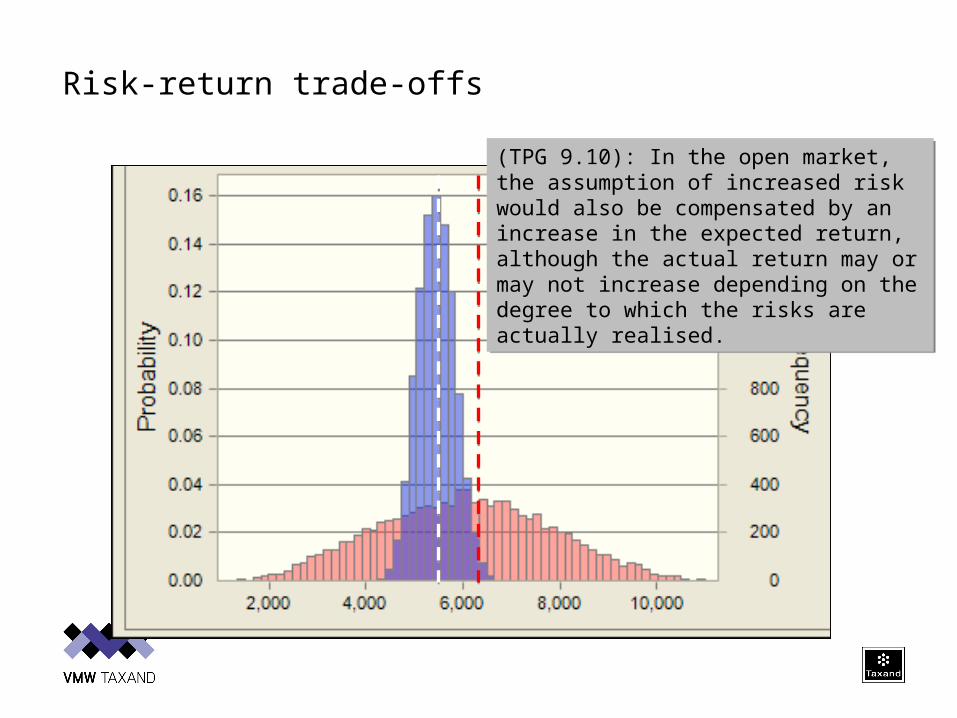
Risk-return trade-offs
Risk premiumRisk premium
Profit potential given up
Profit potential given up
Loss potential hedged
Loss potential hedged

Weighted average cost of capital (WACC)
WACCWACC
Average cost of equity
Average cost of equity
Average cost of debt
Average cost of debt
Capital structure
(D/E Ratio)
Capital structure
(D/E Ratio)
Cost of equityCost of equity
Average gross cost of
debt
Average gross cost of
debtTax shieldTax shield
Risk free rate
(3-4%)
Risk free rate
(3-4%)
Market risk premium(4-5%)
Market risk premium(4-5%)
Industry beta(0.68-2.4)
Industry beta(0.68-2.4)
Allows to compare the values of two investments with a different risk profile by discounting their cashflows at a risk adjusted discount rate

Example

Risk-return trade-offs
WACC 12%WACC 12%
WACC 7%WACC 7%
Risk-return trade-offs
(TPG 9.10): In the open market, the assumption of increased risk would also be compensated by an increase in the expected return, although the actual return may or may not increase depending on the degree to which the risks are actually realised.
(TPG 9.10): In the open market, the assumption of increased risk would also be compensated by an increase in the expected return, although the actual return may or may not increase depending on the degree to which the risks are actually realised.
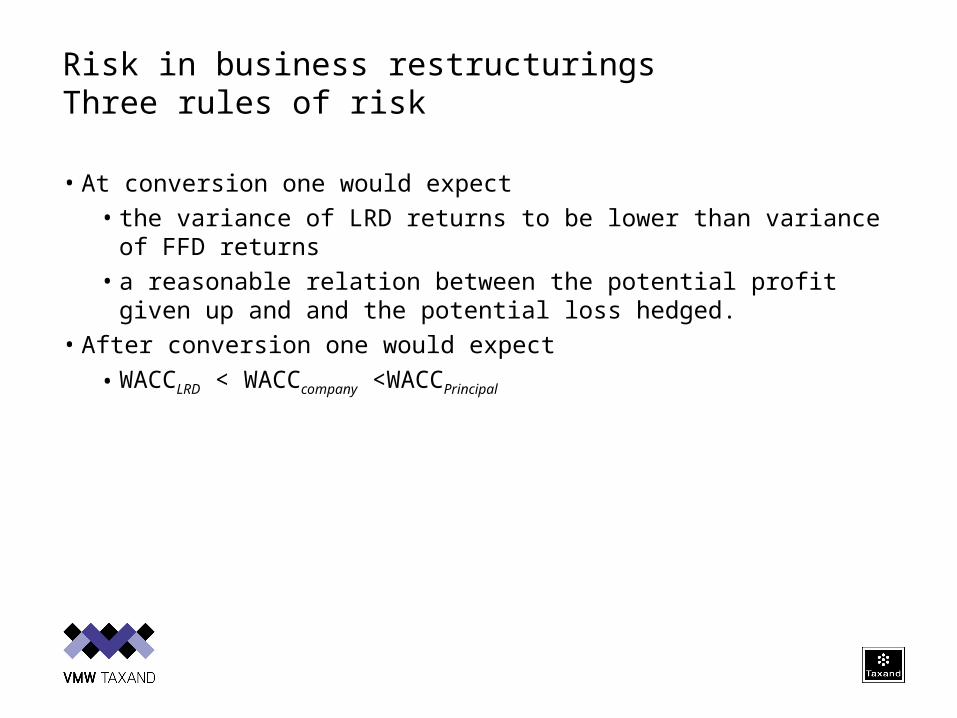
Risk in business restructuringsThree rules of risk
• At conversion one would expect
• the variance of LRD returns to be lower than variance of FFD returns
• a reasonable relation between the potential profit given up and and the potential loss hedged.
• After conversion one would expect
• WACCLRD < WACCcompany <WACCPrincipal

Case studyFFD Business Model
Operational profit
Operational profit
RevenuRevenu
SalesSales
ASP($47,50-$52,50)
ASP($47,50-$52,50)
Sales volume(850k—950k)
Sales volume(850k—950k)
Cost of sales
Cost of sales
ACP($37,50)
ACP($37,50)
Sales volume
(850k-950k)
Sales volume
(850k-950k)
OpexOpex
Fixed Opex($5.5m)
Fixed Opex($5.5m)
Variable Opex
Variable Opex
Cost ratio(10%)
Cost ratio(10%) SalesSales
ASP($47,50-$52,50)
ASP($47,50-$52,50)
Sales volume
(850k-950k)
Sales volume
(850k-950k)

Case study

Risk distribution FFD

Conversion FFD into commissionaireMidpoint commission rate: 2%Upper Quartile commission rate: 5%
Options realistically available:
Current situation:

Conversion FFD into commissionaireMidpoint commission rate: 2%Upper Quartile commission rate: 5%
5% commission rate2% commission rate

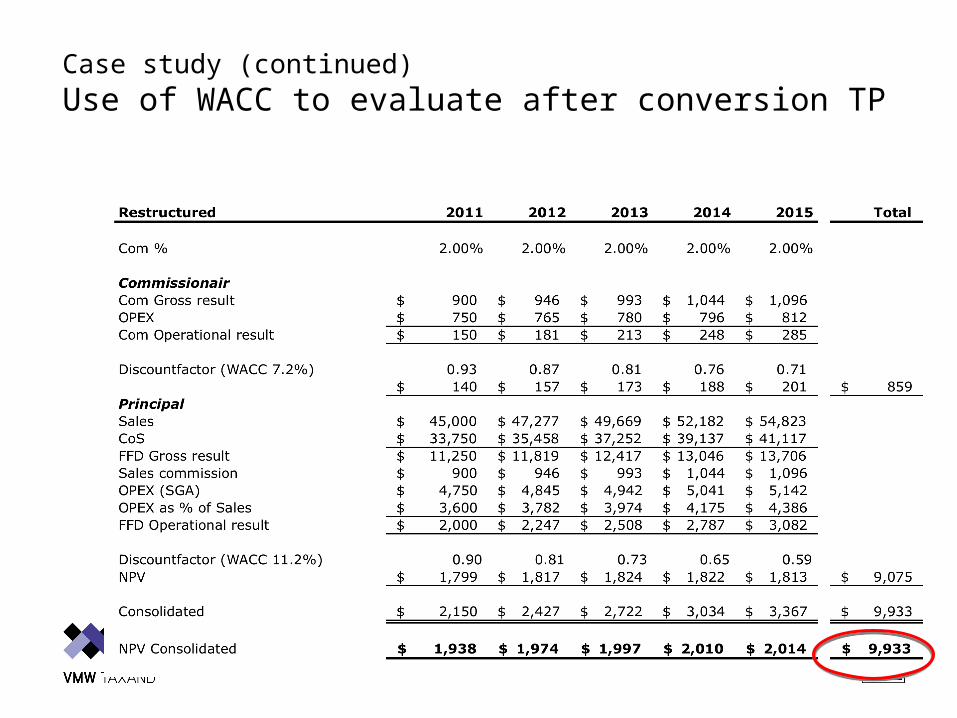
Case study (continued)Use of WACC to evaluate after conversion TP
Value Consolidated
Value Consolidated
Value LRDValue LRD Value PrincipalValue Principal
Forecast LRD profit
Forecast LRD profit LRD WACCLRD WACC Forecast
Principal profitForecast
Principal profit Principal WACCPrincipal WACC

Case study (continued)
Use of WACC to evaluate after conversion TP
Case study (continued)
Use of WACC to evaluate after conversion TP

Case study (continued)
Solved on commissionaire WACC
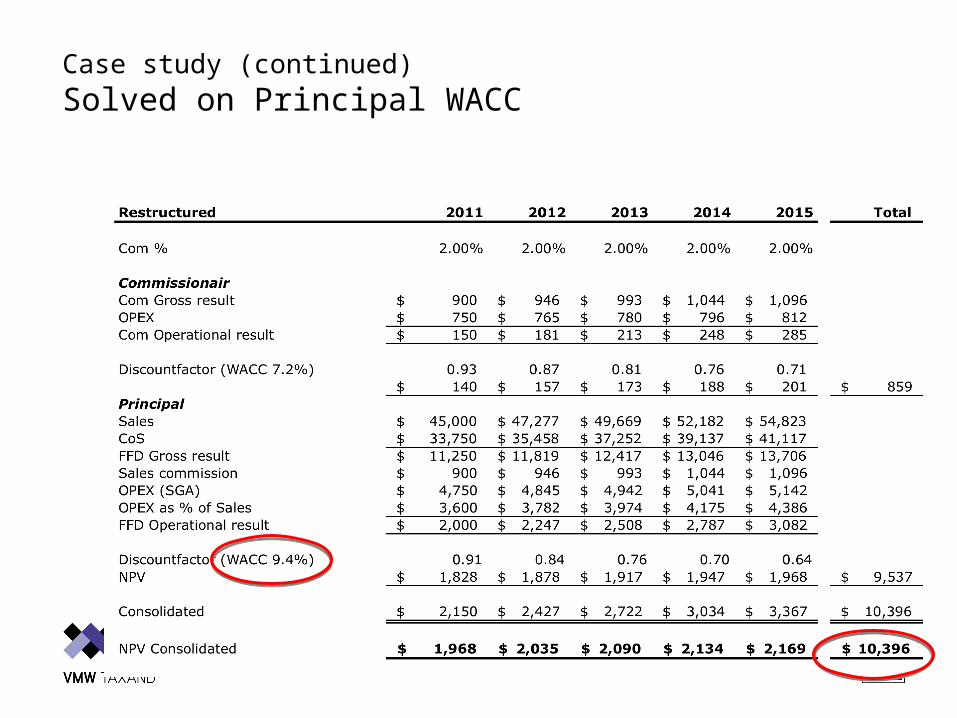
Case study (continued)
Solved on Principal WACC
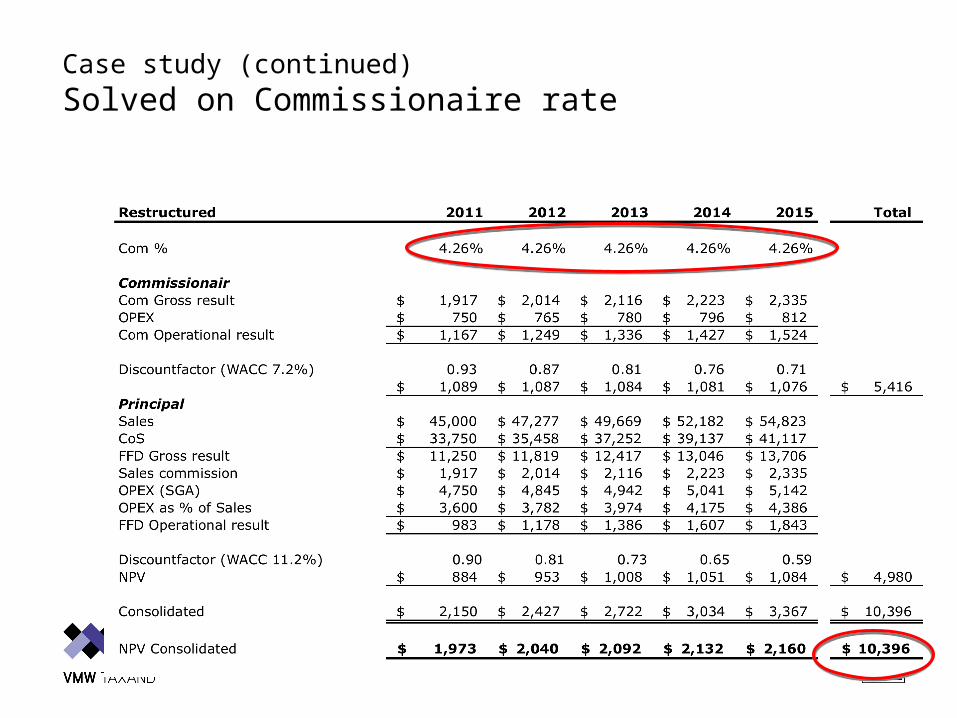
Case study (continued)
Solved on Commissionaire rate
… But how about the benchmark studies?
1 Tax authorities have become as good in manipulating databases as taxpayers.
2 Databases allow only a qualitative functional analysis, but no quantitative
3 >70% cross border transactions are intercompany, and the number is increasing. So how reliable is a database?

Morale of this story
1 Do an economic sanity check on the risk allocation of a business restructuring before the tax authorities do it for you…
2 Why interesting for lawyers? – Client privilege!