Study of Nutritional Factors in Food Allergies and Food Intolerance

Nutritional Consequences of Food Allergies
Marion Groetch, MS, RDN
Director of Nutrition Services
Jaffe Food Allergy Institute

Financial: Nutricia North America
Royalties: UpToDate
Disclosures
Mount Sinai 2015 2

Objectives
▶ Identify potential causes of nutritional risks in children and adults with food allergies
▶ Review the nutritional outcomes that have been measured in the literature
▶ Evaluate the impact of nutrition counseling on nutrient intake and growth in children
Mount Sinai 2015 3

Allergens Main Nutrients
Cow’s Milk • Protein, fat
• Calcium, Magnesium, Phosphorus, Iodine
• A, B6, B12, D, Riboflavin, Pantothenic Acid
Wheat • Carbohydrate
• Magnesium, Phosphorus, Potassium, Zinc
• Frequently in enriched cereal products: Iron, Thiamine,
Niacin, Riboflavin, Folate
Soy • Protein, fat
• Calcium, Phosphorus, Magnesium, Iron, Zinc
• Thiamine, Riboflavin, Vitamin B6, Folate
Egg • Protein, fat
• Iron, Selenium, Choline
• Biotin, Vitamins B12, Pantothenic Acid, Folate, Riboflavin
Fish/Shellfish • Protein, fat, Omega-3 fatty acids
• Iodine, Choline
• Vitamins A and D
Peanut/Tree nuts • Protein, fat
• Vitamin E, niacin, magnesium, chromium 4

Q. What are the dietary recommendations for
children with food allergies?
Alternative sources
Cow’s Milk • Infants / Young toddlers (< 2 years)- breast milk or substitute formula
• Older toddlers (>2 years)- Calcium supplement
• Fortified alternative beverages were not specifically grade-evaluated
such as soy, rice, hemp, almond, oat, coconut but can be used on an
individual basis- if tolerated
5
JACI 2010 Dec;126(6):1119-28
World Allergy Organization Diagnosis and Rationale for Action
against Cow’s Milk Allergy- DRACMA
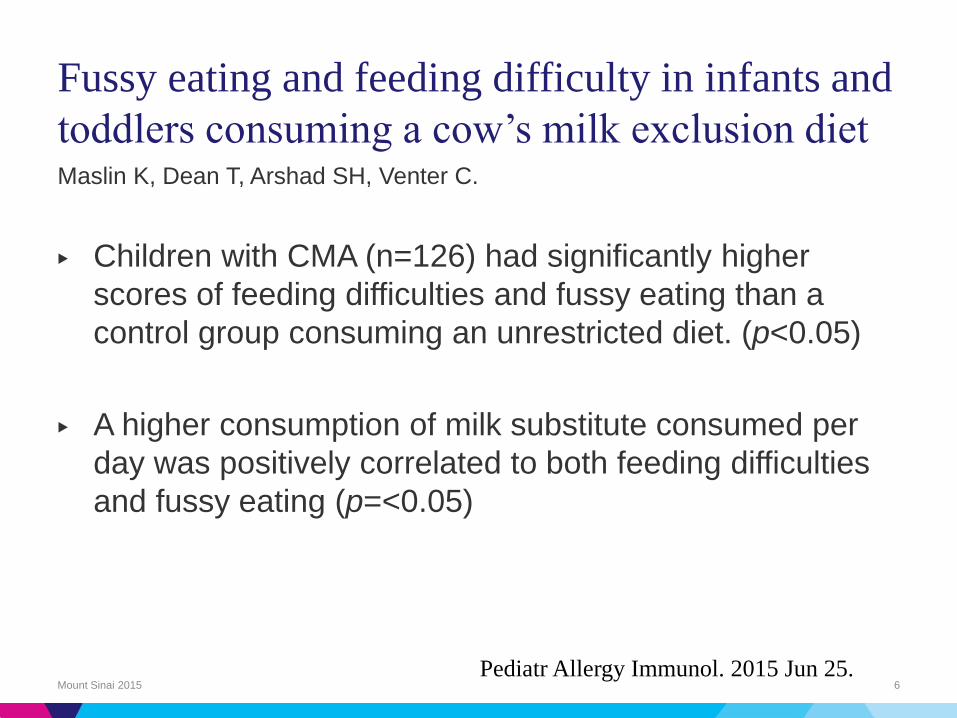
Fussy eating and feeding difficulty in infants and
toddlers consuming a cow’s milk exclusion diet Maslin K, Dean T, Arshad SH, Venter C.
▶ Children with CMA (n=126) had significantly higher
scores of feeding difficulties and fussy eating than a
control group consuming an unrestricted diet. (p<0.05)
▶ A higher consumption of milk substitute consumed per
day was positively correlated to both feeding difficulties
and fussy eating (p=<0.05)
Mount Sinai 2015 6 Pediatr Allergy Immunol. 2015 Jun 25.
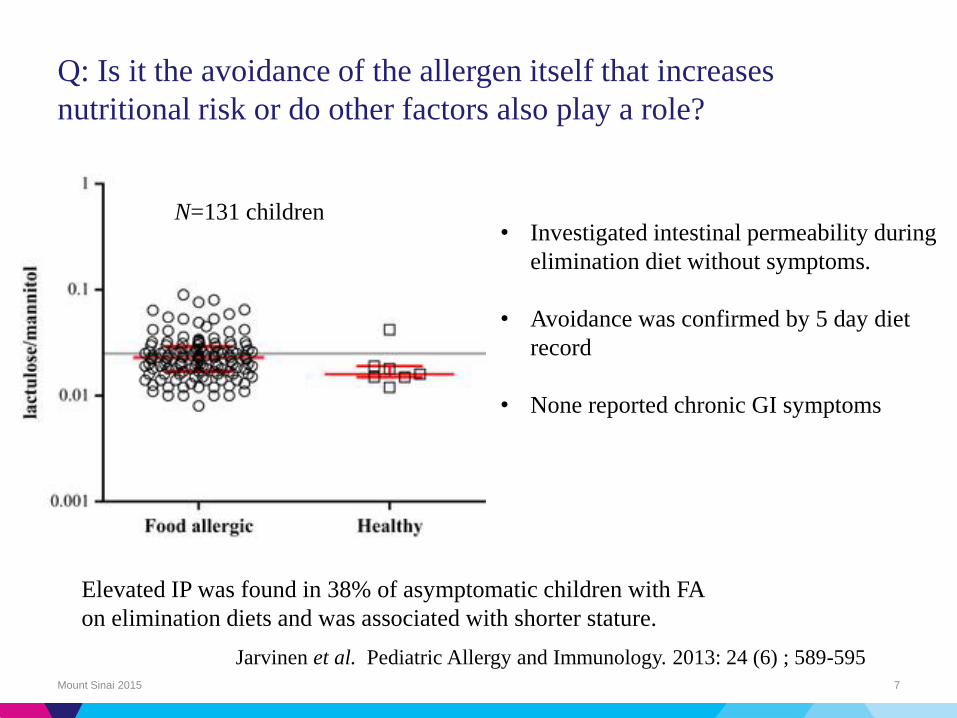
Q: Is it the avoidance of the allergen itself that increases
nutritional risk or do other factors also play a role?
Mount Sinai 2015 7
N=131 children
Elevated IP was found in 38% of asymptomatic children with FA
on elimination diets and was associated with shorter stature.
• Investigated intestinal permeability during
elimination diet without symptoms.
• Avoidance was confirmed by 5 day diet
record
• None reported chronic GI symptoms
Jarvinen et al. Pediatric Allergy and Immunology. 2013: 24 (6) ; 589-595

What is the impact of the clinical manifestation?
▶ IgE mediated allergy
The nutritional value of the food eliminated and the
number of foods eliminated may affect the risk.
▶ Eosinophilic esophagitis
Esophageal dysfunction
▶ Food protein induce enterocolitis syndrome
Limited diets and altered complementary feeding
schedule
▶ Atopic Dermatitis
Increase energy/protein needs
Mount Sinai 2015
Groetch M, Henry M, Feuling MB, Kim J. Guidance for the
nutrition management of gastrointestinal allergy in pediatrics.
JACI in practice. 2013;1(4):323-31.

Question
Mount Sinai 2015 9
How do food allergies and elimination diets
affect growth and nutritional status?
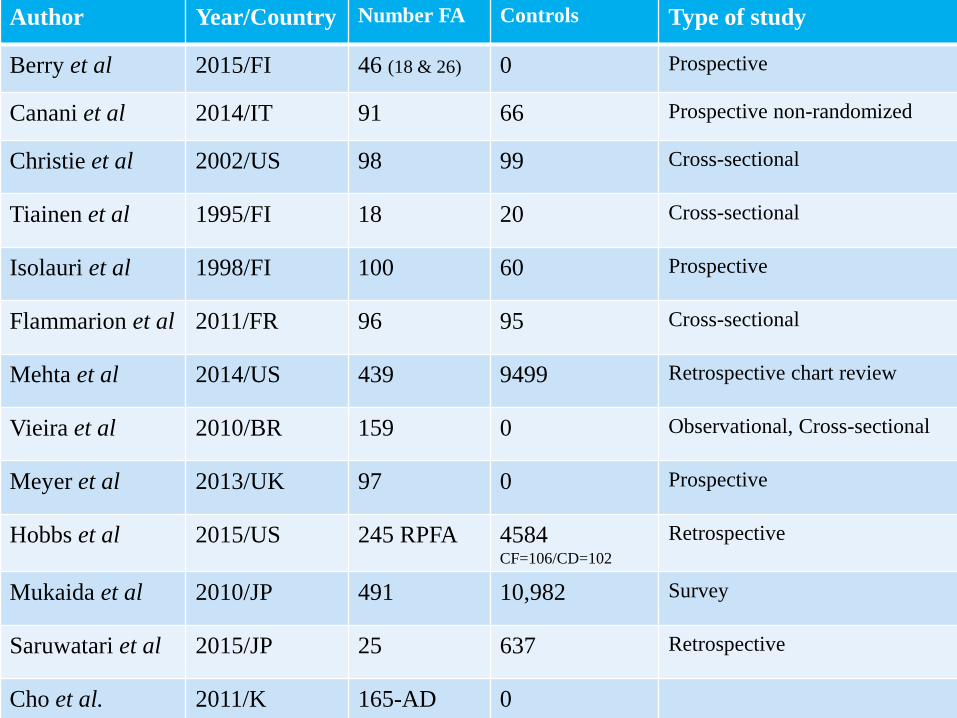
Author Year/Country Number FA Controls Type of study
Berry et al 2015/FI 46 (18 & 26) 0 Prospective
Canani et al 2014/IT 91 66 Prospective non-randomized
Christie et al 2002/US 98 99 Cross-sectional
Tiainen et al 1995/FI 18 20 Cross-sectional
Isolauri et al 1998/FI 100 60 Prospective
Flammarion et al 2011/FR 96 95 Cross-sectional
Mehta et al 2014/US 439 9499 Retrospective chart review
Vieira et al 2010/BR 159 0 Observational, Cross-sectional
Meyer et al 2013/UK 97 0 Prospective
Hobbs et al 2015/US 245 RPFA 4584 CF=106/CD=102
Retrospective
Mukaida et al 2010/JP 491 10,982 Survey
Saruwatari et al 2015/JP 25 637 Retrospective
Cho et al. 2011/K 165-AD 0
The Effect of Past Food Avoidance Due to Allergic
Symptoms on the Growth of Children at School Age
Mount Sinai 2015 11
Kumiko Mukaida, Takashi Kusunoki, Takeshi Morimoto,
Takahiro Yasumi, Ryuta Nishikomori, Toshio Heike,
Tatsuya Fujii and Tatsutoshi Nakahata
Allergology International. 2010;59:369-374

Compared Food Avoiders in Infancy (FAI; N=491) with
Non-Food Avoiders (Controls: N=11,473)
No. of patients Length of avoidance
322 Outgrown by age 3
169 Continuous at age 3
112 Outgrown by age 3-6
57 Continuous at age 6
Mount Sinai 2015 12
Mukaida, et al. Allergology International. 2010;59:369-374

Results
▶ FAI (total) had significantly lower mean weight for age (WA)
than non-FAI (no difference in HA) (p=0.01)
▶ If outgrown by 3 years of age, there was no significant
difference in WA compared to non-avoidance
▶ Those with continuous avoidance at age 3, if avoiding 2 or
more foods or cow’s milk had significantly lower height for
age (HA) than those with avoidance of one food or non-
avoidance of cow’s milk. (p =0.02, 0.04, respectively)
Mount Sinai 2015 13
Less likely to be overweight or obese than non-FAI and had less consumption of fast food.
Mukaida, et al. Allergology International. 2010;59:369-374

Harshna Mehta, MD
Manish Ramesh, MD, PhD
Elizabeth Feuille, MD
Marion Groetch, MS, RD
Julie Wang, MD
Mount Sinai 2015 14
Growth Comparison in Children with and without Food Allergies
in 2 Different Demographic Populations The Journal of Pediatrics, Volume 166, Issue 1, January 2015, Page 212
▶ A retrospective chart review was performed for children with and without food allergies followed at 2 New York City general pediatric practices during 2010-2011.
▶ 9938 children seen- 439 (4.4%) were avoiding one or more foods
▶ Children with CMA were shorter (P=.047) and weighed less (P=.0006) when compared with matched controls.
Mount Sinai 2015 15
Growth Comparison in Children with and without Food Allergies
in 2 Different Demographic Populations The Journal of Pediatrics, Volume 166, Issue 1, January 2015, Page 212

Mount Sinai 2015 16
Children with food allergies and commercial insurance were significantly shorter (mean height
z-score = 0.06) than children without food allergies (mean height z-score = 0.42) P = .01
P = .01
HEIGHT

Mount Sinai 2015 17
But there was no difference in height in the patients with and without food allergy and state
insurance
HEIGHT
Mount Sinai 2015 18
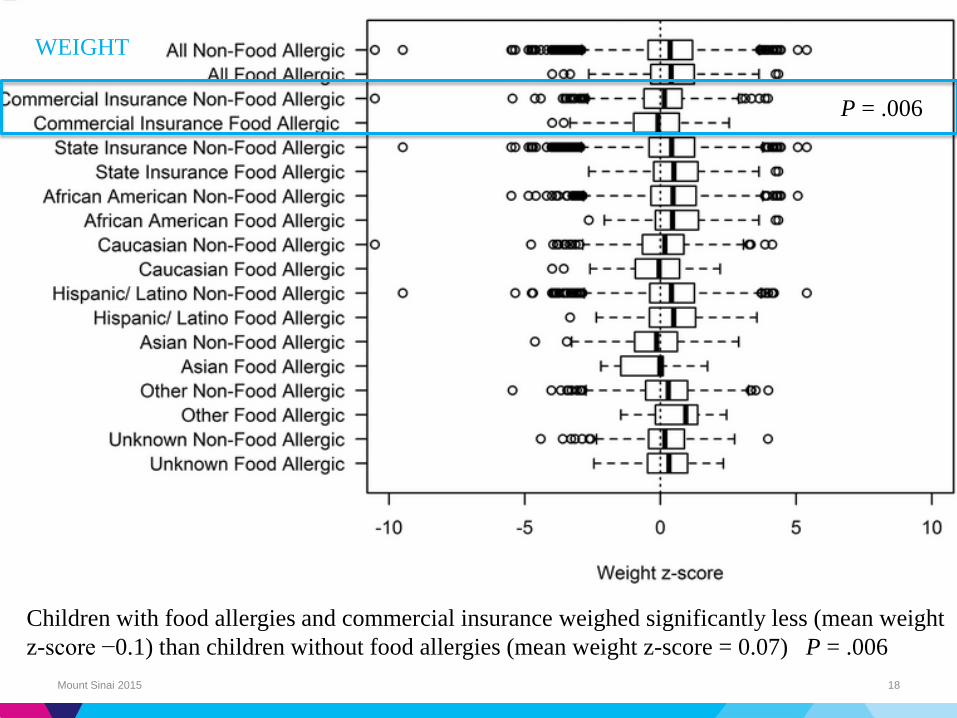
Children with food allergies and commercial insurance weighed significantly less (mean weight
z-score −0.1) than children without food allergies (mean weight z-score = 0.07) P = .006
P = .006
WEIGHT

Mount Sinai 2015 19
In contrast, children with food allergies and
state insurance were not smaller in height or
weight compared with children without food
allergies.
WEIGHT

Q. Do certain food allergies put children at
greater risk of decreased growth?
Yes
▶ Isolauri, Tiainen, Paganus (1992-2002)
▶ Mukaida - Japan (2010)
▶ Hobbs - US (2015)
▶ Mehta - US (2014) in children >2 years
▶ Vieira - Brazil (2010)
No
▶ Meyer UK (2013)
▶ Flammarion FR (2011)
Mount Sinai 2015 20
-All patients under supervision of specialist RD
-88% nutrition counseling
Cow’s milk

Do multiple food allergies put children at greater risk
of decreased growth?
Mount Sinai 2015 21
Yes
▶ Christie US (2002)
▶ Meyer UK (2013)
▶ Flammarion FR (2011)
▶ Mukaida - Japan (2010)
▶ Hobbs - US (2015)
▶ Cho K (2011)
▶ Vieira - Brazil (2010)
No
▶ Mehta - US (2014)
Only 2.23% of population had MFA

Q. How prevalent is malnutrition in children and
adults with food allergies?
Mount Sinai 2015 22

Malnutrition
Nutrient deficiencies
WHO Growth standards definition of malnutrition
Normal growth 0 to +/- 2 Z-scores (WA, HA, WH)
Under-weight <-2 Z-scores (WA)
Malnourished
▶ Wasted < --2 Z scores (WH)
▶ Stunted < --2 Z-scores (HA)
▶ Overweight > +2 Z-scores (WA or WH)
Mount Sinai 2015 23
Weight for Age (WA), Height for Age (HA),Weight for Height (WH)
Decreased bone mineral density (BMD) in young
adult IgE-mediated cow’s milk–allergic patients.
Calcium intake was significantly and severely reduced
(p<.0001)
Significant risk of reduced BMD and early osteoporosis
(T score <2.5 SD; 27% vs. 0%; p=.0071)
Mount Sinai 2015 24
Liat Nachshon, MD, Michael R. Goldberg, MD, PhD, Naama Schwartz, MA, et al.
JACI 2014; 134; (5): 1108-1113.

Increased Prevalence
▶ Meyer UK (2013)
▶ Flammarion FR (2011)
▶ Canani Italy (2014)
▶ Cho K Japan(2011)
▶ Vieira - Brazil (2010)
▶ Costa- Brazil (2014)
Mount Sinai 2015 25
Q. How prevalent is malnutrition in children
with food allergies?
Overweight was also found but lower prevalence

Diet and Nutritional Status of Children with Food Allergies
Sophie Flammarion,
Clarisse Santos,
Dominique Guimber,
Lyne Jouannic,
Caroline Thumerelle,
Frederic Gottrand
Antoine Deschildre
▶ Cross sectional study
▶ 96 children with FA & 95 paired controls (mean age 4.7 years)
▶ Growth
▶ 3 day food records
Energy, protein, CHO, fat, Ca, P, Fe, Mg, vitamins A, D, C
and E (compared to French RDI)
Mount Sinai 2015 29
Pediatric Allergy and Immunology 22 (2011) 161-165.

Nutritional status of children with food allergies
compared with controls
Children with food
allergies (n = 96) Mean Controls (n = 95) Mean
Z score weight for age 0.1 (1.6) 0.6* (1.2)
Z score height for age 0.2 (1.5) 0.8* (1.4)
Z score weight for height −0.2 (1.4) −0.1 (1.3)
Mount Sinai 2015 30
SD, standard deviation.
*p < 0.05 compared to controls.
No difference based on type of food allergy or allergic symptom
No difference in nutrient intake between the FA and control
Flammarion et al 2011
Controls (n = 95)
%
Allergy to 1 or 2
foods (n = 55) %
Allergy to more
than 3 foods
(n = 41) %
All children with
food allergies
(n = 96) %
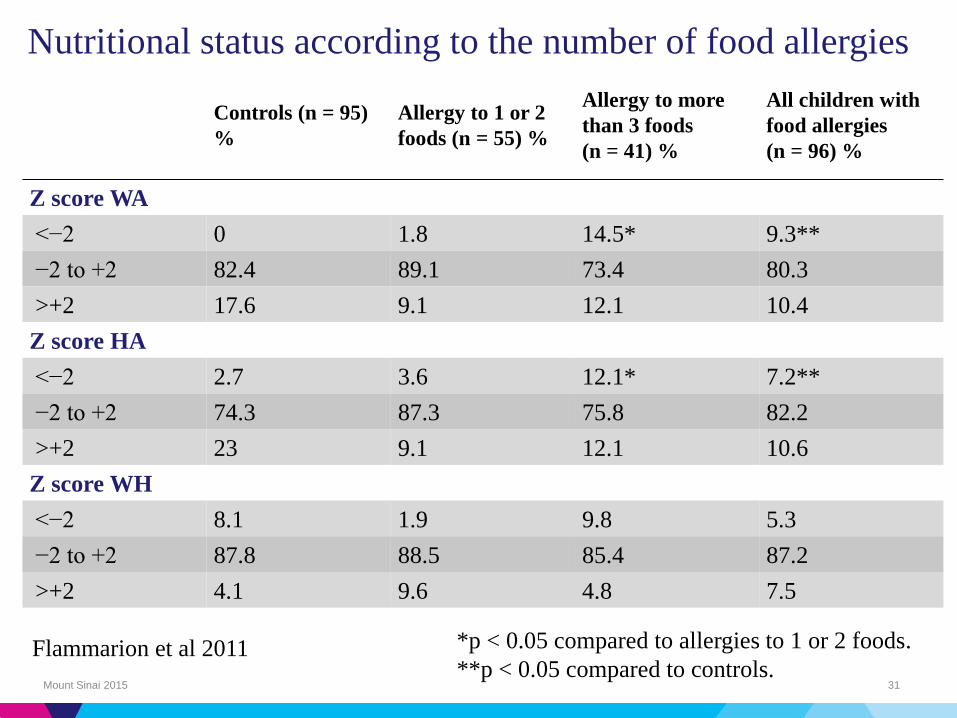
Z score WA
<−2 0 1.8 14.5* 9.3**
−2 to +2 82.4 89.1 73.4 80.3
>+2 17.6 9.1 12.1 10.4
Z score HA
<−2 2.7 3.6 12.1* 7.2**
−2 to +2 74.3 87.3 75.8 82.2
>+2 23 9.1 12.1 10.6
Z score WH
<−2 8.1 1.9 9.8 5.3
−2 to +2 87.8 88.5 85.4 87.2
>+2 4.1 9.6 4.8 7.5
Mount Sinai 2015 31
Nutritional status according to the number of food allergies
*p < 0.05 compared to allergies to 1 or 2 foods.
**p < 0.05 compared to controls. Flammarion et al 2011
Q. What are the data to suggest dietary
counseling can improved nutritional status
in children with food allergies?
Mount Sinai 2015 32
The Effects of Dietary Counseling on Children with Food
Allergy: A Prospective, Multicenter Intervention Study Journal of the Academy of Nutrition and Dietetics. Volume 114, Issue 9,
September 2014, Pages 1432–1439
Mount Sinai 2015 33
▶ Roberto Berni Canani, MD, PhD
▶ Ludovica Leone, LDN
▶ Enza D’Auria, MD
▶ Enrica Riva, MD
▶ Rita Nocerino
▶ Serena Ruotolo, MD
▶ Gianluca Terrin, MD, PhD
▶ Linda Cosenza, MD
▶ Margherita Di Costanzo, MD
▶ Annalisa Passariello, MD, PhD
▶ Anna Coruzzo, LDN
▶ Carlo Agostoni, MD, PhD
▶ Marcello Giovannini, MD, PhD
▶ Riccardo Troncone, MD
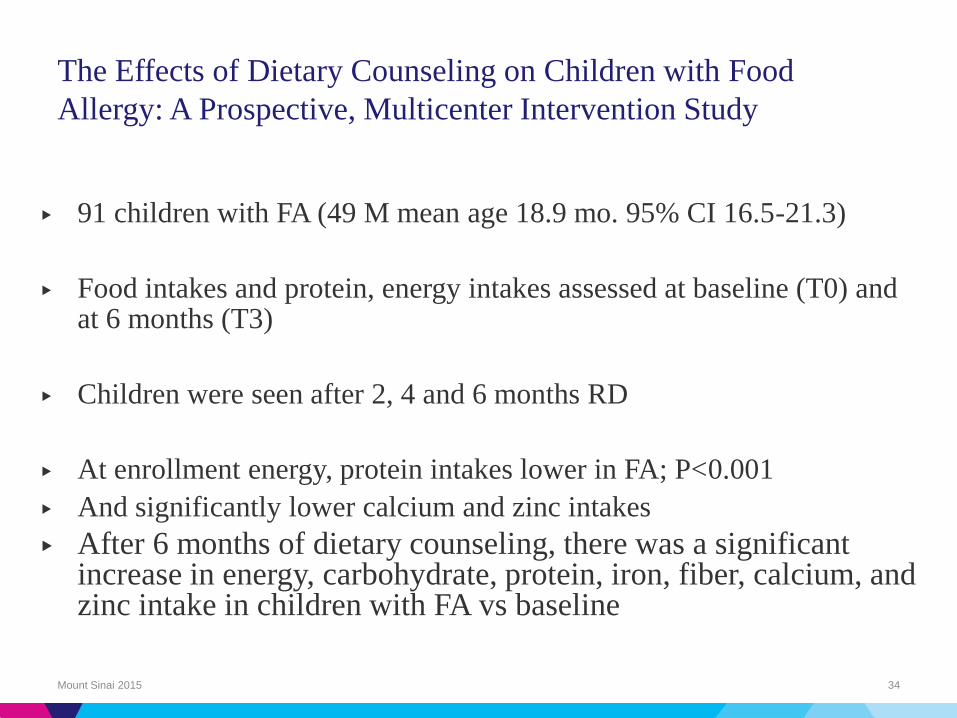
The Effects of Dietary Counseling on Children with Food
Allergy: A Prospective, Multicenter Intervention Study
▶ 91 children with FA (49 M mean age 18.9 mo. 95% CI 16.5-21.3)
▶ Food intakes and protein, energy intakes assessed at baseline (T0) and at 6 months (T3)
▶ Children were seen after 2, 4 and 6 months RD
▶ At enrollment energy, protein intakes lower in FA; P<0.001
▶ And significantly lower calcium and zinc intakes
▶ After 6 months of dietary counseling, there was a significant increase in energy, carbohydrate, protein, iron, fiber, calcium, and zinc intake in children with FA vs baseline
Mount Sinai 2015 34

At Baseline (TO) a weight/length
ratio below 2 SD was observed
in a significantly higher percentage
of children with FA compared
with healthy children (P<0.001)

Q. What recommendations are made in order to
improve growth in children with food allergies?
Mount Sinai 2015 38
• Individualized
• Adjusted daily amount of formula
• Increasing concentration when necessary
• Customize total amount of energy intake
• Discourage inappropriate elimination of other foods
• Address feeding strategies
• Consider micronutrients needs and supplementation

Proposed recommended nutrient densities for
moderately malnourished children
Protein g/kg/day Energy
kcal/kg/day
Protein/energy
(%)
1 g/kg/day 1.02 89 4.6
2 g/kg/day 1.22 93 5.2
5 g/kg/day 1.82 105 6.9
10 g/kg/day 2.82 126 8.9
20 g/kg/day 4.82 167 11.5
40
• Golden, Michael H. Food & Nutrition Bulletin 2009. 30;(3) pp. 267-342.
• Meyer et al. Pediatric Allergy and Immunology2012; 23 (4) 307–314
• Joint WHO/FAO/UNU Expert Consultation.Vol.935,1-265.2007 World Health Organization
Micronutrients

Q. What are the research gaps? Q. What are your recommendations to
healthcare workers and policy makers for addressing the nutritional
consequences of food allergies and further preventing them?
Mount Sinai 2015 42
*What are the specific requirements for patients with FA?
*Does medical nutrition therapy have an impact?
*How do we best way to educate dietitians?
*How do we encourage doctors to use dietitians?
*How do ensure access to dietitians?

Questions?