Nutritional and biochemical evaluation of the protein ... · Nutritional and biochemical evaluation...
17
Available online at www.scholarsresearchlibrary.com Scholars Research Library Archives of Applied Science Research, 2011, 3 (5):428-444 (http://scholarsresearchlibrary.com/archive.html) ISSN 0975-508X CODEN (USA) AASRC9 428 Scholars research library Nutritional and biochemical evaluation of the protein quality of four popular insects consumed in Southern Nigeria Ekpo, K.E Department of Biochemistry, Ambrose Alli University, Ekpoma ______________________________________________________________________________ ABSTRACT The nutritional and biochemical evaluation of the protein quality of some popular insects consumed in Southern Nigeria was investigated. Thirty six (36) young weanling male albino rats (Wistar strain) of about 23 days old, grouped into six (6) groups of six (6) animals per group, were fed separate diets containing 10% protein by weight of the test diets, casein diet and a protein free (corn starch) diet for twenty eight (28) days. The diets contained adequate amounts of all other required nutrients. Results showed that the PER of the insects expressed as percentage of that obtained for casein were 94.26%, 71.31%, 96.72% and 107.38% respectively for Oryctes rhinoceros (OR) larva, Imbrasia belina (IBL) larva, Macrotermis belicosus (MB) and Rhynchophorus pheonicis (RP) larva, while the BV for the different insects were 87.94±4.14, 86.82±3.89, 88.55±7.89, and 88.95±8.14 respectively for OR, IBL, MB and RP. Results obtained for the net protein ratio (NPR), protein retention efficiency (PRE), and true digestibility (TD) for the insects show that they were comparable to values observed for the casein control and the observed slight differences were not significant at 95% confidence limit. The relative weights (g/kg live weight) of the organs namely liver, spleen, heart, kidney and lungs were not affected by feeding the animals using the insects as source of protein (P═0.05). Haematological and toxicological parameters assayed for were not significantly different from the control (P>0.05), but the serum ALP and ALT values were slightly higher while AST values were lower than that of the control (P≤0.05) for animals fed IBL diet. The plasma protein and blood urea levels were similar to values observed for the casein standard diet and the slight differences were not significant at 95% confidence limit. These observed results suggest the insects to be good sources of essential nutrients, which could go a long way in helping to solve most nutritional problems in many developing countries. Entomophagy should be encouraged as a good alternative towards solving the PEM problem facing many third world countries. Key words: Entomophagy, Insects, Protein quality, Nutrition, Toxicology. ______________________________________________________________________________
Transcript of Nutritional and biochemical evaluation of the protein ... · Nutritional and biochemical evaluation...
Available online at www.scholarsresearchlibrary.com
Scholars Research Library
Archives of Applied Science Research, 2011, 3 (5):428-444
(http://scholarsresearchlibrary.com/archive.html)
ISSN 0975-508X CODEN (USA) AASRC9
428 Scholars research library
Nutritional and biochemical evaluation of the protein quality of four popular insects consumed in Southern Nigeria
Ekpo, K.E
Department of Biochemistry, Ambrose Alli University, Ekpoma
______________________________________________________________________________ ABSTRACT The nutritional and biochemical evaluation of the protein quality of some popular insects consumed in Southern Nigeria was investigated. Thirty six (36) young weanling male albino rats (Wistar strain) of about 23 days old, grouped into six (6) groups of six (6) animals per group, were fed separate diets containing 10% protein by weight of the test diets, casein diet and a protein free (corn starch) diet for twenty eight (28) days. The diets contained adequate amounts of all other required nutrients. Results showed that the PER of the insects expressed as percentage of that obtained for casein were 94.26%, 71.31%, 96.72% and 107.38% respectively for Oryctes rhinoceros (OR) larva, Imbrasia belina (IBL) larva, Macrotermis belicosus (MB) and Rhynchophorus pheonicis (RP) larva, while the BV for the different insects were 87.94±4.14, 86.82±3.89, 88.55±7.89, and 88.95±8.14 respectively for OR, IBL, MB and RP. Results obtained for the net protein ratio (NPR), protein retention efficiency (PRE), and true digestibility (TD) for the insects show that they were comparable to values observed for the casein control and the observed slight differences were not significant at 95% confidence limit. The relative weights (g/kg live weight) of the organs namely liver, spleen, heart, kidney and lungs were not affected by feeding the animals using the insects as source of protein (P═0.05). Haematological and toxicological parameters assayed for were not significantly different from the control (P>0.05), but the serum ALP and ALT values were slightly higher while AST values were lower than that of the control (P≤0.05) for animals fed IBL diet. The plasma protein and blood urea levels were similar to values observed for the casein standard diet and the slight differences were not significant at 95% confidence limit. These observed results suggest the insects to be good sources of essential nutrients, which could go a long way in helping to solve most nutritional problems in many developing countries. Entomophagy should be encouraged as a good alternative towards solving the PEM problem facing many third world countries. Key words: Entomophagy, Insects, Protein quality, Nutrition, Toxicology. ______________________________________________________________________________

Ekpo, K.E Arch. Appl. Sci. Res., 2011, 3 (5):428-444 _____________________________________________________________________________
429 Scholars research library
INTRODUCTION
With the recent wave of natural disasters coupled with economic depression and its attendant effect on the purchasing power of the populations of less developed countries, it has become obvious that the local food stuffs will play increasing roles in the food and nutrition security of the rural people and the increasing urban poor. One of such habits is the use of insects as food (entomophagy) by the African rural communities to supplement their protein intake. The practice of eating insects or their larva is not new. Archaeological evidence tells us that entomophagy has been practiced since mankind first made an appearance on this planet. The habit can be traced to the biblical days when for a period, John the Baptist depended entirely on insects for his food: “He did eat locusts and wild honey” (Mark 1:6) [1]. In Africa, entomophagy is a traditional and culturally acceptable way by which low income persons supplement the meager protein content of their high carbohydrate diet [2, 3]. Ordinarily, insects are not used as emergency food to ward off starvation in these indigenous groups, but are included as a planned part of the diet throughout the year or when seasonally available [4, 5]. Insects are very abundant and contain many nutrients that are essential to humans. For example, they are known to have the same amino acid requirements as man [6], and so they actively accumulate these amino acids, thus being a readily available source of these useful nutrients. The interest in the use of insect as food has been expressed in several reports [7, 8, 9, 10, 11, 12, 13, 14]. The values reported showed that most of the insect studied had higher levels of protein and several other nutrients than beef, chicken and fish [15]. Despite these reports, there is a dearth of information on the proximate and biological evaluation of the nutrition quality of the protein in most insects consumed. In addition, the association of the consumption of the larvae of Anaphe venata with the incidence of seasonal ataxia in Western Nigeria [16] reinforces the need for a thorough study of the insects for nutrition quality and toxicological safety.
MATERIALS AND METHODS
Solvents and chemicals used in this study were mostly of the analytical reagent grade and were obtained from E. Merck (Darmstadt, West Germany), May and Baker (Dagenham, Essex, England), Sigma Chemicals Company (St. Louis, Missouri, U.S.A.). The chloroform and methanol were redistilled before being used in this study. Rhynchophorus phoenicis (F) and Oryctes rhinoceros larvae were obtained live from Ilushi (on the bank of River Niger) in Edo State, Nigeria. Imbrasia belina larvae were obtained from Ogbomosho in Oyo State, Nigeria while Macrotermes bellicosus was obtained during their nuptial flight at Ekpoma, Edo State, Nigeria. The various species were identified in the Entomology Department, Nigerian Institute for Oil Palm Research (NIFOR), Benin City, Nigeria. All live insects / insect larvae were used within twelve hours of collection. Macrotermes bellicosus (Termites) were dewinged before being used. Lipid from the Insect/ larva was extracted with chloroform-methanol (1: 2, v / v) mixture as described by Bligh and Dyer [17]. Protein nitrogen was estimated according to the Kjeldahl

Ekpo, K.E Arch. Appl. Sci. Res., 2011, 3 (5):428-444 _____________________________________________________________________________
430 Scholars research library
William colorimetric method [18]. The amino acid profile of the insect/ larva samples was determined using the method described by Spackman et al [19]. The moisture content of the live insect/ larva was determined using the method of the Association of Official Analytical Chemists [20]. The method described by Pearson [21] was used to determine the ash content of the insect/ larvae. Carbohydrate content of the insects was determined by difference. Formulation of Diets Six (6) experimental diets were formulated after the pattern of Jenkins and Mitchell [22] with slight modification. The diets were prepared following the proportions as shown in Table 1 below. The components were blended manually starting from the small components to ensure proper blending. Prepared diets were labeled in polythene bags and stored in the refrigerator at 4 o C until needed.
TABLE 1: Composition of Basal, Reference and Test Diets (g/kg)
Samples Weight of samples
Vegetable Oil
Corn Starch
Sucrose Glucose Cellulose Mineral
Mix Vitamin
Mix %
Protein RP 453.3 100 196.7 100 50 50 40 10 10 MB 299.3 100 350.7 100 50 50 40 10 10 OR 331.1 100 318.9 100 50 50 40 10 10 IBL 284.3 100 365.7 100 50 50 40 10 10
Casein 127.8 100 522.2 100 50 50 40 10 10 Corn
Starch(Basal) - 100 650 100 50 50 40 10 -
OR = Oryctes rhinoceros, IBL = Imbrasia belina Lepidoptera; MB = Macrotermes belicosus, RP = Rhynchophorus phoenicis
Composition of mineral mixture (J.T. Baker Co., Phillipsburg, NJ; g/kg) Calcium phosphate (CaHPO4) 500g Magnesium oxide (MgO) 24g Sodium chloride (NaCL) 74g Potassium citrate (K3C6H5O) 200g Potassium sulphate (K2SO4) 52g Manganous carbonate, MnCO3(43-48%Mn) 3.5g Ferric citrate (16-17%Fe) 6g Cupric Carbonate, CuCO3 (53-55% Cu) 0.3g Potassium iodate (KIO3) 0.01g Sodium selenite (Na2SeO3,5H2O) 0.01g Chromium potassium sulphate [CrK(SO4), 12H2O] 0.55g Zinc carbonate (ZnCO3) 8.0g Cellulose to make 1000g Composition of Commercial Vitamin Premix (U.S. Biochem Corp, Cleveland, OH, mg/kg) Thiamin-HCL 600mg Riboflavin 600mg Pyridoxine,-HCL 1600mg Ca-pantothenate 0.6mg

Ekpo, K.E Arch. Appl. Sci. Res., 2011, 3 (5):428-444 _____________________________________________________________________________
431 Scholars research library
Nicotinic acid 2.0mg Inositol 4.0mg Amino benzoic acid 6.0mg Choline 1.3mg Folic acid 200mg Cyanocobalamin 1.0mg Cholecalciferol 2500mg Retinyl palmitate, vitamin A activity 320 UI D-biotin 20mg Menaquinine 50mg Sucrose to make 1000g Experimental animals Thirty six (36) young weanling male albino wistar rats of about 23 days old (bred at the animal house of the College of Medicine, Ambrose Alli University, Ekpoma.) were used for the study. The animals were divided into six (6) groups of six (6) animals per group. Each animal was caged separately for each of the groups to ensure proper metabolic study and monitor. Animals that showed symptoms of ill health were excluded from the experiment. Feeding Regime The rats were weighed to obtain their initial weights, after which they were placed on a 3- day adjustment period on the diets. Thereafter, the animals were placed on the diets and distilled water ad libitum for twenty eight days. All the diets except the protein free diet contained 10% protein (N x 6.25) by weight. Weighed foods were placed in small heavy porcelain mortars and about 5 ml of distilled water added and mixed to minimize spillage and scattering. Spilled food with the faecal contaminants were collected daily and dried. The dry spilt food was combined with the dry unconsumed food for the determination of total amount of food actually consumed by the rats in each of the groups. The proximate daily food consumption was determined by weight difference between the served food and the unconsumed food plus spilt food. The weights of the rats were monitored on a weekly basis. Collection and Treatment of Urine and Faeces. Urine was collected daily from each group of animals for the twenty eight day period they were on the diets. The urine for each cage was collected in small glass sample tubes containing 3 ml of (1% v/v) sulphuric acid. Additional precaution against urine losses were taken by washing the floor of the cage with 7 ml of (1% v/v) sulphuric acid, which is then added to that contained in the sample tube. The tube is then stoppered and stored in the refrigerator at 4 o C until analysed for nitrogen. Faecal collection for each group of animal was done daily. The faecal samples were dried to a constant weight in a Gallenkamp hot air oven size 2 at 85 o C, after which they were ground to a fine powder and then stored in a stoppered glass bottle container in the refrigerator at 4 o C until analysed for nitrogen. Sacrifice of Animals After the twenty eight day feeding period, the rats were weighed and their physical conditions such as fur, appearance and agility were noted and recorded prior to sacrificing them. The animals were put to sleep by placing them in a sealed container containing diethyl ether. Incision

Ekpo, K.E Arch. Appl. Sci. Res., 2011, 3 (5):428-444 _____________________________________________________________________________
432 Scholars research library
was made in the abdomen and extended to the thorax. Blood was collected directly from the heart with a syringe and needle and shared into 3 different containers containing K3 EDTA, Lithium heparin while the third container had no anticoagulant in it. The kidneys, liver, lung, spleen and heart were dissected out quickly. These organs were visually inspected for possible abnormalities such as colour changes, lesions, and fatty liver. The organs were washed with normal saline and their weights determined gravimetrically. Urine and faecal analysis 1 g of dried faeces and 10 ml aliquot of the urine were independently digested and analysed for nitrogen using the Kjeldahl William colorimetric method [18]. The values obtained for the protein free group were used to compute endogenous nitrogen losses. Nutritional Evaluation of the Diets. The protein qualities of the insect/insect larvae and casein diets were evaluated biologically, based on their ability to promote growth and nitrogen retention in the albino rats. The protein efficiency ratio (PER) was determined using the method described by Osborne, Mendel and Ferry [23]. The biological value (BV) of the diets was determined using the nitrogen balance sheet method of Mitchel [24]. The net protein ratio (NPR) and protein retention efficiency (PRE) was determined using the method described Bender and Doell [25]. True digestibility was determined using the balance sheet method of Mitchel [24]. Haematological and Toxicological Parameters Haematology is defined as the scientific study of the natural functions and disease of blood. Haematological parameters refers to those factors in the blood whose levels are usually determined in order to assess the degree of well being of an animal [26]. The relevant parameters measured included:- Red blood cell (RBC), White blood cell (WBC), Pack cell volume (PVC), Haemoglobin concentration (Hb), Mean corpuscular haemoglobin concentration (MCHC), Mean corpuscular volume (MCV), Mean corpuscular haemoglobin, (MCH), platelets count and differential leucocyte count which includes:- Neutrophils, oesinophils, basophils, monocytes and lymphocytes. The estimation of these parameters listed above was carried out using a blood cell counter (Beckman Counter Act Diff. Haematology Analyser). Aspartate amino transferase (AST) activity was determined using the method described by Reitman and Frankel [27]. Alanine amino transferase (ALT) activity was determined using the method of Reitman and Frankel [27]. Alkaline phosphatase activity was determined using the method described by Deutsche [28]. GGT activity was determined by automatic method using the procedure specified for the ACE Clinical Chemistry Analyser (Schiapparelli Biosystems, Netherlands). Urea is the main waste product of protein breakdown. It is formed in the liver, passes into the extracellular fluid and is excreted almost entirely by the kidneys. The measurement of urea is an important investigation in diagnosing kidney damage. The Urease –Berthelot method described by Weatherburn [29] was used for this estimation. The Biuret method described by Weichselbaum [30] was used for the estimation of total protein.
Ekpo, K.E Arch. Appl. Sci. Res., 2011, 3 (5):428-444 _____________________________________________________________________________
433 Scholars research library
Calculation and Statistics All results were expressed as Mean ± Standard Error of the Mean. The significance of the differences between the effects of control, basal and the test diets was measured ANOVA and the Student t-test (SPSS Inc. 1995) at 95% confidence limit.
RESULTS
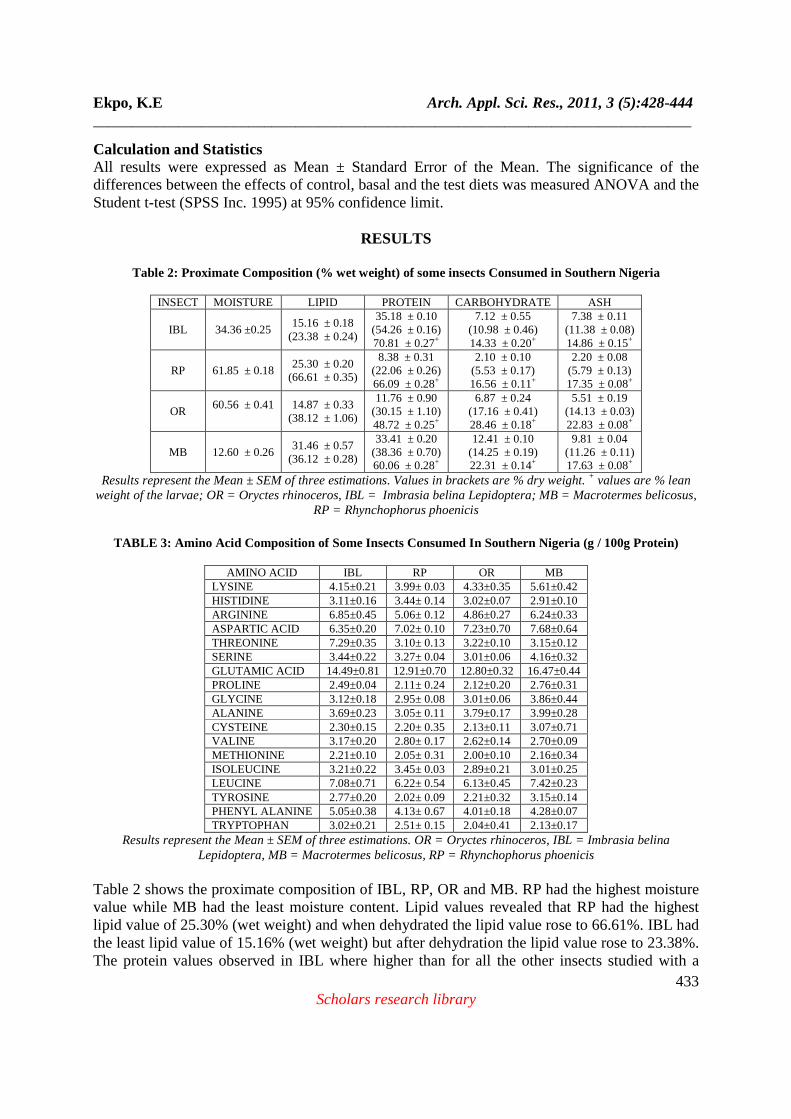
Table 2: Proximate Composition (% wet weight) of some insects Consumed in Southern Nigeria
INSECT MOISTURE LIPID PROTEIN CARBOHYDRATE ASH
IBL 34.36 ±0.25 15.16 ± 0.18
(23.38 ± 0.24)
35.18 ± 0.10 (54.26 ± 0.16) 70.81 ± 0.27+
7.12 ± 0.55 (10.98 ± 0.46) 14.33 ± 0.20+
7.38 ± 0.11 (11.38 ± 0.08) 14.86 ± 0.15+
RP 61.85 ± 0.18 25.30 ± 0.20
(66.61 ± 0.35)
8.38 ± 0.31 (22.06 ± 0.26) 66.09 ± 0.28+
2.10 ± 0.10 (5.53 ± 0.17) 16.56 ± 0.11+
2.20 ± 0.08 (5.79 ± 0.13) 17.35 ± 0.08+
OR 60.56 ± 0.41
14.87 ± 0.33
(38.12 ± 1.06)
11.76 ± 0.90 (30.15 ± 1.10) 48.72 ± 0.25+
6.87 ± 0.24 (17.16 ± 0.41) 28.46 ± 0.18+
5.51 ± 0.19 (14.13 ± 0.03) 22.83 ± 0.08+
MB 12.60 ± 0.26 31.46 ± 0.57
(36.12 ± 0.28)
33.41 ± 0.20 (38.36 ± 0.70) 60.06 ± 0.28+
12.41 ± 0.10 (14.25 ± 0.19) 22.31 ± 0.14+
9.81 ± 0.04 (11.26 ± 0.11) 17.63 ± 0.08+
Results represent the Mean ± SEM of three estimations. Values in brackets are % dry weight. + values are % lean weight of the larvae; OR = Oryctes rhinoceros, IBL = Imbrasia belina Lepidoptera; MB = Macrotermes belicosus,
RP = Rhynchophorus phoenicis
TABLE 3: Amino Acid Composition of Some Insects Consumed In Southern Nigeria (g / 100g Protein)
AMINO ACID IBL RP OR MB LYSINE 4.15±0.21 3.99± 0.03 4.33±0.35 5.61±0.42 HISTIDINE 3.11±0.16 3.44± 0.14 3.02±0.07 2.91±0.10 ARGININE 6.85±0.45 5.06± 0.12 4.86±0.27 6.24±0.33 ASPARTIC ACID 6.35±0.20 7.02± 0.10 7.23±0.70 7.68±0.64 THREONINE 7.29±0.35 3.10± 0.13 3.22±0.10 3.15±0.12 SERINE 3.44±0.22 3.27± 0.04 3.01±0.06 4.16±0.32 GLUTAMIC ACID 14.49±0.81 12.91±0.70 12.80±0.32 16.47±0.44 PROLINE 2.49±0.04 2.11± 0.24 2.12±0.20 2.76±0.31 GLYCINE 3.12±0.18 2.95± 0.08 3.01±0.06 3.86±0.44 ALANINE 3.69±0.23 3.05± 0.11 3.79±0.17 3.99±0.28 CYSTEINE 2.30±0.15 2.20± 0.35 2.13±0.11 3.07±0.71 VALINE 3.17±0.20 2.80± 0.17 2.62±0.14 2.70±0.09 METHIONINE 2.21±0.10 2.05± 0.31 2.00±0.10 2.16±0.34 ISOLEUCINE 3.21±0.22 3.45± 0.03 2.89±0.21 3.01±0.25 LEUCINE 7.08±0.71 6.22± 0.54 6.13±0.45 7.42±0.23 TYROSINE 2.77±0.20 2.02± 0.09 2.21±0.32 3.15±0.14 PHENYL ALANINE 5.05±0.38 4.13± 0.67 4.01±0.18 4.28±0.07 TRYPTOPHAN 3.02±0.21 2.51± 0.15 2.04±0.41 2.13±0.17
Results represent the Mean ± SEM of three estimations. OR = Oryctes rhinoceros, IBL = Imbrasia belina Lepidoptera, MB = Macrotermes belicosus, RP = Rhynchophorus phoenicis
Table 2 shows the proximate composition of IBL, RP, OR and MB. RP had the highest moisture value while MB had the least moisture content. Lipid values revealed that RP had the highest lipid value of 25.30% (wet weight) and when dehydrated the lipid value rose to 66.61%. IBL had the least lipid value of 15.16% (wet weight) but after dehydration the lipid value rose to 23.38%. The protein values observed in IBL where higher than for all the other insects studied with a

Ekpo, K.E Arch. Appl. Sci. Res., 2011, 3 (5):428-444 _____________________________________________________________________________
434 Scholars research library
value of 35.18%. This is closely followed by MB with 33.41%. Dehydration and eventually defatting is seen to increase relative concentration or proportion of the other nutrients encompassed in the proximate composition. The carbohydrate and ash values were highest in MB while RP larva had the least values. Table 3 shows the amino acid composition of the protein in the insect/ larvae. The amino acids known to be essential to man were present in varying amounts in the protein portion of the insects, with leucine constituting the major essential amino acid for RP, OR and MB while for IBL, threonine was the major essential amino acid, with a value of 7.29 g/100g. Table 4 shows the protein quality of test samples (Insect/ larvae) compared to casein. The rats kept on the protein free diet (Basal diet) showed signs of weakness at the end of the 4 week feeding period. Two of the rats eventually died before completion of the experiment. Some of the rats on this diet also appeared to have lost some of their furs. They also developed scaly tails, legs and hands. In contrast, rats kept on the other diets showed none of these symptoms. They looked normal, healthy and appeared agile. There were no obvious differences between rats kept on the reference feeds and those kept on the test feed.
TABLE 4: Protein Quality Evaluation
INSECTS / LARVAE
Feed intake in 7 days (g)
Protein intake in 7
days
Total weight gain in 7 days
(g) PER
PER (% OF CASEIN)
NPR PRE BV TD
OR 69.50 6.95 6.81 1.15
± 0.27
94.26 1.84
± 0.18
29.44 ±
0.28
87.94 ±
4.14
89.30 ±
0.70
IBL 59.40 5.94 4.30 0.87
± 0.38
71.31 1.71
± 0.41
27.36 ±
0.35
86.82 ±
3.89
86.03 ±
0.41
MB 66.60 6.66 6.68 1.18
± 0.28
96.72 1.92
± 0.12
30.72 ±
0.51
88.55 ±
7.89
90.18 ±
0.09
RP 75.40 7.54 8.59 1.31
± 0.15
107.38 1.95
± 0.61
31.20 ±
0.41
88.95 ±
8.14
91.79 ±
0.84
CASEIN 80.60 8.06 8.60 1.22
± 0.61
100.00 1.81
± 0.17
28.96 ±
0.45
89.20 ±
8.98
92.57 ±
0.42 BASAL 49.30 - - 4.16 - - - - - -
Results represent the Mean ± SEM of three estimations. OR = Oryctes rhinoceros, IBL = Imbrasia belina Lepidoptera, MB = Macrotermes belicosus, RP = Rhynchophorus phoenicis
TABLE 5: Relative organ weights (g/100g Live Weight)
ORGANS OR IBL MB RP CASEIN BASAL
LIVER 3.70±0.21 3.01±0.30 3.85±0.25 3.98±0.13 4.11±0.18 3.36±0.05+ SPLEEN 0.31±0.05 0.20±0.06 0.26±0.04 0.32±0.02 0.30±0.07 0.34±0.01+ HEART 0.40±0.05 0.35±0.07 0.49±0.02 0.48±0.04 0.47±0.05 0.33±0.06+ KIDNEY 0.70±0.03 0.92±0.06 0.74±0.03 0.73±0.05 0.72±0.05 0.98±0.06+ LUNGS 0.80±0.01 0.76±0.03 0.82±0.02 0.88±0.01 0.79±0.03 0.73±0.01+
Results represent the Mean±SEM of six estimations, + Results represent the Mean ± SEM of four estimations. OR = Oryctes rhinoceros, IBL = Imbrasia belina Lepidoptera, MB = Macrotermes belicosus, RP = Rhynchophorus
phoenicis
Ekpo, K.E Arch. Appl. Sci. Res., 2011, 3 (5):428-444 _____________________________________________________________________________
435 Scholars research library
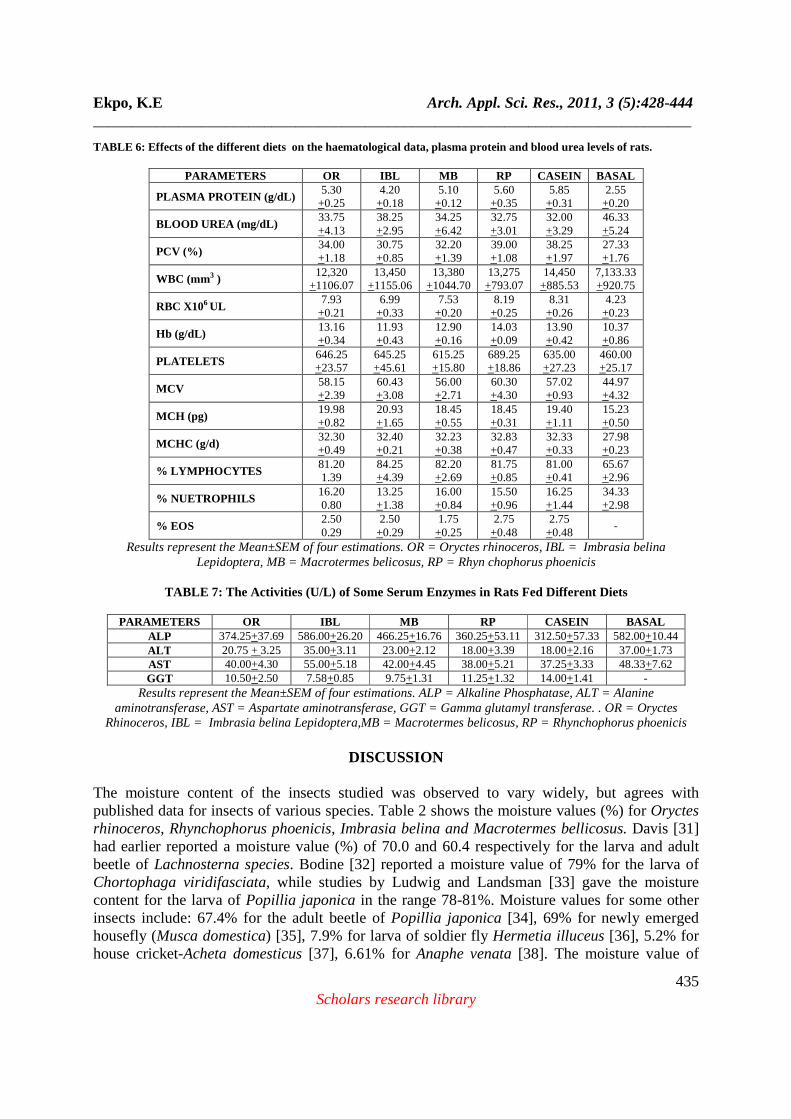
TABLE 6: Effects of the different diets on the haematological data, plasma protein and blood urea levels of rats.
PARAMETERS OR IBL MB RP CASEIN BASAL
PLASMA PROTEIN (g/dL) 5.30
+0.25 4.20
+0.18 5.10
+0.12 5.60
+0.35 5.85
+0.31 2.55
+0.20
BLOOD UREA (mg/dL) 33.75 +4.13
38.25 +2.95
34.25 +6.42
32.75 +3.01
32.00 +3.29
46.33 +5.24
PCV (%) 34.00 +1.18
30.75 +0.85
32.20 +1.39
39.00 +1.08
38.25 +1.97
27.33 +1.76
WBC (mm3 ) 12,320
+1106.07 13,450
+1155.06 13,380
+1044.70 13,275 +793.07
14,450 +885.53
7,133.33 +920.75
RBC X106 UL 7.93
+0.21 6.99
+0.33 7.53
+0.20 8.19
+0.25 8.31
+0.26 4.23
+0.23
Hb (g/dL) 13.16 +0.34
11.93 +0.43
12.90 +0.16
14.03 +0.09
13.90 +0.42
10.37 +0.86
PLATELETS 646.25 +23.57
645.25 +45.61
615.25 +15.80
689.25 +18.86
635.00 +27.23
460.00 +25.17
MCV 58.15 +2.39
60.43 +3.08
56.00 +2.71
60.30 +4.30
57.02 +0.93
44.97 +4.32
MCH (pg) 19.98 +0.82
20.93 +1.65
18.45 +0.55
18.45 +0.31
19.40 +1.11
15.23 +0.50
MCHC (g/d) 32.30 +0.49
32.40 +0.21
32.23 +0.38
32.83 +0.47
32.33 +0.33
27.98 +0.23
% LYMPHOCYTES 81.20 1.39
84.25 +4.39
82.20 +2.69
81.75 +0.85
81.00 +0.41
65.67 +2.96
% NUETROPHILS 16.20 0.80
13.25 +1.38
16.00 +0.84
15.50 +0.96
16.25 +1.44
34.33 +2.98
% EOS 2.50 0.29
2.50 +0.29
1.75 +0.25
2.75 +0.48
2.75 +0.48
-
Results represent the Mean±SEM of four estimations. OR = Oryctes rhinoceros, IBL = Imbrasia belina Lepidoptera, MB = Macrotermes belicosus, RP = Rhyn chophorus phoenicis
TABLE 7: The Activities (U/L) of Some Serum Enzymes in Rats Fed Different Diets
PARAMETERS OR IBL MB RP CASEIN BASAL
ALP 374.25+37.69 586.00+26.20 466.25+16.76 360.25+53.11 312.50+57.33 582.00+10.44 ALT 20.75 + 3.25 35.00+3.11 23.00+2.12 18.00+3.39 18.00+2.16 37.00+1.73 AST 40.00+4.30 55.00+5.18 42.00+4.45 38.00+5.21 37.25+3.33 48.33+7.62 GGT 10.50+2.50 7.58+0.85 9.75+1.31 11.25+1.32 14.00+1.41 -
Results represent the Mean±SEM of four estimations. ALP = Alkaline Phosphatase, ALT = Alanine aminotransferase, AST = Aspartate aminotransferase, GGT = Gamma glutamyl transferase. . OR = Oryctes
Rhinoceros, IBL = Imbrasia belina Lepidoptera,MB = Macrotermes belicosus, RP = Rhynchophorus phoenicis
DISCUSSION The moisture content of the insects studied was observed to vary widely, but agrees with published data for insects of various species. Table 2 shows the moisture values (%) for Oryctes rhinoceros, Rhynchophorus phoenicis, Imbrasia belina and Macrotermes bellicosus. Davis [31] had earlier reported a moisture value (%) of 70.0 and 60.4 respectively for the larva and adult beetle of Lachnosterna species. Bodine [32] reported a moisture value of 79% for the larva of Chortophaga viridifasciata, while studies by Ludwig and Landsman [33] gave the moisture content for the larva of Popillia japonica in the range 78-81%. Moisture values for some other insects include: 67.4% for the adult beetle of Popillia japonica [34], 69% for newly emerged housefly (Musca domestica) [35], 7.9% for larva of soldier fly Hermetia illuceus [36], 5.2% for house cricket-Acheta domesticus [37], 6.61% for Anaphe venata [38]. The moisture value of

Ekpo, K.E Arch. Appl. Sci. Res., 2011, 3 (5):428-444 _____________________________________________________________________________
436 Scholars research library
6.0% reported for Macrotermes bellicosus by Ukhun and Osasona [39] is lower than the values reported in this work. No immediate explanations could be given, but it is worth noting that different analytical procedures were employed. White and Kendall [40] have shown that moths collected at different periods of the year and location varied in their chemical composition, which may be applicable here. Generally, insect larvae tend to contain more moisture than their adult counterparts. These insect/larvae are usually used as food supplements by those who feed on it. It is consumed as part of a meal or as a complete meal. When compared with conventional animal food supplements such as beef, chicken, pork, and fish which have a moisture content of 40-70% [41], the larva of Rhynchophorus phoenicis and Oryctes rhinoceros are seen as high moisture food supplement, while values for Imbrasia belina are a little lower compared to these conventional foods. Macrotermes bellicosus moisture value marks it as a low moisture food supplement. The high moisture content as observed for Rhynchophorus phoenicis, Oryctes rhinoceros and partially for Imbrasia belina implies that most of the essential nutrients in the insect larvae will be in forms that are easily available to the body when the larvae are consumed as food. However, dehydration generally increases the relative concentrations of the food components (Table 2) and in addition improves the shelf-life/ preservation of the larvae. Fat is the chief form in which energy is stored in insect larvae [6, 42, 43]. It is usually present in greatest amounts in the mature larvae before metamorphosis [44]. According to Fast [44] although fat content can reach as high as 41% wet weight, three-fourths of insect species studied contained less than 10% of wet weight as lipid. Those with fat content greater than 10% are primarily phytophagous. The lipid values of Rhynchophorus pheonicis, Oryctes rhinoceros, Imbrasia belina and Macrotermes bellicosus (Table 2) are in agreement with this statement. Fast [45] reported a lipid value of 22.3% (wet weight) for Rhynchophorus palmarum. Lipid values reported for some insects are 3.1% and 4.0% respectively for the larva and adult beetle of Lachnosterna species [31], 2.1% for the Japanese beetle, Popillia japonica Neuman [34], 15.5% in the pupae of housefly Musca domestica [46]. Teotia and Miller [35] repeated the work done by Calvert et al [46] and reported the same results except that the lipid content was a little lower. 7.54% was reported for adult honey bees Apis mellifera L [47], 23.22% (dry matter basis) for Anaphe venata [38]. Leung [48, 49] reported lipid values of 36.10, 16.94, 22.08 and 55.24 (% dry weight) for Bombyx mori, palmweevil larvae, Crickets and Termites respectively. Ukhun and Osasona [39] reported a lipid value of 46.1% (moisture free basis) for Macrotermes bellicosus. This value is more than the 36.12% (dry weight) obtained in this study. Comparatively, the lipid values of these edible insects are higher than that found in most insects for which data are available [44]. The fat contents of these insects could have contributed to their highly acceptable flavour when fried or roasted. The lipid values of these insects when compared to lipids derived from conventional foods of animal origin [15] are found to be higher. Malnutrition in developing countries is as much, or more, a problem of calories deficiency as of protein deficiency [50]. The consumption of these insects could go a long way in taking care of the calorie needs in such communities. From the fat contents of these insects, a 100g sample will supply enough of the daily energy needs of very active people [51]. This is particularly relevant in the developing countries where much energy is expended in doing works that are usually done by machines in the industralised countries. Available data shows that of the insects analysed so

Ekpo, K.E Arch. Appl. Sci. Res., 2011, 3 (5):428-444 _____________________________________________________________________________
437 Scholars research library
far, 50% had a higher caloric value than soybeans, 87% were higher than corn, 63% were higher than beef, 70% were higher than fish, lentils and beans, while 95% were higher than wheat, rye or teosintle. [38, 52, 53, 54, 55]. Earlier studies [10, 14, 50, 56, 57, 58] have shown that these insect/larval lipids are rich in the polyunsaturated fatty acids which are protective against atherosclerotic disorders. Another implication of the high fat content of these insects is that defatting them will markedly increase the relative proportions of the other nutrients encompassed in the proximate composition. This means that greatly increased protein contents can be achieved by defatting these insects/ larvae as can be seen in the protein values of the defatted samples (Table 2). Table 2 shows the carbohydrate values for Rhynchophorus pheonicis, Oryctes rhinoceros, Imbrasia belina and Macrotermes bellicosus, with the values ranging from 2.10 – 12.41% (wet weight). Wigglesworth [42] observed that carbohydrate stores vary with the species of the insect. For instance, it comprises 33.5% of the dry weight of the mature bee larva, 31% for Gasterophilus while 5% in Ophyra, Calliphora, Lucilia, Bombyx and Malacosoma. Therefore, the carbohydrate level found in any insect can only be assessed/ compared with the values/ data available for the species. Nutritionally, although there is no special requirement for carbohydrate in terms of “Essential carbohydrate’s”, it is important that diets contain a certain amount of carbohydrate’s since it has a “sparring” action on proteins [59]. The high protein content of the insects (Table 2) suggests the potential of the insect species in combating protein deficiency. Davis [31] reported a value of 11.1 and 20.1 (% wet weight) for the larva and adult beetle of Lachnosterna species while Fleming [34] reported a crude protein value of 22.1% (wet weight) for the Japanese beetle Popillia japonica Newman. Calvert et al [46] reported a crude protein value of 63.1% (dry weight) for Musca domestica pupae. Calvert et al [60] further conducted proximate analysis of newly emerged housefly (M. domestica) and reported a crude protein content of 75% (dry weight). Hale [61] noted that dried larvae of the soldier fly Hermetia illucens had a crude protein value of 45.2% while Newton et al [36] reported a value of 42.1% for same larva, on dry matter basis. Koo et al [62] reported a crude protein of 51.7% for face fly, Musca autumnalis (De Geer). Ryan et al [47] reported that adult honey bees (Apis mellifera L) have a crude protein value of 49.8% while Landry et al [63] reported crude protein values for C. promethean, H. cecropia, and M. sexta as 49.4, 54.7 and 58.0% respectively. DeFoliart et al [64] had earlier reported a crude protein value of 58% (dry weight) for Mormon cricket (A. simplex) while Nakagaki et al [37] reported a crude protein value of 62.0 % (dry weight) for house cricket (Acheta domesticus L). Ashiru [38] reported a crude protein value of 60.03% (dry weight) for Anaphe venata while Ukhun and Osasona [39] reported a crude protein value of 34.8% (moisture free) for Macrotermes bellicosus . This value is lower than that observed in the present study which is reporting a value of 38.36 ± 0.70% (dry weight). Onigbinde and Adamolekun [3] reported a crude protein value of 52.7% for Imbrasia belina which is lower than the value of 54.26 reported in this study. The protein values observed justifies the cultural perception of the high nutritional value attached to entomophagy [13]. The results show that the protein values for these insects are superior to that of beef and chicken as well as many other conventional animal protein sources [15]. Proteins provide the chief structural elements of the muscle, glands and other tissues, but in insect larvae most of the proteins are found in the haemolymph [43]. The fate and physiological role of these proteins are not fully defined, although it seems probable that they play a major role in insect metamorphosis
Ekpo, K.E Arch. Appl. Sci. Res., 2011, 3 (5):428-444 _____________________________________________________________________________
438 Scholars research library
[65]. All the amino acids commonly found in proteins have been identified in insects, which are known to have the same amino acid requirements as mammals [6, 66]. Table 3 shows the amino acid composition of the four insect/ larvae under study. All the amino acids known to be essential to man are found present in varying proportions in the protein portion of the insects. Of particular interest is the high level of leucine, lysine and threonine observed in the insects. Lysine and threonine are limiting amino acids in wheat, rice, cassava and maize based diets that are prevalent in the developing world [67, 68], while leucine and histidine have been reported to enhance the growth of infants and young children [69]. Fisher [70] revealed that among the rat, rabbit and chicken, the requirement pattern of the growing rat is most similar to that of a growing child, pointing out that neither requires arginine. He further showed that the requirement pattern of the child for sulphur amino acids and for lysine resembled that of the rat more than those of either rabbit or chick. The inclusion of these insects into the staple diets of these third world communities would boost their nutritional status. The value of the sulphur amino acids though not so high yet they meet the RDA values for these amino acids. Whole matured insect as a source of protein, on one hand, is of somewhat lower quality than animal products because of the indigestibility of chitin [8, 52]. Despite this, the consumption of insects can to a substantial degree supplement the predominantly cereal diet with many of the protective nutrients [8]. Removal of chitin increases the quality of insect protein to a level comparable to that of products from vertebrate animals. It should be noted however that in insect larvae, most of these nutrients are in the haemolymph and could be easily absorbed in case of ingestion as food or feed. Comparison of the amino acids composition of these insects with conventional animal foods indicate that the supply of some of the essential amino acids were superior to those found in these conventional foods [71]. These insect proteins may constitute a cheaper source of protein supplement easily available and affordable to the natives within the localities where the insects are found. The group of animals maintained on the protein-free control (Basal) diet consumed the least quantity of feed when compared with the other groups of animals kept on the experimental diets and standard casein diets (Table 4). All the diets with the exception of the protein free control group contained 10% crude protein (N x 6.25). The lower feed intake of this group of animals correlated with their apparent growth failure, if weight gain is used as a measure of growth. The group of rats fed Rhynchophorus phoenicis larva diet consumed the highest quantity of feed and recorded the highest weight gain. This correlates weight gain to feed intake in the experimental diet. The feed intake and weight gain in this group was close to that observed for the casein diet. The group of rats fed Imbrasia belina larva consumed the least quantity of feed among the experimental diets. This lower feed intake (and indirectly lower protein intake) also reflected in their lower weight gain when compared to the other experimental diets. The reduced feed intake by the animals fed Imbrasia belina diet could be attributed to a number of factors which may include : a deficiency and / or imbalance of amino acids and other nutrients; adverse substances (antinutrients) in the protein source; or reduced palatability of the diet. Jacquot and Peret [72] reported that the nature of proteins included in diets influences the appetite of animals, and may cause significant reductions in food intakes during ad libitum feeding. This reduction in general food intake indicates a reduction in the intake of other essential dietary components such as calories. The reduction in food intake compounds the possible effects of limiting amino acids [22]. In addition, Passmore et al [73]

Ekpo, K.E Arch. Appl. Sci. Res., 2011, 3 (5):428-444 _____________________________________________________________________________
439 Scholars research library
reported that if the total energy intake is inadequate, some dietary protein is used for energy, and is therefore not available to satisfy protein needs. Thus, further increases in protein intake is of limited effectiveness and wasteful if energy needs are not being satisfied at the same time. The caloric (energy) values of the various experimental diets were not determined in this study. Oke [74] was of the opinion that the nutritional importance of a foodstuff in a diet depends on the nutrient composition of the raw foodstuff, the amount that is consumed and the extent to which the component nutrients are destroyed or lost during preparation of the diet. Similarly, Ensminger [75] observed that feed processing influences the nutritional value of feedstuffs by enhancing some nutrients and lowering others. The observed higher feed intake among the different insect/ larva groups could be due to the fat content of the insect/ larvae which contributes to its highly acceptable flavour thereby helping to improve the dietary intake of the diet [76]. On the other hand, these insect/ larvae all had a fat content higher than 10% (wet weight), which were also observed to be highly unsaturated. The implication of the high fat content is that it increases the susceptibility of the undefatted insect/ larvae to storage deterioration via lipid oxidation [77]. There was significant difference (P ≤ 0.05) in feed intake between casein fed rats and rats fed with Oryctes rhinoceros, Imbrasia belina, and Macrotermes bellicosus diets while the difference in weight gain between Imbrasia belina diet compared with casein diet was significant at P ≤ 0.05. Looking at the amino acid credentials of these insect/ larvae, Imbrasia belina tends to have a higher essential amino acid content than the other insect/ larvae. Inspite of this impressive array of essential amino acids, the feed intake and subsequently the weight gain of this group of rats fed the larval diet was lower than that observed for the other insect/ larvae groups. It is either that these essential amino acids are in a form unavailable to the animals or there is the presence of an antinutritional factor which makes these essential amino acids unavailable to the animals. Osborne et al [23] and Henry [78] have reported maximum values of PER (Protein efficiency ratio) at lower protein concentrations for good quality proteins than for poor-quality proteins. Results observed in this present study are shown in Table 4. The PER value for Rhynchophorus phoenicis diet was higher than the value obtained for the casein diet, while all the others were a little lower. This result is not too surprising as other researchers such as Calvert et al [60], Hale, [61], Abdel Gawaad and Brune, [79], Ocio et al [80], Finke et al [81] worked on various insects and discovered that many of the insect they studied had protein qualities that were superior to soy protein or casein as a source of protein. Rats fed with Imbrasia belina larval diet recorded the lowest PER values which also corresponds with their lower feed intake. With the exception of the Imbrasia belina fed rats, all the others recorded higher Net protein ratio (NPR) values when compared to casein fed rats (Table 4). The spread of protein retention efficiency (PRE) values were similar to the observed NPR values. Very high biological values (BV) were observed for all the insect/ larval diets, though value obtained for the casein diet was higher. Comparison with results reported by Dreyer and Wehmeyer, [8] for Imbrasia belina shows that the results obtained in the present study are much higher. The high biological values of the insect/ larval diets support the general view that maximal utilization of good quality proteins occurs at lower levels of protein intake [78]. At higher levels, there is a tendency for increased metabolic wastage of dietary proteins.

Ekpo, K.E Arch. Appl. Sci. Res., 2011, 3 (5):428-444 _____________________________________________________________________________
440 Scholars research library
The True Digestibility (TD) values strongly indicate the ease of bioavailability of the amino acid constituents of the insect/ larvae, an important factor in considering the nutritional quality of a protein [82]. Dreyer and Wehmeyer [8] reported a digestibility value of 85.8% for Imbrasia belina larva while the present study reports a slightly higher value of 86.03 for Imbrasia belina larval diet. Improved quality of food proteins have been ascribed to factors which range from denaturation of the protein and consequent enhancement of the digestion, to destruction of antinutritional factors which might be present in the food by the various processing treatments. While the unfolding of the protein for improved proteolysis may sound obvious, it is not possible to confirm the possibility of any anti-nutritional factor from these results. However looking at the proximate and chemical analysis credentials for Imbrasia belina and comparing these with the observed low weight gain, Protein efficiency ratio, Biological value, True digestibility and other nutritional parameters, does not reflect the observed values. Generally, the organs of the animals placed on the protein free diet were pale in appearance and diminished in size, as compared with those of the other animals placed on the standard casein diet and test diets. The liver and kidneys of the animals placed on the casein diet were brick red in colour with no lesions on them or any signs of fatty liver, while that of the animals placed on the various test diets showed a fine brick red colouration, darker than that observed for the animals on the casein diet. There were no lesions on the various organs, or signs of fatty liver. The results of the organ weight clearly indicate that there was corresponding increase or decrease in the organ weights with increased protein intake and/ or quality. In particular the liver weight of the different group of rats fed the various diets correlated quite well with the level and quality of dietary protein intake. Rats fed Rhynchophorus phoenicis larval diet recorded the highest feed intake and also the highest relative liver weight of 3.98±0.13g closely following the rats fed the casein diet. There is a direct correlation between feed intake and relative liver weights of the test animals. Expectedly animals fed Imbrasia belina larva recorded the least feed intake and as well the least relative liver weight. This result is in agreement with the findings of Jenkins and Mitchell [22]. These differences in liver relative weights may indicate stress and or possible changes in the relative composition of these tissues due to the test diet. The relative spleen weights were fairly constant with little variations among the various groups, and the noticed slight differences were not significant (P>0.05). The relative weights of the heart and lungs were similar to results observed for the spleen, and there were no significant differences (P>0.05) in the relative heart and lung weight for the different group of rats. The relative kidney weights appears to be related to the PER of the protein source. Rats fed diets with the lowest PER values (index of protein quality) recorded the highest relative kidney weights. These observations were also reported by Tanaka et al [83], Kimiagar, et al [84]), and Jenkins and Mitchell [22]. Kimiagar et al [84] however demonstrated that the effects of the quality of dietary protein on the organ weights and liver enzymes could depend on the length of feeding. Tanaka et al [83] ascribed the feeding of poor quality protein to significant increase in the serum activities of Alanine aminotransferase (ALT) and Aspartate aminotransferase (AST). A later report by Kimiagar et al [84] showed that these effects on liver enzymes depended on the length of feeding. AST is a mitochondrial enzyme and is also present in heart, muscle, kidney and brain, while ALT is a cytosol enzyme and is more specific to the liver than AST [85]. The normal range for these enzymes in rats could not be ascertained, but comparing observed results with the casein reference values shows increase in ALT and AST values for Imbrasia belina fed rats, which was significant at P ≤ 0.05. There were no significant differences in the casein values

Ekpo, K.E Arch. Appl. Sci. Res., 2011, 3 (5):428-444 _____________________________________________________________________________
441 Scholars research library
when compared to the other insect/ larval diets. Elevated levels of AST are usually observed in hepatic necrosis, myocardial infarction, muscle injury and congestive cardiac failure [85]. Increase in ALT activity has also been associated with vitamin D malnutrition and several diseases of the bone [86]. There were observed increases in the alkaline phosphatase activity in rats fed various levels of Imbrasia belina larva P ≥ 0.05 compared to those fed casein diets. Rats fed casein diets showed lower levels of alkaline phosphatase activity compared to the other diets, but the difference was not significant (P>0.05) for these other insect/larvae. Alkaline phosphatase is present in the canalicular and sinusoidal membranes of the liver, but is also present in many other tissues e.g. bone, intestine and placenta. Serum alkaline phosphatase is raised in cholestasis from any cause, whether intrahepatic or extrahepatic [85, 87]. There were observed decreases in the activity of Gamma Glutamyl transferase (or transpeptidase) (A microsomal enzyme present in many tissues including the liver), in the Insect/ larval diets with the exception of Rhynchophorus phoenicis larval diet where the values were comparable to values observed in the casein fed animals. The difference were not significant compared with the casein values (P ≥ 0.05) except for the Imbrasia belina larval diet. These observed differences and apparent lack of any effects of the Insect/ larvae intake on these enzymes makes it difficult to ascertain any disease condition. The results of the haematological data (Table 6) show that the various protein sources had different effects on the total plasma protein concentration. Rats fed Oryctes rhinoceros, Macrotermes bellicosus and Rhynchophorus phoenicis larval diets had plasma total protein levels comparable to casein, but values for Imbrasia belina larva were significantly lower than casein values (P < 0.05). During protein depletion periods, there is usually a drop in plasma protein content and plasma volume, resulting in a steep reduction in the total amount of circulating plasma protein [88]. Blood urea levels for the various insect/ larval diets were similar to values observed for casein with the exception of values for Imbrasia belina fed rats. Miller and Payne [89] reported that, if the concentration of energy in the diet is too low, some of the protein is inevitably deaminated and used for energy. Since the feed intakes of rats fed Imbrasia belina larvae were low, the low energy level may have been one of the factors contributing to the higher levels of blood urea nitrogen. Rhynchophorus phoenicis fed rats recorded the highest feed intake and also the lowest blood urea nitrogen values. For the most part, plasma total protein and blood urea nitrogen levels reflected the quality of the protein sources. Blood urea nitrogen levels were lower in rats with the highest PER values. The higher concentration of blood urea nitrogen in the blood of rats with low PER values indicates the presence of large quantities of amino nitrogen resulting from the breakdown of tissue or dietary proteins or both. In this study PER values are positively correlated with plasma total protein and negatively correlated with blood urea nitrogen levels. The significant relationship between the biological value of the diets and blood urea nitrogen levels has been shown by several workers [89, 90]. There were no significant differences in the PCV, WBC, RBC, Platelet count, MCV, MCH, MCHC of the animals on the reference and Insect / larval diets (P≥ 0.05). Percentage lymphocyte, was only slightly elevated while percentage Neutrophils was slightly decreased in rats fed Imbrasia belina, but this elevation or decrease was not significant at P>0.05. The similarities in the values for the test samples suggest that the animals were capable of utilizing these samples with almost equal efficiency.

Ekpo, K.E Arch. Appl. Sci. Res., 2011, 3 (5):428-444 _____________________________________________________________________________
442 Scholars research library
REFERENCES [1] TRE Southwood. Amer. Scient. 1977, 65: 30-39. [2] K Nonaka. Agr. Stud. Monogr., 1996, 22: 29-46. [3] AO Onigbinde., B Adamolekun. Central Afr. J. med., 1998, 44 (5) 125-127. [4] PJ Quin. Foods and Feeding Habits of the Pedi. Witwatersrand University, Johannesburg, Republic of South Africa. 1959, Pp. 278. [5] K Ruddle. Biotropica. 1973, 5: 94 –101. [6] D Gilmour. Biochemistry of insects. Academic Press, New York and London. 1961. [7] IB Umoh, O Bassir. Food Chem., 1977, 2: 315. [8] J J Dreyer, AS Wehmeyer. South Afr. J. Sci., 1982, 78: 33-35. [9] J O Fasoranti, DO Ajiboye. Amer. Entomologist. 1993, 39 (2): 113 – 116. [10] KE Ekpo. Ph.D. Thesis. Ambrose Alli University, Ekpoma, Edo State, Nigeria. 2003. [11] KE Ekpo, AO Onigbinde.). Nig. J. Nutritional Sciences. 2005a, 26(1): 54-59. [12] KE Ekpo, AO Onigbinde. Pakistan J. Nutr., 2005b, 4(5): 287-290. [13] KE Ekpo, AO Onigbinde. Nig. J. of Nutritional Sciences. 2008, 29(2): 201-209. [14] KE Ekpo. Annals of Biological Research. 2010, 1(1): 178-190. [15] M Pyke. The Science of Nutrition. In: Science in Nutrition. John Murray (Publishers) Ltd. London. 1979, 251-258. [16] B Adamolekun. Lancet. 1993, 341: 629. [17] EG Bligh, NJ Dyer. Can. J. Bioche. Physiol. 1959, 37: 911-917. [18] PC William. Analyst. 1964, 84: 281-283. [19] DH Spackman, S Moore, WH Stern. Anal. Chem. 1958, 30:1190. [20] Association of Official Analytical chemists (AOAC) Official methods of Analysis. 12th Edition, Washington D.C. 1980. [21] D Pearson. Chemical Analysis of Foods. 7th Edition. Churchill Livingstone (Publisher). 1976, 491-516. [22] MY Jenkins, GV Mitchell. Nutr. Res. 1989, 9: 83-92. [23] TB Osborne, LB Mendel, EL Ferry. J. Biol. Chem., 1919, 37: 223. [24] HH Mitchell.). J. Biol. Chem., 1924, 58: 73. [25] AE Bender, BH Doell. Brit. J. Nutr. 1957, 11: 140. [26] M Robert, O Bern, NL Mathew. Principles of Physiology. Wolf Publishing Co limited. 1990, 188-191. [27] S Reitman, S Frankel. Amer. J. Clin. Patho. 1957, 28: 56. [28] KC Deutsche. J. Clin. Chem., 1972, 10:82. [29] MW Weatherburn. Analytical Chemistry., 54: 971. [30] IE Weichselbaum. Amer. J. Clin. Path., 1997, 56: 2. [31] JJ Davis. USDA Farmer’s Bull. 1918. No. 940; 28. [32] JH Bodine. J. Expt. Zool., 1923, 37: 457-476. [33] D Ludwig, HM Landsman. Physiol. Zool., 1937, 10: 171-179. [34] WE Fleming. USDA Tech. Bull. 1968, No 1383 :78. [35] JS Teotia, BF Miller. Brit. Poult. Sci. 1974, 15: 177-182. [36] GL Newton, CV Broram, OM Hale. J. Anim. Sci. 1977, 44: 395-400. [37] BJ Nakagaki, MZ Sunde, GR DeFoliart. Poult. Sci., 1987, 66: 1367-1371. [38] MO Ashiru. Ecol Food Nutr. 1988, 22: 313 – 320. [39] ME Ukhun, MA Osasona. Nutr. Rep. Internat., 1985, 32(5): 1121-1129.

Ekpo, K.E Arch. Appl. Sci. Res., 2011, 3 (5):428-444 _____________________________________________________________________________
443 Scholars research library
[40] D White, K Kendall. Bear News. 1993, 2 (3): 2-3. [41] BK Watt, AL Merril. U.S. Dept. of Agric. Handbook, 1963, 8: 1-189. [42] VB Wigglesworth. The principles of insect physiology. 7th Edition. Methuen and Co Ltd. (Publishers). London. 1976, p594. [43] RF Chapman. The Insects: Structure and Function. The English Language Book society. Stoughton and Hodder. Printed in Great Britain for Hodder and Stoughton Educational. 1980, 83-106. [44] PG Fast. Progress in the chemistry of fats and other lipids. 1970,11(2) : 181-242. [45] PG Fast. Science. 1967, 155: 1680-1681. [46] CC Calvert, RD Martin, NO Morgan. J. Econ. Entomol., 1969, 62: 938-939. [47] JK Ryan, P Jelen, WC Sauer. J. Food Sci., 1983, 48:886-896. [48] WW Leung. Food consumption table for use in Africa. FAO U.S. Govt. Printing Office. Washington D.C. 1968. [49] WW Leung. Food consumption table for use in East Asia. FAO, U.S. Govt. Printing Office. Washington D.C. 1972. [50] GR DeFoliart. Insect as Human Food. Elsevier Science (Publishers). 1992, 395-399. [51] S Davidson, R Passmore, JF Brock. In: Human nutrition and Dietetics (5th edition). TheEnglish Language Book Society and Churchill Livingstone. 1973, 77. [52] RJ Phelps, JK Struthers, SJL Moyo. Zoological Africana. 1975, 10: 123-132. [53] JFS Olivcira, JP de Carvacho, RFXB de Sousa, MM Simao. Ecol. Food. Nutr., 1976, 5: 91-97. [54] F Malaisse, G Parent. Naturalistes Beiges. 1980, 61: 2-24. [55] J Ramos-Elorduy, J. M Pino. Revta Soc. Quim. Mexico. 1990, 34: 56-65. [56] GR DeFoliart. Food Insects Newslet., 1991, 4 (1). [57] KE Ekpo, AO Onigbinde. Pakistan J. Nutr., 2007a, 6(3): 247-251. [58] KE Ekpo, AO Onigbinde. Pakistan J. Scientific and Industrial Research. 2007b, 50(2): 7579. [59] TT Burton. Human nutrition. (Formerly The Heinz Handbook of nutrition) Tata McGraw-hill Publishing Co., New Delhi. 3rd Edition. 1979, 61- 68. [60] CC Calvert, NO Morgan, HJ Edy. Proc. Internat. Sympos. .on livestock wastes. Am. Soc. Agric. Eng. 1971, 319-320. [61] OM Hale. J. Ga. Entomol. Sci. 1973, 8: 16-20. [62] SI Koo, TA Currin, MG Jonhson, EW King and DE Turk. Poult. Sci. 1980, 59: 2514 -2517. [63] SV Landry, GR DeFoliart and ML Sunde. J.Econ. Entomol., 1986, 79: 600-604. [64] GR DeFoliart, MD Finke and ML Sunde. J. Econ. Entomol., 1982, 75: 848-852. [65] GR Wyatt and ML Pan. Ann. Rev. Biochem 1978, 47: 779 – 817. [66] GR Wyatt. Ann. Rev. Entomol., 1961, 6:75. [67] MM Hill. Food Guides- Their Development and use. Nut. Prog. News (US Department of Agriculture) Washington D.C. 1970, Pp 1-5. [68] L Ozimek, WC Sauer, V Kozikowski, JK Ryan, H Jorgensen and P Jelen. J. Food Sci.1985, 50: 1327- 1332. [69] M Cameron and Y Hofvander. “Manual on feeding Infants and young children”. 2nd Edition. FAO of the United Nations, Rome. 1980, Pp 41-52. [70] H Fisher. “Nutrients in Processed Foods. Symposium on proteins in processed foods”. New Orleans, AMA Publishing Sciences Group, Inc., Action Mass. 1972.

Ekpo, K.E Arch. Appl. Sci. Res., 2011, 3 (5):428-444 _____________________________________________________________________________
444 Scholars research library
[71] F.A.O. Food Composition table for use in Africa. Food and Agricultural Organization of theUnited Nations Rome. 1970. [72] RA Jacquot, and J Peret. Protein efficiency ratio and related methods. In: Protein and Amino Acid Function. Bigwood E. J. (Editor). Pergamon Press, New York. 1972, Pp 317-346. [73] R Passmore, BM Nicol, RM Nanayana, GH Beaton, and EM.Demaeyer. “Handbook on Human Nutritional Requirements”. WHO, Geneva. 1974, Pp 6-22. [74] OL Oke. The mode of cyaride detoxification. In: Chronic Cassava toxicity: Procedurings of an interdisciplinary workshop, London, England. Inter. Develop.Res. Center. Monogr. IDRC – OIOC. 1973, Pp 97-104. [75] ME Ensminger. Processing effects on nutrition. In: Food manufacturing Technology. 3rd Ed. Bm. R.R. McElchinery. American Feed 2nd. Assoc. Inc., Arlington, U.S.A. 1985. [76] M.A Joslyn.. In: Methods in Food Analysis. (2nd Edition). Acad. Press, New York and London. 1970, Pp 149-150. [77] BE Greene and TH Cumuze.). J. Fd. Sci., 1982, 47 (1) :52. [78] KM Henry. Brit. J. Nutr., 1965, 19: 125-135. [79] AA Abdel Gawaad and H Brune. Zeitschritt fur Tierphysiologie, Tcerernahrung undFuttermittelkunde 1979, 42:216 – 222. [80] E Ocio, R Vinaras, and JM Rey. Anim. Feed Sci. and Technol. 1979, 4: 227-231. [81] MD Finke, GR DeFoliart and NJ Benevenga. J. Nutr., 1989, 119: 864-871. [82] ME Shils, JA Olson and M Shike. In: Modern nutrition in health and disease. (8th Edition) Williams and Wilkins (Publisher). New York,. 1994, Pp 3-31. [83] M Tanaka, M Kimiagar, TC Lee and CO Chichester. Effect of maillard reaction on the nutritional quality of protein. In: Nutritional, Biochemical and chemical consequences of protein crosslinking. Plenum Publishing Co. New York. 1977, Pp 321-341. [84] M Kimiagar TC Lee, and CO Chichester. J. Agric. Food Chem. 1979, 28: 150-155. [85] P Kumar and M Clark. Clinical medicine. “A text book for medical students and doctors”. 3rd Edition. Bailliere Tindall (Publishers). London. 1995, Pp. 241-255. [86] HE Sauberlich, RP Dowdy and JH Skala. Laboratory tests for the assessment of nutritional status. CRC Press Inc. Cleveland. Ohio. 1974, Pp 175-180. [87] PK Bondy, and LE Rosenbery. Metabolic control and Disease. 8th Edition. Saunders Company, Philadelphia, London, Tokyo. 1981, Pp. 161-256. [88] CD Hartog, and G Pol. Assays based on repletion of exhausted nitrogen stones. In: Proteinand Amino Acid Function. (Bigwood E.J, Editor), Pergamon Press, New York. 1972, Pp347-352. [89] DS Miller and PR Payne. J. Nutr. 74: 413-419. [90] B.O Eggum. Brit. J. Nutr. 1970, 24: 983-988.