Nutrition Support in the Elderly NPA 2015
52
Issues in Nutrition for the Frail Elderly Presented by: Jonathan Hjelm, PharmD, BCPS, BCNSP, CGP Clinical Pharmacist Monique Dowd, MA, RD, LDN, CSG, CDE Clinical Nutritionist
-
Upload
jonathan-hjelm-pharmd-bcps-bcnsp-cgp -
Category
Documents
-
view
143 -
download
0
Transcript of Nutrition Support in the Elderly NPA 2015

Issues in Nutrition for the Frail Elderly
Presented by:
Jonathan Hjelm, PharmD, BCPS, BCNSP, CGP
Clinical Pharmacist
Monique Dowd, MA, RD, LDN, CSG, CDE
Clinical Nutritionist

Learning Objectives
Upon completion of this session, the learner will be able to:1. Discuss physiologic changes associated with aging as
related to nutrition2. Think about how nutrition influences health and
aging3. How is nutrition status is assessed4. Become familiar with nutritional risk factors5. Understand implications of under- and over-nutrition
for PACE programs6. Overview nutritional interventions in the context of a
PACE member7. Identify geriatric nutrition resources

Overview
• 1 in every 8 Americans is 65 years of age or older.• 10,000 Americans enter Medicare each day.• By 2030 this age group will be double what it was in
2000 (from 35 million to 72 million or 20% of US population).
• According to US Census Bureau projections, the oldest-old population could grow to 19 million by 2050. The impact of nutrition is particularly crucial for successful aging. Lack of tailored nutrient recommendations for
older adults
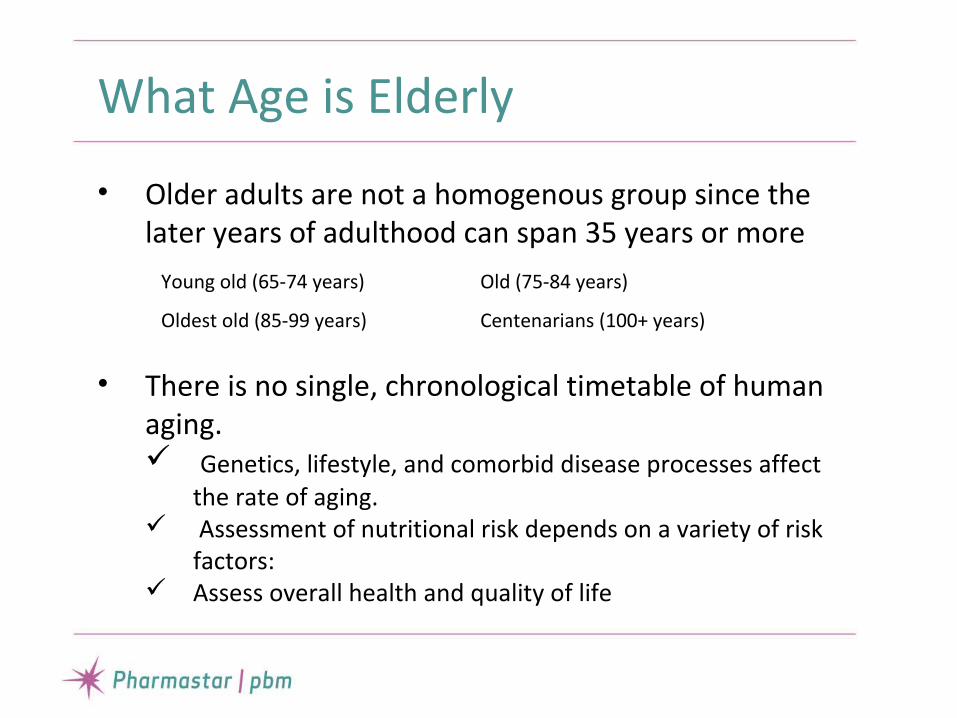
What Age is Elderly
• Older adults are not a homogenous group since the later years of adulthood can span 35 years or more
• There is no single, chronological timetable of human aging. Genetics, lifestyle, and comorbid disease processes affect
the rate of aging. Assessment of nutritional risk depends on a variety of risk
factors: Assess overall health and quality of life
Young old (65-74 years) Old (75-84 years)
Oldest old (85-99 years) Centenarians (100+ years)

Increase in Demands
• Hospitalization rates increased slightly to 336 per 1000 Medicare enrollees in 2007, with an average hospital length of stay = 5.6 days.• 4% of total population ≥ 65 years lives in a long-term-care setting whereas 15% of adults ≥ 85 use these facilities.• Skilled nursing facility stays increased significantly from 28 per 1000 Medicare enrollees in 1992 to 81 per 1000 enrollees in 2007.• Use of home care services also increases with age.

Nutrition – A Call to Action
• Lack of adequate studies, defined methods, and standards
• Multiple factors that restrict interpretation of available data (e.g. genetic factors, social environment, economic status, selection of food, weak methods of assessing nutritional status)
• Several surveys have been performed Do not adequately indicate poor nutritional status
or marked deficiency among older individuals in the US
Suggest that intake relates more to health and poverty than to age

Integration of into Geriatric Assessment
• While the number of older adults with obesity has increased from 22% to 38% over a 12 year period, malnutrition continues to pose a significant threat to older adults.
• One way to address this threat is for better integration of nutrition into the comprehensive geriatric assessment.
Comorbidities
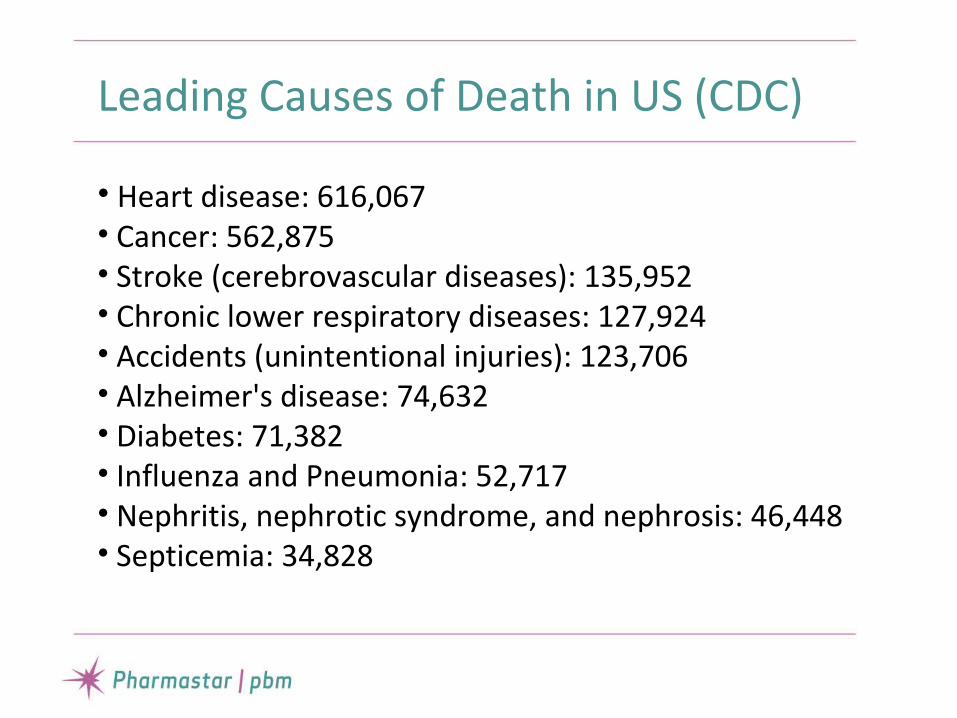
Leading Causes of Death in US (CDC)
• Heart disease: 616,067• Cancer: 562,875• Stroke (cerebrovascular diseases): 135,952• Chronic lower respiratory diseases: 127,924• Accidents (unintentional injuries): 123,706• Alzheimer's disease: 74,632• Diabetes: 71,382• Influenza and Pneumonia: 52,717• Nephritis, nephrotic syndrome, and nephrosis: 46,448• Septicemia: 34,828

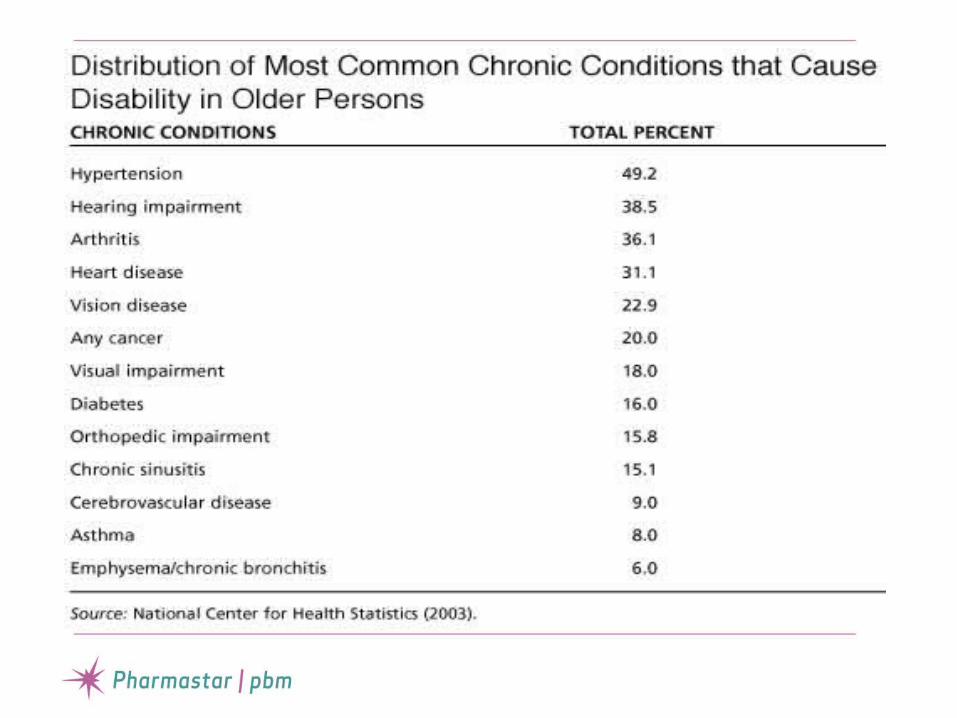
Aging and Nutritional Status
• Almost 80% of older adults have at least 1 chronic health condition and 50% have at least 2 or more.
• The most costly chronic health conditions include heart disease, stroke, cancer, and diabetes.
• Food insecurity and/or Lack of access to appropriate foods may lead to nutritional issues, which can have a major impact on health, the ability to maintain independence, and quality of life.

Aging and Nutritional Status
• Several parameters are used in assessing nutritional status in older adults.
• The effect of the aging process on lean body mass is so great that it remains a poor reflection of nutritional status in older adults.
Assessment Component
Weight Global
Body mass index (BMI) Total fat
Skin fold Percent fat
Waist:hip ratio Central adiposity
Upper arm circumference Lean body mass

Aging and Nutritional Status
• For frail older adults, physiological changes associated with aging can make it difficult to consume an adequate diet.
• These individuals may need additional supplementation to their diet to provide adequate nutrition.
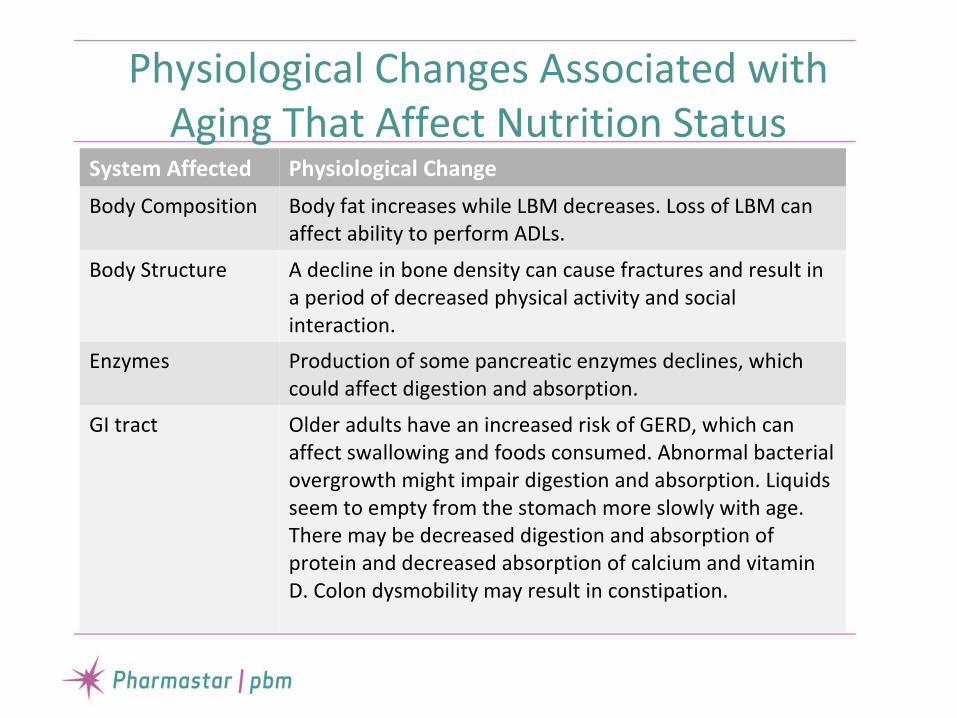
Physiological Changes Associated with Aging That Affect Nutrition Status
System Affected Physiological Change
Body Composition Body fat increases while LBM decreases. Loss of LBM can affect ability to perform ADLs.
Body Structure A decline in bone density can cause fractures and result in a period of decreased physical activity and social interaction.
Enzymes Production of some pancreatic enzymes declines, which could affect digestion and absorption.
GI tract Older adults have an increased risk of GERD, which can affect swallowing and foods consumed. Abnormal bacterial overgrowth might impair digestion and absorption. Liquids seem to empty from the stomach more slowly with age. There may be decreased digestion and absorption of protein and decreased absorption of calcium and vitamin D. Colon dysmobility may result in constipation.

Physiological Change ContinuedSystem Affected Physiological Change
Mouth Missing teeth and deterioration of gums can affect chewing and swallowing and may contribute to oral dysphagia. Discomfort and mouth pain can reduce food intake.
Neurologic Decline in cognition, steadiness, reactions, and coordination can decline, potentially affecting food and beverage intake.
Sensory changes Taste perception (dysgeusia) or smell perception (hyposmia) may be altered with aging and/or chronic disease. Ability to see, hear, smell, and taste may all decline with age, resulting in decreased intake. Taste and smell are closely tied together and loss of one sense may affect the other sense.
Urinary tract Kidneys decreased in size and function. Age is a risk factor for chronic kidney disease, leading to increased frailty, anemia, and depression

Nutritional Requirements in Older Persons
Vitamins Unchanged in older persons
Protein 0.5 to > 1 g/Kg/day
Amino acids Unchanged to increased
Calcium 850-1200 mg/day
Calories Declines by 12.4 Kcal/day/year from maturity to senescence
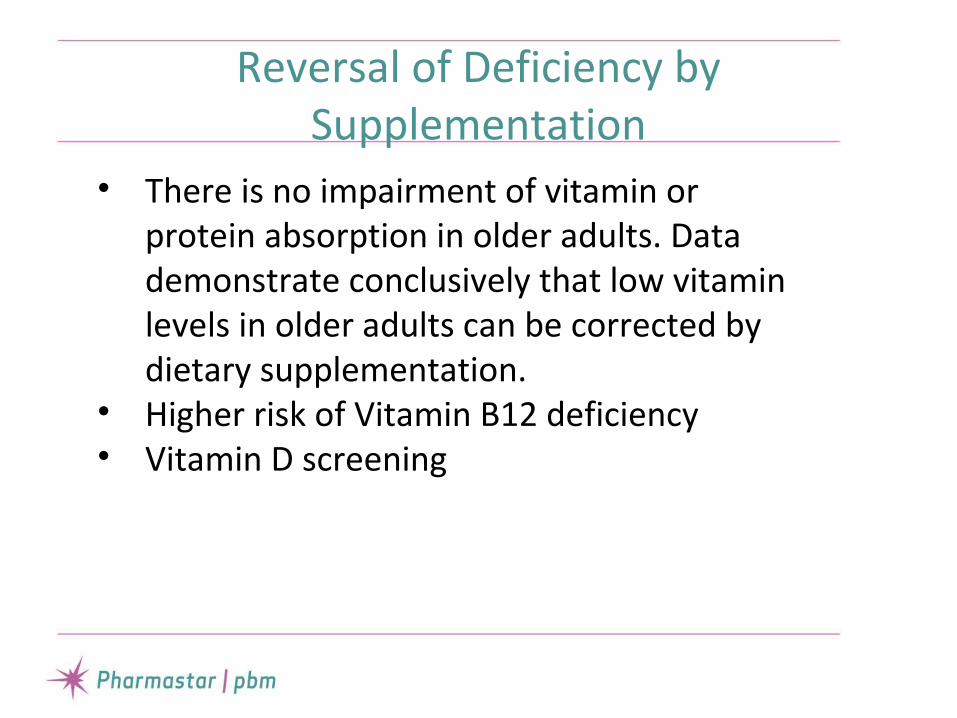
Reversal of Deficiency by Supplementation
• There is no impairment of vitamin or protein absorption in older adults. Data demonstrate conclusively that low vitamin levels in older adults can be corrected by dietary supplementation.
• Higher risk of Vitamin B12 deficiency • Vitamin D screening

Nutritional Screening and Assessment
• It is essential to have a solid nutrition-screening program in all settings that serve older adults.
Setting Time Frame
Acute Care 24 hours of admission
Skilled Nursing Facilities 5 days
Other Long-Term-Care Settings
14 days
Home Care Upon first RN visit
PACE Within 30 days of enrollment and then annually or as needed.

Evaluation of Nutritional Status
• Up to 25% of all elderly patients may be suffering from malnutrition.
• Nutrition Screening focusing on the elderly to promote early intervention as a part of routine health care for the elderly.
• Collaborative effort
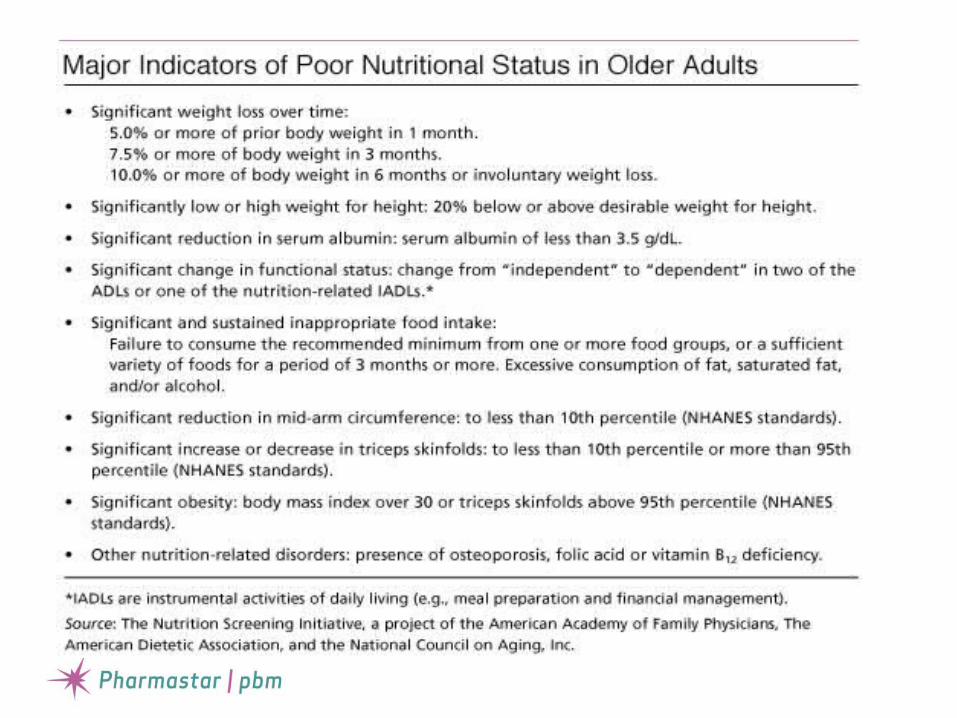
Nutrition Screening and Assessment

Critical Questions in Assessing a Patient for Malnutrition
1. Is there any reason to suspect malnutrition?2. If so, of which nutrient(s) and to what
extent?3. What are the pathophysiological mechanisms
(e.g. alteration in nutrient intake, digestion and absorption, metabolism, excretion, or requirements)?
4. What etiology underlies the pathophysiological mechanism(s)?
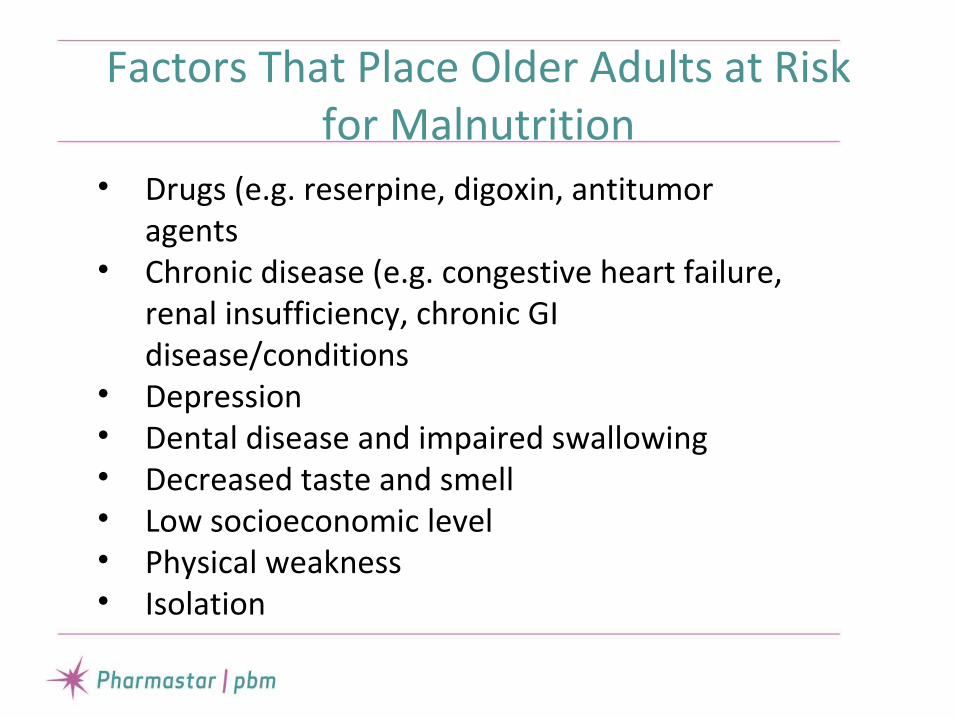
Factors That Place Older Adults at Risk for Malnutrition
• Drugs (e.g. reserpine, digoxin, antitumor agents
• Chronic disease (e.g. congestive heart failure, renal insufficiency, chronic GI disease/conditions
• Depression• Dental disease and impaired swallowing• Decreased taste and smell• Low socioeconomic level• Physical weakness• Isolation
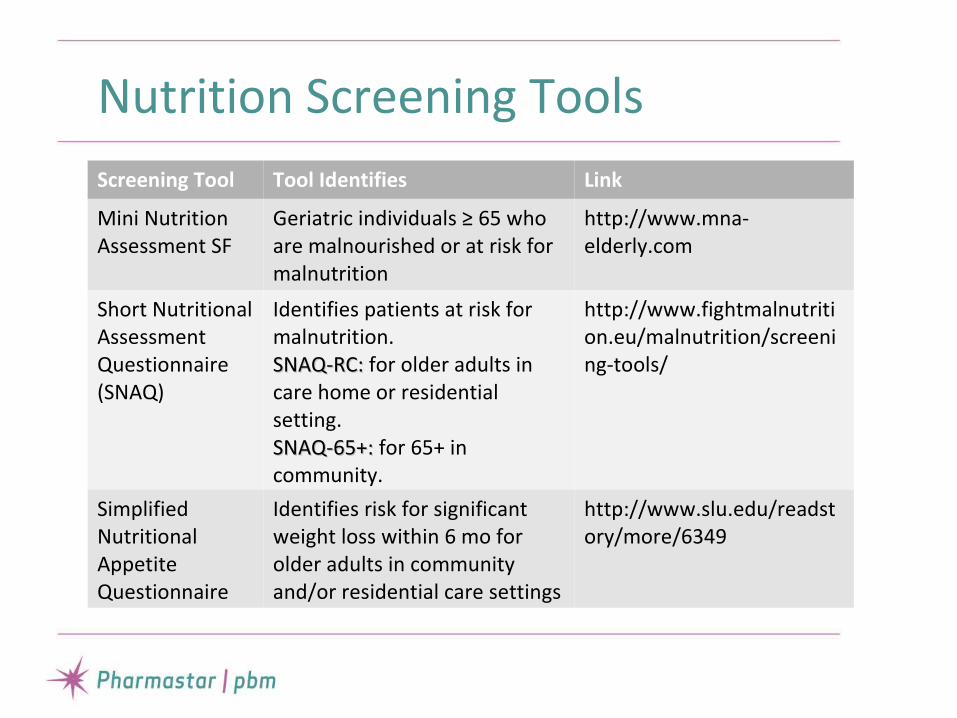
Nutrition Screening Tools
Screening Tool Tool Identifies Link
Mini Nutrition Assessment SF
Geriatric individuals ≥ 65 who are malnourished or at risk for malnutrition
http://www.mna-elderly.com
Short Nutritional Assessment Questionnaire (SNAQ)
Identifies patients at risk for malnutrition.SNAQ-RC: SNAQ-RC: for older adults in care home or residential setting.SNAQ-65+: SNAQ-65+: for 65+ in community.
http://www.fightmalnutrition.eu/malnutrition/screening-tools/
Simplified Nutritional Appetite Questionnaire
Identifies risk for significant weight loss within 6 mo for older adults in community and/or residential care settings
http://www.slu.edu/readstory/more/6349

Nutrition Diagnosis and Intervention
• After the comprehensive nutrition assessment, the RD will determine a nutritional diagnosis (i.e. increased need for protein related to increased demands for healing as evidenced by delayed wound healing).
• Determine what nutritional interventions should be taken based on the comprehensive nutrition assessment.
• Interventions should be individualized to needs and desired outcomes.

Essential Components for a Comprehensive Nutrition Assessment
• Height, current weight, usual body weight, weight history, and significant changes in weight (>5% in 30 days, or >10% in 180 days)
• Current food and fluid intake adequacy compared with calculated nutritional needs• Eating ability (able to feed self, requires assistance, needs total assistance)• Interview with the individual and/or family or staff for food preferences and tolerances• Medications that may affect food/fluid intake or tolerance (food-medication interactions)• Other factors that may impact nutritional status (such as chewing/swallowing ability,
gastrointestinal problems, depression, pressure ulcers, wounds)• Signs/symptoms of dehydration (such as poor skin turgor, flushed dry skin, coated tongue,
oliguria, irritability, confusion)• Current nutrition interventions (such as food or dining interventions, oral nutritional
supplements)• Monitoring and evaluation of nutritional status and outcomes• Intolerances and allergies: drug allergies, food allergies or intolerances, food or fluid
aversions• Dental/oral: chewing and swallowing ability, dentition.• Mental status: altered cognitive function, altered mental status, dementia, Alzheimer disease• Cultural factors: religion, customs that influence eating

Nutrient Needs for Pressure Ulcers
Based on Individual Assessment
Prevention Treatment Goals
Calories/Kg body weight
30-35 • 30-35• Adjust calories as needed based on weight loss or gain, or level of
obesity• Increased calories may be needed for individuals who have had
significant unintended weight loss• 50%–60% of calories from carbohydrate sources• Least restrictive diet when intake is poor• Enhanced foods or oral medical nutritional supplements if needed
(between meals)• Nutrition support if needed and if consistent with the individual’s
goals of care
• Promote anabolism• Prevent or correct under
nutrition, protein-energy malnutrition, unintended weight loss or regain lost weight
Protein, g/Kg body weight
1.25-1.5 • 1.25-1.5 when compatible with goals of care• Reassess as condition changes• Monitor renal function
• Promote a positive nitrogen balance
• Prevent or correct protein-energy malnutrition
Fluids, mL/Kg body weight
1 mL of fluid intake per KCal per day
• Adequate fluid to promote hydration• Monitor for signs and symptoms of dehydration• Additional fluids needed for insensible fluid losses• Estimate either using 30 mL/Kg body weight or 1 mL/Kcal
consumed
• Promote sufficient hydration• Correct known dehydration
Vitamins/ Minerals • Encourage a balanced diet with good sources of vitamins and minerals
• If deficiencies are confirmed or suspected, provide supplementation up to 100% of US RDI
• If deficiencies present, provide <40 mg of elemental zinc daily
• Provide adequate nutrients for prevention or healing
• Correct any known deficiencies

Geriatric Problems
• Weight Loss• Sarcopenia• Dehydration• Swallowing• Dementia• Pressure Ulcers• Constipation• Depression

Optimal Weight
• Weight is a primary parameter• Standard tables vs. Trends
Identify unintentional weight change Attention to individual trends
• Optimal Weight Maximize function and quality of life Minimize risk from disease or
comorbidities
Weight Trends
• Gradual weight gain during middle age
• Peak weight occurs around age 75• Gradual weight loss after age 75

Weight and Mortality


Weight and Mortality
Increasing Calories
• Energy requirements are dependent on activity and physiologic stress levels
• 30 Kcal/Kg based on IBW• Basal Energy Equation ?
Harris Benedict Equation Multiply X factor of 1-1.5
• Use more frequent meals and consider supplements or snacks to boost caloric intake
Obesity
• The prevalence of obesity among older persons is growing (30.5% in NHANES)
• Although increased mortality rate from all causes extends into the seventh decade, controversy exists about the potential harms of obesity in older adults and the relation between obesity in old age and total or disease specific mortality.

Obesity
• A meta-analysis indicated that being overweight (BMI 25-29.9 Kg/m2)is not associated with a significantly increased risk of mortality in older adults.
• BMI in the moderately obese range (BMI>30Kg/m2) is only associated with a modest (10%) increase in mortality risk.
• Central fat and relative loss of fat-free mass may become relatively more important than BMI in determining the health risk associated with obesity in older age.
Janssen and Mark, 2007

Obesity
• However, obesity causes serious medical complications, impair quality of life, can exacerbate the age-related decline in physical function, and lead to frailty.
• Self-reported functional capacity, particularly mobility, is diminished
• Have a greater rate of nursing home admissions
Villareal et al., 2005

Nonpharmacologic Treatment
Primary approach is to achieve lifestyle change. In younger overweight and obese patients, no
particular combination of protein, carbohydrate, and fat in weight loss diets offers any advantage in losing weight.
Moderate exercise at 90 min/3x/week and caloric reduction 500-700 Kcal/day can lead to weight loss of 10% and improved functional status.
Bariatric surgery is often not an option

Pharmacological Treatment
• Consider if BMI≥30 or 27-29 if comorbidities• Weight loss of 10-15% is considered good and >15% is
excellent.• Orlistat (Xenical, Alli) 120 mg every 8 hours, has the longest-
term data on safety and efficacy.• Locaserin (Belviq) 10 mg every 12 hours. Discontinue if <5%
weight loss in 12 weeks.• Phentermine-topiramate (Qsymia). Begin 3.75 mg/23 mg daily
for 14 days then increase. Evaluate weight loss following dose escalation to phentermine 15 mg/topiramate 92 mg ER after an additional 12 weeks of treatment. Do not use if CV disease or HTN
• Other drugs have limited effectiveness or high potential for adverse effects or abuse.

Sarcopenia
• Is the progressive loss of muscle mass and function resulting in decreased strength, aerobic capacity, and functional capacity
• Is a multifactorial disease process that may result from low hormone levels (estrogen and testosterone), protein and vitamin D deficiency, decrease in physical activity, chronic inflammation, and insulin resistance
• Decline is greater in men than women
Sarcopenia
• Prevalence in adults > 60 years is 8% to 40% and increases to 50% for those > 75 years old
• Estimated healthcare costs of $18.5 billion• Hispanic men and women have higher rates • A serious component of sarcopenia is
diminished functional capacity• 20% of older adults in US are functionally
disabled, and risk of disability is 1.5 to 4.6 times higher in older persons with sarcopenia

Dehydration: Causes
• Decreased thirst sensation with aging• More dependent on others to obtain fluid• Decreased ability to concentrate urine• Increased incidence of incontinence with
self-imposed fluid restriction• Increased use of medications contributing
to dehydration• Increased losses: vomiting, diarrhea, fever
Dehydration: Symptoms
• Decreased Skin Turgor• Dry Mouth and Mucosal Membranes• Decreased Urine Volume• Darker Urine• Constipation• Acute Weight Loss• Confusion

Dehydration Management
• Treat Cause• Set Fluid Goal• Goal: 30 mL/Kg or 1 mL/Kcal• Replace Additional Fluid Losses• Drink Fluid At and Between Meals• Use Foods Which Have Fluid Value

Swallowing Problems
• Swallowing is difficult or hard to initiate• Wet sounding voice• Aspiration pneumonia history• Loss of fluid through the nose• Leakage of food out of mouth when eating• Overt coughing or choking with oral intake• Weight loss • Involve speech therapist• Nutrient density• Go for least restrictive

Dementia
• Weight loss is presented as the primary nutritional problem
• Stage of disease• Eating behaviors (e.g. distracted at meal
times, eating without utensils, consume non-food items, eating pieces that are too big, resist eating). Eating is not just food Barometer of well being Social interaction
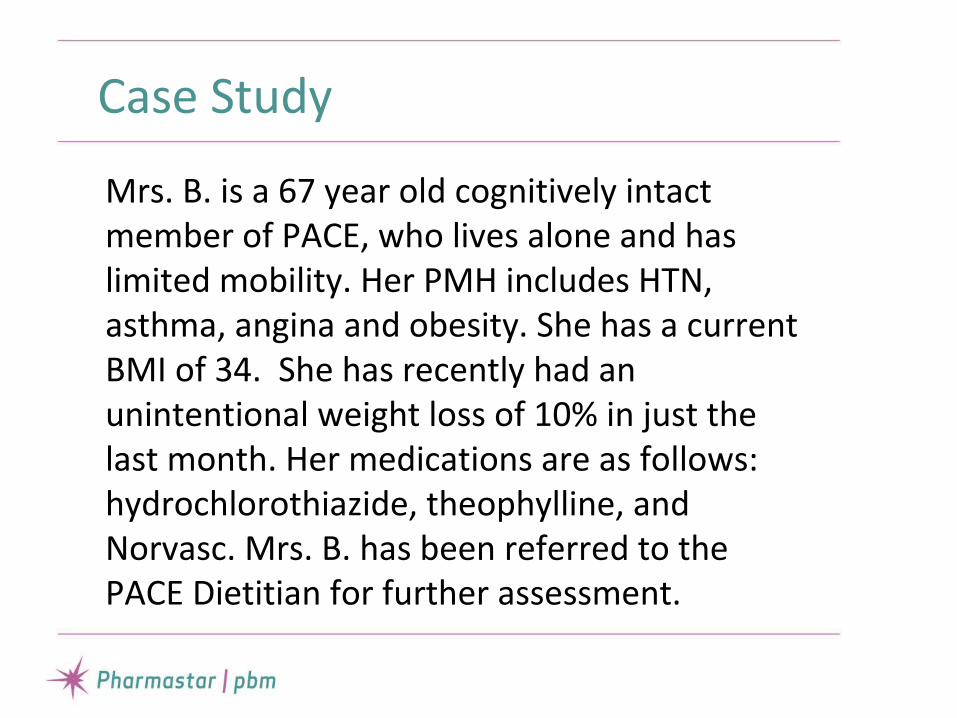
Case Study
Mrs. B. is a 67 year old cognitively intact member of PACE, who lives alone and has limited mobility. Her PMH includes HTN, asthma, angina and obesity. She has a current BMI of 34. She has recently had an unintentional weight loss of 10% in just the last month. Her medications are as follows: hydrochlorothiazide, theophylline, and Norvasc. Mrs. B. has been referred to the PACE Dietitian for further assessment.

Case Study Questions
1) Is the member’s weight loss considered significant? Why?
2) In the nutrition assessment, what are some of the nutrition risk factors that the Registered Dietitian should screen for?
3) What conditions/diseases should the NCP or physician attempt to rule out?
4) Is Mrs. B taking any medications that have potential side effects of decreasing appetite?
5) If Mrs. B’s pre-albumin came back from the lab with a value of 10, what would be the best supplementation? Why?

Resources:
• Oley Foundation. http://www.oley.org• ASPEN – American Society for Parenteral and Enteral Nutrition. http://www.nutritioncare.org• INCC – Infusion Nurses Certification Corporation. http://incc1.org• INS – Infusion Nurses Society. http://www.ins1.org• NHIA – National Home Infusion Association. http://nhia.org

Thank You!Questions?

Thank You!Thank You!

References
1. Agarwal E, Miller M, Yaxley A, Isenring E. Malnutrition in the elderly: A narrative review. Maturitas. 2013; 76: 296-302.
2. Chernoff R. Issues in geriatric nutrition. Nutr Clin Pract. 2009; 24 (2): 176-178.3. Dorner B, Posthauer ME, Friedrich EK, Robinson GE. Enteral nutrition for older adults in nursing facilities. Nutr
Clin Pract. 2011; 26 (3): 261-272.4. Jyrkka J, Enlund H, Lavikainen P, Sulkava R, Hartikainen S. Association of polypharmacy with nutritional status,
function ability and cognitive capacity over a three-year period in an elderly population. Pharmacoepidemiology and Drug Safety. 2011; 20: 514-522.
5. Karkeck JM. Invited review: Nutrition support for the elderly. Nutr Clin Pract. 1993; 8: 211-219.6. Kiesswetter E, Pohlhausen S, Uhliq K, Diekmann R, Lesser S, Heseker H, Stehle P, Sieber CC, Volkert D.
Malnutrition is related to functional impairment in older adults receiving home care. J Nutr Health Aging. 2013; 17 (4): 345-50.
7. Landi F, Cruz-Jentoft AJ, Liperoti R, Russo A, Giovannini S, Tosato M, Capoluongo E, Bernabei R, Onder G. Sarcopenia and mortality risk in frail older persons aged 80 years and older: results from ilSIRENTE study. Age Ageing. 2013; 42 (2): 203-209.
8. Landi F, Marzetti E, Martone AM, Bernabei R, Onder G. Exercise as a remedy for sarcopenia. Curr Opin Clin Nutr Metab Care. 2014; 17 (1): 25-31.
9. Martone AM, Onder G, Vetrano DL, Ortolani E, Tosato M, Marzetti E, Landi F. Anorexia of aging: a modifiable risk factor for fraility. 2013; 5 (10): 4126-4133.

References
10. Mijan de la Torre A, de Mateo Silleras B, Perez-Garcia A. Guidelines for nutrition support in the elderly. Public Health Nutrition. 2001; 4(6A): 1379-1384
11. Nieuwenhuizen WF, Weenen H, Rigby P, Hetherington MM. Older adults and patients in need of nutritional support: Review of current treatment options and factors influencing nutritional intake. Clinical Nutrition. 2010; 29: 160-169.
12. Posthauer ME, Collins N, Dorner B, Sloan C. Nutritional strategies for frail older adults. Advances in Skin & Wound Care. 2013; 26 (3): 128-140.
13. White JV, Brewer DE, Stockton MD, Keeble DS, Keenum AJ, Rogers ES, Lennon S. Nutrition in chronic disease management in the elderly. Nutr Clin Pract. 2003; 18: 3-11.
14. Strandberg TE, Strandberg AY, Salomaa VV, et al. Explaining the obesity paradox: cardiovascular risk, weight change, and mortality during long-term follow-up in men. Eur. Heart Jour. 2009; 30: 1720-1727.
15. Persson MD, Brismar KE, Katzarski KS, et al. Nutritional status using Mini Nutritional Assessment and Subjective Global Assessment predict mortality in geriatric patients. J Am Geriatr Soc. 2002; 50: 1996-2002.
16. Rubenstein LZ, Harker JO, Salva A, et al. Screening for undernutrition in geriatric practice: developing the Short-Form Mini-Nutritional Assessment (MNA-SF). J Gerontol A Biol Sci Med Sci. 2001; 56A: M366-M372.
17. Janssen I, Mark AE. Elevated body mass index and mortality risk in the elderly. Obesity Rev. 2007.; 8: 41-59.18. Villareal DT, Apovian CM, Kushner RF, et al. Obesity in older adults: technical review and position statement of
the American Society for Nutrition and NAASO, The Obesity Society. Am J Clin Nutr. 2005; 82: 923-934.