Nutrition & Food - OMICS Publishing Group · PDF file · 2014-05-18and amino acid...
5
Volume 2 • Issue 10 • 1000176 J Nutr Food Sci ISSN: 2155-9600 JNFS, an open access journal Open Access Research Article Nutrition & Food Sciences Al-Enazi et al., J Nutr Food Sci 2012, 2:10 http://dx.doi.org/10.4172/2155-9600.1000176 *Corresponding author: El-Khateeb MA, National Research Center, Water Pollution Control Department, Dokki, Cairo, Egypt, E-mail: [email protected] Received March 26, 2012; Accepted November 28, 2012; Published November 30, 2012 Citation: Al-Enazi MM, El-Bahrawy AZ, El-Khateeb MA (2012) In vivo Evaluation of the Proteins in the Cultivated Mushrooms. J Nutr Food Sci 2:176. doi:10.4172/2155- 9600.1000176 Copyright: © 2012 Al-Enazi MM, et al. This is an open-access article distributed under the terms of the Creative Commons Attribution License, which permits unrestricted use, distribution, and reproduction in any medium, provided the original author and source are credited. In vivo Evaluation of the Proteins in the Cultivated Mushrooms Al-Enazi MM 1,2 , El-Bahrawy AZ 3 and El-Khateeb MA 3 * 1 Department of Medical Laboratory Sciences, Collage of Applied Medical Sciences, Salman bin Abdulaziz University, Kingdom of Saudi Arabia 2 Vice Rector of Graduate Studies &Scientific Research, Al Jouf University, Kingdom of Saudi Arabia 3 National Research Center, Water Pollution Control Department, Dokki, Cairo, Egypt Abstract Chemical and biological assays were performed with freeze-dried samples of the cultivated mushroom A. brunnescens. Dried fruitbodies were subjected to proximate analysis and protein, carbohydrates, fat, moisture, ash, and amino acid contents were determined. The mushroom fruitbodies were found to contain 39.5% protein, 2.0% fat, 39.2% carbohydrates and 9.5% ash, on dry weight basis. Furthermore, the amino acid analysis showed that mushroom contains all the essential amino acids, and the limiting amino acid is methionine, with an amino acid score of 51.2. Diets containing 10% mushroom protein resulted in Protein Efficiency Ratio (PER) of 1.5 and Net Protein Ratio (NPR) of 0.74, compared with values for casein of 2.7% and 2.4%, respectively. No significant differences were observed between the weights of the pancreas, spleen and livers of the mushroom protein-fed rats and casein- fed rats. In addition, mushroom was found to be a good source of protein, iron, magnesium, phosphorus, thiamin, riboflavin, niacin, and vitamin C. Keywords: Mushroom; Protein; Amino acids Introduction World food supplies, in particular, seem to be growing at a slower rate than the needs, and the situation in many developing countries has reached a most critical point. Present inadequate food consumption levels are made even more dramatic by rapidly growing populations. e pressure of the continuously expanding populations and limited energy supply have led many to search for new and better methods, through which more and higher quality food can be provided. e cultivated mushrooms contain 30-50% protein on dry weight basis, which can play a constructive role in solving one of the main problems in the twentieth century: the need to feed an increasing population. In addition to being tasty, edible mushrooms are nutritious and contain protein, carbohydrates, lipids, vitamins and minerals. eir protein is of a good quality and contains all dietary essential amino acids. Mushrooms are also high in fiber. Since mushroom can convert agriculture wastes into nutritious food, they can be used as a weapon against starvation in the developing countries [1]. Although mushroom have been produced and consumed for centuries, the published data concerning chemical composition in general, and nutritional value in particular, are very limited. In fact, there have been no animal feeding studies to estimate the mushroom protein's nutritive value. Royse and Schisler [2] mentioned that food analyses have tended to dismiss mushrooms as unworthy of serious consideration, as a dietary factor in nutrition. It is evident from the lack of published data that information concerning the chemical analysis and nutritional value of mushroom protein would be extremely helpful in evaluating the use of the mushroom as a menu item, or a human dietary supplementation. e present study was carried out to evaluate the nutritive value of mushroom through the determination of the Protein Efficiency Ratio (PER), Net Protein Ratio (NPR), chemical score, and Index of Nutritional Quality (INQ). Furthermore, to estimate the ability of the mushroom protein to promote growth in rats compared to casein as standard protein. Materials and Methods Freeze-dried mushrooms Mushrooms (Agaricus brunnescens strain U-1) were supplied by Princeton Farms (Princeton, IL, USA). e mushrooms were sliced and freez-dried using Vacudyne freez-drier (Vacudyne Corporation, Chicago, Il, USA). e freez-dried mushrooms were ground to flour in a CRC Micro-Mill (CRC, Cleveland, Ohio), with circulating coolant to pass 32 mesh screen. Chemical analysis All inorganic chemicals and organic solvents were or reagent-grade quality, or better. e AOAC [3] methods were used for proximate analysis of the mushroom fruit bodies. Moisture: A quantity of mushroom containing 1g of dry mushrooms was dried to constant weight at 100 ° C, under reduced pressure (100 mm Hg) in a vacuum oven for 5 hours [3]. Ash: A dry ash mushroom sample was ignited to a constant weight in a furnace at 550 ° C [3]. Fat: Dry sample was ether extracted in a Soxhlet apparatus, under a fume hood [3]. ( ) Amount of ether extract g 100 Percent crude fat = Sample weight × Crude protein: Crude protein was calculated from the nitrogen content, as determined by the micro-Kjeldahl method [3], using the conversion factor 6.25.
Transcript of Nutrition & Food - OMICS Publishing Group · PDF file · 2014-05-18and amino acid...

Volume 2 • Issue 10 • 1000176J Nutr Food SciISSN: 2155-9600 JNFS, an open access journal
Open AccessResearch Article
Nutrition & FoodSciences
Al-Enazi et al., J Nutr Food Sci 2012, 2:10http://dx.doi.org/10.4172/2155-9600.1000176
*Corresponding author: El-Khateeb MA, National Research Center, Water Pollution Control Department, Dokki, Cairo, Egypt, E-mail: [email protected]
Received March 26, 2012; Accepted November 28, 2012; Published November 30, 2012
Citation: Al-Enazi MM, El-Bahrawy AZ, El-Khateeb MA (2012) In vivo Evaluation of the Proteins in the Cultivated Mushrooms. J Nutr Food Sci 2:176. doi:10.4172/2155-9600.1000176
Copyright: © 2012 Al-Enazi MM, et al. This is an open-access article distributed under the terms of the Creative Commons Attribution License, which permits unrestricted use, distribution, and reproduction in any medium, provided the original author and source are credited.
In vivo Evaluation of the Proteins in the Cultivated MushroomsAl-Enazi MM1,2, El-Bahrawy AZ3 and El-Khateeb MA3*1Department of Medical Laboratory Sciences, Collage of Applied Medical Sciences, Salman bin Abdulaziz University, Kingdom of Saudi Arabia2Vice Rector of Graduate Studies &Scientific Research, Al Jouf University, Kingdom of Saudi Arabia3National Research Center, Water Pollution Control Department, Dokki, Cairo, Egypt
AbstractChemical and biological assays were performed with freeze-dried samples of the cultivated mushroom A.
brunnescens. Dried fruitbodies were subjected to proximate analysis and protein, carbohydrates, fat, moisture, ash, and amino acid contents were determined. The mushroom fruitbodies were found to contain 39.5% protein, 2.0% fat, 39.2% carbohydrates and 9.5% ash, on dry weight basis. Furthermore, the amino acid analysis showed that mushroom contains all the essential amino acids, and the limiting amino acid is methionine, with an amino acid score of 51.2. Diets containing 10% mushroom protein resulted in Protein Efficiency Ratio (PER) of 1.5 and Net Protein Ratio (NPR) of 0.74, compared with values for casein of 2.7% and 2.4%, respectively. No significant differences were observed between the weights of the pancreas, spleen and livers of the mushroom protein-fed rats and casein-fed rats. In addition, mushroom was found to be a good source of protein, iron, magnesium, phosphorus, thiamin, riboflavin, niacin, and vitamin C.
Keywords: Mushroom; Protein; Amino acids
IntroductionWorld food supplies, in particular, seem to be growing at a slower
rate than the needs, and the situation in many developing countries has reached a most critical point. Present inadequate food consumption levels are made even more dramatic by rapidly growing populations. The pressure of the continuously expanding populations and limited energy supply have led many to search for new and better methods, through which more and higher quality food can be provided.
The cultivated mushrooms contain 30-50% protein on dry weight basis, which can play a constructive role in solving one of the main problems in the twentieth century: the need to feed an increasing population. In addition to being tasty, edible mushrooms are nutritious and contain protein, carbohydrates, lipids, vitamins and minerals. Their protein is of a good quality and contains all dietary essential amino acids. Mushrooms are also high in fiber. Since mushroom can convert agriculture wastes into nutritious food, they can be used as a weapon against starvation in the developing countries [1].
Although mushroom have been produced and consumed for centuries, the published data concerning chemical composition in general, and nutritional value in particular, are very limited. In fact, there have been no animal feeding studies to estimate the mushroom protein's nutritive value. Royse and Schisler [2] mentioned that food analyses have tended to dismiss mushrooms as unworthy of serious consideration, as a dietary factor in nutrition.
It is evident from the lack of published data that information concerning the chemical analysis and nutritional value of mushroom protein would be extremely helpful in evaluating the use of the mushroom as a menu item, or a human dietary supplementation.
The present study was carried out to evaluate the nutritive value of mushroom through the determination of the Protein Efficiency Ratio (PER), Net Protein Ratio (NPR), chemical score, and Index of Nutritional Quality (INQ). Furthermore, to estimate the ability of the mushroom protein to promote growth in rats compared to casein as standard protein.
Materials and MethodsFreeze-dried mushrooms
Mushrooms (Agaricus brunnescens strain U-1) were supplied by Princeton Farms (Princeton, IL, USA). The mushrooms were sliced and freez-dried using Vacudyne freez-drier (Vacudyne Corporation, Chicago, Il, USA). The freez-dried mushrooms were ground to flour in a CRC Micro-Mill (CRC, Cleveland, Ohio), with circulating coolant to pass 32 mesh screen.
Chemical analysis
All inorganic chemicals and organic solvents were or reagent-grade quality, or better. The AOAC [3] methods were used for proximate analysis of the mushroom fruit bodies.
Moisture: A quantity of mushroom containing 1g of dry mushrooms was dried to constant weight at 100°C, under reduced pressure (100 mm Hg) in a vacuum oven for 5 hours [3].
Ash: A dry ash mushroom sample was ignited to a constant weight in a furnace at 550°C [3].
Fat: Dry sample was ether extracted in a Soxhlet apparatus, under a fume hood [3].
( )Amount of ether extract g 100Percent crude fat =
Sample weight×
Crude protein: Crude protein was calculated from the nitrogen content, as determined by the micro-Kjeldahl method [3], using the conversion factor 6.25.

Citation: Al-Enazi MM, El-Bahrawy AZ, El-Khateeb MA (2012) In vivo Evaluation of the Proteins in the Cultivated Mushrooms. J Nutr Food Sci 2:176. doi:10.4172/2155-9600.1000176
Page 2 of 5
Volume 2 • Issue 10 • 1000176J Nutr Food SciISSN: 2155-9600 JNFS, an open access journal
Carbohydrates: The phenol-sulfuric acid method [4], was used for total carbohydrates determination.
Amino acids determination: The dried mushroom samples (5 mg) were hydrolyzed in 1 ml of Pierce constant boiling (6 N) hydrochloric acid, under a nitrogen atmosphere for 24 hours at 110°C. The samples were taken dryness in vacuum, with heating up to 45°C. Then, the samples were taken up in Pierce pH 2.2 sodium citrate buffers, to which no-leucine had been added as an internal standard, at a concentration of 1 millimole/ml. The samples were analyzed on a modified Beckman HPLC.
Tryptophan determination: Tryptophan was calorimetrically determined by the method of Spies.
Biological evaluation: Twenty-one day old male weanling rats of Sprague Dawley strain (Harlan Industries, Madison, WI), with an initial weight of 62-64 g were used in the two experiments. The animals were fed a complete diet (Purina Rat Chow) for a two-day adaptation period in the animal room (at 25°C, light 12 hour/day). Then, the rats were randomly distributed into groups of six animals each, and were housed in individual stainless steel cages. Assay diet and water were offered ad libitum. The weight change of every rat was monitored daily, and diet intakes were measured at every 3-day interval. The total test period was 10 days for Net Protein Ratio (NPR) and 28 days for Protein Efficiency Ratio (PER). The basal diet, as shown in table 1, was composed of the following: 10% protein; 8% oil (Mazola corn oil, locally purchased); 3.5% mineral mix (AIN 76 Formula; Teklad Co., Madison, Wisconsin); 1% vitamin mix (AIN 76 Formula; Teklad Co., Madison, Wisconsin), 1% fiber (ICN Pharmaceutical Co., Cleveland, Ohio, USA). Starch and sucrose were mixed at 2:1 ratio, to make the diets up to 100%. The mushroom protein was fed as a sole source of protein at 10% level, and casein (85% protein) was used as control diet. The following diets comprised the experimental groups:
Group1: Positive control group (10% casein), PER study.
Group2: PER Test diet (10% mushroom protein).
Group3: Negative control group (protein free), PER study.
Group4: Positive control group (10% casein), NPR study.
Group5: NPR Test diet (10% mushroom protein).
Group6: Negative control (protein free), NPR study.
The protein efficiency ratio method of AOAC was followed [3], and the Net Protein Ratio was calculated, as reported by Pellett and Young [5].
( )Wt. gain oftest animal gPER
ProteinConsumed=
Wt. gain of test animal average wt. loss of animal fed the protein free dietNPR Protein Consumed by the test animal
+=
Chemical score: The content of each Essential Amino Acid (EAA) in a food protein is expressed first as a ratio of EAA in the food. These ratios are then expressed as percentages of the ratios between EAA and the total EAA in the egg, using the following formula (FAO) [6]:
( )
( )( )
( )EAA in testprotein g Total EAAin egg g
Chemical Score 100Total EAA in test protein g EAA in egg g
= × ×
Index of Nutrition Quality (INQ)
INQ is an expression of the nutrient density of a food, i.e. the extent a food meets the requirements for a specific nutrient, compared to the extent to which it meets the needs for energy [7].
Amount of nutrient in 1000 kcl of foodINQ Humanallowance of the nutrient per 1000
=
Statistical analysis
The statistical analyses were carried out using the University Computation Center, by subjecting the data to the Statistical Analysis System (SAS), using Duncan Multiple range test (P≥0.05) to separate treatment means (Table 2).
Results and DiscussionThe chemical composition of Agaricus brunnescens on dry weight
basis is shown in table 3. Mushrooms were found to contain 89.3% moisture. On a dry weight basis, mushroom composition was 39.5% protein, 2% fat, 39.2% carbohydrates, 9.5% ash and 9.8% dietary fiber.
The results from the amino acid analysis in comparison with the amino acid content of eggs and wheat flour [6], are presented in table 4. All essential amino acids can be found in the fruitbody of Agaricus brunnescens. The mushroom protein was shown to contain essential amino acids in amounts, which are comparable to egg protein. Furthermore, the total aromatic amino acids in the fruitbody can be comparable to the amounts reported for egg protein and wheat flour protein. The most limiting amino acids in the mushroom fruitbody appear to be the sulfur-containing amino acids cystine and methionine, but the levels of the rest of the amino acids are quite satisfactory, compared to the egg protein. Based on the mushroom amino acid profile, it is quite evident that it contains higher levels of lysine, valine, analine, arginine and aspartic acid, compared to wheat flour. Since wheat flour protein contains low levels of lysine and valine, two of the essential amino acids, it would be nutritionally advantageous to supplement with mushroom proteins, certain cereal diets which are extensively used in the developing countries, as a primary source of protein. The results of the amino acids contents of Agaricus brunnescens in this study are
Component Casein (+ control) Mushroom protein (test diet) Protein (- control)Casein 117.6 -- --Mushroom -- 253.2 --Oil 80.0 78.0 80.0Minerals 35.0 35.0 35.0Vitamins 10.0 10.0 10.0Fiber 10.0 10.0 10.0Choline 1.5 1.5 1.5Starch 497.3 408.2 575.7Sucrose 248.6 204.1 287.8
Table 1: Composition of diets used for NPR and PER studies (g/Kg).
Constituent(b) PercentProtein(b) 39.5Fat(b) 2.0Carbohydrates:Starch(b) 39.2Others(b) 9.8Ash(b) 9.5
a: Mean of three samples.b: Dry weight basis.Table 2: Chemical composition of Agaricus brunnescens (strain U-1) used for in vivo rats study.(a)

Citation: Al-Enazi MM, El-Bahrawy AZ, El-Khateeb MA (2012) In vivo Evaluation of the Proteins in the Cultivated Mushrooms. J Nutr Food Sci 2:176. doi:10.4172/2155-9600.1000176
Page 3 of 5
Volume 2 • Issue 10 • 1000176J Nutr Food SciISSN: 2155-9600 JNFS, an open access journal
in general agreement with those of other researchers. Similar levels have been reported by Hayes and Haddad [8], except for tryptophan, which they found in higher quantities. The low levels of sulfur-containing amino acids are consistent with findings of Hayes and Haddad [8] and Maggioni et al. [9]. However, the high levels of tryptophan found by Hayes and Haddad [8] and the low quantities of cystine and methionine, reported by Weaver et al. [10] compared
to the amounts presented in table 4 can be due to the use of different strains.
The results of the Net Protein Ratio (NPR) study are presented in table 5 and figure 1 and 2. The rats fed a 10% casein protein diet, gained an average of 42.93g. This group was used as positive control for comparison of NPR study. The average weight of rats fed the non-protein diet decreased during the entire experimental period (-7.13 g). This group was used as negative control. The rats fed the test diet (10% mushroom protein), gained 15.51 g by the end of feeding trail period. The NPR was determined to be 2.41 for the casine fed group and 0.74 for the mushroom protein fed group, as calculated using Pellet and Young method [11]. Table 5 also shows that the weight of liver, pancreas and spleen of the mushroom fed group were not significantly different (P≥0.05) from those of casine fed rats. Consequently, the weight of kidney of the rats fed mushroom protein was significantly higher (P≥0.05) than those of casein fed rats, but it was significantly lower (P≥0.05) than the non-protein fed group.
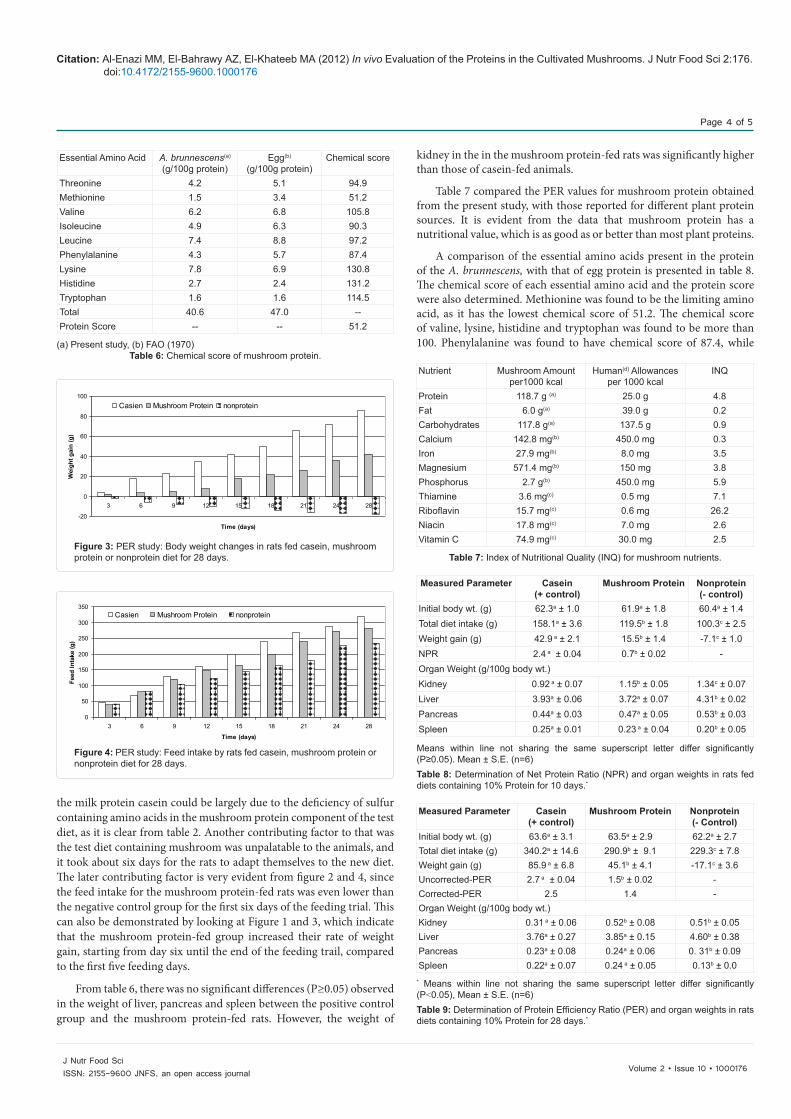
Table 6 and figure 3 and 4 show the results obtained from the PER study. The weight gains after 28 days of feeding for casein-fed rats and mushroom protein-fed rats were 85.9 g and 45.1 g, respectively. The weight of rats fed the non-protein diet decreased during the entire feeding period, resulting in average weight loss of -17.1 g. The uncorrected PER was determined to be 2.7 for the casein-fed group and 1.5 for mushroom protein-fed group, which resulted in corrected PER value of 1.4 for the mushroom protein-fed group. As the results indicate, the mushroom protein was able to promote growth in the rats, equal to 52.5% of the growth in the rats fed with casein. This finding is in close agreement with the results of Fitzpatrick et al. [11], in which it was concluded that mushroom protein was able to produce growth in albino rats, equal to slightly less than one half that produced by casein.
The lower NPR and PER value for mushroom protein compared to
Measured Amino Acid Mushroom (b) A. brunnescens Egg (c) Wheat FlourIsoleucine 4.9 6.3 3.7Leucine 7.4 8.8 6.1Lysine 7.8 6.9 2.5Methionine 1.5 3.4 1.6Phenylalinine 4.3 5.7 4.4Threonine 4.2 5.1 3.1Valine 6.2 6.8 4.3Tyrosine 3.3 4.2 2.9Tryptophan 1.6 1.6 (d) 1.1Alanine 6.6 5.9 2.8Arginine 6.5 6.1 4.1Aspartic acid 11.5 9.7 4.1Cystine 0.5 2.4 2.0Glutamic acid 16.5 12.7 34.5Glycine 4.8 3.3 3.2Histidine 2.7 2.4 1.9Proline 4.8 4.2 11.7Serine 4.2 7.6 5.4Total S-containing 2.0 5.8 3.6Total essential 40.5 47.0 28.7Total aromatic 7.6 9.9 7.3
a: (g) amino acid/100g protein, b: present study, c: FAO [6]Table 3: Comparison of amino acids content of mushroom, eggs and wheat flour.(a)
Measured Parameter Casein(+ control)
MushroomProtein
Non protein(- control)
Initial body wt. (g) 62.3a ± 1.0 61.9a ± 1.8 60.4a ± 1.4Total diet intake (g) 158.1 a ± 3.6 119.5b ± 1.8 100.3c ± 2.5Weight gain (g) 42.9 a ± 2.1 15.5b ± 1.4 -7.1c ± 1.0NPR 2.4 a ± 0.04 0.7b ± 0.02 -Organ Weight (g/100g body wt.)Kidney 0.92 a ± 0.07 1.15b ± 0.05 1.34c ± 0.07Liver 3.93 a ± 0.06 3.72a ± 0.07 4.31b ± 0.02Pancreas 0.44 a ± 0.03 0.47a ± 0.05 0.53b ± 0.03Spleen 0.25 a ± 0.01 0.23 a ± 0.04 0.23 a ± 0.04
Table 4: Determination of Net Protein Ratio (NPR) and organ weights in rats fed diets containing 10% Protein for 10 days.*
Protein Source PER ReferenceWheat flour 0.60 FAO (1970)Red Kidney beans 0.88 FAO (1970)Lentils 0.91 FAO (1970)Seasame flour 0.99 FAO (1970)Sunflower seed meal 1.24 FAO (1970)Mushroom 1.40 Present study (1989)Field peas flour 1.46 -Lima Beans 1.68 -Winged beans 1.73 -Soybean flour 1.81 -
Table 5: Comparison of PER values of in the vivo digestibility studies of different plant protein sources and mushroom protein.
-10
0
10
20
30
40
50
1 2 3 4 5 6 7 8 9 10 11
Time (days)
Wei
ght g
ain
(g)
Casien Mushroom Protein nonprotein
Figure 1: NPR study: Body weight changes in rats fed casein, mushroom protein or nonprotein diet for 10 days.
0
20
40
60
80
100
120
140
160
180
2 4 6 8 10
Time (days)
Feed
Inta
ke (g
)
Casien Mushroom Protein nonprotein
Figure 2: NPR study: Feed intake by rats fed casein, mushroom protein or nonprotein diet for 10 days.
Citation: Al-Enazi MM, El-Bahrawy AZ, El-Khateeb MA (2012) In vivo Evaluation of the Proteins in the Cultivated Mushrooms. J Nutr Food Sci 2:176. doi:10.4172/2155-9600.1000176
Page 4 of 5
Volume 2 • Issue 10 • 1000176J Nutr Food SciISSN: 2155-9600 JNFS, an open access journal
the milk protein casein could be largely due to the deficiency of sulfur containing amino acids in the mushroom protein component of the test diet, as it is clear from table 2. Another contributing factor to that was the test diet containing mushroom was unpalatable to the animals, and it took about six days for the rats to adapt themselves to the new diet. The later contributing factor is very evident from figure 2 and 4, since the feed intake for the mushroom protein-fed rats was even lower than the negative control group for the first six days of the feeding trial. This can also be demonstrated by looking at Figure 1 and 3, which indicate that the mushroom protein-fed group increased their rate of weight gain, starting from day six until the end of the feeding trail, compared to the first five feeding days.
From table 6, there was no significant differences (P≥0.05) observed in the weight of liver, pancreas and spleen between the positive control group and the mushroom protein-fed rats. However, the weight of
kidney in the in the mushroom protein-fed rats was significantly higher than those of casein-fed animals.
Table 7 compared the PER values for mushroom protein obtained from the present study, with those reported for different plant protein sources. It is evident from the data that mushroom protein has a nutritional value, which is as good as or better than most plant proteins.
A comparison of the essential amino acids present in the protein of the A. brunnescens, with that of egg protein is presented in table 8. The chemical score of each essential amino acid and the protein score were also determined. Methionine was found to be the limiting amino acid, as it has the lowest chemical score of 51.2. The chemical score of valine, lysine, histidine and tryptophan was found to be more than 100. Phenylalanine was found to have chemical score of 87.4, while
Essential Amino Acid A. brunnescens(a) (g/100g protein)
Egg(b)
(g/100g protein)Chemical score
Threonine 4.2 5.1 94.9Methionine 1.5 3.4 51.2Valine 6.2 6.8 105.8Isoleucine 4.9 6.3 90.3Leucine 7.4 8.8 97.2Phenylalanine 4.3 5.7 87.4Lysine 7.8 6.9 130.8Histidine 2.7 2.4 131.2Tryptophan 1.6 1.6 114.5Total 40.6 47.0 --Protein Score -- -- 51.2
(a) Present study, (b) FAO (1970)Table 6: Chemical score of mushroom protein.
-20
0
20
40
60
80
100
3 6 9 12 15 18 21 24 28
Time (days)
Wei
ght g
ain
(g)
Casien Mushroom Protein nonprotein
Figure 3: PER study: Body weight changes in rats fed casein, mushroom protein or nonprotein diet for 28 days.
0
50
100
150
200
250
300
350
3 6 9 12 15 18 21 24 28
Time (days)
Feed
Inta
ke (g
)
Casien Mushroom Protein nonprotein
Figure 4: PER study: Feed intake by rats fed casein, mushroom protein or nonprotein diet for 28 days.
Nutrient Mushroom Amount per1000 kcal
Human(d) Allowances per 1000 kcal
INQ
Protein 118.7 g (a) 25.0 g 4.8Fat 6.0 g(a) 39.0 g 0.2Carbohydrates 117.8 g(a) 137.5 g 0.9Calcium 142.8 mg(b) 450.0 mg 0.3Iron 27.9 mg(b) 8.0 mg 3.5Magnesium 571.4 mg(b) 150 mg 3.8Phosphorus 2.7 g(b) 450.0 mg 5.9Thiamine 3.6 mg(c) 0.5 mg 7.1Riboflavin 15.7 mg(c) 0.6 mg 26.2Niacin 17.8 mg(c) 7.0 mg 2.6Vitamin C 74.9 mg(c) 30.0 mg 2.5
Table 7: Index of Nutritional Quality (INQ) for mushroom nutrients.
Measured Parameter Casein (+ control)
Mushroom Protein Nonprotein (- control)
Initial body wt. (g) 62.3a ± 1.0 61.9a ± 1.8 60.4a ± 1.4Total diet intake (g) 158.1a ± 3.6 119.5b ± 1.8 100.3c ± 2.5Weight gain (g) 42.9 a ± 2.1 15.5b ± 1.4 -7.1c ± 1.0NPR 2.4 a ± 0.04 0.7b ± 0.02 -Organ Weight (g/100g body wt.)Kidney 0.92 a ± 0.07 1.15b ± 0.05 1.34c ± 0.07Liver 3.93a ± 0.06 3.72a ± 0.07 4.31b ± 0.02Pancreas 0.44a ± 0.03 0.47a ± 0.05 0.53b ± 0.03Spleen 0.25a ± 0.01 0.23 a ± 0.04 0.20b ± 0.05
Means within line not sharing the same superscript letter differ significantly (P≥0.05). Mean ± S.E. (n=6) Table 8: Determination of Net Protein Ratio (NPR) and organ weights in rats fed diets containing 10% Protein for 10 days.*
Measured Parameter Casein(+ control)
Mushroom Protein Nonprotein(- Control)
Initial body wt. (g) 63.6a ± 3.1 63.5a ± 2.9 62.2a ± 2.7Total diet intake (g) 340.2a ± 14.6 290.9b ± 9.1 229.3c ± 7.8Weight gain (g) 85.9 a ± 6.8 45.1b ± 4.1 -17.1c ± 3.6Uncorrected-PER 2.7 a ± 0.04 1.5b ± 0.02 -Corrected-PER 2.5 1.4 -Organ Weight (g/100g body wt.)Kidney 0.31 a ± 0.06 0.52b ± 0.08 0.51b ± 0.05Liver 3.76a ± 0.27 3.85a ± 0.15 4.60b ± 0.38Pancreas 0.23a ± 0.08 0.24a ± 0.06 0. 31b ± 0.09Spleen 0.22a ± 0.07 0.24 a ± 0.05 0.13b ± 0.0
* Means within line not sharing the same superscript letter differ significantly (P˂0.05), Mean ± S.E. (n=6)Table 9: Determination of Protein Efficiency Ratio (PER) and organ weights in rats diets containing 10% Protein for 28 days.*

Citation: Al-Enazi MM, El-Bahrawy AZ, El-Khateeb MA (2012) In vivo Evaluation of the Proteins in the Cultivated Mushrooms. J Nutr Food Sci 2:176. doi:10.4172/2155-9600.1000176
Page 5 of 5
Volume 2 • Issue 10 • 1000176J Nutr Food SciISSN: 2155-9600 JNFS, an open access journal
threonine, isoleucine and leucine were found to have chemical scores higher than 90.
Index of Nutritional Quality (INQ) for 11 nutrients of the mushroom (Agaricus brunnescens) is presented in table 9. Fat, carbohydrates and calcium were found to have INQ values less than 1, while the rest (8 nutrients) have INQ values of more than 2. According to Guthrie and Bagby [12], a food is considered a source of a nutrient if it has an INQ of 1, and if 1 serving provides at least 2% of the U.S.RDA for the nutrient. To qualify as a good or excellent source, it must have an INQ of 1.5 and provide 10% of the U.S.RDA in each serving. Based on that general rule, mushroom can be considered a good source of protein, iron, magnesium, phosphorus, thiamin, riboflavin, niacin and vitamin C.
In general, the quality of a protein is determined by the kind and proportion of amino acids it contains [12]. Mushroom can be classified as partially complete protein source, since it has limited amounts of sulfur-containing amino acids. Therefore, it is essential that mushroom protein be supplemented with sulfur-containing amino acids, or it can be used as a complementary protein source.
References
1. Lelley J (1987) Disinfection in mushroom farming-possibilities and limits. Mushroom J 14: 181-187.
2. Royse DJ, Schisler LC (1980) Mushrooms Their consumption, production and culture development. Interdiscip Sci Rev 5: 324-332.
3. http://www.aoac.org/.
4. Murray RGE, Philips G (1981) Manual of methods for general bacteriology. American Society for Microbiology, Washington, D.C, USA.
5. Pellett LP, Young VR (1980) Nutritional evaluation of protein foods. In: UNU Publication 224-239.
6. FAO (1970) Nutritional studies No. 24 Amino acid content of foods and biological data on proteins, Rome.
7. Windham CT, Wyse BW, Hansen RG (1983) Nutrient density of diets in the USDA Nationwide Food Consumption Survey, 1977-1978: II. Adequacy of Nutrient density consumption practices. J Am Diet Assoc 82: 34-43.
8. Hayes WA, Haddad N (1976) The food value of the cultivated mushroom and its importance in the mushroom industry. Mushroom J 4: 104-110.
9. Maggioni A, Passera C, Renosto F, Benetti E (1968) Composition of cultivated mushrooms (Agaricus bisporus) during the growing cycle as affected by the nitrogen source introduced in composting. J Agric Food Chem 16: 517-519.
10. Weaver JC, Kroger M, Kneebone LR (1977) Comparative protein studies (Kjeldahl, dye binding, amino acid analysis) of nine strains of Agaricus bisporus (Large) Inbach mushroom. J Food Sci 42: 364-366.
11. Fitzpatrick WH, Esselen WB Jr, Weir E (1946) Composition and nutritive value of mushroom protein. J Am Diet Assoc 22: 318-323.
12. Guthrie HA, Bagby RS (1989) Introductory nutrition. Times mirror / Mosby Collage Publishing, St. Louis.
Submit your next manuscript and get advantages of OMICS Group submissionsUnique features:
• Userfriendly/feasiblewebsite-translationofyourpaperto50world’sleadinglanguages• AudioVersionofpublishedpaper• Digitalarticlestoshareandexplore
Special features:
• 200OpenAccessJournals• 15,000editorialteam• 21daysrapidreviewprocess• Qualityandquickeditorial,reviewandpublicationprocessing• IndexingatPubMed(partial),Scopus,DOAJ,EBSCO,IndexCopernicusandGoogleScholaretc• SharingOption:SocialNetworkingEnabled• Authors,ReviewersandEditorsrewardedwithonlineScientificCredits• Betterdiscountforyoursubsequentarticles
Submityourmanuscriptat:http://www.editorialmanager.com/lifesciences