Nutrition 2016 Feed composition t able...composition. Feed composition values Feeds are not of...
11
16 beefmagazine.com March 2016 Nutrition N utrition research spanning more than 125 years has de- fined the nutrients required by animals. By using this informa- tion, diets can be formulated from feeds and ingredients to meet these requirements, with the expectation that animals will not only remain healthy, but also will be productive 2016 Feed composition table Here are the latest calculations on the nutrient composition of a wide range of feedstuffs fed to cattle and sheep. COMPILED BY R.L. PRESTON, PH.D. and efficient. The ultimate goal of feed analysis is to predict the pro- ductive response of animals when they are fed diets of a given nutrient composition. Feed composition values Feeds are not of constant com- position. Unlike chemicals that are “chemically pure” and thus have a constant composition, feeds vary in their composition for many reasons. An actual analysis of a feed to be used in a diet is much more accurate than the use of tabulated composi- tion data. Actual analysis should be obtained and used whenever pos- sible.
Transcript of Nutrition 2016 Feed composition t able...composition. Feed composition values Feeds are not of...

16 beefmagazine.com March 2016
Nutrition
Nutrition research spanning more than 125 years has de-fined the nutrients required
by animals. By using this informa-tion, diets can be formulated from feeds and ingredients to meet these requirements, with the expectation that animals will not only remain healthy, but also will be productive
2016 Feed composition t able
Here are the latest calculations on the nutrient composition of a wide range of feedstuffs fed to cattle and sheep.
COMPILED BY R.L. PRESTON, PH.D.
and efficient. The ultimate goal of feed analysis is to predict the pro-ductive response of animals when they are fed diets of a given nutrient composition.
Feed composition valuesFeeds are not of constant com-
position. Unlike chemicals that are
“chemically pure” and thus have a constant composition, feeds vary in their composition for many reasons.
An actual analysis of a feed to be used in a diet is much more accurate than the use of tabulated composi-tion data. Actual analysis should be obtained and used whenever pos-sible.

18 beefmagazine.com March 2016
ENERGY PROTEIN FIBER MINERALS
FEEDSTUFFDM%
TDN%
NEm NE
g NE
l
Mcal/cwtCP%
UIP%
CF%
ADF%
NDF%
eNDF %
EE%
ASH%
CA%
P%
K%
CL%
S%
Znppm
Alfalfa cubes 91 57 57 25 57 18 30 29 36 46 40 2.0 11 1.30 0.23 1.9 0.37 0.33 20
Alfalfa dehydrated, 17% CP 92 61 62 31 61 19 60 26 34 45 6 3.0 11 1.42 0.25 2.5 0.45 0.28 21
Alfalfa fresh 24 61 62 31 61 19 18 27 34 46 41 3.0 9 1.35 0.27 2.6 0.40 0.29 18
Alfalfa hay, early bloom 90 59 59 28 59 19 20 28 35 45 92 2.5 8 1.41 0.26 2.5 0.38 0.28 22
Alfalfa hay, midbloom 89 58 58 26 58 17 23 30 36 47 92 2.3 9 1.40 0.24 2.0 0.38 0.27 24
Alfalfa hay, full bloom 88 54 54 20 54 16 25 34 40 52 92 2.0 8 1.20 0.23 1.7 0.37 0.25 23
Alfalfa hay, mature 88 50 50 12 49 13 30 38 45 59 92 1.3 8 1.18 0.19 1.5 0.35 0.21 23
Alfalfa seed screenings 91 84 92 61 87 34 13 15 10.7 6 0.30 0.67
Alfalfa silage 30 55 55 21 55 18 19 28 37 49 82 3.0 9 1.40 0.29 2.6 0.41 0.29 26
Alfalfa silage, wilted 39 58 58 26 58 18 22 28 37 49 82 3.0 9 1.40 0.29 2.6 0.41 0.29 26
Alfalfa leaf meal 89 60 60 30 60 26 15 16 24 34 35 3.0 10 2.88 0.34 2.2 0.32 39
Alfalfa stems 89 47 47 7 46 11 44 44 51 68 100 1.3 6 0.90 0.18 2.5
Almond hulls 89 56 56 23 56 3 60 16 29 36 100 3.1 7 0.24 0.10 2.0 0.03 0.07 20
Ammonium chloride 99 0 0 0 0 163 0 0 0 0 0 0.0 0.00 0.00 0.0 66.00 0.00 0
Ammonium sulfate 99 0 0 0 0 132 0 0 0 0 0 0.0 24.15
Apples 17 70 73 44 71 3 10 7 9 25 10 2.2 2 0.06 0.60 0.8
Apple pomace, wet 20 68 70 41 69 5 10 18 27 36 27 5.2 3 0.13 0.12 0.5 0.04 11
Apple pomace, dried 89 67 69 40 68 5 15 18 28 38 29 5.2 3 0.13 0.12 0.5 0.04 11
Artichoke tops (Jerusalem) 27 61 62 31 61 6 18 30 41 40 1.1 10 1.62 0.11 1.4
Avocado seed meal 91 52 52 16 51 20 19 24 1.2 16
Bahiagrass hay 90 53 53 18 53 6 37 32 41 72 98 1.8 7 0.47 0.20 1.4 0.21
Bakery product, dried 90 90 100 68 94 11 30 3 9 30 0 11.5 4 0.16 0.27 0.4 2.25 0.15 33
Bananas 24 84 92 61 87 4 4 5 0.8 3 0.03 0.11 1.5 8
Barley hay 90 57 57 25 57 9 28 37 65 98 2.1 8 0.30 0.28 1.6 0.19 25
Barley silage 35 59 58 26 58 12 22 34 37 58 61 3.0 9 0.46 0.30 2.4 0.22 28
Barley silage, mature 35 58 58 26 58 12 25 30 34 50 61 3.5 9 0.30 0.20 1.5 0.15 25
Barley straw 90 44 44 1 43 4 70 42 55 78 100 1.9 7 0.32 0.08 2.2 0.67 0.16 7
Barley grain 89 84 92 61 87 12 28 5 7 20 34 2.1 3 0.06 0.38 0.6 0.18 0.16 23
Barley grain, steam fl aked 85 90 100 70 100 12 39 5 7 20 30 2.1 3 0.06 0.35 0.6 0.18 0.16 23
Barley grain, steam rolled 86 84 92 61 87 12 38 5 7 20 27 2.1 3 0.06 0.41 0.6 0.18 0.17 30
Barley grain, 2-row 88 84 92 61 87 12 5 8 20 34 2.2 3 0.06 0.34 0.5 0.18 0.17 16
Barley grain, 6-row 87 84 92 61 87 11 6 8 20 34 2.2 3 0.05 0.36 0.5 0.18 0.15 14
Barley grain, lt. wt. (42-44 lbs./bu.) 88 78 83 54 80 13 30 9 12 30 34 2.3 4 0.04 0.38 0.5 0.18 0.14 14
Barley feed pearl byproduct 90 74 78 49 76 15 25 12 15 3.9 5 0.05 0.45 0.7 0.06
Barley bran 91 59 59 28 59 12 28 21 27 36 6 4.3 7
Barley grain screenings 89 71 74 46 73 12 9 11 2.6 4 0.35 0.33 0.9 0.15
Beans navy, cull 90 84 92 61 87 24 25 5 8 20 0 1.4 5 0.15 0.60 1.4 0.06 0.26 45
Beans pinto 90 75 79 50 77 25 25 5 6 7 0 1.5 5 0.14 0.43 1.1 0.06 0.22 25
Beet pulp, wet 17 77 82 53 79 9 35 20 25 45 30 0.7 5 0.65 0.08 0.9 0.40 0.22 21
Beet pulp, dried 91 76 81 52 78 9 44 21 26 46 33 0.7 5 0.65 0.08 0.9 0.40 0.22 21
Beet pulp, wet with molasses 24 77 82 53 79 11 25 16 21 39 33 0.6 6 0.60 0.10 1.8 0.42 11
Beet pulp, dried with molasses 92 77 82 53 79 11 34 17 23 40 33 0.6 6 0.60 0.10 1.8 0.42 11
Beet root (sugar) 23 80 86 56 83 4 5 7 16 0.4 3
Beet tops (sugar) 19 58 58 26 58 14 11 14 25 41 1.3 24 1.10 0.22 5.2 0.20 0.45 20
Beet top silage 25 52 52 16 51 12 12 2.0 32 1.38 0.22 5.7 0.57 20
Bermudagrass coastal, dehydrated 90 62 63 33 63 16 40 26 29 40 10 3.8 7 0.40 0.25 1.8 0.72 0.23 18
Bermudagrass coastal hay 89 56 56 23 56 10 15 30 36 73 98 2.1 6 0.47 0.21 1.5 0.70 0.22 16
Bermudagrass hay 89 53 53 18 53 10 15 29 37 72 98 1.9 8 0.46 0.20 1.5 0.70 0.25 31
Bermudagrass silage 26 50 50 12 49 10 14 28 35 71 48 1.9 8 0.46 0.20 1.5 0.72 0.25 31
Birdsfoot trefoil, fresh 22 66 68 38 67 21 20 21 31 47 41 4.4 9 1.78 0.25 2.6 0.25 31
Birdsfoot trefoil hay 89 57 57 25 57 16 22 31 38 50 92 2.2 8 1.73 0.24 1.8 0.25 28
Biuret 99 0 0 0 0 248 0 0 0 0 0 0.0 0 0.00 0.00 0.0 0.00 0.00 0
Blood meal, swine/poultry 91 66 68 38 67 92 82 1 2 10 0 1.4 3 0.32 0.28 0.2 0.30 0.70 22
Bluegrass KY, fresh, early-bloom 36 69 71 43 70 15 20 27 32 60 41 3.9 7 0.37 0.30 1.9 0.42 0.19 25
Bluegrass straw 93 45 45 3 44 6 40 50 78 90 1.1 6 0.20 0.10
Bluestem, fresh, mature 61 50 50 12 49 6 34 2.5 5 0.40 0.12 0.8 0.05 28
NutritionNutrition

20 beefmagazine.com March 2016
Nutrition
What is the value, then, of show-ing composition data for feeds? It is often difficult to determine actual composition in a timely way, and therefore, tabulated data are the next best source of information.
In using tabulated values, one can expect organic constituents (e.g., crude protein, ether extract and fiber) to vary as much as ±15%, mineral constituents to vary as
much as ±30% and energy values to vary up to ±10%. Thus, the val-ues shown can only serve as guides. That’s why they are called “typical values.”
They are not averages o f published information, however, since judgment was used in arriving at some of the values in the hope that these values will be more realistic for use in formulating
cattle and sheep diets.New crop varieties may result
in nutrient composition chang-es. Genetically modified crops may result in feeds with improved nu-trient content and availability, or decreased anti-nutrient factors. Changes in processing procedures can change the nutrient composi-tion of byproduct feeds.
Chemical vs. biological attributesFeeds can be chemically analyzed
for many things that may or may not be related to the response of animals when fed the feed. Thus, in the table, certain chemical constitu-ents are shown.
The response of cattle and sheep when fed a feed, however, can be termed the biological response to the feed that is a function of its chemical composition and the abil-ity of the animal to derive useful nutrient value from the feed.
The latter relates to the digest-ibility or availability of a nutrient in the feed for absorption into the body and its ultimate efficiency of use de-pending upon the nutrient status of the animal and the productive or physiological function being per-formed by the animal.
Thus, ground fence posts and shelled corn may have the same gross energy value but have mark-edly different useful energy value (TDN or net energy) when con-sumed by the animal.
Therefore, biological attributes of a feed have much greater mean-ing in predicting the productive re-sponse of animals, but are more difficult to precisely determine because there is an interaction between the feed’s chemical com-position and the animal’s digestive and metabolic capabilities.
Biological attributes of feeds are more laborious and costly to deter-mine, and are more variable than chemical constituents. They are generally more predictive, however, since they relate to the animal’s re-sponse to the feed or diet.
FOR MY LAND
IT’S RED BRAND.
The most trusted name in fencing since 1889.
Find a dealer near you at RedBrand.com
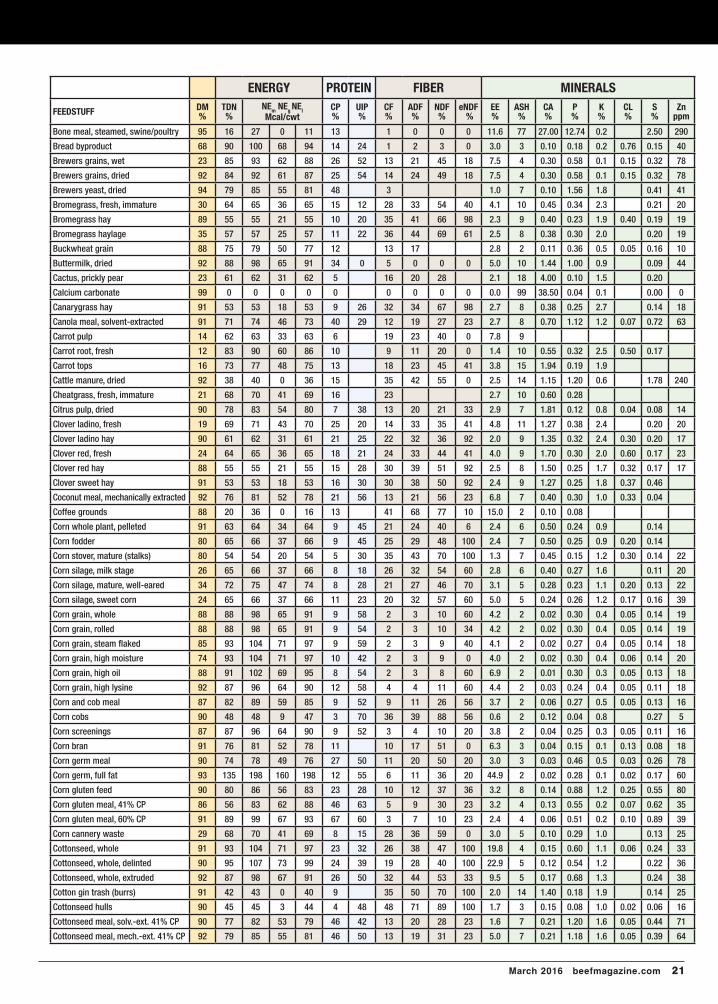
March 2016 beefmagazine.com 21
ENERGY PROTEIN FIBER MINERALS
FEEDSTUFFDM%
TDN%
NEm NE
g NE
l
Mcal/cwtCP%
UIP%
CF%
ADF%
NDF%
eNDF %
EE%
ASH%
CA%
P%
K%
CL%
S%
Znppm
Bone meal, steamed, swine/poultry 95 16 27 0 11 13 1 0 0 0 11.6 77 27.00 12.74 0.2 2.50 290
Bread byproduct 68 90 100 68 94 14 24 1 2 3 0 3.0 3 0.10 0.18 0.2 0.76 0.15 40
Brewers grains, wet 23 85 93 62 88 26 52 13 21 45 18 7.5 4 0.30 0.58 0.1 0.15 0.32 78
Brewers grains, dried 92 84 92 61 87 25 54 14 24 49 18 7.5 4 0.30 0.58 0.1 0.15 0.32 78
Brewers yeast, dried 94 79 85 55 81 48 3 1.0 7 0.10 1.56 1.8 0.41 41
Bromegrass, fresh, immature 30 64 65 36 65 15 12 28 33 54 40 4.1 10 0.45 0.34 2.3 0.21 20
Bromegrass hay 89 55 55 21 55 10 20 35 41 66 98 2.3 9 0.40 0.23 1.9 0.40 0.19 19
Bromegrass haylage 35 57 57 25 57 11 22 36 44 69 61 2.5 8 0.38 0.30 2.0 0.20 19
Buckwheat grain 88 75 79 50 77 12 13 17 2.8 2 0.11 0.36 0.5 0.05 0.16 10
Buttermilk, dried 92 88 98 65 91 34 0 5 0 0 0 5.0 10 1.44 1.00 0.9 0.09 44
Cactus, prickly pear 23 61 62 31 62 5 16 20 28 2.1 18 4.00 0.10 1.5 0.20
Calcium carbonate 99 0 0 0 0 0 0 0 0 0 0.0 99 38.50 0.04 0.1 0.00 0
Canarygrass hay 91 53 53 18 53 9 26 32 34 67 98 2.7 8 0.38 0.25 2.7 0.14 18
Canola meal, solvent-extracted 91 71 74 46 73 40 29 12 19 27 23 2.7 8 0.70 1.12 1.2 0.07 0.72 63
Carrot pulp 14 62 63 33 63 6 19 23 40 0 7.8 9
Carrot root, fresh 12 83 90 60 86 10 9 11 20 0 1.4 10 0.55 0.32 2.5 0.50 0.17
Carrot tops 16 73 77 48 75 13 18 23 45 41 3.8 15 1.94 0.19 1.9
Cattle manure, dried 92 38 40 0 36 15 35 42 55 0 2.5 14 1.15 1.20 0.6 1.78 240
Cheatgrass, fresh, immature 21 68 70 41 69 16 23 2.7 10 0.60 0.28
Citrus pulp, dried 90 78 83 54 80 7 38 13 20 21 33 2.9 7 1.81 0.12 0.8 0.04 0.08 14
Clover ladino, fresh 19 69 71 43 70 25 20 14 33 35 41 4.8 11 1.27 0.38 2.4 0.20 20
Clover ladino hay 90 61 62 31 61 21 25 22 32 36 92 2.0 9 1.35 0.32 2.4 0.30 0.20 17
Clover red, fresh 24 64 65 36 65 18 21 24 33 44 41 4.0 9 1.70 0.30 2.0 0.60 0.17 23
Clover red hay 88 55 55 21 55 15 28 30 39 51 92 2.5 8 1.50 0.25 1.7 0.32 0.17 17
Clover sweet hay 91 53 53 18 53 16 30 30 38 50 92 2.4 9 1.27 0.25 1.8 0.37 0.46
Coconut meal, mechanically extracted 92 76 81 52 78 21 56 13 21 56 23 6.8 7 0.40 0.30 1.0 0.33 0.04
Coffee grounds 88 20 36 0 16 13 41 68 77 10 15.0 2 0.10 0.08
Corn whole plant, pelleted 91 63 64 34 64 9 45 21 24 40 6 2.4 6 0.50 0.24 0.9 0.14
Corn fodder 80 65 66 37 66 9 45 25 29 48 100 2.4 7 0.50 0.25 0.9 0.20 0.14
Corn stover, mature (stalks) 80 54 54 20 54 5 30 35 43 70 100 1.3 7 0.45 0.15 1.2 0.30 0.14 22
Corn silage, milk stage 26 65 66 37 66 8 18 26 32 54 60 2.8 6 0.40 0.27 1.6 0.11 20
Corn silage, mature, well-eared 34 72 75 47 74 8 28 21 27 46 70 3.1 5 0.28 0.23 1.1 0.20 0.13 22
Corn silage, sweet corn 24 65 66 37 66 11 23 20 32 57 60 5.0 5 0.24 0.26 1.2 0.17 0.16 39
Corn grain, whole 88 88 98 65 91 9 58 2 3 10 60 4.2 2 0.02 0.30 0.4 0.05 0.14 19
Corn grain, rolled 88 88 98 65 91 9 54 2 3 10 34 4.2 2 0.02 0.30 0.4 0.05 0.14 19
Corn grain, steam fl aked 85 93 104 71 97 9 59 2 3 9 40 4.1 2 0.02 0.27 0.4 0.05 0.14 18
Corn grain, high moisture 74 93 104 71 97 10 42 2 3 9 0 4.0 2 0.02 0.30 0.4 0.06 0.14 20
Corn grain, high oil 88 91 102 69 95 8 54 2 3 8 60 6.9 2 0.01 0.30 0.3 0.05 0.13 18
Corn grain, high lysine 92 87 96 64 90 12 58 4 4 11 60 4.4 2 0.03 0.24 0.4 0.05 0.11 18
Corn and cob meal 87 82 89 59 85 9 52 9 11 26 56 3.7 2 0.06 0.27 0.5 0.05 0.13 16
Corn cobs 90 48 48 9 47 3 70 36 39 88 56 0.6 2 0.12 0.04 0.8 0.27 5
Corn screenings 87 87 96 64 90 9 52 3 4 10 20 3.8 2 0.04 0.25 0.3 0.05 0.11 16
Corn bran 91 76 81 52 78 11 10 17 51 0 6.3 3 0.04 0.15 0.1 0.13 0.08 18
Corn germ meal 90 74 78 49 76 27 50 11 20 50 20 3.0 3 0.03 0.46 0.5 0.03 0.26 78
Corn germ, full fat 93 135 198 160 198 12 55 6 11 36 20 44.9 2 0.02 0.28 0.1 0.02 0.17 60
Corn gluten feed 90 80 86 56 83 23 28 10 12 37 36 3.2 8 0.14 0.88 1.2 0.25 0.55 80
Corn gluten meal, 41% CP 86 56 83 62 88 46 63 5 9 30 23 3.2 4 0.13 0.55 0.2 0.07 0.62 35
Corn gluten meal, 60% CP 91 89 99 67 93 67 60 3 7 10 23 2.4 4 0.06 0.51 0.2 0.10 0.89 39
Corn cannery waste 29 68 70 41 69 8 15 28 36 59 0 3.0 5 0.10 0.29 1.0 0.13 25
Cottonseed, whole 91 93 104 71 97 23 32 26 38 47 100 19.8 4 0.15 0.60 1.1 0.06 0.24 33
Cottonseed, whole, delinted 90 95 107 73 99 24 39 19 28 40 100 22.9 5 0.12 0.54 1.2 0.22 36
Cottonseed, whole, extruded 92 87 98 67 91 26 50 32 44 53 33 9.5 5 0.17 0.68 1.3 0.24 38
Cotton gin trash (burrs) 91 42 43 0 40 9 35 50 70 100 2.0 14 1.40 0.18 1.9 0.14 25
Cottonseed hulls 90 45 45 3 44 4 48 48 71 89 100 1.7 3 0.15 0.08 1.0 0.02 0.06 16
Cottonseed meal, solv.-ext. 41% CP 90 77 82 53 79 46 42 13 20 28 23 1.6 7 0.21 1.20 1.6 0.05 0.44 71
Cottonseed meal, mech.-ext. 41% CP 92 79 85 55 81 46 50 13 19 31 23 5.0 7 0.21 1.18 1.6 0.05 0.39 64

22 beefmagazine.com March 2016
ENERGY PROTEIN FIBER MINERALS
FEEDSTUFFDM%
TDN%
NEm NE
g NE
l
Mcal/cwtCP%
UIP%
CF%
ADF%
NDF%
eNDF %
EE%
ASH%
CA%
P%
K%
CL%
S%
Znppm
Crab waste meal 91 29 37 0 30 32 65 11 13 3.0 43 15.00 1.88 0.5 1.63 0.27 107
Crambe meal, solvent-extracted 91 81 88 58 84 31 45 25 35 47 23 1.4 8 1.27 0.86 1.1 0.70 1.26 44
Crambe meal, mechanically extracted 92 88 98 65 91 28 50 24 33 42 25 17.0 7 1.22 0.78 1.0 0.65 1.18 41
Cranberry pulp meal 88 49 49 11 48 7 26 47 54 33 15.7 2
Crawfi sh waste meal 94 25 36 0 29 35 74 12 15 42 13.10 0.85
Curacao phosphate 99 0 0 0 0 0 0 0 0 0 0.0 95 34.00 15.00
Defl uorinated phosphate 99 0 0 0 0 0 0 0 0 0 0.0 95 32.60 18.07 1.0 100
Diammonium phosphate 98 0 0 0 0 115 0 0 0 0 0 0.0 35 0.52 20.41 0.0 2.16
Dicalcium phosphate 96 0 0 0 0 0 0 0 0 0 0.0 94 22.00 18.65 0.1 1.00 70
Distillers grain, barley 90 75 79 50 77 30 56 16 20 44 4 8.5 4 0.15 0.67 1.0 0.18 0.43 50
Distillers grain, corn, dry 91 95 107 73 99 30 58 8 16 44 4 9.5 4 0.09 0.75 0.9 0.14 0.70 65
Distillers grain, corn, wet 36 96 109 74 100 30 47 8 16 44 4 9.5 4 0.09 0.75 0.9 0.14 0.70 65
Distillers grain, corn with solubles 91 96 109 74 100 31 55 9 14 30 4 10.8 5 0.21 0.82 0.9 0.18 0.77 86Distillers grain, corn with solubles, low oil 90 92 103 70 96 31 55 10 15 31 4 7.4 5 0.22 0.81 0.9 0.19 0.78 88
Distillers dried solubles 93 87 96 64 91 32 40 4 7 22 4 13.0 8 0.35 1.20 1.8 0.28 1.10 91
Distillers corn stillage 7 92 103 70 96 22 55 8 10 21 0 8.1 5 0.14 0.72 0.2 0.60 60
Distillers grain, sorghum, dry 91 84 92 61 87 33 62 13 20 44 4 10.0 4 0.20 0.68 0.3 0.50 50
Distillers grain, sorghum, wet 35 86 95 63 89 33 55 13 19 43 4 10.0 4 0.20 0.68 0.3 0.50 50Distillers grain, sorghum with solubles 92 85 93 62 88 33 53 12 18 42 4 10.0 4 0.23 0.70 0.5 0.70 55
Elephant (Napier) grass hay, chopped 92 55 55 21 54 9 24 46 63 85 2.0 10 0.35 0.30 1.3 0.10
Fat, animal, poultry, vegetable 99 195 285 230 285 0 0 0 0 0 99.0 0 0.00 0.00 0.0
Feather meal, hydrolyzed 93 67 69 40 68 87 68 1 14 42 23 7.0 3 0.48 0.45 0.1 0.20 1.82 90
Fescue KY 31, fresh 29 64 65 36 65 15 20 25 32 64 40 5.5 9 0.48 0.37 2.5 0.18 22
Fescue KY 31 hay, early-bloom 88 60 60 30 60 18 22 25 31 64 98 6.6 8 0.48 0.36 2.6 0.27 24
Fescue KY 31 hay, mature 88 52 52 16 51 11 26 30 42 73 98 5.0 6 0.45 0.26 1.7 0.14 22
Fescue (red) straw 94 43 44 0 41 4 41 1.1 6 0.00 0.06
Fish meal 90 74 78 49 76 66 60 1 2 12 10 9.0 20 5.55 3.15 0.7 0.76 0.80 130
Flax seed hulls 91 38 40 0 36 9 32 39 50 98 1.5 10
Garbage municipal, cooked 23 80 86 56 83 16 9 50 59 30 20.0 10 1.20 0.43 0.6 0.67
Glycerol (glycerin) 88 90 100 68 94 0 0 0 0 0 0 0.0 6 4.00
Grain screenings 90 65 66 37 66 14 14 5.5 9 0.25 0.34 30
Grain dust 92 73 77 48 75 10 11 2.2 10 0.30 0.18 42
Grape pomace, stemless 91 40 42 0 38 12 45 32 46 54 34 7.6 9 0.55 0.07 0.6 0.01 24
Grass hay 88 58 58 26 58 10 30 33 41 63 98 3.0 6 0.60 0.21 2.0 0.20 28
Grass silage 30 61 62 31 61 11 24 32 39 60 61 3.4 8 0.70 0.24 2.1 0.22 29
Guar meal 90 72 75 47 74 39 34 16 3.9 5
Hominy feed 89 89 99 67 93 11 48 6 7 19 9 5.8 2 0.03 0.48 0.5 0.06 0.12 27
Hop leaves 37 49 49 11 48 15 15 3.6 35 2.80 0.64
Hop vine silage 30 53 53 18 53 15 21 24 3.1 20 3.30 0.37 1.8 0.22 44
Hops spent 89 35 39 0 33 23 26 30 4.6 7 1.60 0.60
Kelp, dried 91 32 38 0 29 7 7 10 0.5 39 2.72 0.31
Kenaf hay 92 48 48 9 47 10 31 44 56 98 2.9 12
Kochia, fresh 29 55 55 21 55 16 23 1.2 18 1.10 0.30
Kochia hay 90 53 53 18 53 14 27 1.7 14 1.00 0.20
Kudzu hay 90 54 54 20 54 16 33 2.6 7 3.00 0.23
Lespedeza, fresh, early-bloom 25 60 60 30 60 16 50 32 2.0 10 1.20 0.24 1.1 0.21
Lespedeza hay 92 54 54 20 54 14 60 30 3.0 7 1.10 0.22 1.0 0.19 29
Limestone, ground 98 0 0 0 0 0 0 0 0 0 0 0.0 98 34.00 0.02 0.03
Limestone dolomitic, ground 99 0 0 0 0 0 0 0 0 0 0 0.0 98 22.30 0.04 0.4
Linseed meal, solvent-extracted 91 77 82 53 79 39 36 10 17 26 23 1.9 7 0.43 0.91 1.5 0.04 0.52 65
Linseed meal, mechanically extracted 91 82 89 59 85 37 40 10 17 24 23 6.0 6 0.42 0.90 1.4 0.04 0.46 59
Meadow hay 90 50 50 12 49 7 23 33 44 70 98 2.5 9 0.61 0.18 1.6 0.17 24
Meat meal, swine/poultry 93 71 74 46 73 56 64 2 7 48 0 10.5 24 9.00 4.42 0.5 1.27 0.48 190
Meat and bone meal, swine/poultry 93 72 75 47 74 56 24 1 5 34 0 10.0 29 13.50 6.50
Milk, dry, skim 94 87 96 64 90 36 0 0 0 0 0 0.9 8 1.36 1.09 1.7 0.96 0.34 41
Mint slug silage 27 55 55 21 55 14 24 1.8 16 1.10 0.57
Nutrition

26 beefmagazine.com March 2016
Nutrition
Sources of table information Several sources of information
were used in arriving at the “typical values” shown in the table.
Where information was not avail-able, a reasonable estimate was made from similar feeds or stages of maturity, because it’s not too helpful to have a table with missing infor-mation.
Where zeros appear, the amount of that item is so small it can be con-sidered insignificant in practical diet formulation. Blanks indicate that the value is unknown.
Using the table informationFeed names. The most obvious
or commonly used feed names are used in the table. Feeds designated as “fresh” are feeds that are grazed or fed as fresh-cut materials.
Dry matter. Typical dry mat-ter (DM) values are shown, but the moisture content of feeds can vary greatly. Thus, DM content can be the biggest reason for variation in feed composition on an as-fed basis.
For this reason, chemical con-stituents and biological attributes of feeds in the table are on a DM basis. Since DM can vary greatly and since one of the factors regulating total feed intake is the DM content of feeds, diet formulation on a DM basis is preferred rather than using as-fed values. If one wants to con-
vert a value to an as-fed basis, mul-tiply the decimal equivalent of the DM content times the compositional value shown in the table.
Energy. The table lists four mea-sures of the energy value of feeds. TDN (total digestible nutrients) is shown because there are more deter-mined TDN values, and it’s been the standard system for expressing the energy value of feeds for cattle and sheep.
There are several technical prob-lems with TDN, however. For one, the digestibility of crude fiber (CF) may be higher than for nitrogen-free extract (NFE) in certain feeds due to the partition of lignin in the CF analysis. TDN also overestimates the energy value of roughages compared to concentrates in producing ani-mals. Some argue that since energy isn’t measured in pounds or percent, TDN isn’t a valid energy measure. This, however, is more a scientific argument than a criticism of TDN’s predictive value.
Digestible energy (DE) values are not included in the table. There is a fairly constant relationship between TDN and DE in cattle and sheep; DE (Mcal per cwt) can be calculated by multiplying the percent TDN content by 2. The ability of TDN and DE to predict animal performance is there-fore the same.
Interest in using net energy (NE) in feed evaluation was renewed with the development of the California net energy system. This is due to the improved predictability of the pro-ductive response of animals depend-ing on whether feed energy is being used for maintenance (NEm), growth (NEg) or lactation (NEl).
The major problem in using these NE values is predicting feed intake and thus the proportion of feed that will be used for maintenance and production. Some only use NEg, but this suffers the equal but opposite criticism mentioned for TDN; NEg will overestimate the feeding value of concentrates relative to roughages.
The average of the two NE
Since DM can
vary greatly and
since one of the
factors regulating
total feed intake
is the DM content
of feeds, diet
formulation on
a DM basis is
preferred rather
than using as-fed
values.
Extended-Release Injectable Parasiticide
5% Sterile Solution
NADA 141-327, Approved by FDA for subcutaneous injection
For the Treatment and Control of Internal and External
Parasites of Cattle on Pasture with Persistent Effectiveness
CAUTION: Federal law restricts this drug to use by or on the order of a licensed veterinarian.INDICATIONS FOR USELONGRANGE, when administered at the recommended dose volume of 1 mL per 110 lb (50
kg) body weight, is effective in the treatment and control of 20 species and stages of internal
and external parasites of cattle:
DOSAGE AND ADMINISTRATIONLONGRANGE® (eprinomectin) should be given only by subcutaneous injection in front of the
shoulder at the recommended dosage level of 1 mg eprinomectin per kg body weight (1 mL
per 110 lb body weight).
WARNINGS AND PRECAUTIONSWithdrawal Periods and Residue Warnings
Animals intended for human consumption must not be slaughtered within 48
days of the last treatment.
This drug product is not approved for use in female dairy cattle 20 months of age or
older, including dry dairy cows. Use in these cattle may cause drug residues in milk
and/or in calves born to these cows.
A withdrawal period has not been established for pre-ruminating calves. Do not use
in calves to be processed for veal.
Animal Safety Warnings and PrecautionsThe product is likely to cause tissue damage at the site of injection, including possible
granulomas and necrosis. These reactions have disappeared without treatment. Local tissue
reaction may result in trim loss of edible tissue at slaughter.
Observe cattle for injection site reactions. If injection site reactions are suspected, consult your
veterinarian. This product is not for intravenous or intramuscular use. Protect product from
light. LONGRANGE® (eprinomectin) has been developed specifically for use in cattle only. This
product should not be used in other animal species.
When to Treat Cattle with GrubsLONGRANGE effectively controls all stages of cattle grubs. However, proper timing of treatment
is important. For the most effective results, cattle should be treated as soon as possible after
the end of the heel fly (warble fly) season.
Environmental HazardsNot for use in cattle managed in feedlots or under intensive rotational grazing because the
environmental impact has not been evaluated for these scenarios.
Other Warnings: Underdosing and/or subtherapeutic concentrations of extended-release
anthelmintic products may encourage the development of parasite resistance. It is
recommended that parasite resistance be monitored following the use of any anthelmintic
with the use of a fecal egg count reduction test program.
TARGET ANIMAL SAFETYClinical studies have demonstrated the wide margin of safety of LONGRANGE® (eprinomectin).
Overdosing at 3 to 5 times the recommended dose resulted in a statistically significant
reduction in average weight gain when compared to the group tested at label dose.
Treatment-related lesions observed in most cattle administered the product included
swelling, hyperemia, or necrosis in the subcutaneous tissue of the skin. The administration
of LONGRANGE at 3 times the recommended therapeutic dose had no adverse reproductive
effects on beef cows at all stages of breeding or pregnancy or on their calves.
Not for use in bulls, as reproductive safety testing has not been conducted in males intended
for breeding or actively breeding. Not for use in calves less than 3 months of age because
safety testing has not been conducted in calves less than 3 months of age.
STORAGEStore at 77° F (25° C) with excursions between 59° and 86° F (15° and 30° C). Protect
from light.
Made in Canada.
Manufactured for Merial, Inc., Duluth, GA, USA.
®The Cattle Head Logo and ®LONGRANGE
are registered trademarks of Merial, Inc.
©2015 Merial, Inc. All rights reserved.
1050-2889-06, Rev. 2/2015, 8LON016C
Gastrointestinal Roundworms LungwormsBunostomum phlebotomum – Adults and L4 Dictyocaulus viviparus – Adults
Cooperia oncophora – Adults and L4
Cooperia punctata – Adults and L4
Cooperia surnabada – Adults and L4
Haemonchus placei – Adults GrubsOesophagostomum radiatum – Adults Hypoderma bovis
Ostertagia lyrata – Adults
Ostertagia ostertagi – Adults, L4, and inhibited L4
Trichostrongylus axei – Adults and L4 MitesTrichostrongylus colubriformis – Adults Sarcoptes scabiei var. bovis
Parasites Durations of Persistent Effectiveness
Gastrointestinal RoundwormsBunostomum phlebotomum 150 days
Cooperia oncophora 100 days
Cooperia punctata 100 days
Haemonchus placei 120 days
Oesophagostomum radiatum 120 days
Ostertagia lyrata 120 days
Ostertagia ostertagi 120 days
Trichostrongylus axei 100 days
LungwormsDictyocaulus viviparus 150 days
Advertisement

28 beefmagazine.com March 2016
Nutrition
values can be used, but this would be true only for cattle and sheep eat-ing twice their maintenance energy requirement. The most accurate way to use these NE values to formulate diets is to use the NEm value plus a multiplier times the NEg value, all divided by 1 plus the multiplier. The multiplier is the level of feed intake relative to maintenance.
For example, if 700-pound cat-tle are expected to eat 18 pounds of DM, 8 pounds of which will be re-quired for maintenance, the diet’s NE value would be:NE = [NEm + (10/8)(NEg)] / [1 + (10/8)]
In deciding the energy system to use, there is no question about NE’s theoretical superiority over TDN in predicting animal performance. But this superiority is less if only NEg is used to formulate diets. If NE is used, some combination of NEm and NEg is more accurate. NEl values are also shown but few have actu-ally been determined. NEl values
are similar to NEm values except for very high and low energy feeds.
Distillers grains from the ethanol industry continue to be a large variable in the feeding of animals — not only in terms of the large and perhaps variable amount of this byproduct available for feeding, but also its variable nutrient composition.
Nutrient variation depends upon the efficiency of a given ethanol plant in converting corn starch into ethanol, the drying conditions for the resulting distillers grain and its effect on protein unavailability (UIP), and recently, the amount of corn oil (fat) that is removed during processing the grain.
Research from South Dakota State University indicates that for every 1% decrease in the percent fat value for distillers grain, 2 Mcal of NEg per cwt should be subtracted from a table NEg value for distillers grain.
Protein. Crude protein (CP) val-ues are shown, which are Kjeldahl nitrogen times 100/16, or 6.25, since proteins contain an average of 16% nitrogen. CP does not give any in-formation about the actual protein (amino acid) and non-protein nitro-gen (NPN) content of a feed.
Digestible protein (DP) has been included in many feed composition tables. However, because of the con-tribution of microbial and body pro-tein to the protein in feces, DP is more misleading than CP. One can estimate DP from the CP content of the diet fed to cattle or sheep by the following equation:
%DP = 0.9(%CP) − 3where %DP and %CP are the diet
values on a DM basis.Undegradable intake protein (UIP,
rumen “bypass” or escape protein) values are shown. This value repre-sents the percent of the CP passing through the rumen without degrada-tion by rumen microorganisms.
2015
The Progressive Agriculture Foundation spends
$12 per child to support and train
coordinators, insure participants and
provide curriculum for each Safety Day.
Please support Amy, along with more than 450 Safety Day coordinators, as they provide education
and training to children in agricultural
communities.
3 easy ways to make a tax-deductible donation:
• text “AmyR” to 71777, • call (888) 257-3529
• www.progressiveag.org/donate
Amy Rademaker, Progressive Agriculture Safety Day® Coordinator, Tolono, IL
Every 3 Days a Child Dies in an Ag-Related Incident. I can help change that ... So can you!
Penton Agriculture, the parent company of this magazine, is proud to support Progressive Agriculture Safety Day® program
Amy RademSafety D
I have heard many kids say, “I had no clue that was so dangerous.” I hear that about
all the topics. If what we are teaching saves one life, that’s enough.
The reason I coordinate Progressive Agriculture Safety Days hit home when an 8 year old died in a gravity wagon while visiting her grandparents in our area. A friend of the
family called to learn more about our programs, including Safety Days.
I explained the work I do and the lady said “Thank God for what you do. No one deserves to go through what this family is going through.”

March 2016 beefmagazine.com 29
ENERGY PROTEIN FIBER MINERALS
FEEDSTUFFDM%
TDN%
NEm NE
g NE
l
Mcal/cwtCP%
UIP%
CF%
ADF%
NDF%
eNDF %
EE%
ASH%
CA%
P%
K%
CL%
S%
Znppm
Molasses beet 77 75 79 50 77 8 0 0 0 0 0 0.2 12 0.14 0.03 6.0 1.64 0.60 18
Molasses cane 77 74 78 49 76 6 0 0 0 0 0 0.5 14 0.95 0.09 4.2 2.30 0.68 15
Molasses cane, dried 94 74 78 49 76 9 0 2 3 7 0 0.3 14 1.10 0.15 3.6 3.00 30Molasses, condensed fermentation solubles 43 69 71 43 70 16 0 0 0 0 0 1.0 26 2.12 0.14 7.5 2.73 0.93 30
Molasses citrus 65 75 79 50 77 9 0 0 0 0 0 0.3 8 1.84 0.15 0.2 0.11 0.23 137
Molasses wood, hemicellulose 61 70 73 44 71 1 0 1 2 4 0 0.6 7 1.10 0.10 0.1 0.05
Monoammonium phosphate 98 0 0 0 0 70 0 0 0 0 0 0.0 24 0.30 24.70 0.0 1.42 81
Mono-dicalcium phosphate 97 0 0 0 0 0 0 0 0 0 0.0 94 16.70 21.10 0.1 1.20 70
Oat hay 90 54 54 20 54 10 25 31 39 63 98 2.3 8 0.40 0.27 1.6 0.42 0.21 28
Oat silage 35 60 60 30 60 12 21 31 39 59 61 3.2 10 0.34 0.30 2.4 0.50 0.25 27
Oat straw 91 48 48 9 47 4 40 41 48 73 98 2.3 8 0.24 0.07 2.5 0.78 0.22 6
Oat grain 89 76 81 52 78 13 18 11 15 28 34 5.0 4 0.05 0.41 0.5 0.11 0.20 40
Oat grain, steam fl aked 84 88 98 65 91 13 26 11 15 30 32 4.9 4 0.05 0.37 0.5 0.11 0.20 40
Oat groats 91 91 102 69 95 18 15 3 6.6 2 0.08 0.47 0.4 0.10 0.20
Oat middlings 90 91 102 69 95 16 20 4 6 6.0 3 0.07 0.48 0.5 0.23
Oat mill byproduct 89 33 38 0 30 7 27 37 2.4 6 0.13 0.22 0.6 0.24
Oat hulls 93 38 40 0 36 4 25 33 41 75 90 1.6 7 0.16 0.15 0.6 0.08 0.14 31
Orange pulp, dried 89 79 85 55 81 9 9 16 20 33 1.8 4 0.71 0.11 0.6 0.05
Orchardgrass, fresh, early-bloom 24 65 66 37 66 14 23 30 32 54 41 4.0 9 0.33 0.39 2.7 0.08 0.20 21
Orchardgrass hay 88 59 59 28 59 10 27 34 40 67 98 3.3 8 0.32 0.30 2.6 0.41 0.20 26
Pea vine hay 89 59 59 28 59 11 32 50 62 92 2.0 7 1.25 0.24 1.3 0.20 20
Pea vine silage 25 58 58 26 58 16 29 44 55 61 3.3 8 1.25 0.28 1.6 0.29 32
Pea vine straw 89 51 51 14 50 7 41 49 72 98 1.4 7 0.75 0.13 1.1 0.15
Peas, cull 88 85 93 62 88 23 22 7 9 12 0 1.4 4 0.14 0.46 1.1 0.06 0.26 30
Peanut hulls 91 22 36 0 18 7 63 65 74 98 1.5 5 0.20 0.07 0.9
Peanut meal, solvent-extracted 91 77 82 53 79 51 27 9 16 27 23 2.5 6 0.26 0.62 1.1 0.03 0.30 38
Peanut skins 92 0 0 0 0 17 13 20 28 0 22.0 3 0.19 0.20
Pearl millet grain 87 82 89 59 85 13 2 6 18 34 4.5 3 0.03 0.36 0.5
Pineapple greenchop 17 47 47 7 46 8 24 35 64 41 2.4 7 0.28 0.08
Pineapple bran 89 71 74 46 73 5 20 33 66 20 1.5 3 0.26 0.12
Pineapple presscake 21 71 74 46 73 5 24 35 69 20 0.8 3 0.25 0.09
Potato vine silage 15 59 59 28 59 15 26 3.7 19 2.10 0.29 4.0 0.37
Potatoes, cull 21 80 86 56 83 10 0 2 3 4 0 0.4 5 0.03 0.24 2.2 0.30 0.09
Potato waste, wet 14 82 89 59 85 7 0 9 11 18 0 1.5 3 0.16 0.25 1.2 0.36 0.11 12
Potato waste, dried 89 85 93 62 88 8 0 7 9 15 0 0.5 5 0.16 0.25 1.2 0.39 0.11 12
Potato waste, wet with lime 17 80 86 56 83 5 0 10 12 16 0 0.3 9 4.20 0.18
Potato waste fi lter cake 14 77 82 53 79 5 0 2 7.7 3 0.10 0.19 0.2
Poultry byproduct meal 93 79 85 55 81 62 49 2 14.5 17 4.00 2.25 0.5 0.58 0.56 129
Poultry manure, dried 89 38 40 0 36 28 22 13 15 35 0 2.1 33 10.20 2.80 2.3 1.05 0.20 520
Prairie hay 91 50 50 12 49 7 30 34 47 67 98 2.0 8 0.40 0.15 1.1 0.06 0.06 34
Pumpkins, cull 11 80 86 56 83 15 14 21 30 0 8.9 9 0.24 0.43 3.3
Rice straw 91 40 42 0 38 4 38 47 72 100 1.4 13 0.23 0.08 1.2 0.11
Rice straw, ammoniated 87 45 45 3 44 9 39 53 68 100 1.3 12 0.25 0.08 1.1 0.11
Rice grain 89 79 85 55 81 8 30 10 12 16 34 1.9 5 0.07 0.32 0.4 0.09 0.05 17
Rice polishings 90 90 100 68 94 14 4 5 14.0 9 0.05 1.34 1.2 0.12 0.19 28
Rice bran 91 71 74 46 73 14 30 13 18 24 0 16.0 11 0.07 1.70 1.8 0.09 0.19 40
Rice hulls 92 13 35 0 8 3 45 44 70 81 90 0.9 20 0.12 0.07 0.5 0.08 0.08 24
Rice mill, byproduct 91 39 41 0 37 7 32 50 60 0 5.7 19 0.25 0.48 2.2 0.30 31
Ryegrass hay 90 58 58 26 58 10 30 33 38 65 98 3.3 8 0.45 0.30 2.2 0.18 27
Ryegrass silage 32 59 59 28 59 14 25 22 37 59 61 3.3 8 0.43 0.38 2.9 0.73 0.23 29
Rye straw 89 44 44 1 43 4 44 55 71 100 1.5 6 0.24 0.09 1.0 0.24 0.11
Rye grain 89 80 86 56 83 14 20 3 9 19 34 2.5 3 0.07 0.55 0.5 0.03 0.17 33
Saffl ower meal, solvent-extracted 91 56 56 23 56 24 33 41 57 36 1.3 6 0.35 0.79 0.9 0.21 0.23 65
Saffl ower meal dehulled, solv.-ext. 91 75 79 50 77 47 11 20 27 30 0.8 7 0.38 1.50 1.2 0.18 0.22 36
Saffl ower hulls 91 14 35 0 34 4 58 73 90 100 3.7 2
Sagebrush, fresh 50 50 50 12 49 13 25 30 38 9.2 10 1.00 0.25 0.22
Sanfoin hay 89 60 60 30 60 14 65 25 36 48 92 2.6 9 1.37 0.31

30 beefmagazine.com March 2016
Degradable intake protein (DIP) is the percent of the CP that is de-graded in the rumen and is equal to 100 minus UIP. Like other bio-logical attributes, these values are not constant. UIP values on many feeds have not been determined and reasonable estimates are difficult to make.
How should these values be used to improve the predictability of ani-
mal performance when fed various diets?
Generally, DIP can supply CP up to 7% of the diet. If the required CP in the diet exceeds 7% of the DM, all CP above this amount should be UIP.
In other words, if the final diet is to contain 13% CP, 6 of the 13 percentage units, or 46% of the CP, should be UIP. Once the relation-
ship between UIP and DIP has been better quantified, CP requirements may be lowered especially at higher CP levels. For diets high in rumen fermentable carbohydrate, DIP re-quirements may determine the total CP required in the diet.
Crude, acid detergent and neutral detergent fiber. After more than 150 years, crude fiber (CF) is declining in use as a mea-sure of poorly digested carbohy-drates in feeds. The major problem with CF is that variable amounts of lignin, which isn’t digestible, are re-moved in the CF procedure.
In the old scheme, the remaining carbohydrates (nitrogen-free extract or NFE) were thought to be more digestible than CF, despite many feeds having higher CF digestibility than NFE. One reason CF remained in the analytical scheme was its ap-parent requirement for the TDN calculation.
Improved analytical procedures for fiber have been developed, namely acid detergent fiber (ADF) and neutral detergent fiber (NDF). ADF is related to feed digestibility, and NDF is somewhat related to voluntary intake and the availabil-ity of net energy.
Both of these measures relate more directly to predicted animal performance and thus are more valuable than CF. Lignification of NDF alters the availability of the surface area to fiber-digesting rumen microorganisms.
Effective NDF (eNDF) has been used to better describe the dietary fiber function in high-concentrate, feedlot-type diets. While eNDF is defined as the percent of NDF that is retained on a screen similar in size to particles that will pass from the rumen, this value is further modified based on feed density and degree of hydration.
Rumen pH is correlated with di-etary eNDF when diets contain less than 26% eNDF. Thus, when formu-lating high-concentrate diets, the inclusion of eNDF may help in
Call for more information! 620.225.1142 www.rotomix.com
Blend Uniform Rations
Model 625 Vertical Mixer
• Twin Augers• 620 cu. ft. capacity• 104" load height
Producers from Cow/Calf and Stockers to Commercial Feeders rely on Roto-Mix for the right feed mixer to fit their operation.
Nutrition

32 beefmagazine.com March 2016
preventing acidosis in the rumen. In feedlot diets, the recommended eNDF levels range from 5% to 20%, depending on bunk management, inclusion of ionophores, digestion of NDF and microbial protein synthesis in the rumen.
Estimated eNDF values are shown for many feeds. These should be decreased depending on the de-gree of feed processing (e.g., chop-ping, grinding, pelleting, flaking) and hydration (fresh forage, silages, high-moisture grains) if these feed forms are not specified in the table.
Ether extract. Ether extract (EE) shows the crude fat content of the feed.
Minerals. Values are shown for only certain minerals. Ash is the total mineral content of a feed. Calcium (Ca) and phosphorus (P) are important minerals to con-sider in most feeding situations. Potassium (K) is more important as the concentrate level increases and when NPN is substituted for intact protein in the diet.
Sulfur (S) also becomes more important as the NPN level in-creases in the diet. High dietary S levels compounded by high S levels in drinking water, however, can be detrimental. Zinc (Zn) is shown be-cause it is less variable and is more generally near a deficient level in cattle and sheep diets. Chlorine (Cl) is of increasing interest for its role in dietary acid-base relationships.
The mineral level in the soil on which the feeds are grown or other environmental factors pre-clude showing a single value for many of the trace minerals in feeds. Iodine and selenium are required nutrients that may be deficient in many diets, yet their level in a feed is more related to the conditions under which the feed is grown than to a characteristic of the feed itself. Trace mineralized salt and trace mineral premixes are generally used to supplement trace minerals; their use is encouraged where defi-ciencies exist.
Vitamins. Vitamins are not in-cluded in the table. The only vita-min of general practical importance in cattle and sheep feeding is the vi-tamin A value (vitamin A and caro-tene) in feeds. This depends largely on maturity and conditions at har-vest, and the length and conditions during storage. Thus, it is probably unwise to rely entirely on harvested feeds as a source of vitamin A value.
Where roughages are fed that contain good green color or are being fed as immature, fresh for-ages (e.g., pasture), there will prob-ably be sufficient vitamin A value to meet animal requirements. Other vitamins, if required, should be sup-plied as supplements.
Future table revisionsA feed composition table is of
value only if it’s relatively complete, contains feeds commonly fed and the data are constantly updated. Suggestions and compositional data are welcomed to keep this table use-ful to the cattle and sheep industry. When sending compositional data, adequately describe the feed, indi-cating the DM or moisture content, and if the analytical values are on an as-fed or DM basis. If more than one sample was analyzed, the num-ber of samples analyzed should be indicated.
Editor’s note: Since 1957, R.L. Preston has taught and conduct-ed animal nutrition research in the areas of protein, minerals, growth and body composition. He has also conducted cattle feeding research on the energy value of feeds, growth en-hancers and nutrition management.
Preston was a member of the NRC Committee on Animal Nutrition and president of the American Society of Animal Science. He retired as emeritus professor from Texas Tech University, where he was a Horn Distinguished Professor and held the Thornton Endowed Chair. Preston’s address is 3263 Spyglass Drive, Bellingham, WA 98226-4178.
Brief Summary for use in Cattle: See Package Insert for full Prescribing Information
Antibiotic100 mg of tulathromycin/mLFor use in beef cattle (including suckling calves), non-lactating dairy cattle (including dairy calves), veal calves, and swine. Not for use in female dairy cattle 20 months of age or older.CAUTION: Federal (USA) law restricts this drug to use by or on the order of a licensed veterinarian.DESCRIPTIONDRAXXIN Injectable Solution is a ready-to-use sterile parenteral preparation containing tulathromycin, a semi-synthetic macrolide antibiotic of the subclass triamilide. Each mL of DRAXXIN contains 100 mg of tulathromycin as the free base in a 50% propylene glycol vehicle, monothioglycerol (5 mg/mL), with citric and hydrochloric acids added to adjust pH.DRAXXIN consists of an equilibrated mixture of two isomeric forms of tulathromycin in a 9:1 ratio. The chemical names of the isomers are (2R,3S,4R,5R,8R,10R, 11R,12S,13S,14R)-13-[[2,6-dideoxy-3-C-methyl-3-V-meth-yl-4-C-[(propylamino) methyl]-_-L-ribo-hexopyrano-syl]oxy]-2-ethyl-3,4,10-trihydroxy-3,5,8,10,12,14-hexamethyl-11- [[3,4,6-trideoxy-3-(dimethylamino)-`-D-xylo-hexopyrano-syl]-oxy]-1-oxa-6-azacyclopentadecan-15-one and (2R,3R,6R, 8R,9R,10S,11S,12R)-11-[[2,6-dideoxy-3-C-methyl-3-V-methyl-4-C-[(propylamino)methyl]-_-L-ribo-hexopyrano-syl]oxy]-2-[(1R,2R)-1,2-dihydroxy-1-methylbutyl]-8-hydroxy- 3,6,8,10,12-pentamethyl- 9-[[3,4,6-trideoxy-3-(dimethylamino)- `-D-xylo-hexopyranosyl]oxy]-1-oxa-4-azacyclotridecan-13-one, respectively.INDICATIONSBeef and Non-Lactating Dairy CattleBRD – DRAXXIN Injectable Solution is indicated for the treatment of bovine respiratory disease (BRD) associated with Mannheimia haemolytica, Pasteurella multocida, Histophilus somni, and Mycoplasma bovis; and for the control of respiratory disease in cattle at high risk of developing BRD associated with Mannheimia haemolytica, Pasteurella multocida, Histophilus somni, and Mycoplasma bovis.IBK – DRAXXIN Injectable Solution is indicated for the treatment of infectious bovine keratoconjunctivitis (IBK) associated with Moraxella bovis.Foot Rot – DRAXXIN Injectable Solution is indicated for the treat-ment of bovine foot rot (interdigital necrobacillosis) associated with Fusobacterium necrophorum and Porphyromonas levii.Suckling Calves, Dairy Calves, and Veal CalvesBRD - DRAXXIN Injectable Solution is indicated for the treatment of BRD associated with M. haemolytica, P. multocida, H. somni, and M. bovis.DOSAGE AND ADMINISTRATIONCattleInject subcutaneously as a single dose in the neck at a dosage of 2.5 mg/kg (1.1 mL/100 lb) body weight (BW). Do not inject more than 10 mL per injection site.Table 1. DRAXXIN Cattle Dosing Guide Animal Weight Dose Volume (Pounds) (mL) 100 1.1 200 2.3 300 3.4 400 4.5 500 5.7 600 6.8 700 8.0 800 9.1 900 10.2 1000 11.4
CONTRAINDICATIONSThe use of DRAXXIN Injectable Solution is contraindicated in animals previously found to be hypersensitive to the drug.WARNINGSFOR USE IN ANIMALS ONLY.NOT FOR HUMAN USE.KEEP OUT OF REACH OF CHILDREN.NOT FOR USE IN CHICKENS OR TURKEYS.
RESIDUE WARNINGSCattleCattle intended for human consumption must not be slaughtered within 18 days from the last treatment. Do not use in female dairy cattle 20 months of age or older.
PRECAUTIONSCattleThe effects of DRAXXIN on bovine reproductive performance, pregnancy, and lactation have not been determined. Subcutaneous injection can cause a transient local tissue reaction that may result in trim loss of edible tissue at slaughter.ADVERSE REACTIONSCattleIn one BRD field study, two calves treated with DRAXXIN at 2.5 mg/kg BW exhibited transient hypersalivation. One of these calves also exhibited transient dyspnea, which may have been related to pneumonia.NADA 141-244, Approved by FDATo report a suspected adverse reaction or to request a safety data sheet call 1-888-963-8471. For additional information about adverse drug experience reporting for animal drugs, contact FDA at 1-888-FDA-VETS or online at http://www.fda.gov/AnimalVeterinary/SafetyHealth.
For additional DRAXXIN product information call: 1-888-DRAXXIN or go to www.DRAXXIN.com
032908ZOMade in Brazil Revised: February 2014
®
(tulathromycin) Injectable Solution
Distributed by:Zoetis Inc. Kalamazoo, MI 49007
AdvertisementNutrition

34 beefmagazine.com March 2016
ENERGY PROTEIN FIBER MINERALS
FEEDSTUFFDM%
TDN%
NEm NE
g NE
l
Mcal/cwtCP%
UIP%
CF%
ADF%
NDF%
eNDF %
EE%
ASH%
CA%
P%
K%
CL%
S%
Znppm
Shrimp waste meal 90 48 48 9 47 50 60 11 5.5 25 8.50 1.75 1.15
Sodium tripolyphosphate 96 0 0 0 0 0 0 0 0 0 0.0 96 0.00 25.98 0.0 0.00
Sorghum stover 87 54 54 20 54 5 33 41 65 100 1.8 10 0.50 0.12 1.2
Sorghum silage 32 59 59 28 59 9 25 27 38 59 70 2.7 6 0.48 0.21 1.7 0.45 0.11 30
Sorghum grain (milo), ground 89 82 89 59 85 11 55 3 7 17 5 3.1 2 0.03 0.32 0.4 0.10 0.12 17
Sorghum grain (milo), fl aked 82 90 100 68 94 11 62 3 7 17 38 3.1 2 0.03 0.28 0.4 0.10 0.12 17
Soybean hay 89 52 52 16 51 16 33 40 55 92 3.5 8 1.28 0.29 1.0 0.15 0.24 24
Soybean straw 88 42 43 0 40 5 44 54 70 100 1.4 6 1.59 0.06 0.6 0.26
Soybeans whole 88 92 103 70 96 41 28 8 11 15 100 18.8 5 0.27 0.64 1.9 0.03 0.34 56
Soybeans whole, extruded 88 93 104 71 97 40 35 9 11 15 100 18.8 5 0.27 0.64 2.0 0.03 0.34 56
Soybeans whole, roasted 88 93 104 71 97 40 48 9 11 15 100 18.8 5 0.27 0.64 2.0 0.03 0.34 56
Soybean hulls 89 74 78 49 76 12 25 40 51 65 28 1.7 5 0.55 0.20 1.3 0.02 0.11 30
Soybean meal, solv.-ext. 44% CP 89 84 92 61 87 49 35 7 10 15 23 1.5 7 0.36 0.70 2.2 0.07 0.41 62
Soybean meal, solv.-ext. 49% CP 89 87 96 64 90 54 33 4 6 10 23 1.1 7 0.35 0.75 2.3 0.08 0.47 61
Soybean mill feed 90 50 50 12 49 15 36 46 1.9 6 0.46 0.19 1.7 0.07
Spelt grain 88 75 79 50 77 13 27 10 17 21 34 2.1 4 0.04 0.40 0.4 0.15 47
Sudangrass, fresh, immature 18 70 73 44 71 17 23 29 55 41 3.9 9 0.46 0.36 2.0 0.11 24
Sudangrass hay 88 57 57 25 57 9 30 36 43 67 98 1.8 10 0.50 0.22 2.2 0.80 0.12 26
Sudangrass silage 31 58 58 26 58 10 28 30 42 64 61 3.1 10 0.58 0.27 2.4 0.52 0.14 29
Sunfl ower meal, solvent-extracted 91 64 65 36 65 39 27 20 22 36 23 2.0 7 0.42 1.00 1.1 0.15 0.37 70
Sunfl ower meal with hulls 91 57 57 25 57 32 32 27 33 45 37 1.9 7 0.39 1.01 1.1 0.31 80
Sunfl ower seed hulls 90 40 42 0 38 4 65 52 63 73 90 2.2 3 0.00 0.11 0.2 0.19 200
Sugarcane bagasse 91 39 41 0 37 1 49 60 86 100 0.6 4 0.90 0.29 0.5 0.10
Tapioca meal, cassava byproduct 89 82 89 59 85 1 5 8 34 0.8 3 0.03 0.05
Timothy, fresh, prebloom 26 64 65 36 65 11 20 31 36 59 41 3.8 7 0.40 0.28 1.9 0.57 0.15 28
Timothy hay, early-bloom 88 59 59 28 59 11 22 32 39 63 98 2.7 6 0.58 0.26 1.9 0.51 0.21 30
Timothy hay, full-bloom 88 57 57 25 57 8 25 34 40 65 98 2.6 5 0.43 0.20 1.8 0.62 0.13 25
Timothy silage 34 59 59 28 59 10 23 34 45 70 61 3.4 7 0.50 0.27 1.7 0.15
Tomatoes 6 69 71 43 70 16 9 11 4.0 6 0.14 0.35 4.2
Tomato pomace, dried 92 64 65 36 65 23 26 50 55 34 10.6 6 0.43 0.59 3.6
Triticale hay 90 56 56 23 56 10 34 41 69 98 0.30 0.26 2.3 25
Triticale silage 34 58 58 26 58 14 30 39 56 61 3.6 0.58 0.34 2.7 0.28 36
Triticale grain 89 85 93 62 88 14 25 4 5 22 34 2.4 2 0.07 0.39 0.5 0.17 37
Turnip tops (purple) 18 68 70 41 69 18 10 13 2.6 14 3.10 0.40 3.0 1.80 0.27
Turnip roots 9 86 95 63 89 12 0 11 34 44 40 1.6 9 0.65 0.31 3.1 0.65 0.43 40
Urea, 46% N 99 0 0 0 0 288 0 0 0 0 0 0.0 0 0.00 0.00 0.0 0.00 0.00 0
Vetch hay 89 58 58 26 58 18 14 30 33 48 92 1.8 8 1.25 0.34 2.4 0.13
Wheat, fresh, pasture 21 71 74 46 73 20 16 18 30 50 41 4.0 13 0.35 0.36 3.1 0.67 0.22
Wheat hay 90 57 57 25 57 9 25 29 38 66 98 2.0 8 0.21 0.22 1.4 0.50 0.19 23
Wheat silage 33 59 59 28 59 12 21 28 37 62 61 3.2 8 0.40 0.28 2.1 0.50 0.21 27
Wheat straw 91 43 44 0 41 3 60 43 57 81 98 1.8 8 0.17 0.06 1.3 0.32 0.17 6
Wheat straw, ammoniated 85 50 50 12 49 9 25 40 55 76 98 1.5 9 0.15 0.05 1.3 0.30 0.16 6
Wheat grain 89 88 98 65 91 15 23 3 4 14 0 2.8 2 0.06 0.48 0.5 0.09 0.18 48
Wheat grain, hard 89 88 98 65 91 14 28 3 6 14 0 2.0 2 0.05 0.43 0.5 0.16 45
Wheat grain, soft 89 88 98 65 91 12 23 3 6 12 0 2.0 2 0.05 0.41 0.4 0.16 40
Wheat grain, steam fl aked 85 91 102 69 95 14 29 3 4 12 0 2.3 2 0.05 0.39 0.4 0.15 40
Wheat grain, sprouted 86 88 98 65 91 12 18 3 4 13 0 2.0 2 0.04 0.36 0.4 0.17 45
Wheat bran 89 70 73 44 71 17 28 11 14 46 4 4.4 7 0.13 1.32 1.4 0.05 0.24 96
Wheat middlings 89 75 79 50 77 17 22 9 11 38 2 4.7 5 0.14 1.02 1.2 0.05 0.20 100
Wheat mill run 90 76 81 52 78 17 28 9 12 37 0 4.5 6 0.11 1.10 1.2 0.07 0.22 90
Wheat shorts 89 78 83 54 80 19 25 8 10 30 0 5.3 5 0.10 0.93 1.1 0.08 0.20 118Wheatgrass, crested, fresh, early-bloom 37 60 60 30 60 11 22 26 28 50 41 1.6 7 0.46 0.32 2.4
Wheatgrass, crested, fresh, full-bloom 50 55 55 21 55 10 25 33 36 65 41 1.6 7 0.39 0.28 2.1
Wheatgrass, crested hay 92 54 54 20 54 10 28 33 36 65 98 2.4 7 0.33 0.20 2.0 32
Whey, dried 94 82 89 59 85 14 15 0 0 0 0 0.9 10 0.98 0.88 1.3 1.20 0.92 10
Yeast, brewer’s 92 79 85 55 81 47 30 3 4 0 0.9 7 0.13 1.49 1.8
Nutrition