NUTRIGENOMICS: A SYSTEM BIOLOGY TOOL FOR ANIMAL HEALTH RVS Pawaiya, UB Chaudhary, Nitika Sharma and...
60
NUTRIGENOMICS: A SYSTEM BIOLOGY TOOL FOR ANIMAL HEALTH RVS Pawaiya, UB Chaudhary, Nitika Sharma and N. Shivasharanappa Central Institute for Research on Goats Makhdoom, P.O. Farah – 281122 Mathura, Uttar Pradesh (India)
-
Upload
matilda-turner -
Category
Documents
-
view
213 -
download
0
Transcript of NUTRIGENOMICS: A SYSTEM BIOLOGY TOOL FOR ANIMAL HEALTH RVS Pawaiya, UB Chaudhary, Nitika Sharma and...

NUTRIGENOMICS: A SYSTEM BIOLOGY TOOL FOR ANIMAL
HEALTH
RVS Pawaiya, UB Chaudhary, Nitika Sharma and N. Shivasharanappa
Central Institute for Research on GoatsMakhdoom, P.O. Farah – 281122
Mathura, Uttar Pradesh (India)

• The complete sequencing of the human genome has ushered in a new era of systems biology referred to as Omics technology.
• The term ‘omics’ refers to the comprehensive analysis of biological systems - signifying the ‘‘collectivity’’ of a set of things.
• Genomics, genotyping, transcriptomics, proteomics and metabolomics, together with bioinformatics, constitute the discipline of functional genomics – also referred to as ‘Systems biology’.
Overview

• A genotype is an individual’s collection of genes. The term also can refer to the two alleles inherited for a particular gene.
• The genotype is expressed when the information coded in the genes DNA is used to make RNA molecules and protein.
• The expression of the genotype contributes to the individual’s observable traits, called phenotype.
Genotype

Organism/Name Size (Mb) GC% Chrs Gene Release Date Modify Date
Bos taurus (Cattle) 2670.04 41.89 30 32574 2009/04/24 2013/08/06
Caenorhabditis elegans (Nematode)
100.286 35.43 6 44867 2001/12/03 2013/03/13
Canis lupus familiaris (Dog) 2410.98 41.30 39 28995 2004/07/10 2013/09/24
Capra hircus (Goat) 2635.85 42.18 30 25789 2012/12/06 2013/09/30
Drosophila melanogaster 143.726 42.10 7 17241 2002/04/30 2014/08/15
Equus caballus (Horse) 2474.93 41.65 32 25565 2007/01/24 2014/04/25
Esox lucius (Pike Fish) 877.814 42.39 25 - 2014/06/26 2014/07/09
Felis catus (Cat) 3160.29 45.60 19 - 2009/01/14 2014/04/25
Gallus gallus (Chicken) 1046.93 41.89 34 21211 2004/02/29 2011/02/24
Gorilla gorilla gorilla 3035.66 41.17 24 31334 2008/10/19 2012/12/06
Homo sapiens (human) 3209.29 41.31 24 41571 2002/08/02 2014/02/03
Macaca fascicularis (Macaque) 2946.84 41.33 21 35895 2013/05/20 2013/06/12
Mus musculus (mouse) 2775.06 42.58 21 41170 2005/07/07 2013/12/27
Ovis aries (Sheep) 2619.05 42.00 54 48657 2012/09/21 2012/12/02
Rattus norvegicus (rat) 2870.18 42.41 22 37441 2002/11/27 2014/07/01
Sus scrofa (wild boar) 2808.53 42.45 20 35252 2008/07/11 2013/09/29
Genome information by organismhttp://www.ncbi.nlm.nih.gov/genome/browse/
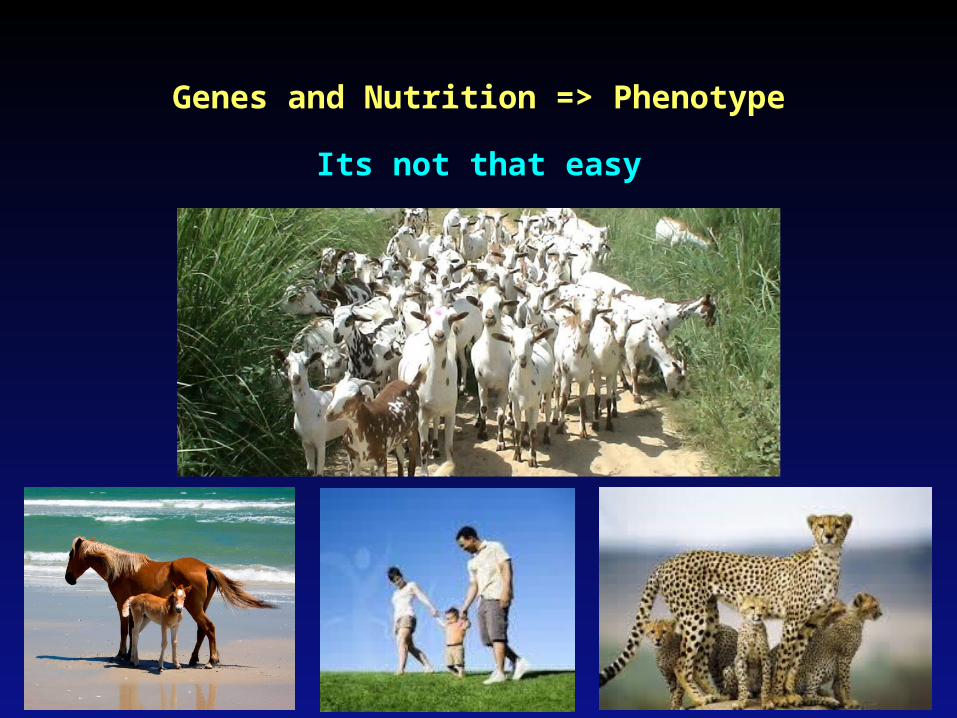
Genes and Nutrition => Phenotype
Its not that easy

Classification of hereditary diseases

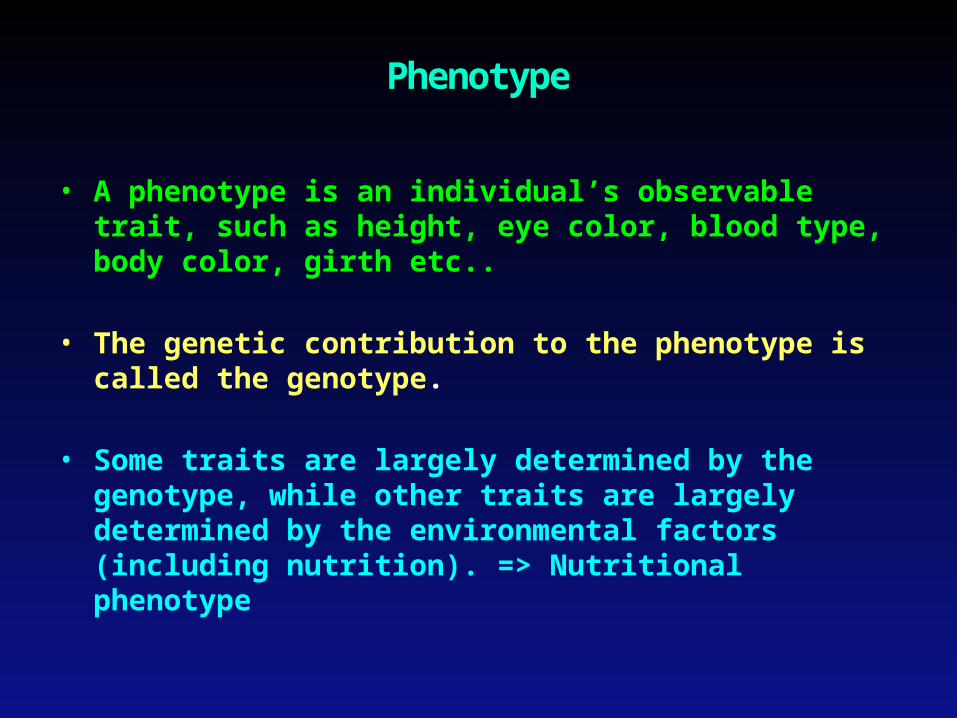
• A phenotype is an individual’s observable trait, such as height, eye color, blood type, body color, girth etc..
• The genetic contribution to the phenotype is called the genotype.
• Some traits are largely determined by the genotype, while other traits are largely determined by the environmental factors (including nutrition). => Nutritional phenotype
Phenotype
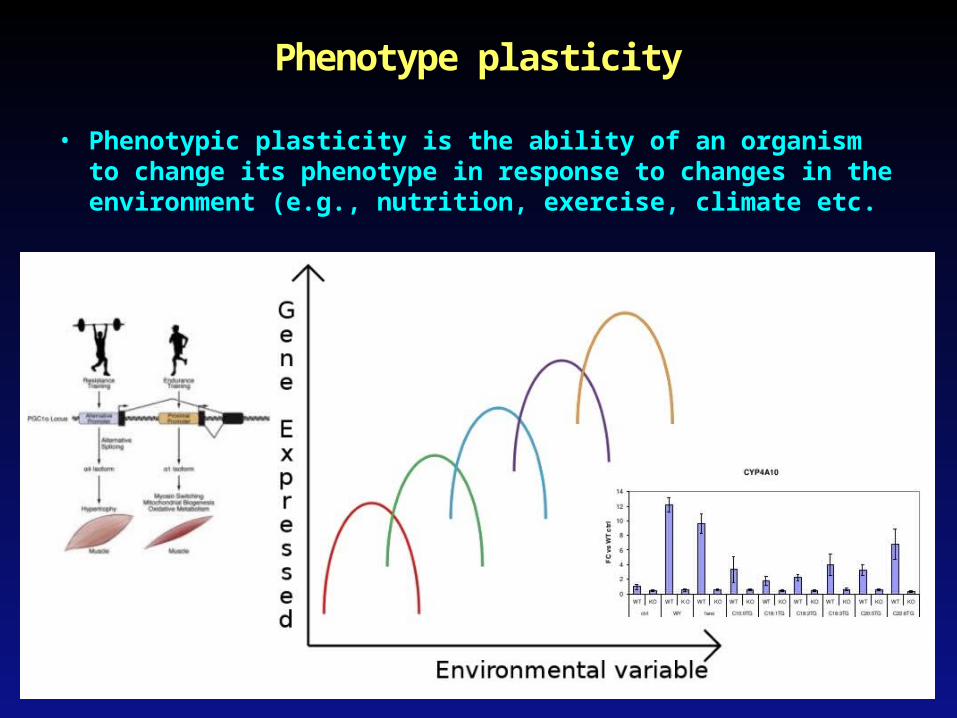
• Phenotypic plasticity is the ability of an organism to change its phenotype in response to changes in the environment (e.g., nutrition, exercise, climate etc.
Phenotype plasticity


• Epigenetics refers to the processes that regulate how and when certain genes are turned on and off, while epigenomics pertains to analysis of epigenetic changes in a cell or entire organism.
– Epigenetic processes have a strong influence on normal growth and development, and this process is deregulated in diseases such as cancer.
• Diet on its own or by interaction with other environmental factors can cause epigenetic changes that may turn certain genes on or off.
• The epigenome which is heritable and modifiable by diet is the global epigenetic pattern determined by global gene-specific DNA methylation, histone modifications and chromatin-associated proteins which control expression of house-keeping genes and suppress the expression of parasitic DNA such as transposons.
Epigenetics
Fenech M, Mutagenesis 20: 255-269, 2005; Sharma S et al., Cacinogenesis 31: 27-36, 2010

• Lack of methylation due to deficiency of methyl donors (e.g. folate, vitamin B 12 , choline and methionine) or inhibition of DNA methyltransferases leads to transposon activation and promoter silencing
– when the activated transposons insert themselves adjacent to a house-keeping gene promoter.
• A shift towards global DNA hypomethylation and tumour suppressor gene silencing with age, leads to alterations in the genotype, gene expression profile, cellular phenotype and an increased risk of cancer.

Health effects of food compounds are related mostly to specific interactions on a molecular level.
van Ommen B, Nutrition 20: 4-8, 2004

Considers how things in diet influence individual’s genome, and how this interaction modifies phenotype, i.e., how diet alters
biological systems to promote either health or disease.
Aims to figure out how any one of us is genetically programmed to respond in a particular way to a given dietary nutrient.

Nutrigenomics Vs. Nutrigenetics
Nutrigenomics• Focuses on the effect of
nutrients on gene interactions, transcriptome, proteome and metabolome.
e.g. the way in which food/ food ingredients influence the gene expression
Nutrigenetics• Focuses on the effect of
Individuals' genetic variations responsible for differential responses to nutrients.
• Differences may be at the level of SNPs than at gene level.
Although these terms are closely related, they are not interchangeable.

van Ommen B, Nutrition 20: 4-8, 2004
Nutrigenomics and nutritional systems biology apply the same set of technologies
The nutrigenomics approach then extracts relevant differences, which become leads for further mechanistic research.
The nutritional systems biology approach aims at a complete description of the physiologic response by exploiting the complete data sets, thus targeting a new concept of biomarker.

Influence of nutrigenetics, epigenetics, transcriptomics, proteomics and metabolomics on the phenotypic response to food components
Tai ES and Gillies PJ, Nutrigenomics – Opportunities in Asia, Karger, 2007

Fundamental hypotheses underpinning the science of nutrigenetics and nutrigenomics:
• Nutrition may exert its impact on health by affecting expression of genes in critical metabolic pathways and/or by affecting the incidence of genetic mutation which in turn causes alterations in gene expression.
• The health effects of nutrients depend on inherited genetic variants that alter the uptake and metabolism of nutrients.
• Better health outcomes can be achieved if nutritional requirements are customized for each individual taking into consideration his/her inherited and acquired genetic characteristics depending on life stage, dietary preferences and health status.
Fenech M et al., J Nutrigenet Nutrigenomics 4: 69-89, 2011

Transcriptomics and Microarray Technologies
• The regulation of gene expression pattern is controlled by not only bioactive food components but host of some essential nutrient elements as well.
• Genome-wide monitoring of gene expression allows us assessment of transcription of thousands of genes along with their expression in normal and diseased cells before and after their exposure to different bioactive components.
• Changes which occur in diseased cells compared with normal cells are provided by latest microarray technology tools.
• Analysis of data using bioinformatics software assist in the detection of promising biomarkers for diagnosis of disease, prognosis prediction and in the discovery of new therapeutic tools.
• The discovery of appropriate clinical strategies, including nutritional preemption related strategies are made possible by the use of molecular approach in health and disease.

• While the application of these technologies is becoming more accessible, the analysis of the complex large data sets that are generated presents multiple challenges.
– E.g., the complexity of the analysis is underscored by the potential interaction of a chosen nutrient with the 30,000 genes in the human genome or the 100,000 different proteins believed to be translated.
• Integration of statistics and bioinformatics with biology is therefore essential for the analysis and interpretation of these datasets and requires the skills, expertise and knowledge of a multidisciplinary team.
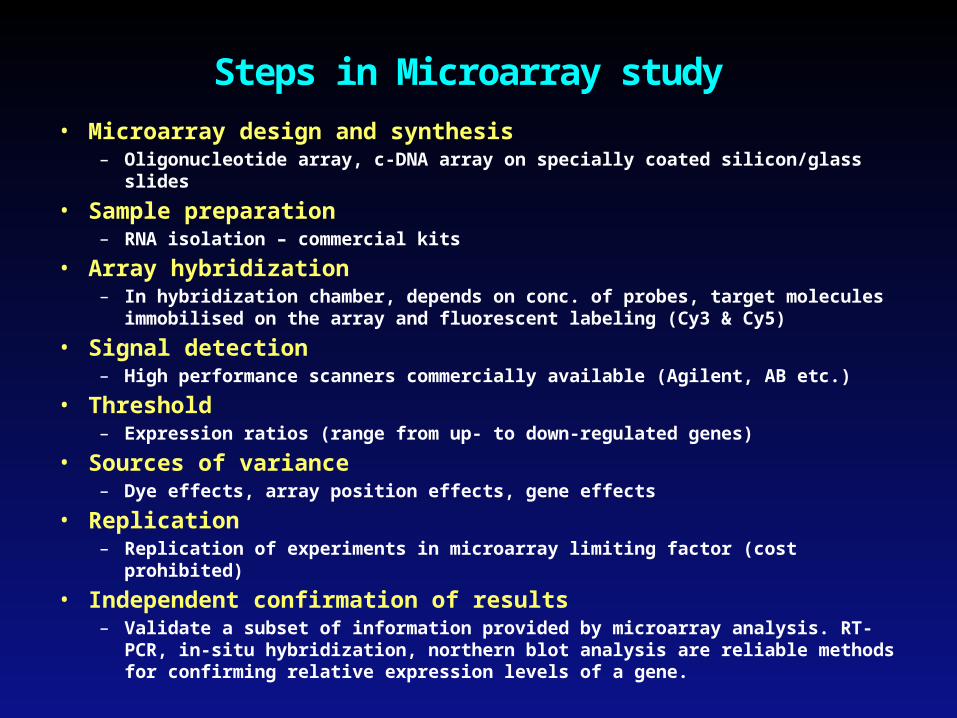
• Microarray design and synthesis– Oligonucleotide array, c-DNA array on specially coated silicon/glass slides
• Sample preparation– RNA isolation – commercial kits
• Array hybridization– In hybridization chamber, depends on conc. of probes, target molecules
immobilised on the array and fluorescent labeling (Cy3 & Cy5)
• Signal detection– High performance scanners commercially available (Agilent, AB etc.)
• Threshold– Expression ratios (range from up- to down-regulated genes)
• Sources of variance– Dye effects, array position effects, gene effects
• Replication– Replication of experiments in microarray limiting factor (cost prohibited)
• Independent confirmation of results– Validate a subset of information provided by microarray analysis. RT-PCR,
in-situ hybridization, northern blot analysis are reliable methods for confirming relative expression levels of a gene.
Steps in Microarray study
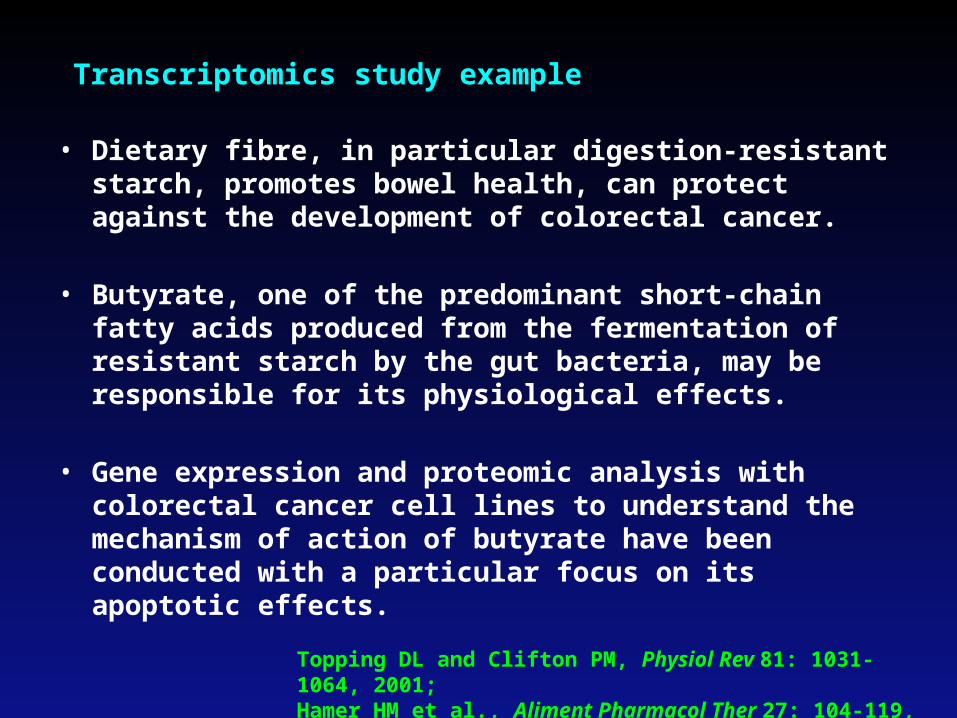
• Dietary fibre, in particular digestion-resistant starch, promotes bowel health, can protect against the development of colorectal cancer.
• Butyrate, one of the predominant short-chain fatty acids produced from the fermentation of resistant starch by the gut bacteria, may be responsible for its physiological effects.
• Gene expression and proteomic analysis with colorectal cancer cell lines to understand the mechanism of action of butyrate have been conducted with a particular focus on its apoptotic effects.
Topping DL and Clifton PM, Physiol Rev 81: 1031-1064, 2001; Hamer HM et al., Aliment Pharmacol Ther 27: 104-119, 2008
Transcriptomics study example
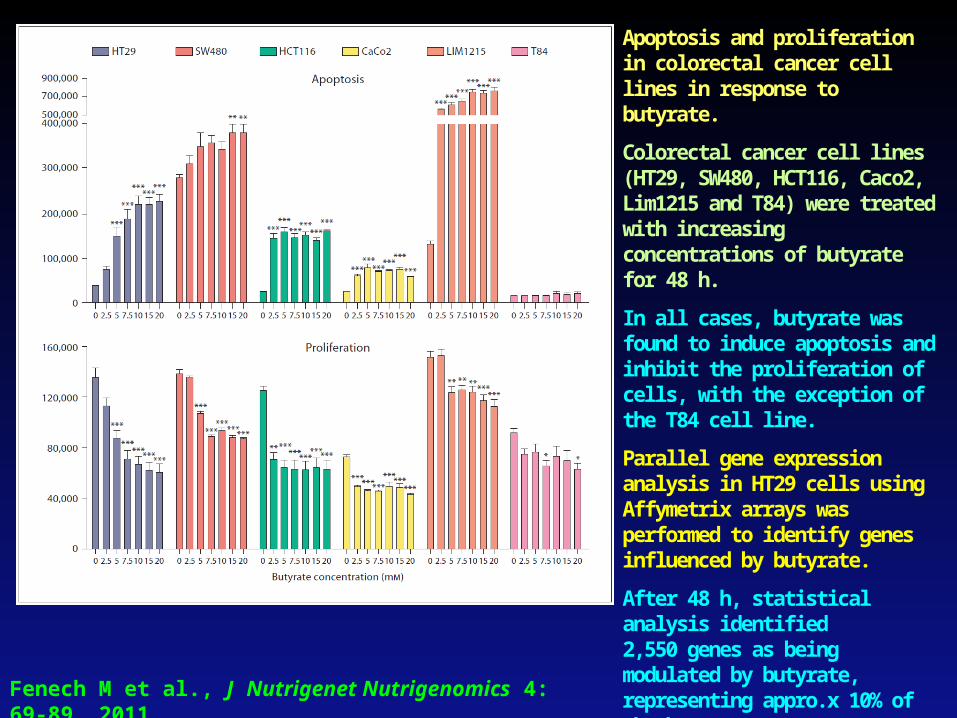
Apoptosis and proliferation in colorectal cancer cell lines in response to butyrate.
Colorectal cancer cell lines (HT29, SW480, HCT116, Caco2, Lim1215 and T84) were treated with increasing concentrations of butyrate for 48 h.
In all cases, butyrate was found to induce apoptosis and inhibit the proliferation of cells, with the exception of the T84 cell line.
Parallel gene expression analysis in HT29 cells using Affymetrix arrays was performed to identify genes influenced by butyrate.
After 48 h, statistical analysis identified2,550 genes as being modulated by butyrate, representing appro.x 10% of the human genome.
These genes were found to be involved in biological processes such as DNA repair and transcription, cell cycle progression, cell metabolism and signal transduction.Fenech M et al., J Nutrigenet Nutrigenomics 4: 69-89, 2011
• Proteomics in nutrition can identify and quantify bioactive proteins and peptides and addresses questions of nutritional bio efficacy.
• Many nutrients can modify RNA translation to protein and post- translation events.
• The proteome exploration is found to play a role in solving major nutrition-associated problems in living beings, e.g., obesity, diabetes, CV diseases, melanoma, aging process etc. by using proteome analysis.
Proteomics
Kussmann M and Affolter M, Nutrition 25: 1085-93, 2009

• Two-dimensional polyacrylamide gel electrophoresis .
• Chromatography methods (LC, GC).
• Mass spectrometry (MS)-rooted proteomic techniques for protein
identification and quantification .
• MS technologies include electrospray ionization (ESI), soft ionization technique and matrix-associated laser desorption ionization (MALDI).
• These techniques make use of charge to mass ratio; flight time and
electron trap as chief discriminating parameters for analysis of ionized
and vaporized proteins and peptides in high vacuum of the MS and
MALDI.
• MS has very high speed, sensitivity, specificity, resolution of mass ability
and mass precision for protein documentation processes.
• When MS is merged with LC-GC or with MS, then its efficiency can further
be enhanced in proteomics.
• All of these methods involve preparation of sample, separation of protein,
analysis of MS, and identification of protein.
Proteomics technologies
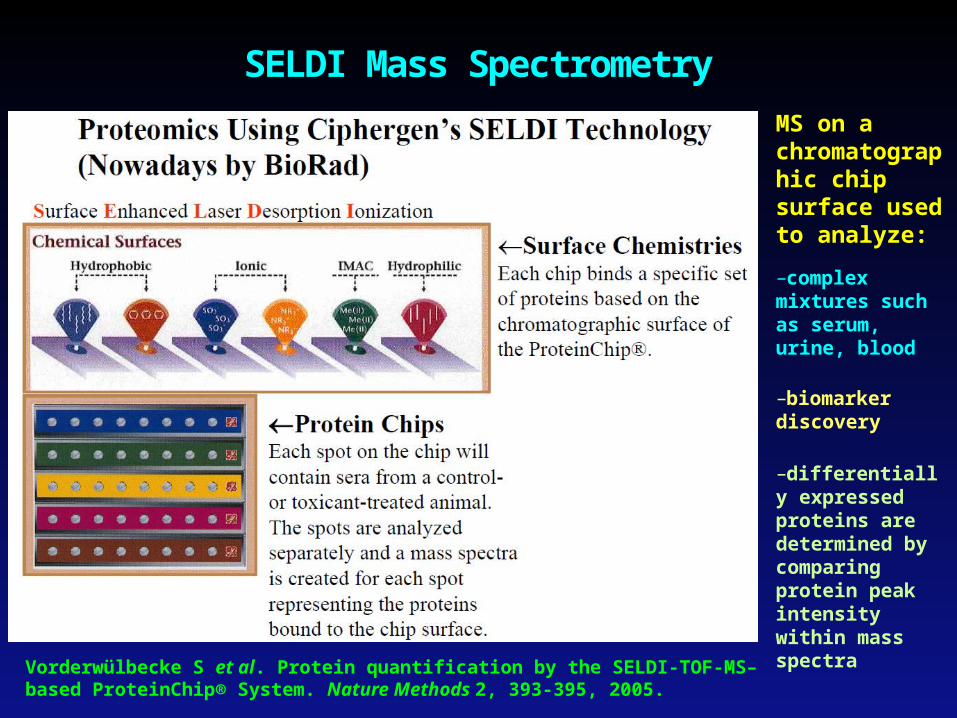
SELDI Mass Spectrometry
MS on a chromatographic chip surface used to analyze:
–complex mixtures such as serum, urine, blood
–biomarker discovery
–differentially expressed proteins are determined by comparing protein peak intensity within mass spectra
Vorderwülbecke S et al. Protein quantification by the SELDI-TOF-MS–based ProteinChip® System. Nature Methods 2, 393-395, 2005.

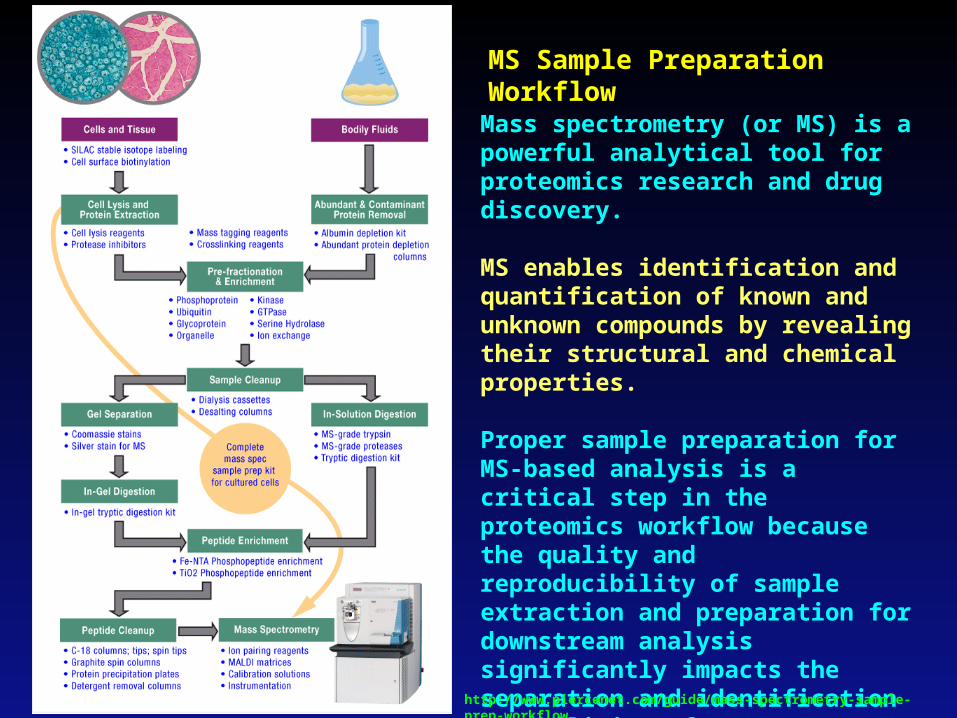
Mass spectrometry (or MS) is a powerful analytical tool for proteomics research and drug discovery.
MS enables identification and quantification of known and unknown compounds by revealing their structural and chemical properties.
Proper sample preparation for MS-based analysis is a critical step in the proteomics workflow because the quality and reproducibility of sample extraction and preparation for downstream analysis significantly impacts the separation and identification capabilities of mass spectrometers.
MS Sample Preparation Workflow
http://www.piercenet.com/guide/mass-spectrometry-sample-prep-workflow

• In colorectal cancer cell lines, butyrate treatment induced apoptosis and inhibited proliferation after 48 h.
• Proteomics and gene expression arrays were used to identify the mechanisms underlying butyrate-induced apoptosis using HT29 cells as the model system.
• Statistical and bioinformatic analyses were then employed to identify potentially important genes and proteins involved in the induction of apoptosis in colorectal cancer cells.
• Using proteomics (2D-DIGE and MS), 1,347 proteins were detected, including protein isoforms and modifications, and 139 proteins were identified which were potentially involved in the apoptotic response to butyrate.
Fung KY et al., J Proteome Res 8: 1220–1227;, 2009
Proteomics study example
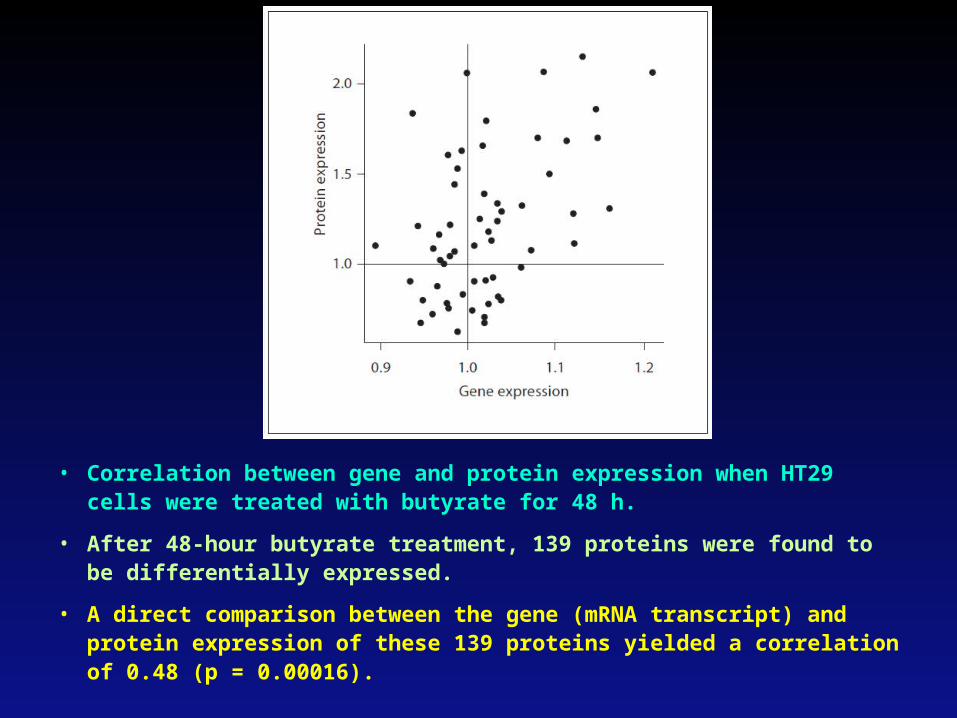
• Correlation between gene and protein expression when HT29 cells were treated with butyrate for 48 h.
• After 48-hour butyrate treatment, 139 proteins were found to be differentially expressed.
• A direct comparison between the gene (mRNA transcript) and protein expression of these 139 proteins yielded a correlation of 0.48 (p = 0.00016).

• Metabolomics can be defined as the screening of small-molecule metabolites present in samples of biological origins.
• The characterization of all the metabolites (or metabolome) can provide a snapshot of the metabolism and a molecular fingerprint.
– Such a characterization acts as an index or biomarker of a biological state of an organism.
• By comparing metabolome profiles, we can determine patterns of variations between different groups: healthy vs. diseased, control vs. treated, wild-type vs. genetically modified.
• In addition, metabolomics can be used to monitor the outcome of treatment strategies, such as pharmacological or dietary interventions,
– by observing whether the metabolic phenotypes of treated, diseased patients shifts in the cluster of healthy subjects.
Metabolomics
Astarita G and Langridge J, J Nutrigenet Nutrigenomics 6: 181-200, 2013
• Unlike the genome, which remains static, the metabolome reflects both genetic and environmental components, including drugs, contaminants, gut microflora activity and diet.
• Thus, comprehensive metabolite profiles can offer a level of description of a biological system that transcends pure genetic information and more closely reflects the ultimate phenotypes.
• Metabolomics tools are now being applied to the analysis of:
– food components,
– the identification of their metabolites in body fluids and biological tissues,
– the evaluation of their bioavailability and metabolism,
– the role of gut microflora, and
– the physiological response to a particular diet regimen, food, or nutraceutical.
Astarita G and Langridge J, J Nutrigenet Nutrigenomics 6: 181-200, 2013

Genes (DNA) encode mRNAs that, in turn, encode proteins that collectively, and together with environmental factors (e.g., diet), lead to the metabolite inventory of a cell, tissue, or body fluid. Metabolites, in turn, can regulate gene expression, enzymatic activities, and protein functions.
Astarita G and Langridge J, J Nutrigenet Nutrigenomics 6: 181-200, 2013
Among the metabolites are lipids.
Novel approaches now allow for qualitative and quantitative measurements at each level on global scales (genomics, epigenomics, proteomics, and metabolomics).
Lipidomics can be viewed as a subdiscipline of metabolomics under the umbrella of systems biology.
Metabolomics in systems biology
• One of the main challenges for metabolomics is the generation of comprehensive profiles of metabolites in biological samples.
• Metabolites vary in concentrations (from attomolar to millimolar), chemical complexity (thousands of components), and spatial localization.
• Complex analytical strategies have been designed to study metabolic phenotypes as well as to perform comparative analyses of metabolomes.
• Currently, three main strategies are used for metabolomic investigations:
– untargeted metabolomics,
– targeted metabolomics, and
– in situ metabolomics.
Metabolomics Tools and Srategies
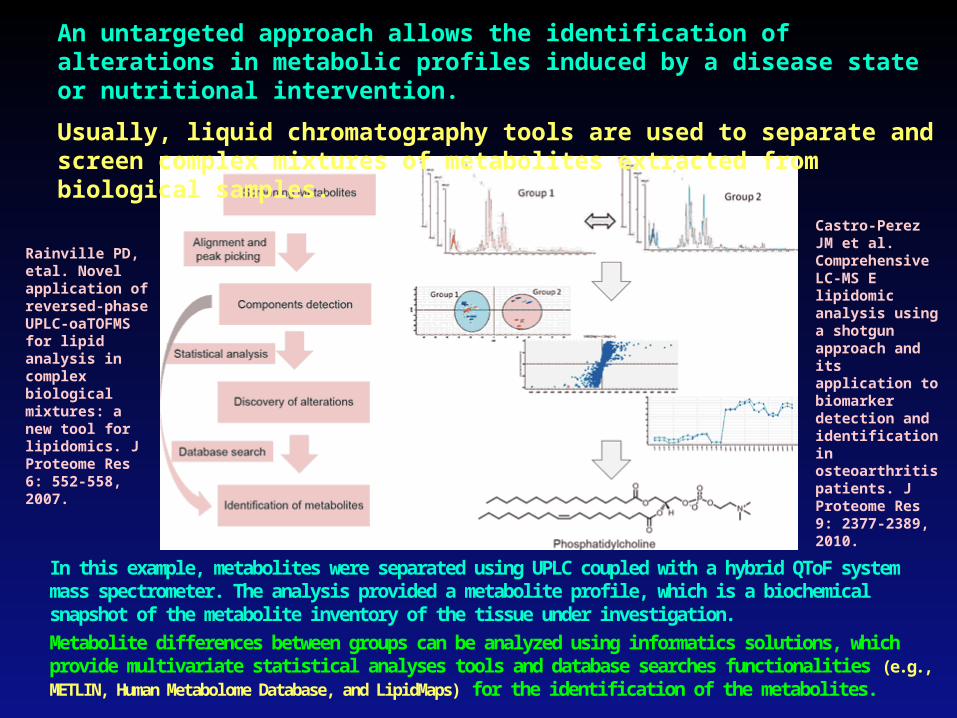
In this example, metabolites were separated using UPLC coupled with a hybrid QToF system mass spectrometer. The analysis provided a metabolite profile, which is a biochemical snapshot of the metabolite inventory of the tissue under investigation.
Metabolite differences between groups can be analyzed using informatics solutions, which provide multivariate statistical analyses tools and database searches functionalities (e.g., METLIN, Human Metabolome Database, and LipidMaps) for the identification of the metabolites.
An untargeted approach allows the identification of alterations in metabolic profiles induced by a disease state or nutritional intervention.
Usually, liquid chromatography tools are used to separate and screen complex mixtures of metabolites extracted from biological samples.
Rainville PD, etal. Novel application of reversed-phase UPLC-oaTOFMSfor lipid analysis in complex biological mixtures: a new tool for lipidomics. J Proteome Res 6: 552-558, 2007.
Castro-Perez JM et al. Comprehensive LC-MS E lipidomic analysis using a shotgun approach and its application to biomarkerdetection and identification in osteoarthritis patients. J Proteome Res 9: 2377-2389, 2010.
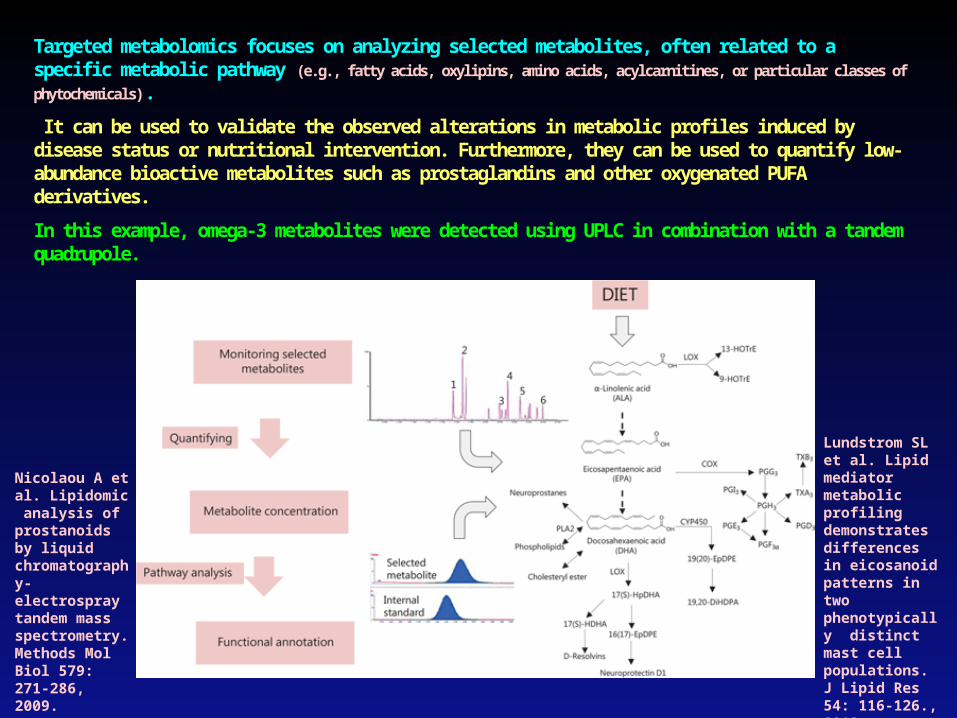
Targeted metabolomics focuses on analyzing selected metabolites, often related to a specific metabolic pathway (e.g., fatty acids, oxylipins, amino acids, acylcarnitines, or particular classes of phytochemicals).
It can be used to validate the observed alterations in metabolic profiles induced by disease status or nutritional intervention. Furthermore, they can be used to quantify low-abundance bioactive metabolites such as prostaglandins and other oxygenated PUFA derivatives.
In this example, omega-3 metabolites were detected using UPLC in combination with a tandem quadrupole.
Nicolaou A et al. Lipidomic analysis of prostanoids by liquid chromatography-electrospray tandem mass spectrometry. Methods Mol Biol 579: 271-286, 2009.
Lundstrom SL et al. Lipid mediator metabolic profiling demonstrates differences in eicosanoid patterns in two phenotypically distinct mast cell populations. J Lipid Res 54: 116-126., 2013.
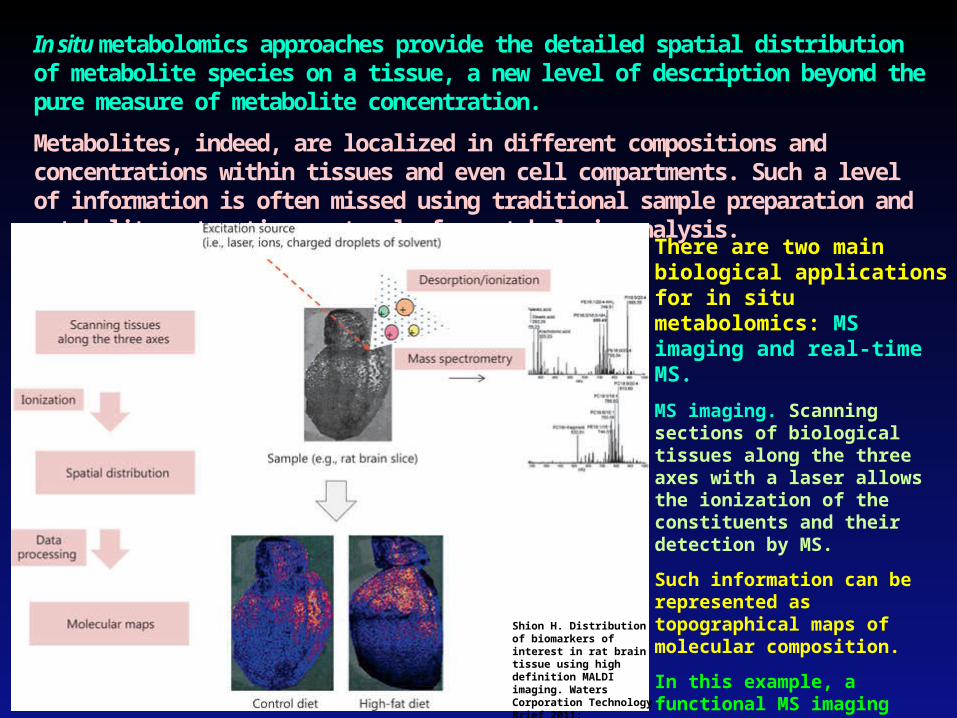
In situ metabolomics approaches provide the detailed spatial distribution of metabolite species on a tissue, a new level of description beyond the pure measure of metabolite concentration.
Metabolites, indeed, are localized in different compositions and concentrations within tissues and even cell compartments. Such a level of information is often missed using traditional sample preparation and metabolite extraction protocols for metabolomic analysis.
There are two main biological applications for in situ metabolomics: MS imaging and real-time MS.
MS imaging. Scanning sections of biological tissues along the three axes with a laser allows the ionization of the constituents and their detection by MS.
Such information can be represented as topographical maps of molecular composition.
In this example, a functional MS imaging using MALDI-Synapt allows to determine the exact localization in the rat brain of the changes in molecular composition induced by a particular diet.
Shion H. Distribution of biomarkers of interest in rat brain tissue using high definition MALDI imaging. Waters Corporation Technology Brief 2011: 720004135en.
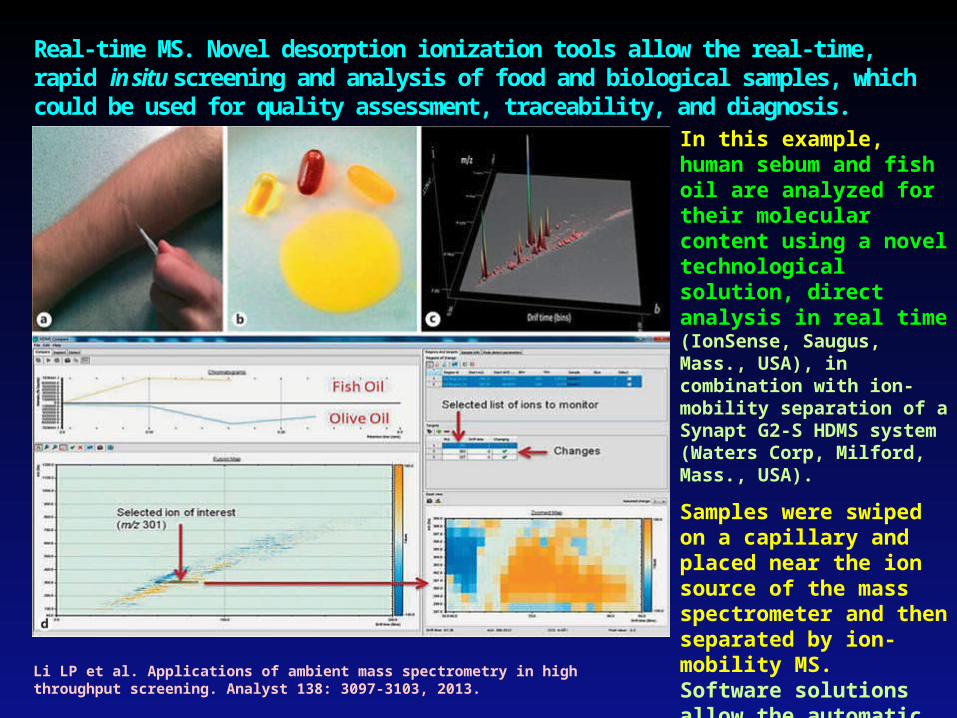
Real-time MS. Novel desorption ionization tools allow the real-time, rapid in situ screening and analysis of food and biological samples, which could be used for quality assessment, traceability, and diagnosis.
In this example, human sebum and fish oil are analyzed for their molecular content using a novel technological solution, direct analysis in real time (IonSense, Saugus, Mass., USA), in combination with ion-mobility separation of a Synapt G2-S HDMS system (Waters Corp, Milford, Mass., USA).
Samples were swiped on a capillary and placed near the ion source of the mass spectrometer and then separated by ion-mobility MS. Software solutions allow the automatic detection of differences in PUFA composition.Li LP et al. Applications of ambient mass spectrometry in high throughput
screening. Analyst 138: 3097-3103, 2013.

NutrigenomicsQuantification of nutritional genotype-phenotype
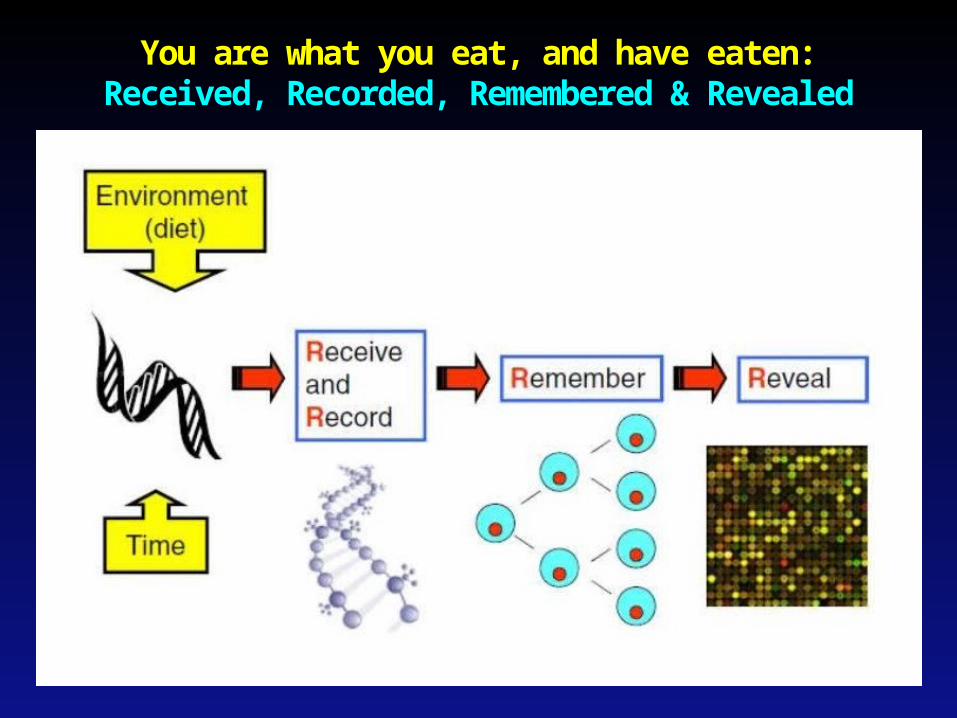
You are what you eat, and have eaten:Received, Recorded, Remembered & Revealed

Timely relatively modest interventions in early life can have a large effect on disease risk later

Nutrigenomics: two strategies

What is the background? What is the problem?
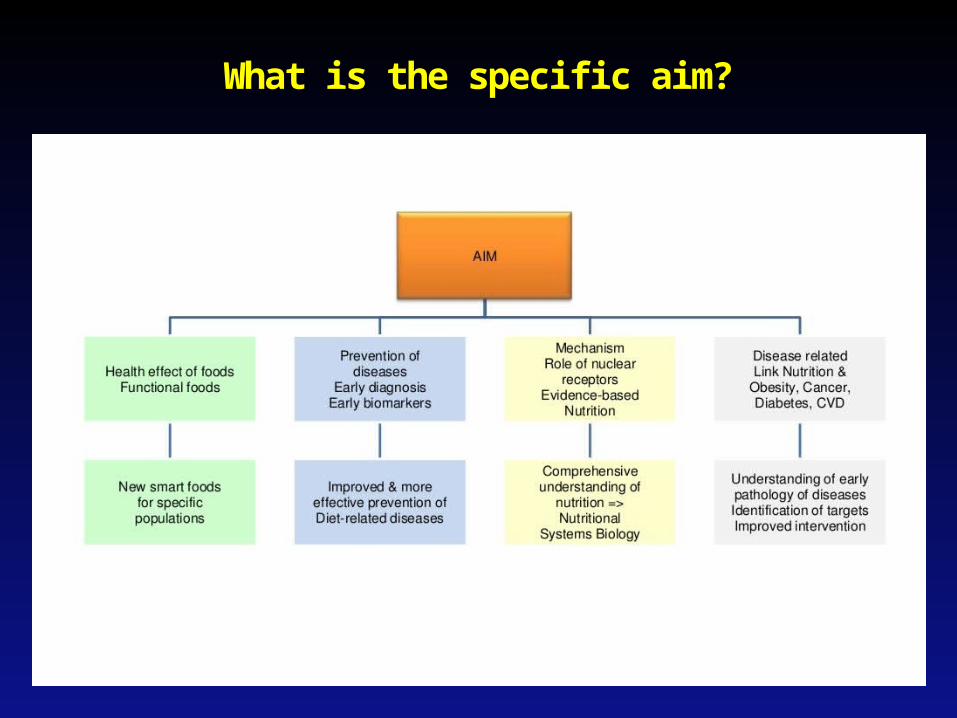
What is the specific aim?

Which materials and methods?

What are the specific deliverables?

It is possible to understand the importance of the relationship between individual nutrients and the regulation of gene expression.
Macronutrients (e.g., fatty acids and proteins), micronutrients (e.g., vitamins, minerals), and naturally occurring bioactive chemicals (e.g., phytochemicals such as flavonoids, carotenoids, coumarins, polyphenols, and phytosterols; and zoochemicals such as eicosapentaenoic acid
and docosahexaenoic acid) regulate gene expression in
diverse ways.
(Karlsen et al. 2007; Mead, 2007)

Transcription factor pathways mediating nutrient-gene interaction

Nuclear hormone receptors

Nutrigenomics = Molecular Nutrition & GenomicsEssential role of nutrient sensing transcription factors

e.g. In steers under nutritional restriction due to intake of
poor quality feeds, expression of specific genes associated with protein turnover, cytoskeletal remodeling and metabolic homeostasis was clearly
influenced by diet. (Byrn et al., 2005)
In a study on diet induced gene expression in mice, Se-deficiency altered protein synthesis at transcriptional level, resulting into increase of stress through up-regulation of specific gene expression and
signaling pathway. (Rao et al., 2001)
Very limited studies in animals

• Diet-induced milk fat depression (MFD) represents an exciting example of nutrigenomics:
Where bioactive fatty acids produced as biohydrogenation intermediates during rumen fermentation act to down-regulate the expression of key lipogenic genes involved in milk fat synthesis.
Multiple conjugated linoleic acid isomers have been observed to reduce milk fat synthesis in the cow.
(Minihane, 2009; Bauman et al., 2011)
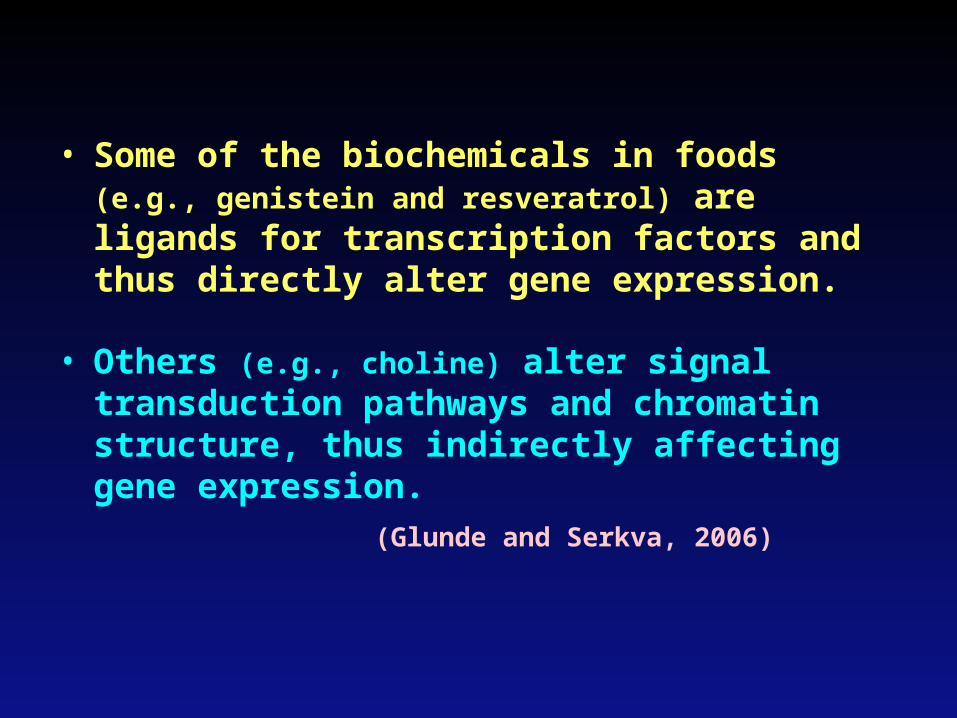
• Some of the biochemicals in foods (e.g., genistein
and resveratrol) are ligands for transcription factors and thus directly alter gene expression.
• Others (e.g., choline) alter signal transduction pathways and chromatin structure, thus indirectly affecting gene expression.
(Glunde and Serkva, 2006)
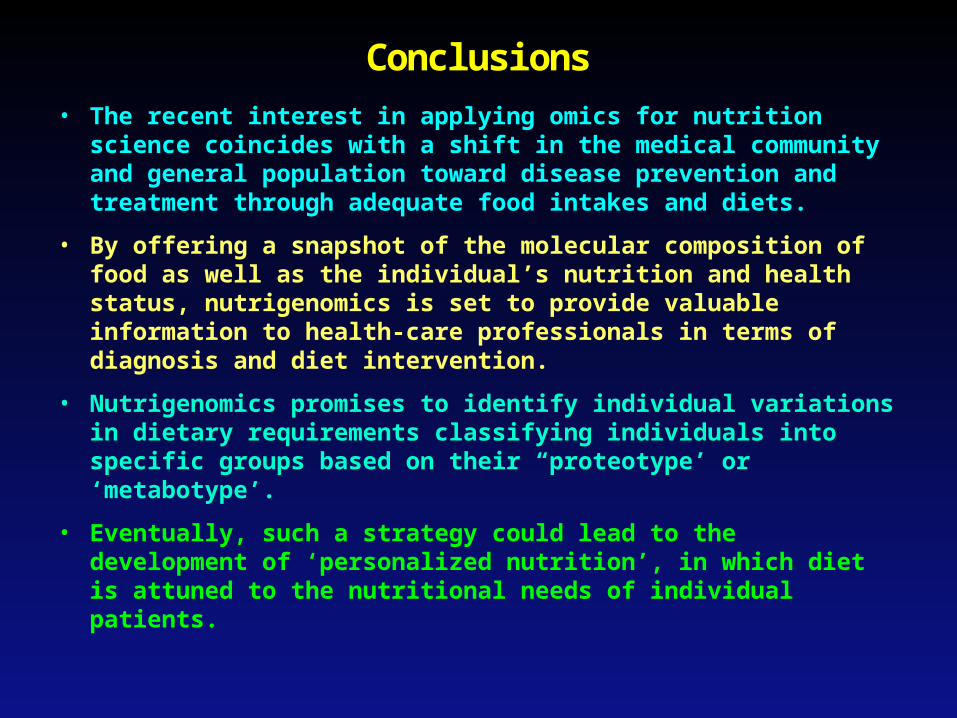
• The recent interest in applying omics for nutrition science coincides with a shift in the medical community and general population toward disease prevention and treatment through adequate food intakes and diets.
• By offering a snapshot of the molecular composition of food as well as the individual’s nutrition and health status, nutrigenomics is set to provide valuable information to health-care professionals in terms of diagnosis and diet intervention.
• Nutrigenomics promises to identify individual variations in dietary requirements classifying individuals into specific groups based on their “proteotype’ or ‘metabotype’.
• Eventually, such a strategy could lead to the development of ‘personalized nutrition’, in which diet is attuned to the nutritional needs of individual patients.
Conclusions

• Specific blood-metabolomic/ proteomic profile tests might one day identify persons or animals with specific dietary deficiency or who are at risk for disease.
• Based on genetic variations, personalized dietary recommendations and supplements may be advised for such individuals, the aim being not merely to decrease the risk of disease but to achieve optimal health and wellness.
• Nutrigenomics can be used to identify specific markers to manipulate gene expression through use of nutrients or their combinations so as to improve productive as well as overall animal performance.
• In veterinary field, nutrigeonmics studies could prove to be an important tool for identification of pathways and candidate genes responsible for dietary induced diseases and ultimately reduction in production losses due to these diseases in animals.
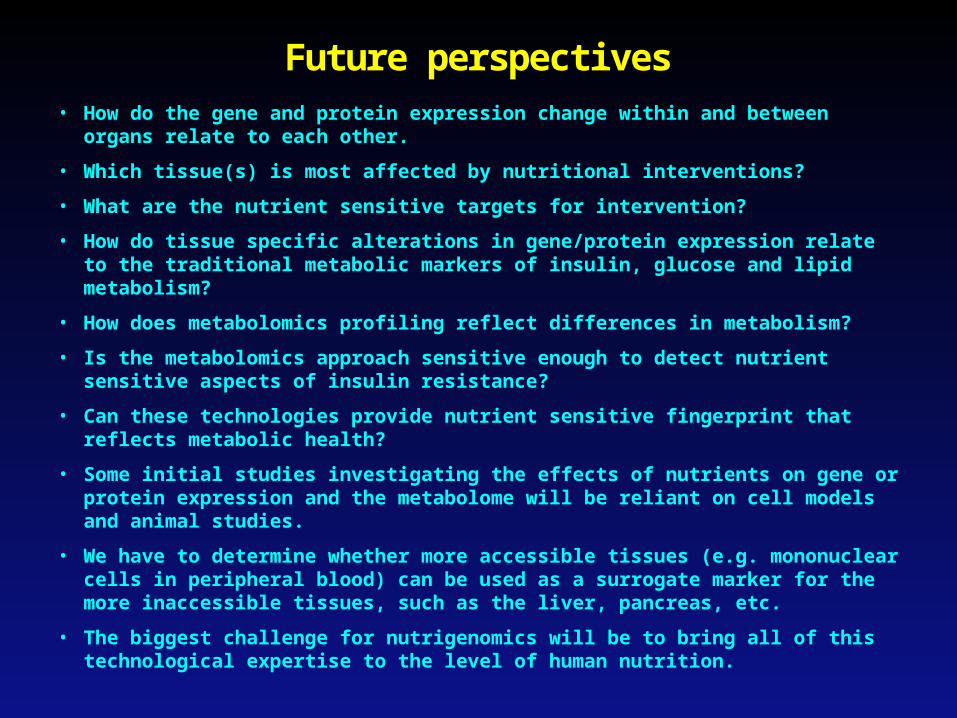
• How do the gene and protein expression change within and between organs relate to each other.
• Which tissue(s) is most affected by nutritional interventions?
• What are the nutrient sensitive targets for intervention?
• How do tissue specific alterations in gene/protein expression relate to the traditional metabolic markers of insulin, glucose and lipid metabolism?
• How does metabolomics profiling reflect differences in metabolism?
• Is the metabolomics approach sensitive enough to detect nutrient sensitive aspects of insulin resistance?
• Can these technologies provide nutrient sensitive fingerprint that reflects metabolic health?
• Some initial studies investigating the effects of nutrients on gene or protein expression and the metabolome will be reliant on cell models and animal studies.
• We have to determine whether more accessible tissues (e.g. mononuclear cells in peripheral blood) can be used as a surrogate marker for the more inaccessible tissues, such as the liver, pancreas, etc.
• The biggest challenge for nutrigenomics will be to bring all of this technological expertise to the level of human nutrition.
Future perspectives

Thanksfor patient hearing