Nutrients, phytochemicals and antioxidant activity in wild ... · taken to analyze dry matter, pH,...
30
Nutrients, phytochemicals and antioxidant activity in wild populations of Allium ampeloprasum L., a valuable underutilized vegetable García-Herrera, P. a , Morales, P. a,b , Fernández-Ruiz, V. a , Sánchez-Mata, M.C. a , Cámara, M. a , Carvalho, A.M. b , Ferreira, I.C.F.R. b *, Pardo-de-Santayana, M. c , Molina, M. d , Tardio, J d . a Dpto. Nutrición y Bromatología II. Facultad de Farmacia. Universidad Complutense de Madrid (UCM). Pza Ramón y Cajal, s/n. E-28040 Madrid, Spain. b Centro de Investigação de Montanha, ESA, Instituto Politécnico de Bragança, Campus de Santa Apolónia, Apartado 1172, 5301-854 Bragança, Portugal. c Dpto. Biología (Botánica), Facultad de Ciencias. Universidad Autónoma de Madrid. Campus de Cantoblanco E-28049 Madrid, Spain. d Instituto Madrileño de Investigación y Desarrollo Rural, Agrario y Alimentario (IMIDRA). Finca "El Encín”. Apdo. 127. E-28800 Alcalá de Henares, Spain. *Author to whom correspondence should be addressed (e-mail: [email protected]; telephone +351-273-303219; fax +351-273-325405).
Transcript of Nutrients, phytochemicals and antioxidant activity in wild ... · taken to analyze dry matter, pH,...

Nutrients, phytochemicals and antioxidant activity in wild populations of Allium
ampeloprasum L., a valuable underutilized vegetable
García-Herrera, P.a, Morales, P.a,b, Fernández-Ruiz, V.a, Sánchez-Mata, M.C.a, Cámara,
M.a, Carvalho, A.M.b, Ferreira, I.C.F.R.b*, Pardo-de-Santayana, M.c, Molina, M.d,
Tardio, J d.
a Dpto. Nutrición y Bromatología II. Facultad de Farmacia. Universidad Complutense
de Madrid (UCM). Pza Ramón y Cajal, s/n. E-28040 Madrid, Spain.
b Centro de Investigação de Montanha, ESA, Instituto Politécnico de Bragança, Campus
de Santa Apolónia, Apartado 1172, 5301-854 Bragança, Portugal.
c Dpto. Biología (Botánica), Facultad de Ciencias. Universidad Autónoma de Madrid.
Campus de Cantoblanco E-28049 Madrid, Spain.
d Instituto Madrileño de Investigación y Desarrollo Rural, Agrario y Alimentario
(IMIDRA). Finca "El Encín”. Apdo. 127. E-28800 Alcalá de Henares, Spain.
*Author to whom correspondence should be addressed (e-mail: [email protected];
telephone +351-273-303219; fax +351-273-325405).

Abstract
Wild Allium species with a long tradition of use, such as A. ampeloprasum L. could
provide interesting bioactive compounds to current diet. This wild vegetable is been
scarcely known, regarding nutrient and bioactive compounds content. Therefore, the
aim of this work is to provide a detailed chemical quantification of nutrients,
hydrophilic and lipophilic bioactive compounds and antioxidant capacity of the edible
parts of wild leek, as well as data about plant production and availability of the species
in their natural habitats.
Wild leek can be considered as a low energy food, being a good source of fiber and
zinc, compared to its cultivated relatives, and revealed predominance of polyunsaturated
fatty acids, being linoleic acid the main fatty acid. For these reasons, this non-
conventional wild bulb should be revalorised as a good alternative to increase the
diversity of vegetables consumed and enhance the quality of current occidental diets.
Additionally, natural yield of this species, although lower than other cultivated Allium
species, was found to be stable and well-adapted to human-disturbed environments. For
these reasons, this non-conventional wild bulb should be revalorised as a good
alternative to increase the diversity of vegetables consumed and enhance the quality of
current occidental diets.
Keywords: Wild leek; nutrients; bioactive compounds; antioxidant activity; natural
production.

1. Introduction
Many members of Allium genus, which include around 700 species, have been
recognized as rich sources of secondary metabolites with biological activity (Khanum et
al., 2004). The antioxidant properties of many Allium species have being widely proved
(Bernaert et al., 2012), as well as the antifungal and antimicrobial activity of bulbs and
aerial parts of garlic (A. sativum L.), scallion (A. fistulosum L.), and other species of the
genus (Mohammadi et al., 2012; Kim, Cho & Han, 2013). One of the main mechanisms
proposed for explaining Allium species bioactivity is radical scavenging. When the
balance between the production and neutralization of free radicals by antioxidants tends
to the overproduction of reactive oxygen species, the cells suffer the consequences of
oxidative stress (Carocho & Ferreira, 2013). To avoid this, humans depend on
antioxidants presents in the diet to maintain free radicals at low levels (Pietta, 2000).
Some hydrophilic compounds such as ascorbic acid and other organic acids present
antioxidant properties, but there is a lack of data regarding their profile in non-
cultivated Allium species (Seabra et al., 2006; Carocho & Ferreira, 2013). Also some
lipophilic compounds such as tocopherols are naturally occurring antioxidants that play
important roles in health by inactivating the free radicals and protecting against
degenerative processes, such as cancer and cardiovascular diseases (Simopoulos, 2002).
Among Allium species, the wild leek or broadleaf wild leek, Allium ampeloprasum L. is
native to the Mediterranean region (S. Europe, Northern Africa to W. Asia), though it
has been introduced in other regions of the world, such as North and South America and
Australia (Aedo 2013). It is a species closely related to leek (Allium porrum L.), that
have been traditionally considered as its wild progenitor. Although some authors (eg.
Hanelt & Institute of Plant Genetics and Crop Plant Research, 2001; Govaerts, 1995)
adopt a broad sense of the taxon A. ampeloprasum that considers cultivated leeks as a

subspecies or variety of A. ampeloprasum, other prefer a more restricted taxonomical
approach for the species that only includes wild leeks without considering any
subspecies (Aedo, 2013; ITIS, 2014). Recent molecular studies seem to agree that A.
porrum should be considered a distinct species (Hirschegger et al. 2010). Therefore in
this paper we consider A. ampeloprasum in this strict sense.
Its bulb and the pseudostem formed by the overlapping leaves are traditionally
consumed either as a vegetable or as a condiment in many Mediterranean countries (e.g.
Al-Qura'n, 2010; Picchi and Pieroni 2005; Tardío et al. 2006). As a vegetable, it is
sometimes consumed raw, but more frequently cooked, boiled and seasoned with olive
oil and vinegar, fried or mixed with other ingredients (e.g. Dogan, 2012; Tardío, Pardo-
de-Santayana & Morales, 2006). Though lesser than other Allium species, the wild leek
has a very long folk medicinal history of use in a wide range of diseases, being
mentioned by Dioscorides in the 1st century AD (Osbaldeston, 2000) and also in some
modern ethnobotanical works for their perceived antihelmintic, diuretic,
antihypertensive (Guarrera & Savo, 2013), or digestive properties (Triano et al., 1998).
To the authors’ knowledge, an extensive chemical and antioxidant characterization of
wild leek (A. ampeloprasum) has not been previously performed. Its nutritional
composition, organic acid profile, fatty acids and tocopherols content, as well as their
antioxidant properties have not been previously measured. This wild vegetable is been
scarcely known, regarding nutrient and bioactive compounds content. Therefore, the
aim of this work is: to provide a detailed chemical quantification of nutrients,
hydrophilic and lipophilic bioactive compounds and antioxidant capacity of the edible
parts of wild leek; and to estimate the individual plant production and availability of the
species in their natural habitats where the samples were collected, in order to offer a
wide perspective of its potential use in contemporary diets.

2. Materials and methods
2.1. Study sites and harvesting dates
Two wild populations of Allium ampeloprasum were selected to carry out this survey,
from two different sites of Central Spain (Fig. 1). Although the two sites have similar
climatic characteristics they differ on soil types and land uses at the sampling areas.
Wild leeks were found growing wild in human-disturbed habitats at both forested (Site
1) and agricultural (Site 2) areas, especially near roadsides and paths.
The sampling was carried out choosing the appropriate moment or gathering, during the
end of winter and early spring, from 23 of February to 28 of March, as shown in Fig. 1.
The measurements were made during three consecutive years (2007-2009). The edible
parts, i.e., the bulb and the pseudostem formed by the overlapping leaves, of a minimum
of 25 randomly selected individuals per site and year were gathered. They were dug out
with a hoe and prepared as for human consumption, cleaning them by cutting the roots
and the greener parts of the leaves, as well as the outer parts of the bulbs and leaves
(Fig. 1).
2.2 Sample preparation for nutritional analyses
Since the composition of wild plants is highly influenced by natural (geographical and
environmental) conditions, four individual samples corresponding to the two sites and
collected during the first two years of survey (2007-2008) were prepared for the
analysis in order to do a representative sampling. Each sample comprises 500 g of
edible portion collected from at least 25 individual plants randomly chosen per site and
year, all of them with a healthy external appearance.

Each individual fresh and cleaned sample (Fig. 1) were immediately carried to the
laboratory in a cold system and homogenized in a laboratory blender. Aliquots were
taken to analyze dry matter, pH, titratable acidity, organic acids and vitamin C (ascorbic
acid- AA and dehydroascorbic acid- DHAA). Proximal composition and mineral
analysis were performed on freeze-dried materials (stored at -20ºC until analysis). For
fatty acids, tocopherols, phenolics and antioxidant capacity analysis, a composite
sample was prepared by mixing the four individual samples, according to Greenfield &
Southgate (2003). All determinations, in either individual or composite samples were
performed in triplicate.
2.3. Nutritional evaluation
The pH was measured by a potentiometer (MicropH-2000, Crison Instrument) over an
homogenized sample 1/10 (w/v) in distilled water; titratable acidity (TA) was
determined by titration with 0.1 N NaOH until pH of 8.1 was reached; moisture was
determined by desiccation to constant weight at 100 ± 2 ºC following AOAC official
methods (2006).
Total available carbohydrates (TAC). This analysis was carried out by a colorimetric
method using anthrone reagent, as described by Osborne and Voogt (1986) using 0.5 g
of freeze-dried sample. Samples were pre-treated with 15 mL of 52% (v/v) HClO4 and
10 mL of distilled water and kept for 18 h in the dark. After this period, samples were
filtered and the volume of the filtrate was adjusted to 250 mL. Finally, the solution was
further diluted to 8% (v/v), and 5 mL of 0.1% (w/v) anthrone solution in 70% (v/v)
H2SO4 was added to 1 mL of extract. Samples were kept in a boiling water bath for 12
min where the anthrone reaction with sugars yielded a green colour, and absorbance
was measured at 630 nm on a UV/Vis Spectrometer EZ210 (Perkin Elmer, Waltham,

MA, USA) equipped with Lambda software PESSW ver. 1.2. The absorbance of the
sample solution was compared to a 10–100 mg/mL concentration range standard
glucose calibration curve.
Total dietary fiber assay. AOAC enzymatic–gravimetric methods (993.19 and 991.42)
were used for soluble dietary fiber (SDF) and insoluble dietary fiber (IDF) analysis
(Horwith & Latimer, 2005). In brief, freeze-dried samples were treated with alpha-
amylase, protease and amyloglucosidase. The soluble and insoluble fractions were
separated by vacuum filtration. Waste from the digests was dried at 100 ºC, and ash and
protein contents were determined in the residue. Total fiber is the sum of soluble and
insoluble fiber.
Total protein. Total proteins were determined as nitrogen content by the Kjeldahl
method. An amount of 0.7 g of freeze-dried sample was digested in sulfuric acid, NH3
was distilled over N/10 H2SO4 and the excess of sulfuric acid was titrated against N/10
NaOH. Total nitrogen content was converted to protein content by using the conversion
factor 6.25 (Horwith, & Latimer, 2005).
Lipids. A Soxtec Sistem HT 1043 Extraction Unit Tecator (Fisher-Scientific, Madrid,
Spain) was used. The crude fat was determined by extracting 0.5 g of freeze-dried
sample with petroleum ether. Containers were removed and dried at 105 ºC, cooled and
weighted.
Ash content and mineral composition. The method 930.05 of AOAC procedures was
used (Horwith & Latimer 2005). A sample of 500 mg was incinerated with high
pressure in a microwave oven (Muffle Furnace mls1200, Thermo scientific, Madrid,
Spain) for 24 h at 550 ºC, and ashes were gravimetrically quantified. The residue of
incineration was extracted with HCl (50% v/v) and HNO3 (50% v/v) and made up to an

appropriate volume with distilled water, where Fe, Cu, Mn and Zn were directly
measured. An additional 1/10 (v/v) dilution of the sample extracts and standards was
performed to avoid interferences between different elements in the atomic absorption
spectroscopy: for Ca and Mg analysis in 1.16% La2O3/HCl (leading to LaCl2); for Na
and K analysis in 0.2% CsCl. All measurements were performed in atomic absorption
spectroscopy (AAS) in Analyst 200 Perkin Elmer equipment (Perkin Elmer, Waltham,
MA, USA), comparing absorbance responses with > 99.9% purity analytical standard
solutions for AAS made with Fe (NO3)3, Cu (NO3)2, Mn (NO3)2, Zn (NO3)2,. NaCl,
KCl, CaCO3 and Mg band, supplied by Merck (Darmstadt, Germany) and Panreac
Química (Barcelona, Spain).
2.4. Hydrophilic phytochemicals: Vitamin C, organic acids, total phenolics and
flavonoids
Vitamin C (AA and DHAA), as well as individual organic acids (oxalic, glutamic,
malic, citric and fumaric acids), were determined based on protocols described by
Sánchez-Mata et al. (2012), using an HPLC-UV methodology after samples extraction
with 4.5% m-phosphoric acid. The HPLC equipment used was a liquid chromatograph
(Micron Analítica, Madrid, Spain) equipped with an isocratic pump (model PU-II), an
AS-1555 automatic injector (Jasco, Easton, MD, USA), a Sphereclone ODS (2) 250 x
4.60, 5 µm Phenomenex column, and a UV-visible detector (Thermo Separation Specta
Series UV100; Thermo Scientific, Madrid, Spain) at 245 nm for AA or 215 nm for
organic acids. The mobile phase was 1.8 mM H2SO4 (pH = 2.6), with a flow rate of 0.9
mL/min for AA or 0.4 mL/min for organic acids. All data was analysed using Biocrom
2000 3.0 software (Biocrom, Madrid, Spain). The compounds were identified by
chromatographic comparisons with authentic standards (AA, oxalic, malic, citric and

fumaric acids all from Sigma, St. Louis, MO, USA), and glutamic acid (Merck,
Darmstadt, Germany) using linear calibration curves of all compounds for
quantification purposes. Vitamin C and organic acids content were expressed in mg/100
g of fresh weight (fw).
Total phenolics were estimated based on procedures described by Wolfe, Wu & Liu
(2003) with some modifications. An aliquot of the extract solution (0.5 mL) was mixed
with Folin–Ciocalteu reagent (2.5 mL, previously diluted with water 1:10 v/v) and
sodium carbonate (75 g/L, 2 mL). The tubes were vortexed for 15 s and allowed to
stand for 30 min at 40°C for colour development. Absorbance was then measured at 765
nm (AnalytikJena 200 spectrophotometer, Jena, Germany). Gallic acid was used to
calculate the standard curve (0.05–0.8 mM), and the results were expressed as mg of
gallic acid equivalents (GAE) per g of extract.
Flavonoids content was determined using the method of Jia, Tang & Wu (1999), with
some modifications. An aliquot (0.5 mL) of the extract solution was mixed with
distilled water (2 mL) and subsequently with NaNO2 solution (5%, 0.15 mL). After 6
min, AlCl3 solution (10%, 0.15 mL) was added and allowed to stand further 6 min,
thereafter, NaOH solution (4%, 2 mL) was added to the mixture. Immediately, distilled
water was added to bring the final volume to 5 mL. Then the mixture was properly
mixed and allowed to stand for 15 min. The intensity of pink colour was measured at
510nm. (+)-Catechin was used to calculate the standard curve (0.0156–1.0 mM) and the
results were expressed as mg of (+)-catequin equivalents (CE) per g of extract.
2.4. Lipophilic phytochemicals: tocopherols and fatty acids
Tocopherols content was determined by HPLC-fluorescence following a procedure
previously described by Morales et al. (2012a), using tocol (2.0 µg/mL; 250 µL; Sigma,
St. Louis, MO, USA) as internal standard (IS). The HPLC equipment consisted of an
integrated system with a Smartline pump 1000 (Knauer, Berlin, Germany), a degasser
system Smartline manager 5000, an AS-2057 auto-sampler, an Polyamine II (250 x 4.6
mm) normal phase column from YMC Waters (Dinslaken, Germany) operating at 30°C
(7971 R Grace oven) and a FP-2020 fluorescence detector (Jasco, Easton, MD, USA)
programmed for excitation at 290 nm and emission at 330 nm. The mobile phase used
was a mixture of n-hexane and ethyl acetate (70:30, v/v) at a flow rate of 1 mL/min.
Data was analysed using Clarity 2.4 Software (DataApex; Prague, The Czech
Republic). The compounds were identified by comparisons with authentic α, β, γ and δ-
tocopherol standards (Sigma, St. Louis, MO, USA). Quantification was based on the
fluorescence signal response, using the internal standard method. Tocopherols content
in the samples were expressed in mg/100 g of fresh weight (fw).
For fatty acids analysis, crude fats extracts were subjected to a trans-esterification
procedure according to the procedure previously reported by Morales et al. (2012b).
Individual fatty acids were determined by gas-liquid chromatography with flame
ionization detection (GC-FID)/capillary column. Equipment used was a DANI model
GC 1000 instrument equipped with a split/splitless injector, a FID (at 260ºC) and a
Macherey-Nagel column (30 m × 0.32 mm ID × 0.25 µm df). The oven temperature
program was as follows: the initial temperature of the column was 50 ºC, held for 2
min, then a 30ºC/min ramp to 125ºC, 5ºC/min ramp to 160ºC, 20ºC/min ramp to 180 ºC,
3ºC/min ramp to 200ºC, 20ºC/min ramp to 220 ºC and held for 15 min. The carrier gas
(hydrogen) flow-rate was 4.0 mL/min (0.61 bar), measured at 50ºC. Split injection
(1:40) was carried out at 250ºC. Fatty acid identification was made by comparing the
relative retention times of FAME (fatty acids methyl ester) peaks from samples with
standards. The results were recorded and processed using CSW DataApex 1.7 software

(DataApex, Prague, The Czech Republic) and expressed in relative percentage of each
fatty acid.
2.5. Antioxidant activity assays
Extracts preparation. The sample (1 g of freeze-dried powder) was extracted by stirring
with 40 mL of methanol at 25°C for 1 h and filtered through Whatman No. 4 filter
paper. The residue was then extracted with an additional 40 mL portion of methanol.
The combined methanolic extracts were evaporated under reduced pressure (rotary
evaporator Büchi R-210, Flawil, Switzerland), re-dissolved in methanol at a
concentration of 5 mg/mL, and stored at 4°C for further use.
DPPH radical-scavenging activity. This methodology was performed using an ELX800
Microplate Reader (Bio-Tek Instruments, Inc.; Winooski, VT, USA), according to
Morales et al. (2012a) The reaction mixture in each one of the 96-wells consisted of one
of the different concentrations of the extracts (30 µL) and aqueous methanolic solution
(80:20 v/v, 270 µL) containing DPPH radicals (6×10⁻⁵ mol/L). The mixture was left to
stand for 60 min in the dark. The reduction of the DPPH radical was determined by
measuring the absorbance at 515 nm. The radical-scavenging activity (RSA) was
calculated as a percentage of DPPH discolouration using the equation: %RSA = [(ADPPH
- AS)/ADPPH] × 100, where AS is the absorbance of the solution when the sample extract
has been added at a particular level, and ADPPH is the absorbance of the DPPH solution.
The extract concentration providing 50% of radicals scavenging activity (EC50) was
calculated from the graph of RSA percentage against extract concentration. Trolox was
used as standard.
Reducing power. Different concentrations of the extracts (0.5 mL) were mixed with
sodium phosphate buffer (200 mmol/L, pH 6.6, 0.5 mL) and potassium ferricyanide

(1% w/v, 0.5 mL). The mixture was incubated at 50 °C for 20 min, and trichloroacetic
acid (10% w/v, 0.5 mL) was added. The mixture (0.8 mL) was poured in the 48-wells,
as also deionised water (0.8 mL) and ferric chloride (0.1% w/v, 0.16 mL), and the
absorbance was measured at 690 nm in the Microplate Reader described above
(Morales et al., 2012a). The extract concentration providing 0.5 of absorbance (EC50)
was calculated from the graph of absorbance at 690 nm against extract concentration.
Trolox was used as standard.
Inhibition of β-carotene bleaching. The evaluation of β-carotene bleaching inhibition
assay is based on the non-specific oxidation of linoleic acid, catalyzed by heat (50ºC),
following a procedure previously described by Morales et al. (2012a). The addition of
an extract containing antioxidants promotes a decolouration delay of β-carotene by the
inhibition of the oxidation of linoleic acid. Two millilitres of β-carotene solution (0.2
mg/mL, w:v in chloroform) were transferred into a round-bottom flask and chloroform
was removed at 40°C under vacuum. Linoleic acid (40 mg), Tween 80 emulsifier (400
mg), and distilled water (100 mL) were added to the flask shaking vigorously. Aliquots
(4.8 mL) of this emulsion were transferred into test tubes containing different
concentrations of the extracts (0.2 mL) and zero time absorbance was measured at 470
nm. Then tubes were incubated at 50°C in a shaking water bath. β-Carotene bleaching
inhibition was calculated using the following equation:
β-Carotene bleaching Inhibition ratio (%) = absorbance after 2 h of assay/initial
absorbance) × 100.
Thiobarbituric acid reactive substances (TBARS) assay. A solution of pig cerebral
tissue homogenate was obtained according to the procedure reported by Morales et al.
(2012a). An aliquot (0.1 mL) was incubated with the different concentrations of the
extracts (0.2 mL) in the presence of FeSO4 (10 µM; 0.1 mL) and ascorbic acid (0.1 mM;

0.1 mL) at 37 °C for 1 h. The reaction was stopped by the addition of trichloroacetic
acid (28% w/v, 0.5 mL), followed by thiobarbituric acid (TBA, 2% w/v, 0.38 mL), and
the mixture was then heated at 80°C for 20 min. After centrifugation at 3000g for 10
min, the colour intensity of the malondialdehyde (MDA)–TBA complex in the
supernatant was measured by its absorbance at 532 nm. The inhibition ratio (%) was
calculated using the following formula, where A and B were the absorbance of the
control and the extract solution, respectively.
TBARS Inhibition ratio (%) = [(A×B)/A] × 100 (2)
The extract concentration providing 50% of lipid peroxidation inhibition (EC50) was
calculated from the graph of TBARS inhibition percentage against extract
concentration.
2.6. Plant production estimations
Yield estimations were carried out in the same two wild populations where the samples
for analysis were gathered (Fig. 1). Two variables were measured: production per plant
and plant abundance. As previously commented, a minimum of 25 randomly selected
individuals from each site were collected, prepared for consumption and immediately
weighed in a field scale. These data were used to calculate the mean production per
plant. We also measured its pseudostem diameter at the bottom of the leaves with an
electronic calibre to determine the size of the collected plants.
Plant abundance was assessed through more than 25 transects of 25 x 2 m randomly
located at the sampling areas. Since the wild leek is a perennial plant, this estimation
was only carried out in the second year of study.
The combination of these two variables was used to estimate the edible production per
hectare, by multiplying average individual yield data by the average plant density of the

species, assuming that all the plants counted in the transects would reach harvestable
sizes.
2.7. Statistical analysis
In nutritional studies, results were statistically analysed using the Statgraphics Plus 5.1
software. Analysis of variance (ANOVA), followed by Duncan`s test, was conducted to
analyze data at the 95% confidence level. Moreover, multivariable analysis, Principal
Components Analysis (PCA), was performed among all the variables considered.
Production data were expressed as mean value ± standard error (SE) of fresh weight at
harvest. Between-site variability on the average values was analysed using the software
package SPSS v. 16.0. Since yield data were not normally distributed (Kolmogorov-
Smirnov test) and there was not variance homogeneity among groups (Levene test), we
used the non-parametric Mann-Whitney U test.
3. Results and discussion
3.1. Nutritional evaluation
As shown in Table 1, the wild leek showed low acidity (14.35 mL N/10 NaOH per 100
g) and pH values relatively low and stable (5.49-6.09). It showed moisture content
around 78%, between those of the cultivated leek (A. porrum, 86%) and garlic (A.
sativum, 64%) (Souci, Fachmann & Kraut, 2008).
Carbohydrates composition was mainly characterized by TAC (16.60 g/100 g) and
dietary fiber (4.23 g/100 g as an average value). Both parameters showed between-site
and between-year (P<0.05) variability, especially for TAC concentration. The wild leek
presented higher TAC (16.60 g/100 g) than other wild leafy vegetables (García-Herrera,
2014), which is consistent to the fact that bulbs, in contrast to leaves, are reserve tissues
and a higher TAC content would be expected in these subterranean organs. TAC values

were also higher than those reported by Carnovale et al. (1989) for A. sativum and A.
porrum (11.2 g/100 g and 6.75 g/100 g, respectively). Wild leek can be considered an
interesting source of dietary fiber (with 4.23% as average value), since a 100 g portion
can provide 11.21% of the daily amount required for men and 20.29% of the daily
amount required for women, according to the reccomendations of the Food Nutrition
Board (Trumbo, Schlicker, Yates & Poos, 2002). Moreover, the average fiber content of
wild leek was higher than the levels found in other cultivated species of this genus, such
as A. porrum (2.9%) (Souci, Fachmann & Kraut, 2008).
Regarding protein content, the global average values obtained in the wild leek (1.67
g/100 g) were in an intermediate position between those of A. sativum and A. porrum
(0.9 g/100 g and 2.1 g/100 g, respectively). Similarly, the total lipids content of wild
leek (0.18 g/100 g), was close to those of A. porrum and A. sativum (0.1-0.6 g/100 g).
Energy content (Table 1) was calculated according to Regulation (EC) No 1169/2011 of
the European Parliament and of the Council, of 25 October 2011, on the provision of
food information to consumers, obtaining a global average of 78.92 kcal/100 g; this
energy value seems to be influenced mainly by TAC, the main macronutrient of the
bulb. The studied samples presented lower energy content than A. sativum (139
kcal/100 g) (Souci, Fachmann & Kraut, 2008).
A. ampeloprasum standed out by its K content, around 309.37 mg/100 g (Table 1),
which was in the same range than other leafy vegetables such as Beta vulgaris L.,
Lactuca sativa L. and Spinacia oleracea L. with values around 336, 208 and 400
mg/100 g, respectively (Guil-Guerrero, Gímenez-Martínez & Isasa, 1998), and higher
than that of cultivated leek (A. porrum), with 279 mg/100g.
The Ca and Fe content of wild leek (30.24 to 81.7 mg/100 g and 0.20 to 0.92 mg/100 g,
respectively) were in the same range than the values reported for A. porrum that

presents average Ca content of 63 mg/100 g, and Fe of 0.81 mg/100 g (Souci,
Fachmann & Kraut, 2008), whereas Zn content of wild leek (0.75 mg/100 g) was higher
than those from other cultivated edible greens such as Beta vulgaris, Lactuca sativa, and
Spinacia oleracea (Elmadfa et al., 1989). It is well known that the absorption of calcium
of plant origin is impaired by the presence of some calcium-binding substances such as
oxalic acid, which promotes the formation of insoluble calcium oxalates, and may be
present in high proportions in leafy vegetables; the relation between the oxalic acid and
Ca content of the samples analysed is discussed below.
Overall, variations in chemical composition of wilds leek, as in other plant tissues may
be due to the multiple influence of different factors such as temperature, precipitation,
sun exposure, soil composition, growing status, and the interaction of other plants or
animals in the ecosystem. Wide intra-species variability was mainly found in
carbohydrates (closely implicated in plant metabolism, so little differences in growing
status, may lead to differences in carbohydrates contents) and mineral elements (highly
influenced by environmental conditions such as soil composition, among other factors).
A principal component analysis (PCA) was performed reducing the multidimensional
structure of the data, which provided a two-dimensional map for explaining the
observed variance (Figure 2). The two components of the PCA performed explain 89%
of the total variance (67.26% first, 21.83% second). The first principal component is
highly correlated to moisture and K, Cu, Fe and pH variables (positive correlation), and
negatively correlated with carbohydrates (CH), fiber and proteins. The second principal
component is correlated to Zn content and AT; Ca followed by Mg also contributed to
the formation of this second component in a minor degree, being Mn negatively
correlated. As it can be seen, Site 1-07 following by Site 2-07 are characterized by first
principal component (positive and negatively respectively) while Site 1-08 by second

principal component, which statistically confirmed the observations in the presented
data.
3.2. Phytochemicals and antioxidant activity
Many of the compounds found in wild leek may have a protective role against various
diseases due to their antioxidant activity, being able to chelate metals or to delocalize
the electronic charge coming from free radicals (Seabra et al., 2006). The nutritional
interest of ascorbic acid (AA) comes not only from its activity as vitamin C, in
conjunction with its oxidized form, dehydroascorbic acid (DHAA), but also because it
is a potent antioxidant either in the food or in the human body, destroying oxygen free
radicals. Total vitamin C showed fluctuations in A. ampeloprasum edible parts (Table
1), ranging between 2.37 - 11.54 mg/100 g. This is attributable to the extreme
sensitivity of AA to UV radiation, temperature and oxygen, which may produce wide
variations due to differences in ambient factors. In all the samples AA was the major
vitamin form, with a global average of 4.30 mg/100 g, being around double of DHAA
content (2.14 mg/100 g). Comparing with its relatives, A. ampeloprasum showed similar
values to those found in cultivated leek (A. porrum) with 5.15 mg/100 g (Tsouvaltzis,
Gerasopoulos & Siomos, 2007) or those reported by Bernaert et al. 2012 (0.89 – 3.55
mg/g dw), as well as in A. sativum bulbs (14 mg/100 g, Souci, Fachmann & Kraut,
2008).
Other organic acids, closely related to AA biosynthesis metabolism could provide
synergistic effects with AA antioxidant properties (Barceló-Coll, Nicolas-Rodrígo,
Sabater-García & Sánchez-Tamés, 2005). Kirk-Othmer (2007) reported that oxalic acid
(OA) is able to recover AA from ascorbic free radical formed after its antioxidant action
against different radicals and/or oxidative processes. Total organic acids average
content in the wild leek analyzed was 310 mg/100 g. It is a low content, compared to

other wild plants previously studied by the authors (Sánchez-Mata et al., 2012; Tardío et
al., 2011; Morales et al., 2013). Malic acid (MA, Table 1) was the main organic acid in
the wild leek (132.86 mg/100 g), follow by oxalic acid (91.65 mg/100g), glutamic acid
(51.67 mg/100g) and citric acid (38.86 mg/100g), while succinic acid was the minor
organic acid found in the samples analyzed (2.14 mg/100g).
Some authors (Guil et al., 1996) recommended an OA/Ca relation not higher than 2.5 in
foods to avoid a decrease of Ca availability. In the present study, oxalic acid/Ca ratio
was 1.18, so oxalic acid (around 80 mg/100 g) is not considered as a relevant factor
decreasing Ca availability in this plant food.
Average total phenolics and flavonoids of wild leek is 5.77 mg GAE/g extract and 0.86
mg CE/ g extract, respectively (Table 2), which are low values, compared to other wild
vegetables (Morales et al., 2012b, 2013), and is in agreement with the values reported
by Bernaert et al. (2012), lower than the data of Proteggent et al. (2002) and Gorinstein
et al., 2009; Kahkonen et al., 1999; Kim, Cho & Han, 2013 for other Allium species, and
higher than the contents reported by Tsouvaltzis, Gerasopoulos & Siomos (2007) for A.
porrum (0.369 mg GAE/g extract).
Allium cepa presented higher flavonoid contents (1.31 mg CE/g extract), while A.
sativum presented lower concentrations for these compounds (0.56 mg CE/g extract) as
reported by Gorinstein et al. (2009). Moreover, Santas, Carbó, Gordon & Almajano
(2008) reported values around 2.58 mg GAE/g extract for calçot, a variety of A. cepa
traditionally consumed in the north-east of Spain, which has levels slightly lower than
those of the wild leek analyzed herein.
Regarding lipophilic bioactive compounds, as far as we know, this is the first report on
tocopherols composition in wild leek, with values of 0.05 mg/100 g of total tocopherols,
being α-tocopherol the major form (0.03 mg/100 g). In all cases, wild leek presented

lower values comparing with those reported for its cultivated relatives, A. sativum and
A. porrum, whith a total tocopherol content of 100 and 547 µg/100 g, respectively
(Souci, Fachmann & Kraut, 2008).
At least twenty individual fatty acids were identified in wild leek edible parts (Table 3).
Saturated fatty acids (SFA) provide 38.23% of total fatty acids, being palmitic acid (PA,
C16:0) the major one (26.42%) followed by C18:0 and C22:0 (3.30 and 2.75%,
respectively). MUFA provided only 7.61%, being oleic acid (C18:1n9) the major fatty
acid (7.39%). PUFA was the major fraction in wild leek lipids, around 54.16%, with
almost all corresponding to linoleic acid (LA, C18:2n6), which represents 53.45% of
total fatty acids in this vegetable. PUFA/SFA ratio was also calculated, being higher
than 0.45, which considered a good ratio.
Different in vitro assays were performed since each one has specific targets within the
matrix, so there is not one method that can provide unequivocal results (Stratil, Klejdus
& Kuban (2006); Carocho & Ferreira, 2013). DPPH and ferric reducing power assays
were applied to evaluate total antioxidant capacity, obtaining EC50 values ranging
between 15.12 and 0.70 mg/mL of sample methanolic extract, respectively. On the other
hand, β-carotene bleaching inhibition and TBARS assays were used for lipid
peroxidation inhibit on evaluation. In wild leek this ass, giving values around 1.66 and
0.11 mg/mL of extract, respectively.
Comparing the results of antioxidant activity with other wild edible greens characteristic
of the Mediterranean area, A. ampeloprasum has a low antioxidant activity measured by
DPPH and inhibition of β-carotene bleaching, and a moderate-high antioxidant activity
measured by TBARS and reducing power methods, comparable to Foeniculum vulgare
Mill. aerial parts, and much higher than Taraxacum obovatum (Willd.) DC. (Morales et
al., 2014).

3.3. Plant production estimations
Table 4 shows a summary of the yield parameters measured for estimating the natural
production of A. ampeloprasum in the two sites along the different seasons.
The average weight of A. ampeloprasum during the three years of study was 10.77 ±
0.61 g per plant at Site 1 and 16.91 ± 1.07 g at Site 2, which corresponded to individuals
of 8.49 ± 0.24 mm and 11.06 ± 0.31 mm of mean diameter at the bottom of the leaves,
respectively. Significant differences were recorded between locations, probably due to
ecological variables such as weather conditions, land uses and soil characteristics. The
Site 2 population provided individuals of higher weight presumably because sampling
was carried out in agricultural areas where the plants reached a bigger size.
Nevertheless, the production was relatively stable, since all the samples showed a low
dispersion rate, with CVs of 50-60%.
Plant density values in these areas ranged from 11,552 to 23,350 individuals per
hectare, showing the highest figures at Site 2. According to these data, we estimated a
total yield per area of habitat of 273.00 ± 15.44 kg/ha at Site 1 and 195.31 ± 12.39 kg/ha
at Site 2.
4. Conclusions
The wild leek can be considered a low energy food, and a good source of fiber and zinc
compared to its cultivated relatives and other conventional vegetables. Its edible parts
showed a high percentage of PUFA, being LA the main fatty acid (53% of total fatty
acids). Additionally, natural yield of this species, although lower than other cultivated
Allium species, was found to be stable and well-adapted to human-disturbed
environments. For these reasons, this non-conventional wild bulb should be revalorised

as a good alternative to increase the diversity of vegetables consumed and enhance the
quality of current occidental diets.
Acknowledgments
Research funding was obtained from ERDF and the Spanish Ministry of Education and
Science (CGL2006-09546/BOS). The authors are also grateful to Fundação para a
Ciência e a Tecnologa (FCT, Portugal) and COMPETE/QREN/EU for financial support
to CIMO (strategic project PEst-OE/AGR/UI0690/2011). P. García-Herrera thanks to
the Spanish Ministry of Education and Science for her UCM predoctoral fellowship. We
also thank to Ramón Morales, Laura Aceituno, and Susana González for their
collaboration in the gathering and preparation of the samples, and also to Carmen Díez
for her support in mineral analysis.
References
AOAC (2006). Official methods of analysis (18th ed.). Arlington Virginia: AOAC
International.
Aedo, C. (2013). Allium L. In S. Talavera, C. Andrés, M. Arista, M. P. Fernández
Piedra, E. Rico, M. B. Crespo, A. Quintanar, A. Herrero, & C. Aedo (Eds.),
Flora iberica. Volume XX. (pp. 220-273). Madrid: CSIC.
Al-Qura'n, S.A. (2010). Ethnobotanical and Ecological Studies of Wild Edible Plants in
Jordan. Libyan Agriculture Research Center Journal International, 1(4), 231–
243.
Bernaert, N., Paepe, D., Bouten, C., Clercq, H., Stewart, D., Van Bockstaele, E., De
Loose, M., & Van Droogenbroeck, B. (2012). Antioxidant capacity, total

phenolic and ascorbate content as a function of the genetic diversity of leek
(Allium ampeloprasum var. porrum). Food Chemistry, 134, 669–677.
Carnovale, E. & Miuccio, F. (1989). Tabelle di composizione degli alimenti. Istituto
Nazionalle della nutrizione. Milano: Litho Delta.
Carocho, M., & Ferreira, I.C.F.R. (2013). A review on antioxidants, prooxidants and
related controversy: natural and synthetic compounds, screening and analysis
methodologies and future perspectivas. Food and Chemical Toxicology. 51, 15–
25.
Dogan, Y. (2012). Traditionally used wild edible greens in the Aegean Region of
Turkey. Acta Societatis Botanicorum Poloniae, 81(4), 329–342.
Elmadfa, I., Aign, W., Muskat, E., Fritzsche, D., & Cremer, H. (1989). Die Grosse GU
Nahrwert Tabelle. Barcelona: Integral
Garcia-Herrera, P. (2014). Plantas silvestres de consumo tradicional en españa.
Caracterización de su valor nutricional y estimación de su actividad antifúngica.
Ph Dissertation. Madrid: Universidad Complutense de Madrid.
Govaerts, R. (1995). World Checklist of Seed Plants. (vols. 1) Deurne: MIM.
Gorinstein, S., Park, Y.S., Heo, B.G., Namiesnik, J., Leontowicz, H., & Leontowicz, M.
(2009). A comparative study of phenolic compounds and antioxidant and
antiproliferative activities in frequently consumed raw vegetables. European
Food Research and Technology, 228, 903–911.
Greenfield, H. & Southgate, D.A.T. (2003) Food Composition Data: Production,
Management, and Use. FAO, Rome.

Guil, J.L., Torija, M.E., Giménez, J.J., Rodríguez-García, I., & Jiménez, A. (1996).
Oxalic acid and calcium determination in wild edible plants. Journal of
Agricultural and Food Chemistry, 44 (7), 1821–1823.
Guil-Guerrero, J.L., Giménez Martínez, J.J., & Torija Isasa M.E. (1998). Mineral
nutrient composition of edible wild plants. Journal of Food Composition and
analysis, 11, 322–328.
Guarrera, P.M., & Savo, V. (2013). Perceived health properties of wild and cultivated
food plants in local and popular traditions of Italy: A review. Journal of
Ethnopharmacology, 146 (3), 659–680.
Hanelt, P. & Institute of Plant Genetics and Crop Plant Research (2001). Mansfeld's
Encyclopedia of Agricultural and Horticultural Crops. Berlin, Heidelberg, New
York: Springer-Verlag.
Hirschegger, P., Jakše, J. Trontelj, P., & Bohanec, B. (2010). Origins of Allium
ampeloprasum horticultural groups and a molecular phylogeny of the section
Allium (Allium: Alliaceae). Molecular Phylogenetics and Evolution, 54(2),
488–497.
ITIS (2014). ITIS, the Integrated Taxonomic Information System. http://www.itis.gov,
last accessed: February, 2014.
Jia, Z., Tang, M., & Wu, J. (1999). The determination of flavonoid contents in mulberry
and their scavenging effects on superoxide radicals. Food Chemistry, 64, 555–
559.
Kahkonen, M.P., Hopia, A.I., Vuorela, H.J., Rauha, J.P., Pihlaja, K., & Kujala, T.S.,
(1999). Antioxidant activity of plant extracts containing phenolic compounds.
Journal of Agricultural and Food Chemistry, 47, 3954–3962.

Khanum, F., Anilakumar, K.R., & Viswanathan, K.R. (2004). Anticarcinogenic
properties of garlic: a review. Critical Review of Food Science Nutrition, 44(6),
479–88.
Mohammadi, P., Shoaie, N., Ghazanfari, T., & Mohammadi, S.R. (2012). Evaluation of
antibiofilm activity of Allium sativum extract against biofilm formed by Isolated
Candida sp from urinary catheters. Mycoses, 55, 95–96.
Morales, P., Ferreira, I.C.F.R., Carvalho, A.M., Sánchez-Mata, M.C., Cámara, M., &
Tardío, J. (2012a). Fatty acids profile of some Spanish wild vegetables. Science
of Food and Agriculture. 18 (3), 281–290.
Morales, P., Carvalho, A.M., Sánchez-Mata, M.C., Cámara, M., Molina, M., & Ferreira,
I.C.F.R. (2012b). Tocopherol composition and antioxidant activity of Spanish
wild vegetables. Genetic Resources and Crop Evolution, 59 (5), 851–863
Morales, P., Ferreira, I.C.F.R., Carvalho, A.M., Sánchez-Mata, M.C., Cámara, M.,
Fernández-Ruiz, V., Pardo-de-Santayana, M., & Tardío, J. (2014).
Mediterranean non-cultivated vegetables as dietary sources of compounds with
antioxidant and biological activity. LWT - Food Science and Technology, 55 (1),
389-396.
Osbaldeston, T.A. (2000). The Herbal of Dioscorides The Greek. Johannesburg, South
Africa: IBIDIS Press.
Picchi, G., & Pieroni, A. (2005). Atlante dei prodotti tipici: Le erbe. Agra, RAI-Eri,
Roma, Italy.
Pietta, P. (2000). Flavonoids as antioxidants. Journal of Natural Products, 63, 1035–
1042.
Regulation (EC) No 1169/2011 of the European Parliament and of the Council, of 25
October 2011, on the provision of food information to consumers. Official
Journal of the European Union. 22.11.2011. L 304/18- 63.
Sánchez-Mata, M.C., Cabrera-Loera, R.D., Morales, P., Fernández-Ruiz, V., Cámara,
M., Díez-Marqués, C., Pardo-de-Santayana, M., & Tardío, J. (2012). Wild
vegetables of the Mediterranean area as valuable sources of bioactive
compounds. Genetic Resources and Crop Evolution, 59, 431–443.
Santas, J., Carbo, R., Gordon, M.H., & Almajano, M.P. (2008). Comparison of the
antioxidant activity of two Spanish onion varieties. Food Chemistry, 107, 1210–
1216.
Seabra, R.M., Andrade, P.B., Valentão, P., Fernandes, E., Carvalho, F., & Bastos, M.L.
(2006). Anti-oxidant compounds extracted from several plant materials. In
Biomaterials from aquatic and terrestrial organisms. New Hampshire: Science
Publishers – Enfield (NH) Jersey Plymouth
Simopoulos, A.P. (2002). The importance of the ratio of omega-6/omega-3 essential
fatty acids. Biomed Pharmacotherapy, 56, 365–379.
Souci, S.W., Fachmann, W., & Kraut, H. (2008). Food composition and nutrition tables.
Stuttgart: Medpharm Scientific Publishers,.
Stratil, P., Klejdus, B., & Kuban, V. (2006). Determination of total content of phenolic
compounds and their antioxidant activity in vegetables – Evaluation of
spectrophotometric methods. Journal of Agricultural and Food Chemistry,
54(3), 607–616.
Tardío, J., Pardo-de-Santayana, M., & Morales, R. (2006). Ethnobotanical review of
wild edible plants in Spain. Botanical Journal of the Linnean Society, 152(1),
27–72.
Tardío, J., Molina, M., Aceituno-Mata, L., Pardo-de-Santayana, M., Morales, R.,
Fernández-Ruiz, V., Morales, P., García, P., Cámara, M., & Sánchez-Mata, M.
C. (2011). Montia fontana L. (Portulacaceae), an interesting wild vegetable
traditionally consumed in the Iberian Peninsula. Genetic Resources and Crop
Evolution, 58, 1105–1118.
Tsouvaltzis, P., Gerasopoulos, D., & Siomos, A.S. (2007). Effects of base removal and
heat treatment on visual and nutritional quality of minimally processed leeks.
Postharvest Biology and Technology, 43, 158–164.
Triano, E.C., Ruiz Cabello, E., Fernández Luque, A., Gómez Miranda, A., Jiménez
Conejo, A., Gutiérrez Campaña, J.A., Postigo, J:A:, Castro Montes, J., Sánchez
Najarro, J.F., Marín Osuna, J.R., Martos, M., Mérida Moral, M.D., Mérida
Ramírez, M.J., Moral, R., & Hinijosa, R. (1998). Recupera tus tradiciones.
Etnobotánica del Subbético Cordobés. Ayuntamiento de Carcabuey. Córdoba:
Carcabuey.
Trumbo, P., Schlicker, S., Yates, A.A., & Poos, M. (2002). Dietary reference intakes for
energy carbohydrate, fiber, fat, fatty acids, cholesterol, protein and amino acids.
Journal of the American Dietetic Association, 102 (11), 1621–1630.
Wolfe, K., Wu, X., & Liu, R.H. (2003). Antioxidant activity of apple peels. Journal of
Agricultural and Food Chemistry, 51, 609–614.
World Health Organization Study Group (1990). Diet, Nutrition and the prevention of
chronic diseases. WHO Technical Report Series, 797, 30–39.

Table 1. Chemical and nutritional characterization (mean ± SD, n=3) of Allium ampeloprasum L. edible part.
Proximate composition Sample 1
Sample 2
Sample 3
Sample 4
Global average pH 6.09 ± 0.05 b 5.43 ± 0.04 a 5.91 ± 0.03 b 5.61 ± 0.17 a 5.76 Tritable acidity (mL NaOH/100g fw) 10.04 ± 1.12 a 13.22 ± 0.21a 16.87 ± 2.23 b 17.27 ± 2.27 b 14.35 Moisture (%) 81.50 ± 0.02 d 76.02 ±0.10 a 78.10 ± 0.19 c 77.68 ± 0.17 b 78.32 Total available carbohydrates (%) 12.04 ± 0.48 a 20.92 ± 0.27 c 16.76 ± 1.40 b 16.63 ± 0.93 b 16.60 Proteins (%) 1.20 ± 0.10 a 2.02 ± 0.44 a 1.77 ± 0.25 a 1.64 ± 0.22 a 1.67 Lipids (%) 0.23 ± 0.01 b 0.12 ± 0.00 a 0.14 ± 0.01 a 0.21 ± 0.03 b 0.18 Fiber (%) 3.56 ± 0.10 a 4.72 ± 0.43 c 4.08 ± 0.13 b 4.53 ± 0.14 c 4.23 Energy (Kcal/100g) 59.40 ± 3.02 a 97.87 ± 1.89 c 80.03 ± 6.06 b 77.08 ± 3.06 b 78.92 Ashes (%) 0.97 ± 0.09 c 0.48 ± 0.01 a 0.91 ± 0.01 c 0.79 ± 0.02 b 0.79 K (mg/100 g) 533.19 ± 19.68 d 146.62 ± 2.75 a 294.28 ± 9.20 c 232.87 ± 3.30 b 309.37 Na (mg/100 g) 53.08 ± 10.40 a 48.30 ± 8.45 a 67.14 ± 10.83 a 43.64 ± 9.50 a 54.60 Ca (mg/100 g) 30.24 ± 5.23 a 78.04 ± 7.84 b 81.74 ± 3.98 b 80.13 ± 11.98 b 70.16 Mg (mg/100 g) 8.88 ± 1.08 ª 15.44 ± 0.89 c 16.41 ± 1.64 c 13.50 ± 1.80 b 14.03 Mn (mg/100 g) 0.14 ± 0.01 b 0.15 ± 0.02 b 0.08 ± 0.01 a 0.06 ± 0.00 a 0.11 Fe (mg/100 g) 0.92 ± 0.17 c 0.20 ± 0.02 a 0.69 ± 0.18 bc 0.62 ± 0.10 b 0.60 Zn (mg/100 g) 0.68 ± 0.02 b 0.03 ± 0.00 a 1.67 ± 0.02 c 0.61 ± 0.09 b 0.75 Cu (mg/100 g) 0.22 ± 0.03 c 0.05 ± 0.01a 0.11 ± 0.02 b 0.06 ± 0.01 a 0.11 Ascorbic acid (mg/100 g) 4.23 ± 0.23 b 3.49 ± 0.26 b 7.89 ± 1.17 c 1.58 ± 0.27 a 4.30 Dehydroascorbic acid (mg/100 g) 3.83 ± 0.21 a 1.15 ± 0.16 a 3.16 ± 2.36 a 0.43 ± 0.17 a 2.14 Total vitamin C (mg/100 g) 8.06 ± 0.41 a 4.77 ± 0.01 a 11.54 ± 1.23 b 2.39 ± 0.61 a 6.69 Oxalic acid (mg/100 g) 27.83 ± 1.70 b 15.80 ± 1.99 a 239.47 ± 2.44 d 83.52 ± 1.93 c 91.65 Glutamic acid (mg/100 g) 14.77 ± 0.35 b 5.89 ± 0.64 a 159.78 ± 5.40 d 29.26 ± 9.06 c 51.67
Malic acid (mg/100 g) 18.94 ± 2.10 a 26.00 ± 2.86 b 275.42 ± 5.37 d 211.07 ± 6.67 c 132.86 Citric acid (mg/100 g) 29.43 ± 3.03 a 23.60 ± 3.33 a 58.33 ± 0.04 c 44.10 ± 1.93 b 38.86 Succinic acid (mg/100 g) 3.23 ± 0.38 b 1.06 ± 0.17 a tr tr 2.14
Sample 1 = Site 1, 2007; Sample 2 = Site 2, 2007; Sample 3 = Site 1, 2008; Sample 4 = Site 2, 2008.
Different letters in each row means significant differences between each set of individual samples (P<0.05). tr - traces

Table 2. Phenolics and antioxidant activity of Allium ampeloprasum L. methanolic
extracts (mean ± SD; n=3).
Phenolics
Total phenolics (mg GAE/g extract) 5.70 ± 0.62
Total flavonoids (mg CE/g extract) 0.86 ± 0.05
Antioxidant activity (EC50 values, mg/mL methanolic extract)*
DPPH 15.12 ± 1.21d
Reducing power 0.70 ± 0.12b
β-Carotene bleaching inhibition 1.66 ± 0.24c
TBARS assay 0.11 ± 0.01a
*Different letters means significant differences in the same column (P<0.05).
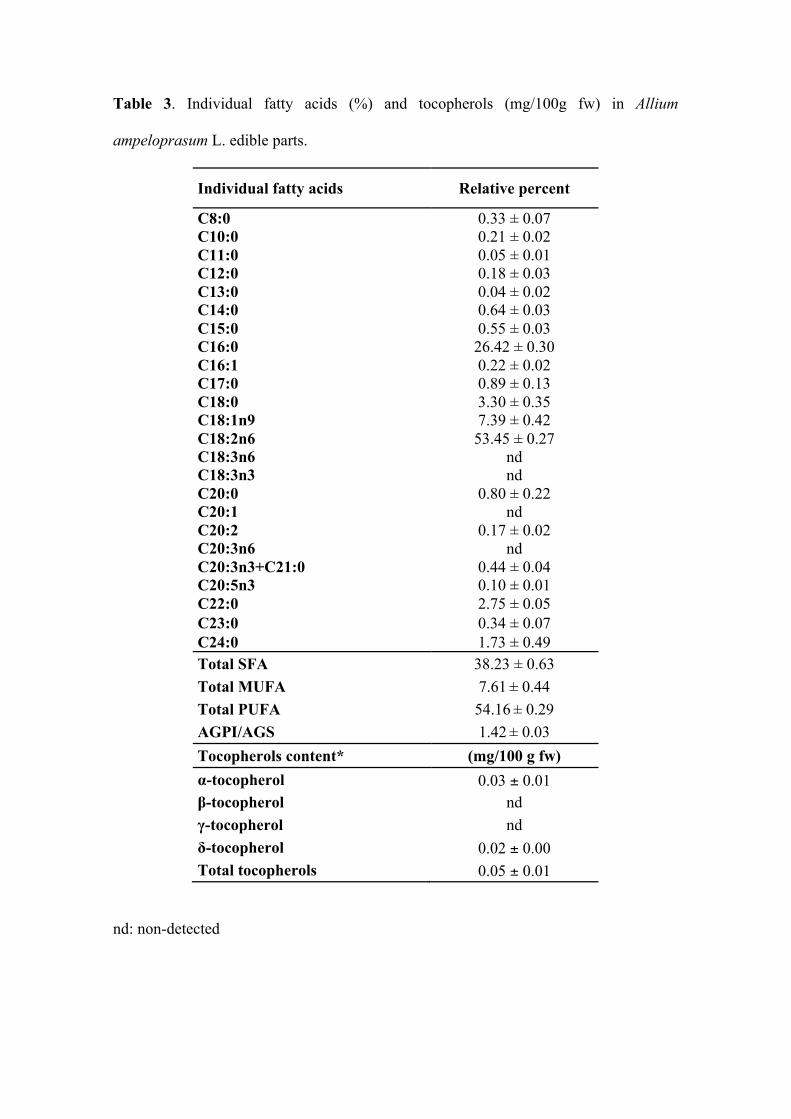
Table 3. Individual fatty acids (%) and tocopherols (mg/100g fw) in Allium
ampeloprasum L. edible parts.
Individual fatty acids Relative percent
C8:0 0.33 ± 0.07 C10:0 0.21 ± 0.02 C11:0 0.05 ± 0.01 C12:0 0.18 ± 0.03 C13:0 0.04 ± 0.02 C14:0 0.64 ± 0.03 C15:0 0.55 ± 0.03 C16:0 26.42 ± 0.30 C16:1 0.22 ± 0.02 C17:0 0.89 ± 0.13 C18:0 3.30 ± 0.35 C18:1n9 7.39 ± 0.42 C18:2n6 53.45 ± 0.27 C18:3n6 nd C18:3n3 nd C20:0 0.80 ± 0.22 C20:1 nd C20:2 0.17 ± 0.02 C20:3n6 nd C20:3n3+C21:0 0.44 ± 0.04 C20:5n3 0.10 ± 0.01 C22:0 2.75 ± 0.05 C23:0 0.34 ± 0.07 C24:0 1.73 ± 0.49 Total SFA 38.23 ± 0.63 Total MUFA 7.61 ± 0.44 Total PUFA 54.16 ± 0.29 AGPI/AGS 1.42 ± 0.03 Tocopherols content* (mg/100 g fw) α-tocopherol 0.03 ± 0.01 β-tocopherol nd γ-tocopherol nd δ-tocopherol 0.02 ± 0.00 Total tocopherols 0.05 ± 0.01
nd: non-detected
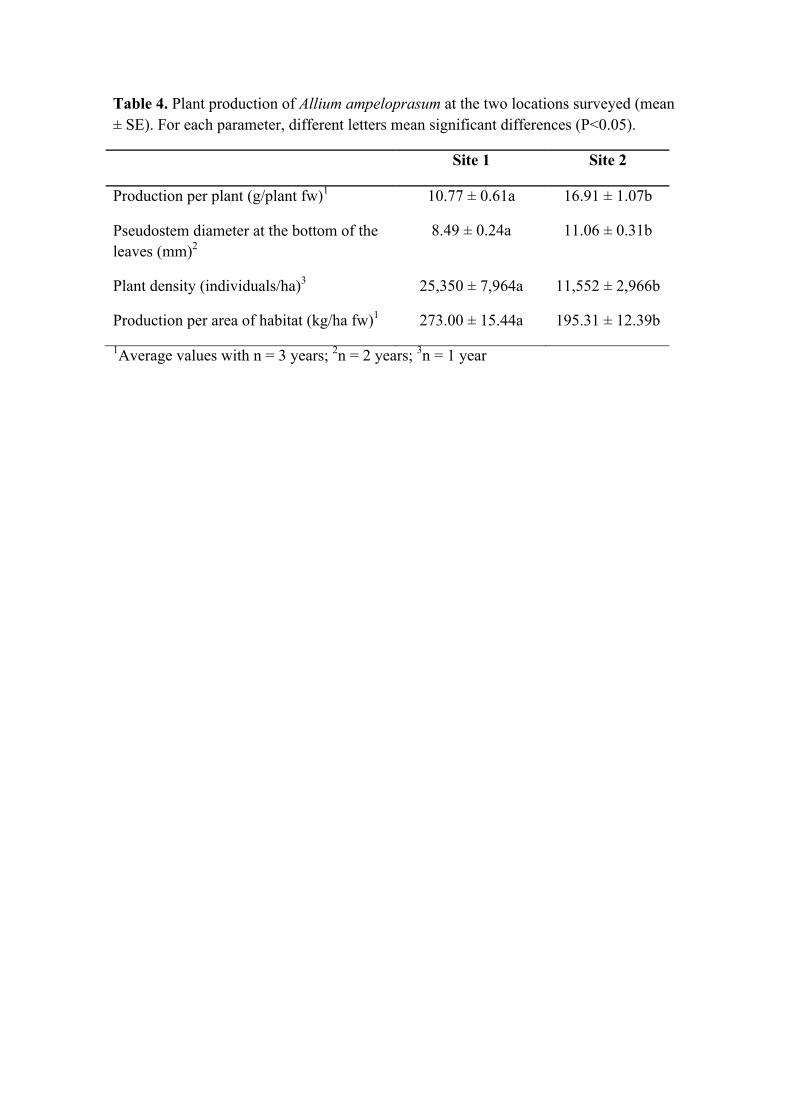
Table 4. Plant production of Allium ampeloprasum at the two locations surveyed (mean ± SE). For each parameter, different letters mean significant differences (P<0.05).
Site 1 Site 2
Production per plant (g/plant fw)1 10.77 ± 0.61a 16.91 ± 1.07b
Pseudostem diameter at the bottom of the leaves (mm)2
8.49 ± 0.24a 11.06 ± 0.31b
Plant density (individuals/ha)3 25,350 ± 7,964a 11,552 ± 2,966b
Production per area of habitat (kg/ha fw)1 273.00 ± 15.44a 195.31 ± 12.39b
1Average values with n = 3 years; 2n = 2 years; 3n = 1 year