
Nutrient Trading in Lake Rotorua: Choosing the Scope of a
39
Nutrient Trading in Lake Rotorua: Choosing the Scope of a Nutrient Trading System Kelly Lock and Suzi Kerr Motu Working Paper 08-05 Motu Economic and Public Policy Research April 2008
Transcript of Nutrient Trading in Lake Rotorua: Choosing the Scope of a
Nutrient Trading in Lake Rotorua: Choosing the Scope of a Nutrient Trading
System
Kelly Lock and Suzi Kerr
Motu Working Paper 08-05 Motu Economic and Public Policy Research
April 2008

Author contact details Kelly Lock Motu Economic and Public Policy Research [email protected] Suzi Kerr Motu Economic and Public Policy Research [email protected]
Acknowledgements This paper has been produced as background to a dialogue process (www.motu.org.nz/nutrient_trading) and is released publicly to facilitate discussion. We would like to thank Environment Bay of Plenty, the Ministry of Agriculture and Forestry, and the Ministry for the Environment for their financial support. We also appreciate feedback from members of the Nutrient Trading Study Group, especially Andrew Wharton, and the research support from Simon Ngawhika. Any opinions expressed are those of the authors and do not reflect the views of the funders or study group. The authors remain responsible for any errors and omissions.
Motu Economic and Public Policy Research PO Box 24390 Wellington New Zealand Email [email protected] Telephone +64-4-939-4250 Website www.motu.org.nz
© 2008 Motu Economic and Public Policy Research Trust and the authors. Short extracts, not exceeding two paragraphs, may be quoted provided clear attribution is given. Motu Working Papers are research materials circulated by their authors for purposes of information and discussion. They have not necessarily undergone formal peer review or editorial treatment. ISSN 1176-2667.
i
Abstract A nutrient trading system is one mechanism that is currently being
considered to control and reduce nutrient loss into Lake Rotorua. However this
may not be the best mechanism for controlling nutrient loss from all sources. A
more comprehensive system improves efficiency and decreases market power
opportunities, but it can also bring increased compliance and administrative costs.
This paper discusses which sources should be included in a nutrient trading
system for Lake Rotorua. It examines existing systems and presents an empirical
analysis to estimate the impact of including different nutrient sources.
JEL classification Q53, Q57, Q58 Keywords Water quality, nutrients, trading, Lake Rotorua
ii

Contents 1 Introduction .....................................................................................................1
1.1 Benefits of a comprehensive system.......................................................2 1.1.1 Provides greater opportunity for efficiency benefits................2 1.1.2 Improves the liquidity of the market........................................5 1.1.3 Limits market power ................................................................5
1.2 Costs of a comprehensive system ...........................................................6 1.2.1 Increases research costs............................................................6 1.2.2 Increased participant’s compliance costs .................................6 1.2.3 Increases administrators’ costs.................................................7
2 Scope of other trading systems........................................................................7 2.1 Lake Taupo Nutrient Trading System.....................................................8 2.2 Quota Management System ....................................................................8 2.3 International nutrient trading markets...................................................10
3 What do we want to do in the Lake Rotorua Catchment? .............................11 3.1 Sources of nutrients entering Lake Rotorua..........................................11
3.1.1 Point sources ..........................................................................13 3.1.2 Non-point sources ..................................................................13
3.2 Thresholds for including different land uses in the trading system ......14 3.3 Analysis of nitrogen distribution from land use sources across parcels15
3.3.1 Dataset creation......................................................................15 3.4 Identifying appropriate thresholds ........................................................17
3.4.1 Horticulture and cropping land ..............................................19 3.4.2 Dairy land...............................................................................20 3.4.3 Pastoral land...........................................................................22 3.4.4 Avoiding undesirable changes in participation over time......22 3.4.5 What about other parcels?......................................................24 3.4.6 Why use parcels? ...................................................................24
4 Summary........................................................................................................25
References ..............................................................................................................27
iv


1 Introduction A variety of policies can be used to control nutrient loss into
waterways, including direct controls on land use activities, compulsory
implementation of mitigation options and nutrient trading systems. Each policy
will be more effective in controlling nutrient loss from some sources than others.
Thus, when implementing a policy, it is important to identify the types of nutrient
sources that the policy will be able to effectively control.
A nutrient trading system is one mechanism that is currently being
considered to control and reduce nutrient loss into Lake Rotorua. This is likely to
be a cost effective method of controlling and reducing nutrient loss from a number
of nutrient sources including pastoral farming. However, it may not be an
effective mechanism for all sources in the catchment.
For water quality in Lake Rotorua to improve, the total amount of
nutrients entering the lake from all sources needs to be controlled. The system
design needs to consider sources both within and outside the trading system to
ensure that the total nutrient cap is not exceeded (see Kerr et al (2007)). The
sources within the nutrient trading system will have their nutrient loss limited by
the trading cap, but sources outside the trading system may or may not have their
nutrient loss controlled. If these sources are ignored by regulation then this is a
lost opportunity to reduce nutrient loss. If they are regulated under separate
regulations then we are not ensuring that the marginal cost of the reductions
equals the market price or that we achieve the efficiency benefits possible from a
comprehensive nutrient trading system. Thus these reductions undertaken outside
the nutrient trading system might be much more expensive than reductions
undertaken by sources within the system.
This paper discusses which sources should be included in a nutrient
trading system for Lake Rotorua. We present benefits and costs associated with a
more comprehensive trading system. We then examine existing systems to
identify the sources that have (and have not) been included in each system. This
includes two New Zealand trading systems (Lake Taupo nutrient trading system
and the Quota Management System (QMS) for managing commercial fisheries)
1

and a brief look at international nutrient trading systems. Finally, we discuss the
options for the Lake Rotorua catchment. We use data provided by Environment
Bay of Plenty (EBOP) to analyse land-based sources of nutrients and provide
insight into the impact of including particular types of land-based sources in the
system.
This paper is part of a series of papers on various aspects of design of a
nutrient trading system for Lake Rotorua. These papers can be found at
www.motu.org.nz/nutrient_trading.
1.1 Benefits of a comprehensive system A comprehensive nutrient trading system is likely to have a number of
benefits as a result of greater opportunities for trade. These benefits could include
improved efficiency, improved market liquidity and decreased market power
opportunities.
1.1.1 Provides greater opportunity for efficiency benefits.
Nutrient trading systems allow the required nutrient loss reductions to
take place in the most cost effective time periods and locations, but only from the
sources that are included in the system. The greatest flexibility and efficiency will
be achieved in a system that includes all sources.
For example, suppose that the cost of reducing nutrient loss through
storm water system upgrades was high but that golf courses could reduce their
nutrient loss at a low cost. If we included both of these sources in the system,
instead of undertaking the expensive nutrient loss reduction option of upgrading
the storm water system, the council could instead pay the golf courses to reduce
their nutrient loss, through purchasing allowances from the golf course. This
would enable the same level of nutrient reductions to be achieved at a much lower
cost. But if storm water and/or golf courses were excluded from the system, the
nutrient reductions cannot move between sources. Thus, the council would face
higher costs to achieve the same level of nutrient loss reductions.
To date, EBOP has identified a number of reduction actions that will
and may be undertaken to reduce nutrient loss and their likely costs (Table 1). For
2

example, the community wastewater reticulation projects could cost up to $460
per kg of nitrogen reduction while the storm water upgrade in Rotorua urban areas
is estimated to cost $348 per kg of nitrogen and $2,098 per kg of phosphorus
reduced. Other actions however, such as Tikitere geothermal, are able to achieve
nutrient loss reductions at a much lower cost ($4 per kg). In contrast, it was
estimated in an earlier version of the draft Lake Rotorua Action Plan (Table 2,
Draft Lake Rotorua and Rotoiti Action Plan, Draft 5, February 2007) that nutrient
reductions through land use and land management change would cost, on average,
$6 per kg.1 This figure has been removed from later drafts of this report but it does
give us a rough estimate of the cost of nutrient reductions achieved through a
nutrient trading system. Even if this prediction of $6 per kg was incorrect by an
order of magnitude and should actually be $60 per kg, a nutrient trading system
would be able to achieve nutrient reductions much more cost effectively than
some of the options already agreed to by the council. For example, at $60 per kg a
nutrient trading system would achieve nutrient reductions for less than 20% of the
cost of achieving the same reductions through the storm water upgrades.2 If
stormwater is not included in the nutrient trading system, the Council does not
have the automatic option of not upgrading the storm water but achieving
equivalent gains by purchasing allowances from others. It would have to justify
its decision on the upgrade in a separate, non-market process which may lead to
an expensive capital project going ahead irrespective of cheaper alternatives.
1 $6 per kg-N was calculated by Environment Bay of Plenty as a budgeted average for expected costs over 10 years. The nutrient reductions from land use/land use management changes are expected to continue beyond 10 years, but total costs are assumed to be capped at $10 million. 2 There may be other reasons for upgrading the storm water system that would lead policy makers to decide to undertake this investment. But in this paper we are only considering the investment that is undertaken to reduce nutrient loss only.
3

Table 1 Comparison of nutrient reductions actions for Lake Rotorua
Cost ($) Time-frame
Action N reduction (T/yr)
P reduction (T/yr)
Per year Per kg
Rotorua Wastewater Treatment Plant upgrade
15 0 $1,484,320 $99 (N) By 2006
Community wastewater reticulation or OSET upgrade for Rotorua
10.8 0.25 $4,990,637 $460 (N) max
By 2014
Storm water upgrades within Rotorua urban
3 0.5 $1,046,080 $348 (N) $2,092 (P)
By 2017
Tikitere geothermal 30 0 $108,200 $4 (N)3 By 2009
Council approved actions
[P flocculation in the Utuhina Stream]
[0]4 [2] $420,000 $210 (P) By 2006
[P flocculation in two other streams]
[0] [4] $840,000 $210 (P) ~
Constructed wetlands N reductions, costs and timeframes will depend on the site and proposal. Further evaluation is required
In-lake/in-stream nutrient removal using biomass
N reductions, costs and timeframes will depend on the site and proposal. Further evaluation is required
Lakebed sediment treatment
05 25 $25 million estimated total cost
~ By 2011
Potential actions
Hamurana Stream diversion to the Ohau Channel
53 (2005)6 92 (2055)7
6.3 $3,030,0008 $57 (‘05) $33 (‘55) $481 (P)
After 2011
Land use management and land use change
170 6 ~ ~ By 2017
Total 228.8 + 53/92 Hamurana
12.75 (inc flocculants) + 25 (lakebed tmt) + 6.3 (Hamurana)
Source: Proposed Lakes Rotorua & Rotoiti Action Plan. Environment Bay of Plenty Environmental Publication 2007/11. Available from www.envbop.govt.nz
3 This cost per kg-N is lower than other actions because the Tikitere geothermal flow has a high nitrogen concentration and low volume, and is close to existing reticulation infrastructure. 4 [#] means that the action is only temporary until long-term land use change/management actions can take effect. 5 Lakebed sediment treatment will reduce N releases, however these are not calculated towards the N reduction target as sediment N releases are excluded (see sections [7] and [9.9] of the draft Action Plan). 6 The ‘true’ N and P reduction for Lake Rotorua is expected to be lower than this. A Hamurana diversion would increase the lake water residence time and decrease oxygenation of bottom waters, thereby increasing the influence of other nutrient sources on in lake nutrient concentration. The actual impact of a Hamurana diversion on Lake Rotorua’s water quality needs a full assessment. 7 This load is expected to increase to 92 tonnes-N/year in 50 years time, and 118 tonnes at ‘steady state’ (> year 2200). See section 5.5 of the draft Lakes Rotorua and Rotoiti Action Plan for more information. 8 Presuming mid-range capital cost = $25 million, maintenance costs $30,000 p.a., 50 year lifespan.
4

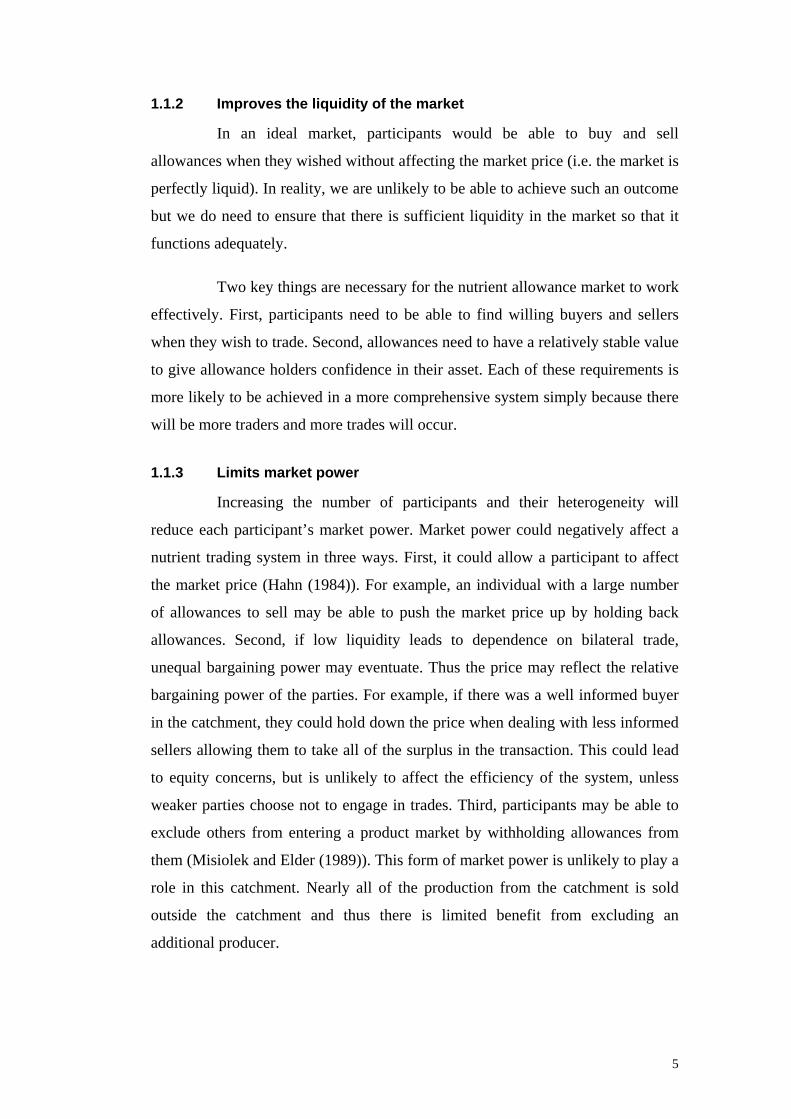
1.1.2 Improves the liquidity of the market
In an ideal market, participants would be able to buy and sell
allowances when they wished without affecting the market price (i.e. the market is
perfectly liquid). In reality, we are unlikely to be able to achieve such an outcome
but we do need to ensure that there is sufficient liquidity in the market so that it
functions adequately.
Two key things are necessary for the nutrient allowance market to work
effectively. First, participants need to be able to find willing buyers and sellers
when they wish to trade. Second, allowances need to have a relatively stable value
to give allowance holders confidence in their asset. Each of these requirements is
more likely to be achieved in a more comprehensive system simply because there
will be more traders and more trades will occur.
1.1.3 Limits market power
Increasing the number of participants and their heterogeneity will
reduce each participant’s market power. Market power could negatively affect a
nutrient trading system in three ways. First, it could allow a participant to affect
the market price (Hahn (1984)). For example, an individual with a large number
of allowances to sell may be able to push the market price up by holding back
allowances. Second, if low liquidity leads to dependence on bilateral trade,
unequal bargaining power may eventuate. Thus the price may reflect the relative
bargaining power of the parties. For example, if there was a well informed buyer
in the catchment, they could hold down the price when dealing with less informed
sellers allowing them to take all of the surplus in the transaction. This could lead
to equity concerns, but is unlikely to affect the efficiency of the system, unless
weaker parties choose not to engage in trades. Third, participants may be able to
exclude others from entering a product market by withholding allowances from
them (Misiolek and Elder (1989)). This form of market power is unlikely to play a
role in this catchment. Nearly all of the production from the catchment is sold
outside the catchment and thus there is limited benefit from excluding an
additional producer.
5

1.2 Costs of a comprehensive system While there are benefits associated with a comprehensive system, there
are also costs in making the system as comprehensive as possible. These costs can
be put into three main categories – costs to undertake necessary research, costs to
individual firms of complying with the system and the administrative costs of
running the system including verifying data and enforcing the system.9
1.2.1 Increases research costs
Within a nutrient trading system, the modelled nutrient loss and
corresponding allowance requirements from each source in the trading system is
calculated using a model (see Kerr and Rutherford (2008)). This model needs to
provide a reasonable estimate of nutrient loss for each type of nutrient source
contained in the system. If the model does not currently provide a reasonable
estimate of the nutrient loss from a particular land use, either the current model
will need to be enhanced so that it does or a new model will need to be developed.
Scientists would need to be funded to complete this work, increasing the research
costs associated with the system.
But by including the additional sources in the nutrient trading system, it
will also increase the information that we have about their nutrient loss. This
could be used improve the ability of catchment models to estimate nutrient loss
from these sources leading to better informed choices of environmental goals.
1.2.2 Increased participant’s compliance costs
Once the nutrient trading system is in place, all nutrient sources will
need to collect and report sufficient information to calculate their nutrient loss.
While large nutrient sources may already collect much of the information
required, smaller sources may not. They may have to collect additional
information, leading to higher costs to comply with regulation. If these costs are
going to be very high for some sources, such as small landowners, it may be better
9 The cost to individual sources of undertaking mitigation options are not considered in this paper as these cost will need to be borne by sources within the catchment regardless of the nutrient control regulation used. The implementation of a nutrient trading system means that the total cost of undertaking mitigation options will be less as the system allows the mitigation costs to move to the most cost effective periods and places.
6
to exclude them from the nutrient trading system. Alternatively, these sources
could be included in a way that has lower compliance costs such as using default
values for the model.
1.2.3 Increases administrators’ costs
While most people will do their best to comply with a system that they
see as reasonable, some individuals will want to cheat any system that restricts
their actions. Thus, in a nutrient trading system, verification and enforcement
systems need to be in place to decrease this incentive (For more information on
system compliance for a Lake Rotorua nutrient trading system see Kerr et al
(2008)). As the system becomes more comprehensive, the cost of verifying data
and enforcing the system will increase.
The verification and enforcement costs associated with each type of
nutrient source depend on the number of sources involved and the complexity of
information required to estimate the nutrient loss. Some sources, such as the
Tikitere diversion, can be included in the system without greatly increasing costs.
But when a type of source is included that has a large number of individuals with
a low nutrient loss or requires a significant amount of detailed data to run the
model, the verification and enforcement costs associated with including them in
the system may be prohibitive. In this case, more random audits may be needed to
maintain the same probability that a property is audited.
For the nutrient trading system to work, a registry of allowance
holdings needs to be maintained and compliance forms need to processed. As the
system becomes more comprehensive, the number of participants and
consequently the number of compliance forms requiring processing will increase.
This will lead to increased administrative costs of running the system.
2 Scope of other trading systems Since a number of trading systems are already in place, we can look to
these systems to gain some insight into the preferred scope of the Lake Rotorua
nutrient trading system. We focus on two New Zealand trading systems – the
Lake Taupo nutrient trading system and New Zealand Quota Management System
7
(QMS) for controlling commercial fisheries - and look at the scope of nutrient
trading systems that have been set up overseas.
2.1 Lake Taupo Nutrient Trading System The Lake Taupo nutrient trading system is being introduced to control
the amount of nitrogen entering the lake and is still in the early stages of
implementation.10 This system includes only pastoral farmers who must hold
sufficient nutrient allowances to cover their nutrient loss unless their nutrient loss
is below the permitted activity level. Permitted activity levels are low thresholds
which ensures that only small properties with low nutrient loss, such as lifestyle
blocks, do not need to be involved in the system. Non-pastoral farming land uses,
such as forestry, are not part of the system and do not need to hold nutrient
allowances. But if they wish to convert to pastoral farming, they must purchase
nutrient allowances. So properties with a small amount of pastoral farming (e.g.
lifestyle blocks) and properties involved in non-pastoral land uses are excluded
from the system. Other nutrient sources, such as wastewater discharges, are
controlled with separate regulation.
2.2 Quota Management System While the QMS is used for managing commercial fishery harvest, not
nutrient loss, this system can give us insight into how trading systems work in a
New Zealand context where some sectors are excluded from the trading system.
Fisheries regulation in New Zealand focuses on two main goals – fish
stock sustainability and the utilisation of the fish stocks. Thus the regulations aim
to maintain fish stock populations without limiting harvest levels more than
necessary. Other than natural fluctuations, the sustainability of fish stocks is
affected by three main activities – commercial fishing, recreational fishing and
customary fishing. It is necessary to control the combined harvest level, the total
allowable catch (TAC), to achieve the above goal of sustainability.11 But while the 10 Information on the scope of the Lake Taupo system was provided by Kelly Forster, Environment Waikato (pers. comm., 19th June 2007). For more information on the Lake Taupo system see http://www.ew.govt.nz/Policy-and-plans/Protecting-Lake-Taupo/. 11 The TAC is set by the Minister at a level which will ensure that the fish stock remains at a size that is able to sustain the maximum sustainable yield or move the stock towards this size.
8

combined harvest needs to be capped, each of the sectors is managed under
different regulations.
Customary fishing is given first priority under fishing regulations to
satisfy customary fishing rights. As a matter of policy, customary fishing should
be allocated a share of the TAC by the Minister of Fisheries, which is sufficient to
fully satisfy customary interests. This share must include sufficient harvest levels
of fish and seafood for use in events on marae as well as other traditional, non-
commercial uses. The Minister can limit the customary fishing harvest only if he
believes that the sustainability of the fish stock is threatened.
While the process for determining the level of customary harvest
required is clearly defined, there are no strict guidelines that the Minister has to
follow to split the remaining harvest between recreational and commercial fishers.
Neither sector has priority in the legislation and the harvest limit for each sector
must be considered simultaneously. Thus the Minister must use his discretion and
implicit ranking of the value of each sector. This has lead to contention between
the two sectors in some fish stocks where both sectors lobby the Minister to
increase their share of the TAC.12 In some fisheries, this is not a major concern as
there is no (or limited) recreational fishing. For example, in the deepwater species
such as orange roughy, the required investment in fishing boats and equipment
means that recreational fishermen do not participate in catching this species. In
contrast, species such as paua and snapper are popular with both recreational and
commercial fishermen, which can lead to conflict between the two sectors about
their share of the harvest.
While the harvest from the customary, recreational and commercial
fishing sectors should not exceed the TAC, there is limited information on the
level of both recreational and customary catch levels.13 There is also uncertainty
Guidance is provided to the Minister through the annual Plenary Reports but recommendations given in this report do not have to be followed through. 12 The Ministry is currently investigating policy options which will improve the relationship between commercial and recreational fishers including increased involvement of the recreational fishing sector more in management decisions and the creation of Fisheries Plans (see Lock and Leslie (2007)). 13 To the authors’ knowledge only two studies (Teirney et al (2007) and Kearney (2002b)) have estimated recreational catch in New Zealand in the last 15 years. These studies have large
9
around the sustainable harvest levels, as was shown in September 2007 when
substantial adjustments were made to commercial and recreational harvest limits
in a number of fish stocks (Anderton (2007)). These adjustments included cutting
the North Island eel commercial catch limit by up to 78%, reducing the hoki
commercial catch limit by close to 50% in some areas and effectively closing
fishing for orange roughy in some locations. So while the Minister needs to aim
for sustainability, there is a large amount of uncertainty in the system. Despite this
uncertainty and the tension between the sectors, this system has been functioning
for the last 20 years and is generally considered to be a success story around the
world.
The QMS shows that trading systems can be implemented and continue
to function when some of the sources are excluded from the trading system. This
suggests that a nutrient trading system for Lake Rotorua could probably function,
even if some sources are excluded. However, there may be tension between those
parties that are included in the system and those excluded especially if they are
not making equal nutrient loss reductions.
2.3 International nutrient trading markets Internationally, nutrient trading systems are increasingly being
considered as a method to reduce and/or control nutrient loss (The World
Resources Institute (2007)). The systems implemented vary in a number of ways:
who is included, what nutrients are controlled, and how nutrient loss is calculated.
Many of these systems do not include diffuse (non-point source) nutrient loss,
such as agriculture. Even in the majority of the systems that do include non-point
sources, the ability of these sources to participate in the system is limited and their
participation is voluntary. Such systems basically use agriculture as an offset
mechanism with credits relative to an estimated baseline, to allow for increases in
nutrient loss from point sources.
differences despite being carried out only a few years apart (Kearney (2002a)). There is also very little information on the level of customary harvest in many parts of the country. In the absence of this data, the Minister bases the customary allowance on a variable proportion of the recreational harvest. But as new customary fishing regulations are applied throughout more of the country, the level of information on customary harvest is expected to increase. See Lock and Leslie (2007) for more information on estimating recreational and customary catch levels.
10

Only two systems have regulated non-point sources and allowed them
to trade. These systems were relatively simple trading systems where the
participants traded the right to apply manure to the land. While both of the
systems are now inactive, they were considered to be successful.14 In one, the
Upper Maquoketa and South Fork Maquoketa Watersheds Nutrient Trading
Directory programme, sediment loads were reduced by 25% in the five years that
the pilot system was operating. These two systems did not allow for trades
between point sources and non-point sources in the catchment as only non-point
sources were included.
To the authors’ knowledge no system currently in place, or previously
implemented, fully includes point sources and non-point sources and allows
nutrient allowances to be bought and sold between all parties. This appears to be
driven by an unwillingness to regulate agriculture.
3 What do we want to do in the Lake Rotorua Catchment? Choosing the appropriate scope of a nutrient trading system for the
Lake Rotorua catchment is not simple. Some sources, such as dairy farmers,
should clearly be included in the system. Other sources, such as residential
properties, should clearly be excluded from direct participation. For many sources,
it is less clear.
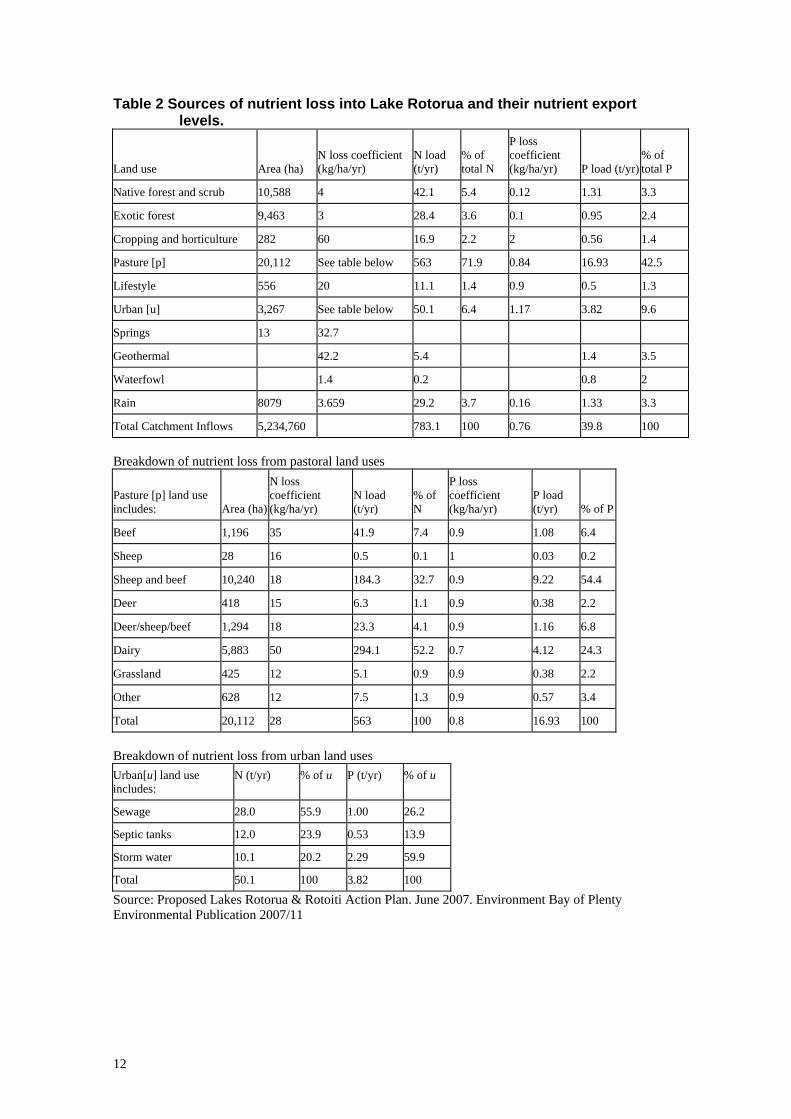
3.1 Sources of nutrients entering Lake Rotorua Nutrients enter Lake Rotorua from several types of sources. By
assessing the nutrient contribution of a particular land use, we can get an idea of
how important these land uses are to the water quality problem currently and in
the future. The contribution of nutrients from each of the different land uses has
been calculated by EBOP (Table 2).
14 The Upper Maquoketa and South Fork Maquoketa Watersheds Nutrient Trading Directory programme was introduced as a five-year pilot programme. No permanent scheme has been introduced since the pilot finished in December 2005. The Dutch Nutrient Quota System was cancelled in 1998 when separate legislation was passed that was considered prior to the introduction of this system.
11
Table 2 Sources of nutrient loss into Lake Rotorua and their nutrient export levels.
Land use Area (ha) N loss coefficient (kg/ha/yr)
N load (t/yr)
% of total N
P loss coefficient (kg/ha/yr) P load (t/yr)
% of total P
Native forest and scrub 10,588 4 42.1 5.4 0.12 1.31 3.3
Exotic forest 9,463 3 28.4 3.6 0.1 0.95 2.4
Cropping and horticulture 282 60 16.9 2.2 2 0.56 1.4
Pasture [p] 20,112 See table below 563 71.9 0.84 16.93 42.5
Lifestyle 556 20 11.1 1.4 0.9 0.5 1.3
Urban [u] 3,267 See table below 50.1 6.4 1.17 3.82 9.6
Springs 13 32.7
Geothermal 42.2 5.4 1.4 3.5
Waterfowl 1.4 0.2 0.8 2
Rain 8079 3.659 29.2 3.7 0.16 1.33 3.3
Total Catchment Inflows 5,234,760 783.1 100 0.76 39.8 100
Breakdown of nutrient loss from pastoral land uses
Pasture [p] land use includes: Area (ha)
N loss coefficient (kg/ha/yr)
N load (t/yr)
% of N
P loss coefficient (kg/ha/yr)
P load (t/yr) % of P
Beef 1,196 35 41.9 7.4 0.9 1.08 6.4
Sheep 28 16 0.5 0.1 1 0.03 0.2
Sheep and beef 10,240 18 184.3 32.7 0.9 9.22 54.4
Deer 418 15 6.3 1.1 0.9 0.38 2.2
Deer/sheep/beef 1,294 18 23.3 4.1 0.9 1.16 6.8
Dairy 5,883 50 294.1 52.2 0.7 4.12 24.3
Grassland 425 12 5.1 0.9 0.9 0.38 2.2
Other 628 12 7.5 1.3 0.9 0.57 3.4
Total 20,112 28 563 100 0.8 16.93 100
Breakdown of nutrient loss from urban land uses Urban[u] land use includes:
N (t/yr) % of u P (t/yr) % of u
Sewage 28.0 55.9 1.00 26.2
Septic tanks 12.0 23.9 0.53 13.9
Storm water 10.1 20.2 2.29 59.9
Total 50.1 100 3.82 100
Source: Proposed Lakes Rotorua & Rotoiti Action Plan. June 2007. Environment Bay of Plenty Environmental Publication 2007/11
12

The nutrient sources listed above can be classified into two categories –
point source and non-point source. This classification can have distinct
implications for the way nutrient loss is regulated and the transaction costs of
including particular sources in the system.
3.1.1 Point sources
Some nutrient sources enter Lake Rotorua from a single identifiable
point, for example urban sewerage and septic tanks. At such sources it relatively
simple to identify the level of nutrients that are entering the lake. Consequently
you may wish to have all of these sources within the trading system. However
there are a large number of small contributors to nutrient loss from sewerage
treatment plants. To make each of these households responsible for their nutrient
loss is likely to be inefficient. Instead the Rotorua District Council could be
responsible for holding sufficient allowances to cover the nutrient loss from the
sewerage treatment plant on behalf of the residents. Storm water, septic tanks and
geothermal sources could be treated in the same way. Models to estimate nutrient
flows from these sources already exist. The Council could regulate these sources
in whatever way they choose.
3.1.2 Non-point sources
While it is more difficult to identify the exact level of nutrients lost
from non-point sources, such as run-off from pastoral farming, this should not be
a barrier to including non-point sources in the system. Existing models are able to
model nutrient loss with reasonable accuracy and landowners are not able to
manipulate the remaining uncertainty to their advantage. It is especially important
to include non-point sources in the Lake Rotorua catchment as they make up a
majority of nutrient sources. However we may not want to include all non-point
sources because modelling nutrient loss for individual land uses is complex, and
excluding small properties with minimal nutrient loss from the trading system
would avoid high administrative and compliance costs. But excluding such
properties would also decrease the efficiency benefits of the trading system. The
following section empirically explores appropriate thresholds for including
properties in the Lake Rotorua nutrient trading scheme.
13
3.2 Thresholds for including different land uses in the trading system In an ideal world, properties would be included in a nutrient trading
system if they had sufficiently high nutrient loss and/or low compliance costs.
Properties that had large nutrient loss would be included in the trading system
while properties with very little nutrient loss would be excluded or covered by a
larger body. Properties that have low compliance costs associated with being
included in the system will be included while those with high compliance costs
will be excluded. By identifying the nutrient loss of each property, we could
determine whether they were included in the system or not.
Such a system is not practical. One of the main costs of being included
in a nutrient trading system is the cost to the landowner of collecting sufficient
data to be able to run the model and calculate their nutrient loss. Thus, if every
source is required to collect sufficient data to assess whether they are included in
the system, the additional costs of participation in the system are minimal, and
therefore all sources could be included. But including all sources in the system as
direct participants is likely to be very inefficient. A number of small sources in the
catchment have minimal nutrient loss. The additional compliance costs of having
these properties included is likely to be much higher than the additional benefits
of including the nutrient loss from these properties.
Since we cannot use the nutrient loss by property to identify which
properties are included in the nutrient trading system, a rule, or set of rules, needs
to be developed to determine which properties are included in the system. These
rules aim to ensure that properties with a large amount of nutrient loss and/or low
compliance costs are included in the system while those with low nutrient loss
and/or high compliance costs are excluded. To achieve this, we need to develop
proxies that are simple but linked to the nutrient loss from the property.
Two factors play a large role in determining the nutrient loss off a
particular property: the property size and the land use. Larger properties are likely
to have more nutrient loss than smaller properties, however this depends on the
land use. Horticulture, for example, has more nutrient loss than plantation
forestry. Therefore a large property covered in plantation forests may have lower
14

nutrient loss than a much smaller horticulture property. Different land uses also
face differences in compliance costs. If a land use has a relatively high
compliance cost, the threshold for inclusion in the system could be set at a higher
level to account for the increased cost of compliance. Alternatively, for properties
that are likely to have low nutrient loss, compliance could be made simpler.
Where possible, it is better not to base thresholds on current land use as this can
change from year to year and it is complex if parcels enter and exit the system.
3.3 Analysis of nitrogen distribution from land use sources across parcels To identify appropriate rules based on land use and property size, we
first identified the sources of nutrients in the catchment so we could better
understand the implications of including or excluding different types and sizes of
parcels. For simplicity, in this analysis we have focused on the non-urban, non-
conservation estate sources of nitrogen loss. Sources of phosphorus may be
different to sources of nitrogen. To assess this, a similar analysis could easily be
carried out for phosphorus.
3.3.1 Dataset creation
To undertake this analysis we used a map of 2003 land use in the Lake
Rotorua catchment provided by EBOP. This map was based on the Land Cover
Database (LCDB) 2003 satellite imagery and then improved by the land resources
staff at EBOP. EBOP staff allocated land use areas to the map, defining land uses
for the pastoral areas and correcting mistakes in the map using their knowledge
and records for the rural properties in the area (Andrew Wharton, EBOP, pers.
comm., 12th February 2008).15
The land use map was combined with the cadastral map to identify the
areas of each land use located on each parcel in the catchment.16 By incorporating
the nutrient loss coefficients from the Action Plan we were able to estimate the
15 The LCDB only provides land cover data such as forest or pasture. It does not distinguish between dairy and sheep/beef properties. This information was added in by the EBOP staff. 16 The cadastral map only gives us parcel boundaries, not the property boundaries. In many cases a property consists of multiple parcels and are likely to be managed together. Unfortunately, it is impossible to identify which parcels are managed together given the data that is available.
15

total nutrient loss from each parcel as these coefficients provide the nutrient loss
per hectare by land use.17
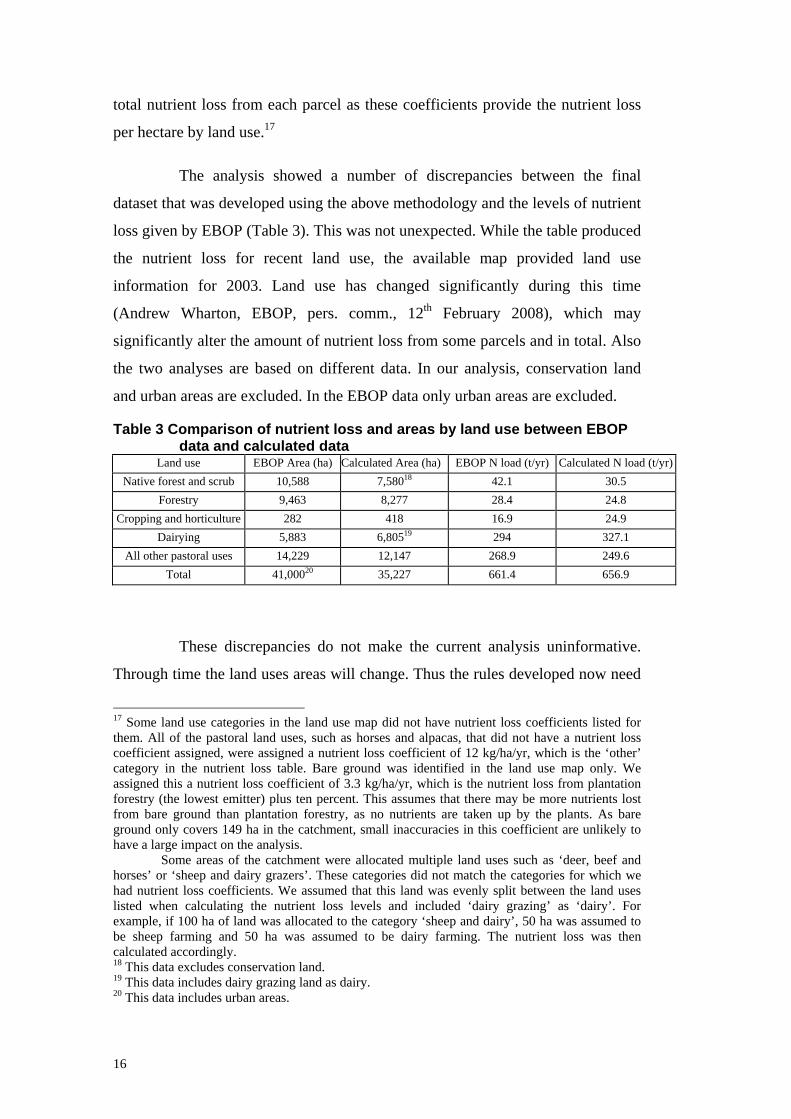
The analysis showed a number of discrepancies between the final
dataset that was developed using the above methodology and the levels of nutrient
loss given by EBOP (Table 3). This was not unexpected. While the table produced
the nutrient loss for recent land use, the available map provided land use
information for 2003. Land use has changed significantly during this time
(Andrew Wharton, EBOP, pers. comm., 12th February 2008), which may
significantly alter the amount of nutrient loss from some parcels and in total. Also
the two analyses are based on different data. In our analysis, conservation land
and urban areas are excluded. In the EBOP data only urban areas are excluded.
Table 3 Comparison of nutrient loss and areas by land use between EBOP data and calculated data
Land use EBOP Area (ha) Calculated Area (ha) EBOP N load (t/yr) Calculated N load (t/yr)Native forest and scrub 10,588 7,58018 42.1 30.5
Forestry 9,463 8,277 28.4 24.8 Cropping and horticulture 282 418 16.9 24.9
Dairying 5,883 6,80519 294 327.1 All other pastoral uses 14,229 12,147 268.9 249.6
Total 41,00020 35,227 661.4 656.9
These discrepancies do not make the current analysis uninformative.
Through time the land uses areas will change. Thus the rules developed now need
17 Some land use categories in the land use map did not have nutrient loss coefficients listed for them. All of the pastoral land uses, such as horses and alpacas, that did not have a nutrient loss coefficient assigned, were assigned a nutrient loss coefficient of 12 kg/ha/yr, which is the ‘other’ category in the nutrient loss table. Bare ground was identified in the land use map only. We assigned this a nutrient loss coefficient of 3.3 kg/ha/yr, which is the nutrient loss from plantation forestry (the lowest emitter) plus ten percent. This assumes that there may be more nutrients lost from bare ground than plantation forestry, as no nutrients are taken up by the plants. As bare ground only covers 149 ha in the catchment, small inaccuracies in this coefficient are unlikely to have a large impact on the analysis.
Some areas of the catchment were allocated multiple land uses such as ‘deer, beef and horses’ or ‘sheep and dairy grazers’. These categories did not match the categories for which we had nutrient loss coefficients. We assumed that this land was evenly split between the land uses listed when calculating the nutrient loss levels and included ‘dairy grazing’ as ‘dairy’. For example, if 100 ha of land was allocated to the category ‘sheep and dairy’, 50 ha was assumed to be sheep farming and 50 ha was assumed to be dairy farming. The nutrient loss was then calculated accordingly. 18 This data excludes conservation land. 19 This data includes dairy grazing land as dairy. 20 This data includes urban areas.
16

to be robust to changes in the future. This analysis provides insight into the
nutrient loss levels from different land uses and different sized parcels at a point
in time, allowing appropriate thresholds to be identified.
3.4 Identifying appropriate thresholds As outlined earlier, in an ideal world, thresholds would be set to ensure
that individual sources with high levels of nutrient loss would be included in the
system. Since in our analysis the nutrient loss by parcel is known, a threshold, in
terms of nutrient loss, can be identified. Within this catchment, a few privately
owned parcels contribute a significant proportion of the nutrient loss (Figure 1).
The top 10, 50 and 100 nitrogen losing parcels contribute 14%, 41% and 57% of
the total nitrogen loss respectively.
Figure 1 Distribution of nitrogen loss across parcels ranked by total nitrogen loss
14%
41%
57%
020
4060
8010
0%
of T
otal
N L
oss
(Kg/
yr)
top
10
top
50
top
100
0 100 200 300 400 500
Number of Parcels, ranked from most Nitrogen loss to least
Only 239 parcels have nutrient loss above 500 kg/yr and most of the
remaining properties have much lower losses (Figure 2). The potential gain from
including parcels with over 500 kg/yr seems likely to justify reasonably careful
17
monitoring, while for other parcels we may find that the gains from inclusion do
not justify the transaction costs of participating in the system.
Figure 2 Nitrogen loss per parcel and a potential threshold for inclusion in the system
500 kg/yr050
0010
000
1500
020
000
Tota
l Nitr
ogen
Los
s pe
r par
cel (
kg/y
r)
239t
h pa
rcel0 500 1000 1500 2000 2500
Number of Parcels, ranked by Nitrogen Loss
This 500 kg/yr threshold provides a first cut for identifying thresholds
based on parcel area and land use. Using the EBOP nutrient loss per hectare for
each of the land uses, it is easy to convert this threshold based on nitrogen loss
into a threshold based on land use and area (Table 4). For example, all parcels that
had at least 10 ha of dairy land would be included in the system. In contrast, a
plantation forests might need to be at least 167 ha before it is included in the
system.
Different land uses in the catchment have different costs of complying
with the system. For example, very little data is required to measure nutrient loss
from plantation forestry. In contrast, the calculation of nutrient loss from livestock
farming involves the collection of much more data and consequently the costs of
complying with the system are much higher.
18

Table 4 Potential inclusion thresholds based on a 500 kg/yr nitrogen loss threshold and the nitrogen loss coefficients
Land use Nitrogen loss coefficient (kg/ha/yr)
Land use area threshold (ha)
Horticulture and cropping 60 8.3
Dairy 50 10
Non-Dairy Pastoral farming 1921 26
Native bush 4 125
Exotic forestry 3 167
3.4.1 Horticulture and cropping land
While horticulture and cropping have the largest nutrient loss
coefficient, this land use contributes only 2.2% of the nutrient loss in the
catchment because of the small land area it occupies. Given the small impact on
nutrient loss that this land use has, it might not be worth including horticulture
and cropping land in the system if existing models cannot be used to calculate
their nutrient loss. Given the high per hectare nutrient loss however, it may be
appropriate to include them even in a very crude way. One option is to require
landowners to report their total horticulture land area and use existing EBOP
nutrient loss coefficients to estimate nutrient loss.
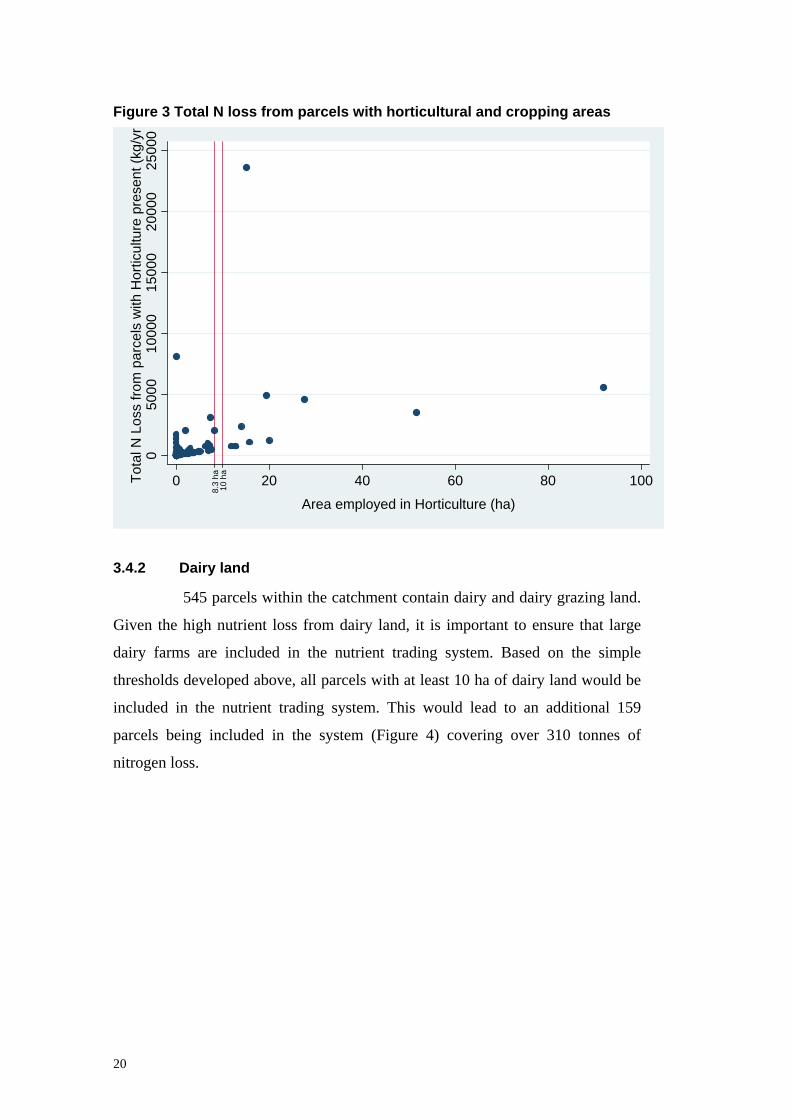
To include horticulture and cropping in the nutrient trading system, an
appropriate threshold for identifying which parcels are included is required. If the
500 kg threshold identified above were used, all parcels with at least 8.3 ha of
horticultural or cropping land would be included. Based on our analysis, only 11
parcels would meet this criterion and consequently would be included in the
nutrient trading system (Figure 3). This corresponds to 1.7 tonnes of nitrogen loss
each year.
21 This coefficient was calculated as the weighted averaged N loss coefficient based on the data provided in Table 2.
19
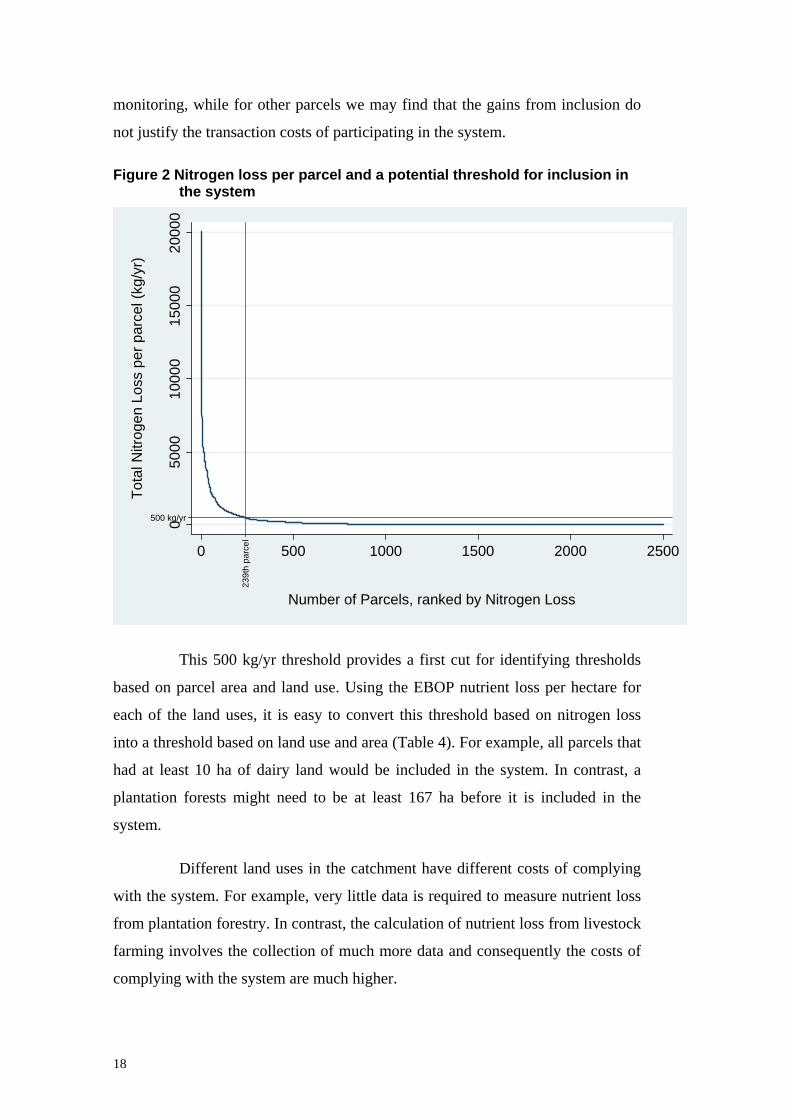
Figure 3 Total N loss from parcels with horticultural and cropping areas
050
0010
000
1500
020
000
2500
0To
tal N
Los
s fro
m p
arce
ls w
ith H
ortic
ultu
re p
rese
nt (k
g/yr
8.3
ha10
ha
0 20 40 60 80 100
Area employed in Horticulture (ha)
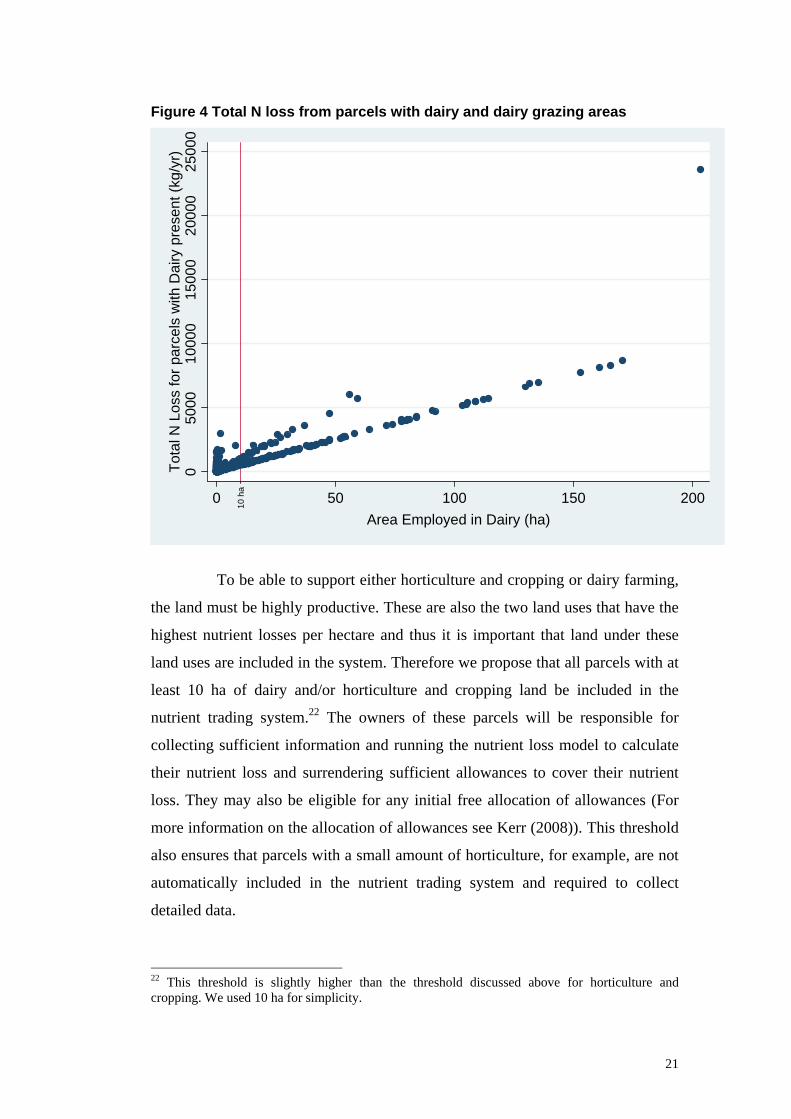
3.4.2 Dairy land
545 parcels within the catchment contain dairy and dairy grazing land.
Given the high nutrient loss from dairy land, it is important to ensure that large
dairy farms are included in the nutrient trading system. Based on the simple
thresholds developed above, all parcels with at least 10 ha of dairy land would be
included in the nutrient trading system. This would lead to an additional 159
parcels being included in the system (Figure 4) covering over 310 tonnes of
nitrogen loss.
20

Figure 4 Total N loss from parcels with dairy and dairy grazing areas
050
0010
000
1500
020
000
2500
0To
tal N
Los
s fo
r par
cels
with
Dai
ry p
rese
nt (k
g/yr
)
10 h
a
0 50 100 150 200Area Employed in Dairy (ha)
To be able to support either horticulture and cropping or dairy farming,
the land must be highly productive. These are also the two land uses that have the
highest nutrient losses per hectare and thus it is important that land under these
land uses are included in the system. Therefore we propose that all parcels with at
least 10 ha of dairy and/or horticulture and cropping land be included in the
nutrient trading system.22 The owners of these parcels will be responsible for
collecting sufficient information and running the nutrient loss model to calculate
their nutrient loss and surrendering sufficient allowances to cover their nutrient
loss. They may also be eligible for any initial free allocation of allowances (For
more information on the allocation of allowances see Kerr (2008)). This threshold
also ensures that parcels with a small amount of horticulture, for example, are not
automatically included in the nutrient trading system and required to collect
detailed data.
22 This threshold is slightly higher than the threshold discussed above for horticulture and cropping. We used 10 ha for simplicity.
21
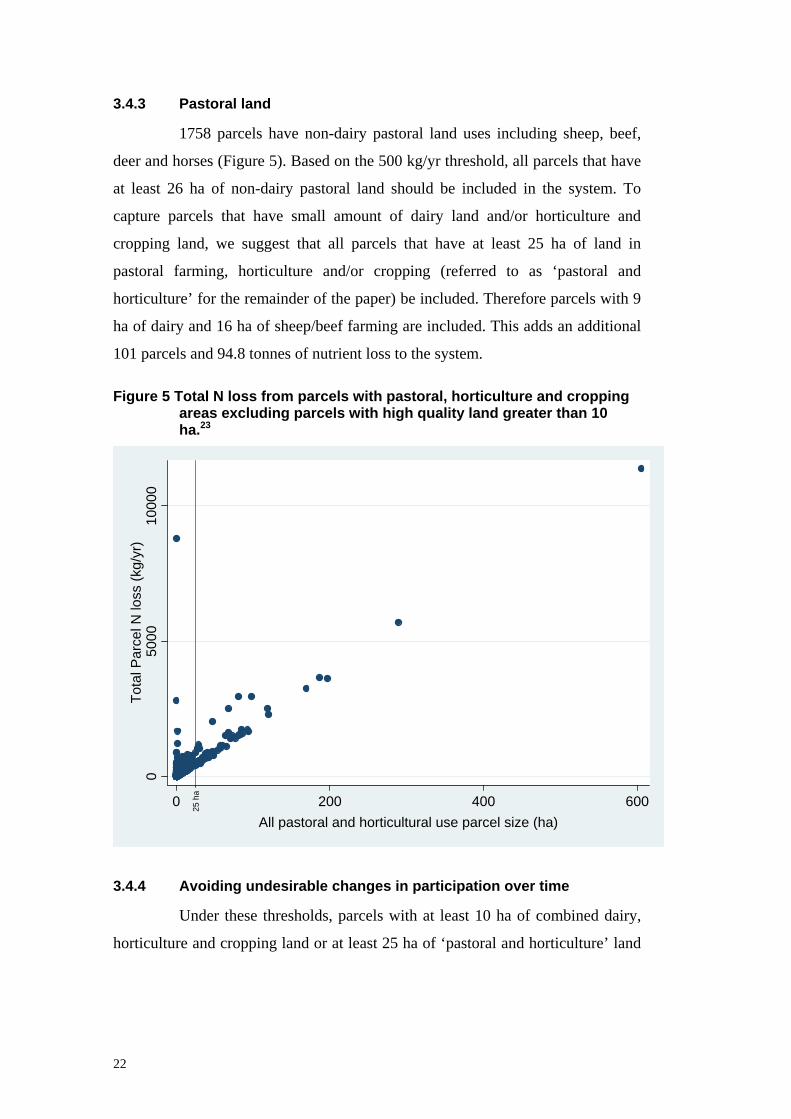
3.4.3 Pastoral land
1758 parcels have non-dairy pastoral land uses including sheep, beef,
deer and horses (Figure 5). Based on the 500 kg/yr threshold, all parcels that have
at least 26 ha of non-dairy pastoral land should be included in the system. To
capture parcels that have small amount of dairy land and/or horticulture and
cropping land, we suggest that all parcels that have at least 25 ha of land in
pastoral farming, horticulture and/or cropping (referred to as ‘pastoral and
horticulture’ for the remainder of the paper) be included. Therefore parcels with 9
ha of dairy and 16 ha of sheep/beef farming are included. This adds an additional
101 parcels and 94.8 tonnes of nutrient loss to the system.
Figure 5 Total N loss from parcels with pastoral, horticulture and cropping areas excluding parcels with high quality land greater than 10 ha.23
050
0010
000
Tota
l Par
cel N
loss
(kg/
yr)
25 h
a
0 200 400 600All pastoral and horticultural use parcel size (ha)
3.4.4 Avoiding undesirable changes in participation over time
Under these thresholds, parcels with at least 10 ha of combined dairy,
horticulture and cropping land or at least 25 ha of ‘pastoral and horticulture’ land
22
are included in the system. We also want to avoid adding parcels to the system
when their land use changes. Doing so would require annual adjustments to the
cap and could create perverse incentives across land uses. To avoid this
complexity, we propose that all parcels 10 ha or larger are included in the system,
regardless of the land use. This will lead to parcels being included that have
smaller amounts of pastoral or horticultural land than specified by the above
thresholds and parcels with plantation forestry and native bush being included in
the system. It is important that the compliance costs to these parcels are not
crippling.
Compliance costs for plantation forestry and native bush areas will be
low. Landowners will not be responsible for the first 3 kg/ha that is lost from their
land as they cannot reduce nutrient loss below this level. Therefore, nutrient loss
from plantation forestry does not need to be covered by allowances each year and
only 1 kg/ha is required for land that is covered in native bush. Landowners could
simply report the total area that they have in plantation forestry and native bush to
allow their nutrient loss to be calculated and thus the default values are not
needed.
To minimise compliance costs for parcels with less than 10ha of
combined dairy, horticulture and cropping and less than 25 ha of pastoral and
horticultural farming, default values could be used to calculate their nutrient loss
from pastoral land uses. This would require the landowner to supply information
on the area in each land use but default values supplied by EBOP could be used to
calculate the total nutrient loss from pastoral, horticultural and cropping land uses.
But if the landowner wished to use the actual information from their parcel, they
could use this instead of the default values.
By ensuring that all parcels above 10 ha are included in the system,
parcels will only stop participating directly in the system when they are
subdivided to be less than 10 ha. Under the rules outlined above, when parcels
change land use they will not move into or out of the nutrient trading system, but
23 The two data points with a high total nutrient loss and a small amount of pastoral area are large plantation and native bush blocks with only a small amount of pastoral land.
23
the level of information that they are required to collect may change. For example,
if the total pastoral area falls below 25 ha, the landowner will now have the option
to use default values.
3.4.5 What about other parcels?
The above rules include 88.5% of nitrogen loss from the catchment.
The excluded parcels are either urban parcels, smaller than 10ha or owned by the
Department of Conservation.
To achieve the most flexibility in the system, all sources of nutrient loss
should be included. The land owned by the Department of Conservation (DoC)
should be included in the system with DoC responsible for reporting and holding
sufficient allowances to cover nutrient loss from all of their land. As this land is
managed as an estate, DoC could complete a single report of the nutrient loss from
all of the conservation land in the catchment. The Rotorua District Council (RDC)
and EBOP should be made responsible for surrendering sufficient allowances to
cover the nutrient loss from parcels smaller than 10 ha. The parcels that each
council is responsible for should follow their jurisdiction. RDC should hold
allowances on behalf of urban parcels while EBOP should be responsible for the
small non-urban parcels such as lifestyle blocks.24 The councils will be required to
report and estimate the total nutrient loss off the parcels they are responsible for
and surrender sufficient allowances. To control nutrient loss they can undertake
mitigation options or use regulations to limit nutrient loss.
3.4.6 Why use parcels?
We propose that land use areas in parcels rather than properties should
be used to determine whether land is included in the nutrient trading system
because parcel size are relatively unchanging through time. Farmers often manage
their parcels simultaneously. This means a landowner can jointly report on all of
their parcels at once, including opting to have parcels smaller than 10ha in the
system. Once a parcel enters the nutrient trading system it can only leave the
24 Urban land is defined in EBOP’s Regional Water and Land Plan as “an area which contains an aggregation of more than 50 lots or sites of an average size of no more than 1000m2”. The same definition should be used here.
24

system if the parcel is sold, providing the new owner the option of including or
excluding the parcel in the nutrient trading system. This stops parcels entering and
leaving the system annually but avoids locking in small parcels.
4 Summary Based on an analysis of the distribution of nutrient loss from parcels in
the Lake Rotorua catchment, a set of rules have been developed to identify which
parcels are included in the nutrient trading system (Figure 6). The thresholds
developed in this analysis are only indicative of the values that should be used.
25

Figure 6 Rules for determining how a parcel is included in the Nutrient Trading System
Do you have at least 25 ha ofpastoral, horticulture andcropping land?
Yes Included in the system and required to collect detailed data
Included in the system andrequired to report total area ineach land use but can usedefault values to calculatepastoral nutrient loss
No
Yes No
Do you have at least 10 ha ina combination of dairy orhorticulture and cropping?
Included in the system andrequired to collect detaileddata
Yes
RDC manages yournutrient loss and you maybe subject to additionalregulations
EBOP manages yournutrient loss and you maybe subject to permittedactivity rules
Yes No
Is your propertydefined as urban bylocal regulations?
No
Is your parcel at least 10 ha?
26

References Anderton, Jim. 2007. "Fisheries Minister Takes Action to Safeguard Sustainability,” Press
Release. Available online at http://www.progressive.org.nz/modules.php?name=News&file=article&sid=2854.
Hahn, Robert W. 1984. "Market Power and Transferable Property Rights," Quarterly Journal of Economics, November 1984, pp. 753-65.
Kearney, R. E. 2002b. "Review of Harvest Estimates From Recent New Zealand National Marine Recreational Fishing Surveys,” Report to the New Zealand Ministry of Fisheries.
Kearney, R. E. 2002a. "Review of Harvest Estimates From Recent New Zealand National Marine Recreational Fishing Surveys,” Report to the New Zealand Ministry of Fisheries.
Kerr, Suzi. 2008. "Nutrient Trading in Lake Rotorua: Cost Sharing," Draft Motu Working Paper.
Kerr, Suzi; Barclay Rogers; Kelly Lock and Cameron Law. 2008. "Nutrient Trading in Lake Rotorua: Legal and Administrative Mechanisms for Trade,” Draft Motu Working Paper.
Kerr, Suzi and Kit Rutherford. 2008. "Nutrient Trading in Lake Rotorua: Reporting and Modeling Net Nutrient Inputs to Lake Rotorua for a Nutrient Trading System," Draft Motu Working Paper.
Kerr, Suzi; Kit Rutherford and Kelly Lock. 2007. "Nutrient Trading in Lake Rotorua: Goals and Trading Caps,” Motu Working Paper 07-06, Motu Economic and Public Policy Research.
Lock, Kelly and Stefan Leslie. 2007. "New Zealand's Quota Management System: A History of the First 20 Years," Motu Working Paper 07-02, Motu Economic and Public Policy Research.
Misiolek, Walter S. and Harold W. Elder. 1989. "Exclusionary Manipulation of Markets for Pollution Rights," Journal of Environmental Economics and Management, 16:2, pp. 156-66.
Teirney, L. D.; A. R. Kilner; R. B. Millar; E. Bradford and J. D. Bell. 2007. "Estimation of Recreational Harvest From 1991-92 and 1993-94,” Report to the Minister of Fisheries.
The World Resources Institute. 2007. "An Overview of Water Quality Trading," Draft, The World Resources Institute, Washington, DC.
27

Motu Working Paper Series
All papers are available online at http://www.motu.org.nz/working_papers or by contacting Motu Economic and Public Policy Research. 08-10 Grimes, Arthur and Andrew Aitken. “Water, Water Somewhere: The Value of Water in a
Drought-Prone Farming Region”. 08-09 Coleman, Andrew. “Inflation and the Measurement of Saving and Housing Affordability”. 08-08 Coleman, Andrew and Özer Karagedikli. “The Relative Size of New Zealand Exchange Rate
and Interest Rate Responses to News”. 08-07 Grimes, Arthur and Yun Liang. “Bridge to Somewhere: The Value of Auckland's Northern
Motorway Extensions". 08-06 Stillman, Steven and David C. Maré. “Housing Markets and Migration: Evidence from New
Zealand”. 08-05 Lock, Kelly and Suzi Kerr. “Nutrient Trading in Lake Rotorua: Choosing the Scope of a
Nutrient Trading System”. 08-04 Kerr, Suzi and Andrew Sweet. “Inclusion of Agriculture and Forestry in a Domestic
Emissions Trading Scheme: New Zealand’s Experience to Date”. 08-03 Kerr, Suzi and Kit Rutherford. “Nutrient Trading in Lake Rotorua: Reporting and Modelling
Net Nutrient Inputs”. 08-02 Lock, Kelly and Suzi Kerr. “Nutrient Trading in Lake Rotorua: Overview of a Prototype
System”. 08-01 Stroombergen, Adolf. “ESSAM General Equilibrium Model: Estimation of 2005/06 Input-Output Tables”. 07-13 Hall, Viv and John McDermott " A quarterly post-World War II real GDP series for New
Zealand".
07-12 Gibson, John; Trinh Le and Steven Stillman "What Explains the Wealth Gap Between Immigrants and the New Zealand Born?"
07-11 Maré, David C.; Melanie Morten and Steven Stillman, “Settlement Patterns and the Geographic Mobility of Recent Migrants to New Zealand”.
07-10 Grimes, Arthur; David C. Maré and Melanie Morten, “Adjustment in Local Labour and Housing Markets.”
07-09 Grimes, Arthur and Yun Liang, “Spatial Determinants of Land Prices in Auckland: Does the Metropolitan Urban Limit Have an Effect?”
07-08 Kerr, Suzi; Kit Rutherford and Kelly Lock, “Nutrient Trading in Lake Rotorua: Goals and Trading Caps”.
07-07 Hendy, Joanna; Suzi Kerr and Troy Baisden, “The Land Use in Rural New Zealand Model Version 1 (LURNZ v1): Model Description”.
07-06 Lock, Kelly and Suzi Kerr, “Nutrient Trading in Lake Rotorua: Where Are We Now?”
07-05 Stillman, Steven and David C. Maré, “The Impact of Immigration on the Geographic Mobility of New Zealanders”.
07-04 Grimes, Arthur and Yun Liang, “An Auckland Land Value Annual Database”.
07-03 Kerr, Suzi; Glen Lauder and David Fairman, “Towards Design for a Nutrient Trading Programme to Improve Water Quality in Lake Rotorua”.
07-02 Lock, Kelly and Stefan Leslie, “New Zealand’s Quota Management System: A History of the First 20 Years”.
07-01 Grimes, Arthur and Andrew Aitken, “House Prices and Rents: Socio-Economic Impacts and Prospects”.
06-09 Maani, Sholeh A.; Rhema Vaithianathan and Barbara Wolf, “Inequality and Health: Is House Crowding the Link?”
06-08 Maré, David C. and Jason Timmins, “Geographic Concentration and Firm Productivity”.
06-07 Grimes, Arthur; David C. Maré and Melanie Morten, “Defining Areas Linking Geographic Data in New Zealand”.
06-06 Maré, David C. and Yun Liang, “Labour Market Outcomes for Young Graduates”.
06-05 Hendy, Joanna and Suzi Kerr, “Land-Use Intensity Module: Land Use in Rural New Zealand Version 1”.
06-04 Hendy, Joanna; Suzi Kerr and Troy Baisden, “Greenhouse Gas Emissions Charges and Credits on Agricultural Land: What Can a Model Tell Us?”
06-03 Hall, Viv B.; C. John McDermott and James Tremewan, “The Ups and Downs of New Zealand House Prices”.
06-02 McKenzie, David; John Gibson and Steven Stillman, “How Important is Selection? Experimental vs Non-Experimental Measures of the Income Gains from Migration”.
06-01 Grimes, Arthur and Andrew Aitken, “Housing Supply and Price Adjustment”.
05-14 Timmins, Jason, “Is Infrastructure Productive? Evaluating the Effects of Specific Infrastructure Projects on Firm Productivity within New Zealand”.
05-13 Coleman, Andrew; Sylvia Dixon and David C. Maré, “Māori Economic Development—Glimpses from Statistical Sources”.
05-12 Maré, David C., “Concentration, Specialisation and Agglomeration of Firms in New Zealand”.
05-11 Holmes, Mark J. and Arthur Grimes, “Is There Long-Run Convergence of Regional House Prices in the UK?”
05-10 Hendy, Joanna and Suzi Kerr, “Greenhouse Gas Emission Factor Module: Land Use in Rural New Zealand—Climate Version 1”.
05-09 Poland, Michelle and David C. Maré, “Defining Geographic Communities”.
05-08 Kerr, Suzi; Joanna Hendy, Emma Brunton and Isabelle Sin, “The Likely Regional Impacts of an Agricultural Emissions Policy in New Zealand: Preliminary Analysis”.
05-07 Stillman, Steven, “Examining Changes in the Value of Rural Land in New Zealand between 1989 and 2003”.
05-06 Dixon, Sylvia and David C. Maré, “Changes in the Māori Income Distribution: Evidence from the Population Census”.
05-05 Sin, Isabelle and Steven Stillman, “The Geographical Mobility of Māori in New Zealand”.
05-04 Grimes, Arthur, “Regional and Industry Cycles in Australasia: Implications for a Common Currency”.
05-03 Grimes, Arthur, “Intra and Inter-Regional Industry Shocks: A New Metric with an Application to Australasian Currency Union”.
05-02 Grimes, Arthur; Robert Sourell and Andrew Aitken, “Regional Variation in Rental Costs for Larger Households”.
05-01 Maré, David C., “Indirect Effects of Active Labour Market Policies”.
04-12 Dixon, Sylvia and David C. Maré, “Understanding Changes in Māori Incomes and Income Inequality 1997–2003”.
04-11 Grimes, Arthur, “New Zealand: A Typical Australasian Economy?”
04-10 Hall, Viv and C. John McDermott, “Regional Business Cycles in New Zealand: Do They Exist? What Might Drive Them?”
04-09 Grimes, Arthur; Suzi Kerr and Andrew Aitken, “Bi-Directional Impacts of Economic, Social and Environmental Changes and the New Zealand Housing Market”.
04-08 Grimes, Arthur and Andrew Aitken, “What’s the Beef with House Prices? Economic Shocks and Local Housing Markets”.
04-07 McMillan, John, “Quantifying Creative Destruction: Entrepreneurship and Productivity in New Zealand”.
04-06 Maré, David C. and Isabelle Sin, “Māori Incomes: Investigating Differences Between Iwi”.
04-05 Kerr, Suzi; Emma Brunton and Ralph Chapman, “Policy to Encourage Carbon Sequestration in Plantation Forests”.
04-04 Maré, David C., “What do Endogenous Growth Models Contribute?”
04-03 Kerr, Suzi; Joanna Hendy, Shuguang Liu and Alexander S. P. Pfaff, “Uncertainty and Carbon Policy Integrity”.
04-02 Grimes, Arthur; Andrew Aitken and Suzi Kerr, “House Price Efficiency: Expectations, Sales, Symmetry”.
04-01 Kerr, Suzi; Andrew Aitken and Arthur Grimes, “Land Taxes and Revenue Needs as Communities Grow and Decline: Evidence from New Zealand”.
03-19 Maré, David C., “Ideas for Growth?”
03-18 Fabling, Richard and Arthur Grimes, “Insolvency and Economic Development: Regional Variation and Adjustment”.
03-17 Kerr, Suzi; Susana Cardenas and Joanna Hendy, “Migration and the Environment in the Galapagos: An Analysis of Economic and Policy Incentives Driving Migration, Potential Impacts from Migration Control, and Potential Policies to Reduce Migration Pressure”.
03-16 Hyslop, Dean R. and David C. Maré, “Understanding New Zealand’s Changing Income Distribution 1983–98: A Semiparametric Analysis”.
03-15 Kerr, Suzi, “Indigenous Forests and Forest Sink Policy in New Zealand”.
03-14 Hall, Viv and Angela Huang, “Would Adopting the US Dollar Have Led to Improved Inflation, Output and Trade Balances for New Zealand in the 1990s?”
03-13 Ballantyne, Suzie; Simon Chapple, David C. Maré and Jason Timmins, “Movement into and out of Child Poverty in New Zealand: Results from the Linked Income Supplement”.
03-12 Kerr, Suzi, “Efficient Contracts for Carbon Credits from Reforestation Projects”.
03-11 Lattimore, Ralph, “Long Run Trends in New Zealand Industry Assistance”.
03-10 Grimes, Arthur, “Economic Growth and the Size & Structure of Government: Implications for New Zealand”.
03-09 Grimes, Arthur; Suzi Kerr and Andrew Aitken, “Housing and Economic Adjustment”.
03-07 Maré, David C. and Jason Timmins, “Moving to Jobs”.
03-06 Kerr, Suzi; Shuguang Liu, Alexander S. P. Pfaff and R. Flint Hughes, “Carbon Dynamics and Land-Use Choices: Building a Regional-Scale Multidisciplinary Model”.
03-05 Kerr, Suzi, “Motu, Excellence in Economic Research and the Challenges of ‘Human Dimensions’ Research”.
03-04 Kerr, Suzi and Catherine Leining, “Joint Implementation in Climate Change Policy”.
03-03 Gibson, John, “Do Lower Expected Wage Benefits Explain Ethnic Gaps in Job-Related Training? Evidence from New Zealand”.
03-02 Kerr, Suzi; Richard G. Newell and James N. Sanchirico, “Evaluating the New Zealand Individual Transferable Quota Market for Fisheries Management”.

03-01 Kerr, Suzi, “Allocating Risks in a Domestic Greenhouse Gas Trading System”.