Nutrient Control of Yeast Gametogenesis Is Mediated by ...
27
Nutrient Control of Yeast Gametogenesis Is Mediated by TORC1, PKA and Energy Availability The MIT Faculty has made this article openly available. Please share how this access benefits you. Your story matters. Citation Weidberg, Hilla, Fabien Moretto, Gianpiero Spedale, Angelika Amon, and Folkert J. van Werven. “Nutrient Control of Yeast Gametogenesis Is Mediated by TORC1, PKA and Energy Availability.” Edited by Michael Lichten. PLOS Genetics 12, no. 6 (June 6, 2016): e1006075. As Published http://dx.doi.org/10.1371/journal.pgen.1006075 Publisher Public Library of Science Version Final published version Citable link http://hdl.handle.net/1721.1/103774 Terms of Use Creative Commons Attribution 4.0 International License Detailed Terms http://creativecommons.org/licenses/by/4.0/
Transcript of Nutrient Control of Yeast Gametogenesis Is Mediated by ...
Nutrient Control of Yeast Gametogenesis IsMediated by TORC1, PKA and Energy Availability
The MIT Faculty has made this article openly available. Please share how this access benefits you. Your story matters.
Citation Weidberg, Hilla, Fabien Moretto, Gianpiero Spedale, AngelikaAmon, and Folkert J. van Werven. “Nutrient Control of YeastGametogenesis Is Mediated by TORC1, PKA and Energy Availability.”Edited by Michael Lichten. PLOS Genetics 12, no. 6 (June 6, 2016):e1006075.
As Published http://dx.doi.org/10.1371/journal.pgen.1006075
Publisher Public Library of Science
Version Final published version
Citable link http://hdl.handle.net/1721.1/103774
Terms of Use Creative Commons Attribution 4.0 International License
Detailed Terms http://creativecommons.org/licenses/by/4.0/
RESEARCH ARTICLE
Nutrient Control of Yeast Gametogenesis IsMediated by TORC1, PKA and EnergyAvailabilityHilla Weidberg1, Fabien Moretto2, Gianpiero Spedale2, Angelika Amon1, Folkert J. vanWerven2*
1 David H. Koch Institute for Integrative Cancer Research and Howard Hughes Medical Institute,Massachusetts Institute of Technology, Cambridge, Massachusetts, United States of America, 2 Cell Fateand Gene Regulation Laboratory, The Francis Crick Institute, London, United Kingdom
AbstractCell fate choices are tightly controlled by the interplay between intrinsic and extrinsic sig-
nals, and gene regulatory networks. In Saccharomyces cerevisiae, the decision to enter into
gametogenesis or sporulation is dictated by mating type and nutrient availability. These sig-
nals regulate the expression of the master regulator of gametogenesis, IME1. Here we
describe how nutrients control IME1 expression. We find that protein kinase A (PKA) and
target of rapamycin complex I (TORC1) signalling mediate nutrient regulation of IME1expression. Inhibiting both pathways is sufficient to induce IME1 expression and complete
sporulation in nutrient-rich conditions. Our ability to induce sporulation under nutrient rich
conditions allowed us to show that respiration and fermentation are interchangeable energy
sources for IME1 transcription. Furthermore, we find that TORC1 can both promote and
inhibit gametogenesis. Down-regulation of TORC1 is required to activate IME1. However,complete inactivation of TORC1 inhibits IME1 induction, indicating that an intermediate
level of TORC1 signalling is required for entry into sporulation. Finally, we show that the
transcriptional repressor Tup1 binds and represses the IME1 promoter when nutrients are
ample, but is released from the IME1 promoter when both PKA and TORC1 are inhibited.
Collectively our data demonstrate that nutrient control of entry into sporulation is mediated
by a combination of energy availability, TORC1 and PKA activities that converge on the
IME1 promoter.
Author Summary
The cell-fate controlling gametogenesis is essential for all sexual reproducing organisms.In Saccharomyces cerevisiae, entry into gametogenesis or sporulation is dictated by matingtype and nutrient availability. These signals regulate the expression of the master regulatorof entry into sporulation, IME1. In this manuscript we describe how nutrients controlIME1. We show that inhibiting two highly conserved nutrient sensing pathways (PKA and
PLOSGenetics | DOI:10.1371/journal.pgen.1006075 June 6, 2016 1 / 26
a11111
OPEN ACCESS
Citation:Weidberg H, Moretto F, Spedale G, AmonA, van Werven FJ (2016) Nutrient Control of YeastGametogenesis Is Mediated by TORC1, PKA andEnergy Availability. PLoS Genet 12(6): e1006075.doi:10.1371/journal.pgen.1006075
Editor: Michael Lichten, National Cancer Institute,UNITED STATES
Received: December 15, 2015
Accepted: May 2, 2016
Published: June 6, 2016
Copyright: © 2016 Weidberg et al. This is an openaccess article distributed under the terms of theCreative Commons Attribution License, which permitsunrestricted use, distribution, and reproduction in anymedium, provided the original author and source arecredited.
Data Availability Statement: All relevant data arewithin the paper and its Supporting Information files.
Funding: HW was supported by the Jane CoffinChilds Memorial Fund, the EMBO Long-TermFellowship, and the Israel National PostdoctoralProgram for Advancing Women in Science. Thisresearch was also supported by NIH grant GM62207to AA. The research of FJvW is supported by theFrancis Crick Institute, which receives its core fundingfrom Cancer Research UK, the UK Medical ResearchCouncil, and the Wellcome Trust. The funders had norole in study design, data collection and analysis,decision to publish, or preparation of the manuscript.
TORC1) mimics starvation-induced sporulation and drives cells to induce IME1 and com-plete meiosis in nutrient-rich conditions. In addition, we show that respiration and fer-mentation are interchangeable energy providers for entry into gametogenesis. Finally, wehave uncovered a critical role for TORC1 during entry into gametogenesis. In addition tothe known role of TORC1 in repressing IME1, we find that intermediate TORC1 activityis required for entry in gametogenesis. Too much or too little TORC1 activity inhibitsgametogenesis. Our data explains how two conserved signalling pathways control a devel-opmental decision essential for sexual reproduction, about which remarkably little isknown in all eukaryotes. Thus the activities of two nutrient sensing pathways and energyavailability determine whether cells enter gametogenesis or not.
IntroductionCellular differentiation programs are controlled by environmental and cell intrinsic events.How cells integrate multiple stimuli to regulate cell fate choice is poorly understood. The yeastSaccharomyces cerevisiae is an ideal model to study this problem. In response to multiple, well-defined signals, yeast cells induce a differentiation program to form four haploid gametes orspores [1, 2]. Gametogenesis or sporulation is characterized by a specialized cell division calledmeiosis. During sporulation diploid cells undergo a single round of DNA replication followedby two consecutive nuclear divisions, meiosis, to generate progeny containing half the numberof chromosomes of the diploid parent cell.
The initiation of gametogenesis is controlled by cell-intrinsic and cell-extrinsic signals,which together regulate a single master transcription factor called inducer of meiosis I, IME1[3, 4]. In cells expressing a single mating type,MATa orMATα, IME1 is repressed by transcrip-tion coupled repression of the IME1 promoter involving the long noncoding RNA IRT1 [5]. InMATa/α diploid cells Rme1, the transcriptional activator of IRT1, is repressed. As a conse-quence these cells express IME1 upon nutrient deprivation [6]. For efficient IME1 induction afermentable carbon source and nitrogen need to be absent from the growth medium. Underthese conditions cells produce ATP via oxidative phosphorylation to facilitate IME1 expression[7, 8].
Two conserved signalling pathways have been implicated in nutrient regulation of IME1expression. First, the presence of glucose in the growth medium activates the Ras/cAMP-dependent Protein Kinase A (PKA) pathway, which in turn inhibits IME1 and entry into spor-ulation [9, 10]. The second regulator of IME1 is the target of rapamycin complex I (TORC1).TORC1 promotes macromolecule biosynthesis in response to nitrogen and amino acid avail-ability [11]. When nitrogen sources/amino acids are ample, TORC1 is active and inhibits IME1and sporulation [7, 12]. Whether PKA and TORC1 are the main mediators of nutrient controlof IME1, and how the two pathways control entry into sporulation is not well understood.
Here we describe how nutrients control IME1 expression. We find that PKA and TORC1signalling account for the majority of IME1 regulation by nutrients. Inhibition of PKA andTORC1 activity is sufficient to induce IME1 expression even in the presence of high levels ofnutrients. Under these conditions, cells induce IME1, complete meiosis, and generate sporeswith kinetics that are highly reminiscent of those observed under starvation conditions. Theability to induce sporulation in the presence of ample nutrients further allowed us to investigatethe importance of respiration and TORC1 activity for the induction of gametogenesis. We findthat respiration and fermentation are interchangeable for IME1 induction. Both metabolicpathways can serve as energy providers during entry into sporulation. Our analysis further
Nutrient Control of Yeast Gametogenesis Is Mediated by TORC1, PKA and Energy Availability
PLOS Genetics | DOI:10.1371/journal.pgen.1006075 June 6, 2016 2 / 26
Competing Interests: The authors have declaredthat no competing interests exist.
shows that intermediate levels of TORC1 activity are critical for gametogenesis. When TORC1is fully active or completely inhibited, IME1 is repressed. Finally, we show that the transcrip-tional repressor Tup1 binds to and represses the IME1 promoter when TORC1 and/or PKAare active, but not when both pathways are inhibited. Importantly, depletion of Tup1 is suffi-cient to mimic starvation-induced IME1 expression. Our data demonstrate that nutrient con-trol of sporulation is sensed and orchestrated by TORC1 and PKA signalling pathways and bythe availability of energy.
Results
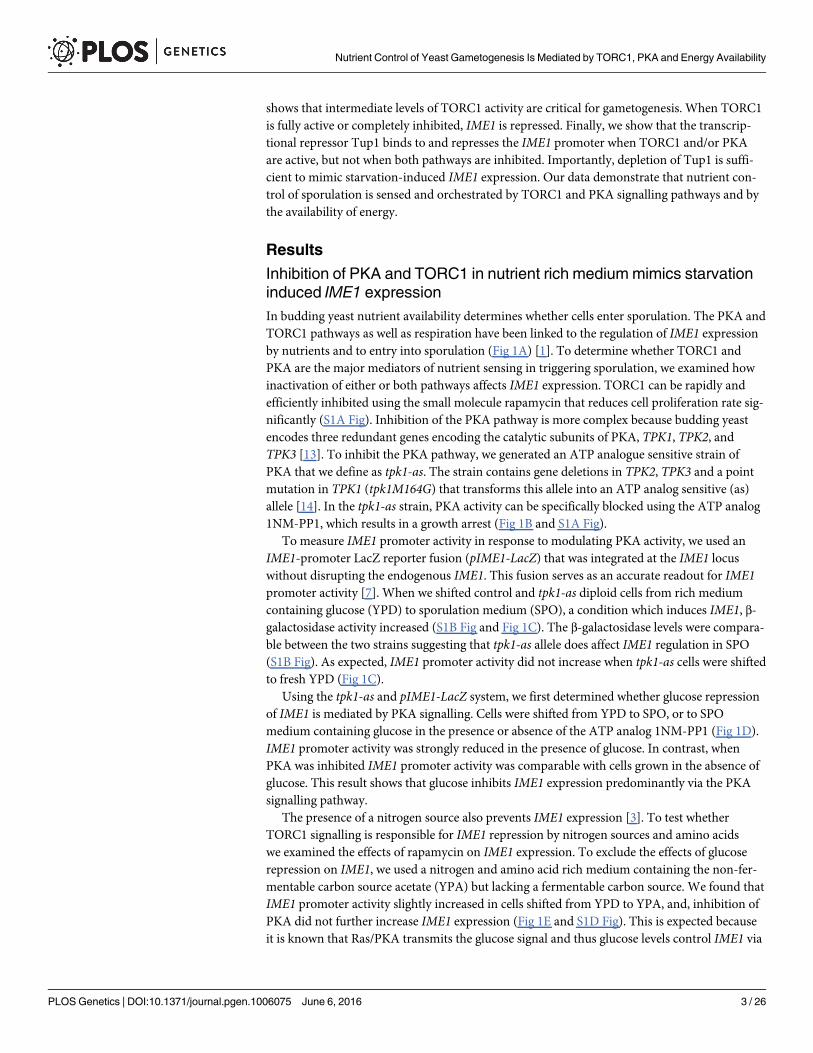
Inhibition of PKA and TORC1 in nutrient rich medium mimics starvationinduced IME1 expressionIn budding yeast nutrient availability determines whether cells enter sporulation. The PKA andTORC1 pathways as well as respiration have been linked to the regulation of IME1 expressionby nutrients and to entry into sporulation (Fig 1A) [1]. To determine whether TORC1 andPKA are the major mediators of nutrient sensing in triggering sporulation, we examined howinactivation of either or both pathways affects IME1 expression. TORC1 can be rapidly andefficiently inhibited using the small molecule rapamycin that reduces cell proliferation rate sig-nificantly (S1A Fig). Inhibition of the PKA pathway is more complex because budding yeastencodes three redundant genes encoding the catalytic subunits of PKA, TPK1, TPK2, andTPK3 [13]. To inhibit the PKA pathway, we generated an ATP analogue sensitive strain ofPKA that we define as tpk1-as. The strain contains gene deletions in TPK2, TPK3 and a pointmutation in TPK1 (tpk1M164G) that transforms this allele into an ATP analog sensitive (as)allele [14]. In the tpk1-as strain, PKA activity can be specifically blocked using the ATP analog1NM-PP1, which results in a growth arrest (Fig 1B and S1A Fig).
To measure IME1 promoter activity in response to modulating PKA activity, we used anIME1-promoter LacZ reporter fusion (pIME1-LacZ) that was integrated at the IME1 locuswithout disrupting the endogenous IME1. This fusion serves as an accurate readout for IME1promoter activity [7]. When we shifted control and tpk1-as diploid cells from rich mediumcontaining glucose (YPD) to sporulation medium (SPO), a condition which induces IME1, β-galactosidase activity increased (S1B Fig and Fig 1C). The β-galactosidase levels were compara-ble between the two strains suggesting that tpk1-as allele does affect IME1 regulation in SPO(S1B Fig). As expected, IME1 promoter activity did not increase when tpk1-as cells were shiftedto fresh YPD (Fig 1C).
Using the tpk1-as and pIME1-LacZ system, we first determined whether glucose repressionof IME1 is mediated by PKA signalling. Cells were shifted from YPD to SPO, or to SPOmedium containing glucose in the presence or absence of the ATP analog 1NM-PP1 (Fig 1D).IME1 promoter activity was strongly reduced in the presence of glucose. In contrast, whenPKA was inhibited IME1 promoter activity was comparable with cells grown in the absence ofglucose. This result shows that glucose inhibits IME1 expression predominantly via the PKAsignalling pathway.
The presence of a nitrogen source also prevents IME1 expression [3]. To test whetherTORC1 signalling is responsible for IME1 repression by nitrogen sources and amino acidswe examined the effects of rapamycin on IME1 expression. To exclude the effects of glucoserepression on IME1, we used a nitrogen and amino acid rich medium containing the non-fer-mentable carbon source acetate (YPA) but lacking a fermentable carbon source. We found thatIME1 promoter activity slightly increased in cells shifted from YPD to YPA, and, inhibition ofPKA did not further increase IME1 expression (Fig 1E and S1D Fig). This is expected becauseit is known that Ras/PKA transmits the glucose signal and thus glucose levels control IME1 via
Nutrient Control of Yeast Gametogenesis Is Mediated by TORC1, PKA and Energy Availability
PLOS Genetics | DOI:10.1371/journal.pgen.1006075 June 6, 2016 3 / 26
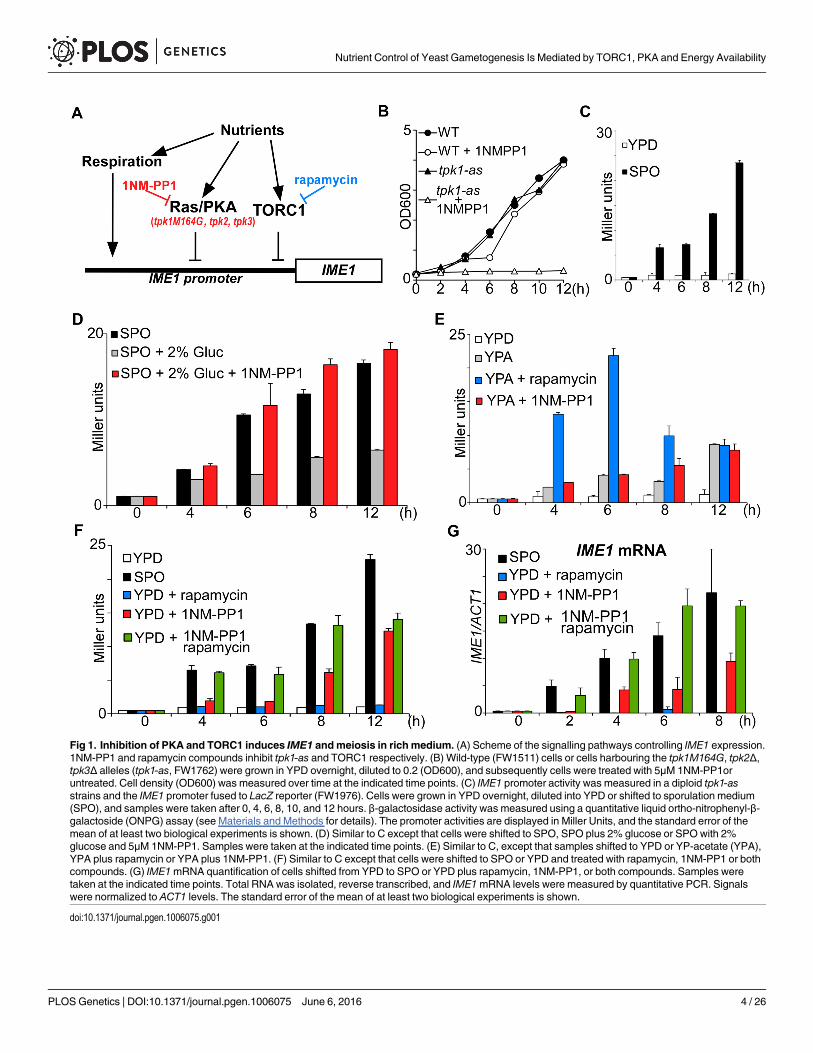
Fig 1. Inhibition of PKA and TORC1 induces IME1 andmeiosis in rich medium. (A) Scheme of the signalling pathways controlling IME1 expression.1NM-PP1 and rapamycin compounds inhibit tpk1-as and TORC1 respectively. (B) Wild-type (FW1511) cells or cells harbouring the tpk1M164G, tpk2Δ,tpk3Δ alleles (tpk1-as, FW1762) were grown in YPD overnight, diluted to 0.2 (OD600), and subsequently cells were treated with 5μM 1NM-PP1oruntreated. Cell density (OD600) was measured over time at the indicated time points. (C) IME1 promoter activity was measured in a diploid tpk1-asstrains and the IME1 promoter fused to LacZ reporter (FW1976). Cells were grown in YPD overnight, diluted into YPD or shifted to sporulation medium(SPO), and samples were taken after 0, 4, 6, 8, 10, and 12 hours. β-galactosidase activity was measured using a quantitative liquid ortho-nitrophenyl-β-galactoside (ONPG) assay (see Materials and Methods for details). The promoter activities are displayed in Miller Units, and the standard error of themean of at least two biological experiments is shown. (D) Similar to C except that cells were shifted to SPO, SPO plus 2% glucose or SPO with 2%glucose and 5μM 1NM-PP1. Samples were taken at the indicated time points. (E) Similar to C, except that samples shifted to YPD or YP-acetate (YPA),YPA plus rapamycin or YPA plus 1NM-PP1. (F) Similar to C except that cells were shifted to SPO or YPD and treated with rapamycin, 1NM-PP1 or bothcompounds. (G) IME1mRNA quantification of cells shifted from YPD to SPO or YPD plus rapamycin, 1NM-PP1, or both compounds. Samples weretaken at the indicated time points. Total RNA was isolated, reverse transcribed, and IME1mRNA levels were measured by quantitative PCR. Signalswere normalized to ACT1 levels. The standard error of the mean of at least two biological experiments is shown.
doi:10.1371/journal.pgen.1006075.g001
Nutrient Control of Yeast Gametogenesis Is Mediated by TORC1, PKA and Energy Availability
PLOS Genetics | DOI:10.1371/journal.pgen.1006075 June 6, 2016 4 / 26
PKA [3, 9, 10, 15, 16]. When we inhibited TORC1, by treating cells grown in YPA mediumwith rapamycin, IME1 was rapidly induced. The majority of cells (95%) were also able to formspores within 24 hours (S1 Table). We conclude, as reported previously, that the PKA pathwaytransmits the glucose signal to the IME1 promoter, and that TORC1 most likely transmits thenitrogen signal [3, 9].
To examine whether PKA and TORC1 are the major mediators of nutrient control of IME1expression, we inhibited either or both pathways in cells grown in rich medium containing glu-cose (YPD) (Fig 1F and S1C Fig). Inhibition of TORC1 had no effect on IME1 expression. Incontrast, IME1 promoter activity strongly increased between 8 to 12 hours following treatmentwith PKA inhibitors. Interestingly, when both PKA and TORC1 were inhibited, IME1 induc-tion was already noticeable at 4 hours, and peaked at 8 hours and was remarkably similar tolevels seen in cells incubated in SPO medium (Fig 1F and S1 Fig). Similar results were obtainedwhen IME1mRNA levels were examined (Fig 1G). These data show that the combined inhibi-tion of PKA and TORC1 activities is sufficient to mimic nutrient control of IME1 expression.We conclude that TORC1 and PKA are two major mediators of nutrient regulation of IME1expression.
Inhibition of PKA and TORC1 induces IME1 expression in the majority ofcellsOur results show that inhibition of PKA leads to some degree of IME1 expression in richmedium (YPD) (approximately 50% of that observed in SPO medium; Fig 1F and 1G). Oneexplanation for this observation is that PKA inhibition induces IME1 at low or intermediatelevels in all cells. It is also possible that IME1 induction occurs only in a subpopulation of cellswhen PKA is inhibited. To distinguish between these possibilities, we measured the distribu-tion of IME1 expression in cells by single molecule RNA fluorescence in situ hybridization(smFISH) (Fig 2A). The technique can reliably measure absolute transcript levels in single cells[17]. To ensure that the signals were specific and probes entered the cells, we first measuredIME1 and ACT1 transcript levels in wild-type and ime1Δ diploid cells that were induced inSPOmedium (S2 Fig). While IME1 was expressed in the wild type, no transcripts were detectedin ime1Δ cells. As expected, ACT1 levels were comparable between the two strains (S2B Fig).Next, we counted the mean number of IME1 transcripts in cells grown in rich medium shiftedto SPO medium, or treated with PKA or PKA/TORC1 inhibitors (Figs 2A and 1B). The IME1expression pattern matched the RT-PCR experiment (compare Figs 1G and 2B). In cells treatedwith the PKA inhibitor IME1 levels increased after 8 hours to about 10 copies per cell on aver-age. When both TORC1 and PKA were inhibited, IME1 was transcribed efficiently and cellscontained on average 30 copies per cell at 8 hours after treatment, which was comparable toIME1 levels in SPO medium (Fig 2B).
It is worth noting that IME1mRNA levels decline sharply 12 hours after inhibition of thePKA and TORC1 pathways but remained elevated in cells incubated in SPO medium for thesame amount of time (Fig 2B). Given that expression of IME1 is known to decline when cellsundergo meiotic divisions, a plausible explanation is that progression into meiosis differsbetween the two conditions [18]. Indeed, when PKA and TORC1 were inhibited the majorityof cells underwent meiotic divisions within 12 hours (see next section for details). In contrast,when cells were directly transferred from YPD medium into SPO medium sporulation did notoccur efficiently, and it is likely that many (more than 50%) of the cells were arrested in inter-mediate stages of meiosis (S1 Table). Therefore a decline in IME1 was not observed at 12 hours(Fig 2B). Finally, we would like to point out that we did not see a decline in pIME1-LacZ
Nutrient Control of Yeast Gametogenesis Is Mediated by TORC1, PKA and Energy Availability
PLOS Genetics | DOI:10.1371/journal.pgen.1006075 June 6, 2016 5 / 26
Fig 2. Single cell quantification of IME1. (A) Representative images used for the analyses of IME1 and ACT1 transcript levels insingle cells. Cells harbouring tpk1-as (FW1762) were grown in YPD overnight and were either shifted to SPO, or diluted into freshYPD plus rapamycin, 1NM-PP1 or 1NM-PP1/rapamycin. Cells were fixed, hybridized with probes directed against IME1 (AF594)and ACT1 (Cy5), and were imaged (see Materials and Methods for details). ACT1 was used as an internal control and only ACT1positive cells were selected for the analysis. (B) Mean of IME1 and ACT1 transcripts’ number among single cells as described in A.
Nutrient Control of Yeast Gametogenesis Is Mediated by TORC1, PKA and Energy Availability
PLOS Genetics | DOI:10.1371/journal.pgen.1006075 June 6, 2016 6 / 26
reporter activity even when cells progressed into meiosis (Fig 1F). This can be explained by thelong half-life of β-galactosidase (more than 20 hours) [19].
Next, we analysed IME1 abundance in single cells. We binned the single cell expression datainto five classes of transcript levels (0–5, 6–10, 11–15, 16–20 and 21 or more transcripts). Inuntreated cells more than 95 percent of cells had no or low levels of IME1, whereas ACT1 wasexpressed strongly in the majority cells (Fig 2C). In line with previous observations, rapamycintreatment had no effect on IME1 expression (Fig 2D). Interestingly, when PKA was inhibitedthe majority of cells expressed no or low levels of IME1 (0–5 copies per cell), but approximately20% of cells expressed high levels of IME1 (21 or more copies per cell) (Fig 2E). When bothPKA and TORC1 were inhibited the majority of cells (more than 75%) harboured high levelsof IME1 RNA, which was comparable to SPO medium (compare Fig 2F and 2G). These datacomplement our population based assays and show that inhibition of PKA/TORC1 leads tosignificant IME1 expression in the majority of cells grown in nutrient-rich conditions.
Inhibition of TORC1/PKA induces meiosisLittle is known about how nutrient signalling controls other aspects of sporulation. To deter-mine the consequences of PKA and TORC1 inhibition on meiotic progression, we examinedsubsequent stages of meiosis by measuring the kinetics of meiosis in cells shifted to YPD con-taining inhibitors of PKA and TORC1. Interestingly, less than 15% of cells underwent meioticdivisions when only PKA was inhibited. Given that a significant higher portion of cells werepositive for intermediate or high levels of IME1 compared to number of cells that underwentmeiotic divisions (Fig 2D and 2E), the result suggests that events downstream of IME1 are per-haps not efficiently induced in these cells. More than 90% of cells underwent meiotic divisionswhen both PKA and TORC1 were inhibited (Fig 3A). Under this condition cells also formedspores, but 70 percent (224 out 320 spores) of spores formed colonies compared to 95 percent(304 out of 320 spores) for the wild-type cells induced to sporulate in SPOmedium. Thisreduced spore viability was not due to the tpk1-as allele being hypomorphic, because the samestrain sporulated efficiently and exhibited 94 percent (301 out of 320 spores) spore viability inSPOmedium (Fig 3B). Apart from reduced spore viability, we also observed a strong enrich-ment for triads in cells treated with PKA/TORC1 inhibitors (Fig 3C). Although four DAPI mas-ses formed during the two meiotic divisions, three were packaged into spores and one nucleuswas evicted or degraded from cells (Fig 3C and 3D). We conclude that inhibition of TORC1 andPKA is sufficient to drive entry into and progression through the sporulation program.
Fermentation and respiration are interchangeable energy providers forIME1 transcriptionRespiration is needed for IME1 transcription and for entry into sporulation [7, 8]. However, itis not clear whether IME1 expression is dependent on the energy produced by respiration or
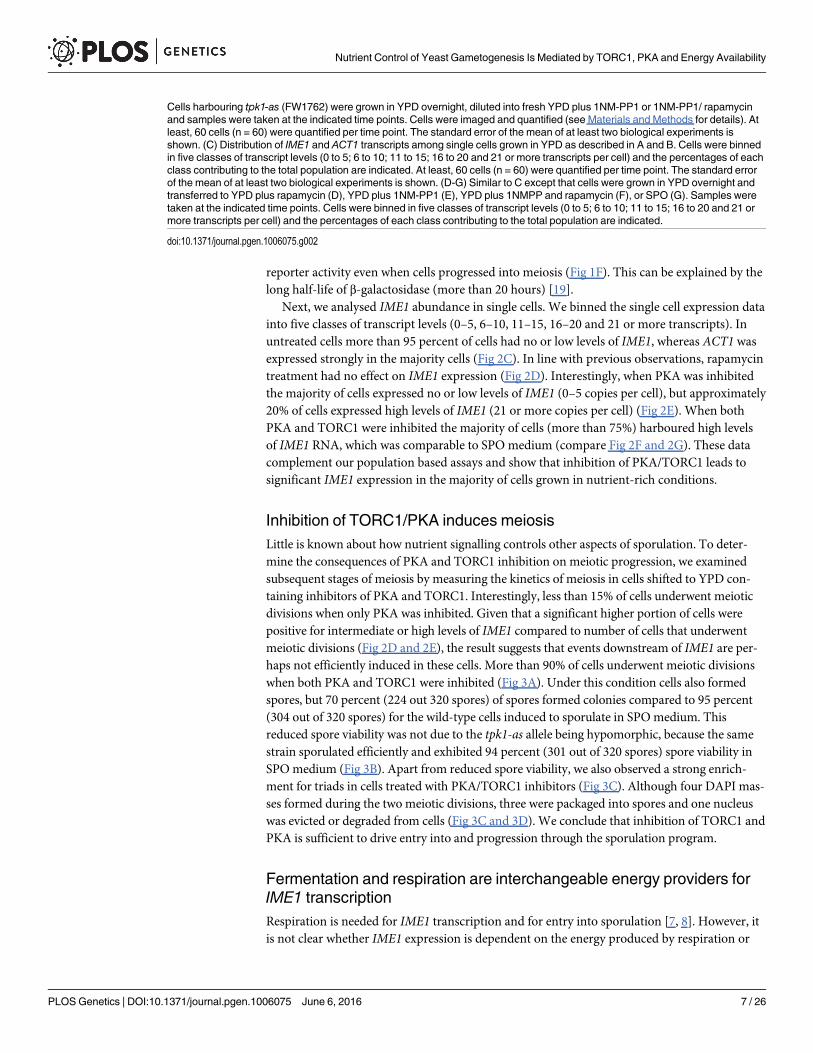
Cells harbouring tpk1-as (FW1762) were grown in YPD overnight, diluted into fresh YPD plus 1NM-PP1 or 1NM-PP1/ rapamycinand samples were taken at the indicated time points. Cells were imaged and quantified (see Materials and Methods for details). Atleast, 60 cells (n = 60) were quantified per time point. The standard error of the mean of at least two biological experiments isshown. (C) Distribution of IME1 and ACT1 transcripts among single cells grown in YPD as described in A and B. Cells were binnedin five classes of transcript levels (0 to 5; 6 to 10; 11 to 15; 16 to 20 and 21 or more transcripts per cell) and the percentages of eachclass contributing to the total population are indicated. At least, 60 cells (n = 60) were quantified per time point. The standard errorof the mean of at least two biological experiments is shown. (D-G) Similar to C except that cells were grown in YPD overnight andtransferred to YPD plus rapamycin (D), YPD plus 1NM-PP1 (E), YPD plus 1NMPP and rapamycin (F), or SPO (G). Samples weretaken at the indicated time points. Cells were binned in five classes of transcript levels (0 to 5; 6 to 10; 11 to 15; 16 to 20 and 21 ormore transcripts per cell) and the percentages of each class contributing to the total population are indicated.
doi:10.1371/journal.pgen.1006075.g002
Nutrient Control of Yeast Gametogenesis Is Mediated by TORC1, PKA and Energy Availability
PLOS Genetics | DOI:10.1371/journal.pgen.1006075 June 6, 2016 7 / 26
whether it requires a signal from active mitochondria. The system we developed to inducesporulation in the presence of ample nutrients allowed us to investigate this question.
First, we analysed how IME1 expression is affected in respiratory deficient cells. Pet100 isrequired for the assembly of cytochrome c oxidase. Yeast cells lacking the PET100 gene cannotrespire. In line with previous observations, pet100Δ cells did not induce IME1 in SPO medium(Fig 4A, compare lanes 1–4 to 5–8) [7]. Likewise, cells treated with the drugs antimycin A(antimycin), which inhibits cytochrome c reductase, or oligomycin, which inhibits the Fo sub-unit of the mitochondrial ATP synthase, did not induce IME1 (Fig 4B, compare lanes 1–4 to5–8 and 9–12). Uncoupling of respiration from energy production by treating cells with CCCPwhich disrupts the proton gradient and thus reduces the ability of the ATP synthase to function
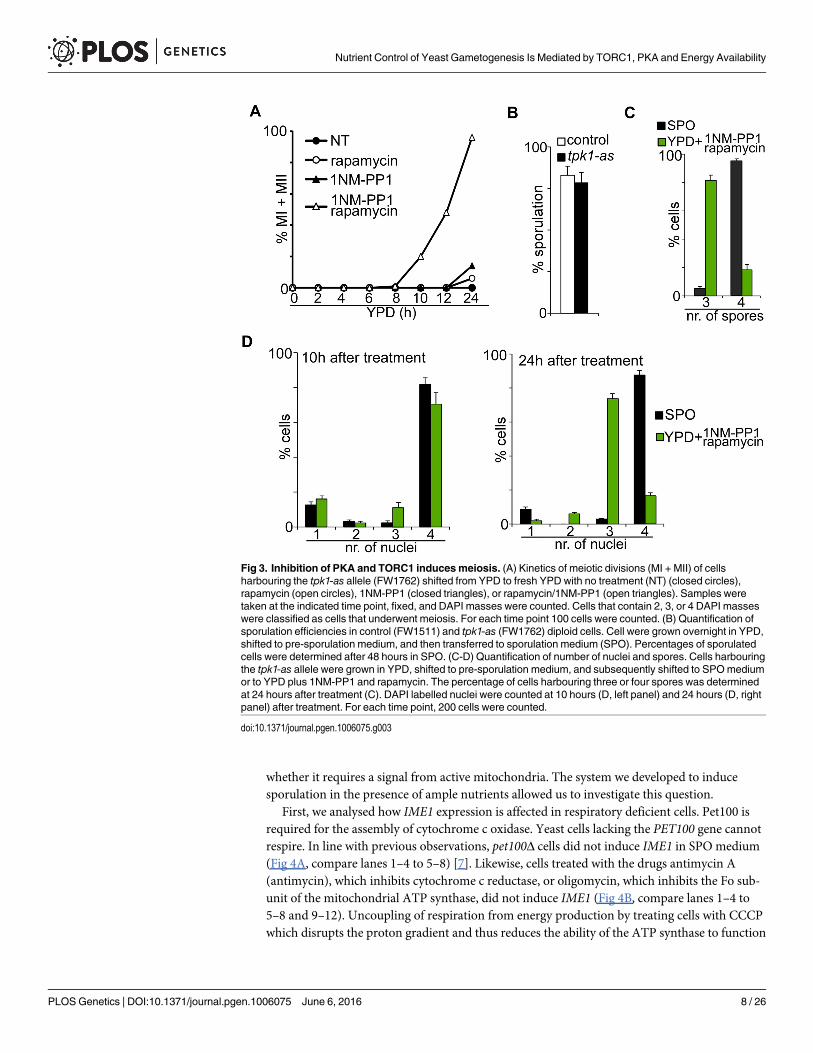
Fig 3. Inhibition of PKA and TORC1 inducesmeiosis. (A) Kinetics of meiotic divisions (MI + MII) of cellsharbouring the tpk1-as allele (FW1762) shifted from YPD to fresh YPD with no treatment (NT) (closed circles),rapamycin (open circles), 1NM-PP1 (closed triangles), or rapamycin/1NM-PP1 (open triangles). Samples weretaken at the indicated time point, fixed, and DAPI masses were counted. Cells that contain 2, 3, or 4 DAPI masseswere classified as cells that underwent meiosis. For each time point 100 cells were counted. (B) Quantification ofsporulation efficiencies in control (FW1511) and tpk1-as (FW1762) diploid cells. Cell were grown overnight in YPD,shifted to pre-sporulation medium, and then transferred to sporulation medium (SPO). Percentages of sporulatedcells were determined after 48 hours in SPO. (C-D) Quantification of number of nuclei and spores. Cells harbouringthe tpk1-as allele were grown in YPD, shifted to pre-sporulation medium, and subsequently shifted to SPOmediumor to YPD plus 1NM-PP1 and rapamycin. The percentage of cells harbouring three or four spores was determinedat 24 hours after treatment (C). DAPI labelled nuclei were counted at 10 hours (D, left panel) and 24 hours (D, rightpanel) after treatment. For each time point, 200 cells were counted.
doi:10.1371/journal.pgen.1006075.g003
Nutrient Control of Yeast Gametogenesis Is Mediated by TORC1, PKA and Energy Availability
PLOS Genetics | DOI:10.1371/journal.pgen.1006075 June 6, 2016 8 / 26

Fig 4. Respiration is not essential to IME1 induction. (A) Northern blot analysis of IME1 expression in control (FW1762, lanes 1–4) and pet100Δmutant (FW1770, lanes 5–8). Cells were grown overnight in YPDmedium and shifted to sporulation medium (SPO), and samples were taken at theindicated time points. (B) Similar to A except that cells (FW1762) were grown in pre-sporulation medium before shifted to SPO. Subsequently, cells wereeither not treated (lanes 1–4), treated with antimycin A (50 μM, lanes 5–8), oligomycin (10 μM, lanes 9–12), or with CCCP (20 μM, lanes 13–16). (C)Similar to A, except that cells were diluted into 1NM-PP1 and rapamycin containing YPD (lanes 1–16), and treated with antimycin A (lanes 5–8) oroligomycin (lanes 9–12). The pet100Δmutant (lanes 13–16) was also included in the analyses. (D) IME1 promoter activity was measured using a diploidstrain harbouring tpk1-as and the IME1 promoter fused to LacZ reporter (FW1976). Cells were grown in YPD overnight, diluted into YPD plus 1NM-PP1/rapamycin or shifted to sporulation medium (SPO) in the presence or absence of oligomycin (10 μM). Samples were taken after 0, 4, 6, 8, and 12 hours. β-galactosidase activity was measured using a quantitative liquid ortho-Nitrophenyl-β-galactoside (ONPG) assay (see Materials and Methods for details).The promoter activities are displayed in Miller Units, and the standard error of the mean of at least two biological experiments is shown. (E) Quantificationof IME1mRNA levels in a strain harbouring theGAL1 promoter fused to IME1 andGAL4-ER (FW3243). Cells were grown in YPD, shifted to pre-sporulation medium, and transferred to SPO in the absence or presence of antimycin A. TheGAL1 promoter was activated using estradiol. Total RNAwas isolated, reverse transcribed, and IME1mRNA levels were measured by quantitative PCR. Signals were normalized to ACT1 levels. The standarderror of the mean of at least two biological experiments is shown. (F) Quantification of sporulation efficiency of strains and treatments described in C. Atleast n = 200 cells were counted at 48 hours after treatment. Untreated diploid cells were included as a negative control.
doi:10.1371/journal.pgen.1006075.g004
Nutrient Control of Yeast Gametogenesis Is Mediated by TORC1, PKA and Energy Availability
PLOS Genetics | DOI:10.1371/journal.pgen.1006075 June 6, 2016 9 / 26
led to similar results (Fig 4B, compare lanes 1–4 and 13–16). Thus, respiration is required forinduction of IME1 expression in sporulation medium.
Next, we induced sporulation by inhibiting PKA and TORC1 in cells grown in glucose-richmedium, and tested whether respiration is required for IME1 expression. To our surprise,IME1 expression levels were comparable between control cells, and antimycin or oligomycintreated cells (Fig 4C, compare lanes 1–4 to 5–8 or 9–12). pet100Δ cells grown in YPD stronglyinduced IME1 when the PKA and TORC1 pathways were inhibited (Fig 4C, compare lanes 1–4to 13–16). To further quantify IME1 promoter activity in respiratory deficient cells, we mea-sured pIME1-LacZ reporter expression in oligomycin treated cells. As expected, in SPOmedium the IME1 promoter stayed repressed when cells were treated with oligomycin. In YPDplus TORC1 and PKA inhibitors, IME1 expression accumulated with slightly slower kinetics inthe presence of oligomycin but peaked to similar levels as control cells (Fig 4D). Finally weexamined whether IME1 can be induced from a heterologous promoter in SPO medium whenrespiration is inhibited (Fig 4E). When we induced IME1 from the GAL1 promoter using aGal4-estrogen receptor fusion (GAL4-ER) that can be activated by the addition of estradiol,IME1 was strongly induced. However, in cells treated with antimycin IME1 stayed repressed.Previous work showed that expression of mRNAs from different genes is also affected underthis condition [7]. We propose that the effects are not specific for IME1, but either transcrip-tion or mRNA stability or both are generally affected when cells are starved and cannot respire.Notably, even though cells were able to express IME1 when respiration was inhibited in YPDmedium with TORC1 and PKA inhibitors the vast majority of these cells did not completegametogenesis (Fig 4F) indicating that other stages of sporulation require respiration. In con-clusion, when sporulation is induced in the presence of ample nutrients, respiration is notrequired for IME1 expression. This result suggests that either respiration or fermentation canserve as energy providers for induction of IME1 transcription.
TORC1 activity enables efficient IME1 induction and meiosisOur results show that inhibition of PKA and TORC1 activity is sufficient to initiate entry intosporulation. Although it is well established that PKA signalling inhibits sporulation, inhibitionof TORC1 by rapamycin treatment has been reported to affect sporulation with different out-comes. We and others have shown that rapamycin can stimulate sporulation by inducingIME1 expression [7]. Moreover, inactivation of TORC1 was shown to stabilize Ime1 and pro-motes its nuclear localization [20]. However, others have found that rapamycin can also inhibitspore formation in budding and fission yeast when added to the SPO medium [21, 22]. Theseseemingly conflicting results prompted us to further examine how rapamycin and TORC1 con-trol sporulation.
First, we tested whether there is a concentration dependent effect of rapamycin on cellgrowth and sporulation. Rapamycin treatment at the concentration which ensures efficientsporulation (1000 ng/ml) diminished, but did not stop cell proliferation (190 min versus 90min in control cells; Fig 5A). This observation suggests that TORC1 is still active. When weused 50 fold less rapamycin (20 ng/ml), cell proliferation was somewhat affected (145 min ver-sus 90 min in control cells), and cells sporulated efficiently when combined with inhibition ofPKA (Fig 5A, right panel). Lower concentrations of rapamycin had no observable effect ongrowth and sporulation. These results indicate that the TORC1 pathway is not completelyblocked upon entry into sporulation and meiosis.
In line with our observation that rapamycin does not abolish growth completely, a recentstudy showed that rapamycin, irrespective of the concentration used, does not fully inhibitTORC1 activity [23]. Depletion or inactivation of the Kog1 subunit of the TORC1 complex,
Nutrient Control of Yeast Gametogenesis Is Mediated by TORC1, PKA and Energy Availability
PLOS Genetics | DOI:10.1371/journal.pgen.1006075 June 6, 2016 10 / 26
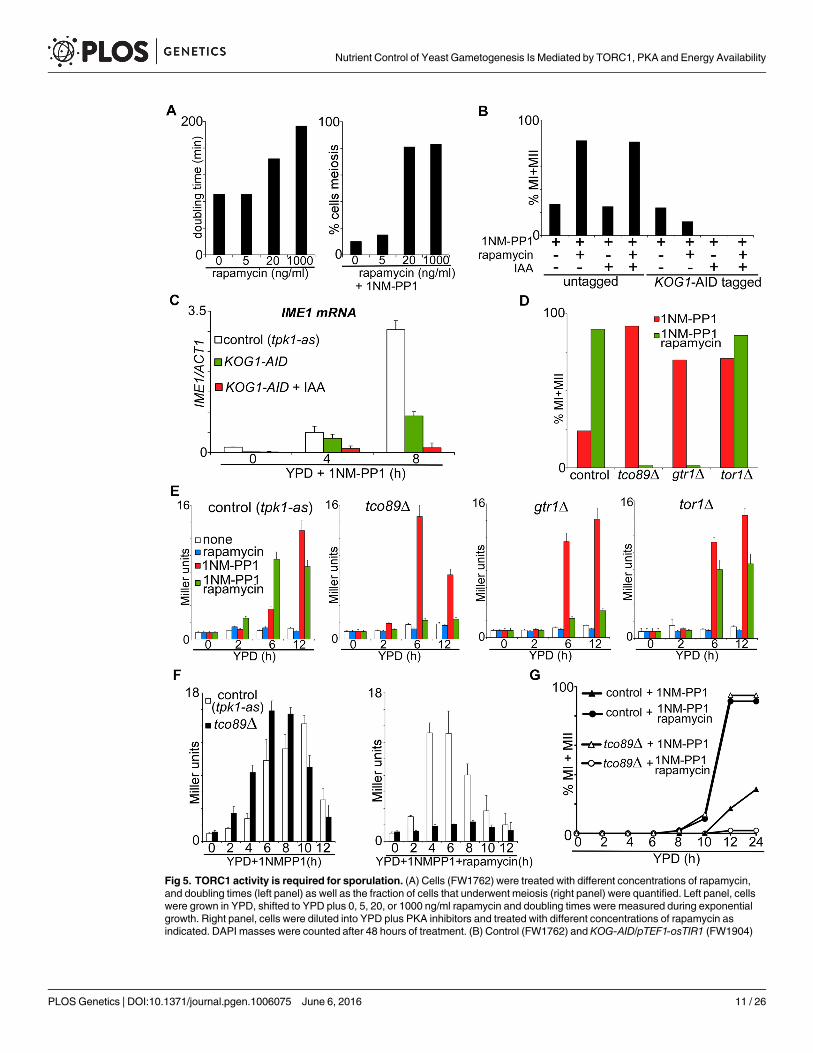
Fig 5. TORC1 activity is required for sporulation. (A) Cells (FW1762) were treated with different concentrations of rapamycin,and doubling times (left panel) as well as the fraction of cells that underwent meiosis (right panel) were quantified. Left panel, cellswere grown in YPD, shifted to YPD plus 0, 5, 20, or 1000 ng/ml rapamycin and doubling times were measured during exponentialgrowth. Right panel, cells were diluted into YPD plus PKA inhibitors and treated with different concentrations of rapamycin asindicated. DAPI masses were counted after 48 hours of treatment. (B) Control (FW1762) and KOG-AID/pTEF1-osTIR1 (FW1904)
Nutrient Control of Yeast Gametogenesis Is Mediated by TORC1, PKA and Energy Availability
PLOS Genetics | DOI:10.1371/journal.pgen.1006075 June 6, 2016 11 / 26

however, causes a complete growth arrest and a starvation response [24, 25]. We thereforedepleted Kog1 using an auxin induced degradation system (AID) system [26] and examinedthe effects on IME1 expression and sporulation. The system relies on Oryza sativa TIR1 (pTE-F1-osTIR1), which interacts with the SCF ubiquitin ligase, and the chemical indole-3-aceticacid (IAA), which allows for the SCF-TIR1 and E2 ubiquitin ligases to come together to polyu-biquitinate and subsequently degrade AID by the proteasome [26]. Tagging Kog1 with theAID-tag decreased Kog1 activity as judged by reduced proliferation of cells carrying theKOG1-AID allele (S3A Fig). However, when KOG1-AID cells expressing pTEF1-osTIR1 weretreated with IAA to deplete Kog1, growth and proliferation were completely abolished (S3Aand S3B Fig). The AID tag also partially interfered with sporulation as Kog1-AID cells exhib-ited reduced meiosis efficiency following treatment with PKA inhibitors and rapamycin (Fig5B). Nonetheless, it was evident that depletion of Kog1 strongly affected IME1 expression andas a result meiosis did not occur (Fig 5B and 5C). In conclusion, when we induce sporulationby inhibiting PKA in nutrient rich conditions, Kog1 is required for entry into sporulation.
Given that inactivation of TORC1 by depleting Kog1 abolished the cells’ ability to sporulate,we hypothesized that some TORC1 activity is needed for entry into sporulation. To test thishypothesis we modulated TORC1 activity. A number of TORC1 pathway mutants have beenisolated previously and have been shown to reduce basal TORC1 activity [27–29]. Typically,these mutants are hypersensitive to rapamycin and some mutants cannot recover growth afterrapamycin treatment. If reduced TORC1 activity is necessary for entry into sporulation, suchmutants should sporulate in the presence of a nitrogen source and/or amino acids. To test this,we generated gene deletion mutants in two nonessential subunits of TORC1, TCO89 and thekinase TOR1. In addition, we mutated the GTPase GTR1, an upstream activator of TORC1 anda component of EGO complex. As reported previously, vegetative growth was strongly reducedin gtr1Δ and tor1Δmutants when treated with rapamycin, and was abolished completely intco89Δ cells (S3C Fig) [27, 30]. Upon inhibition of PKA more than 80 percent of mutant cells(tco89Δ, tor1Δ, and gtr1Δ) completed meiosis compared to approximately 20 percent of controlcells (Fig 5D). The ability to undergo meiosis was abolished in tco89Δ and gtr1Δ cells whentreated with PKA inhibitor and rapamycin (Fig 5D). Meiosis was not affected in tor1Δ cellstreated with rapamycin. This can be explained by the presence of the functionally similar Tor2kinase in TORC1, which can compensate for the tor1Δ [27, 29].
Next, we examined how IME1 promoter activity was affected by tco89Δ, gtr1Δ, or tor1Δmutations. In cells treated with PKA inhibitor, LacZ activity was significantly higher in allthree mutants compared to the control (6h after treatment) (Fig 5E). Moreover, the kinetics
cells harbouring tpk1-aswere grown in YPD overnight, diluted into fresh YPD and treated with 1NM-PP1, rapamycin or IAA. Thenuclei number in cells was counted after 48 hours of treatment by DAPI staining, and percentage of cells that underwent meiosis(MI+MII) was quantified. (C) Quantification of IME1mRNA levels in control (FW1762) and KOG1-AID/pTEF1-osTIR1 (FW1904) cellsharbouring tpk1-as and treated with 1NM-PP1. KOG1-AID/pTEF1-osTIR1 cells were also treated with IAA. Samples were taken atthe indicated time points. Total RNA was isolated, reverse transcribed, and IME1mRNA levels were measured by quantitativePCR. Signals were normalized to ACT1 levels. The standard error of the mean of at least two biological experiments is shown. (D)Percentage of cells that underwent meiotic divisions (MI+MII) was determined in gene deletion strains, all harbouring tpk1-as andpIME1-LacZ (FW1976, control). The following gene deletion mutants were used for the analyses: control (FW1976), tco89Δ(FW2154), gtr1Δ (FW2164) or tor1Δ (FW2162). Samples were grown in YPDmedium, fixed, and DAPI masses were counted at 48hours after treatment with 1NM-PP1 or with 1NM-PP1 and rapamycin. (E) IME1 promoter activity was measured in strainsdescribed in D. Cells were grown in YPD overnight, diluted into YPD plus 1NMPP1 and/or rapamycin, and samples were taken after0, 4, 8, and 12 hours. β-galactosidase activity was measured using a quantitative liquid ortho-Nitrophenyl-β-galactoside (ONPG)assay (see Materials and Methods for details). The promoter activities are displayed in Miller Units, and the standard error of themean of at least two biological experiments is shown. (F) IME1 promoter activity was measured as described in E for control(FW1976) and tco89Δ (FW2154) strains. Cells were grown in YPD overnight, diluted into YPD plus 1NMPP1 and/or rapamycin, andsamples were taken after 0, 2, 4, 6, 8, 10, 12 and 24 hours. (G) Kinetics of meiotic division (MI+MII) of strains and treatmentsdescribed in F. Samples were taken at the indicated time points, fixed, and DAPI masses were counted.
doi:10.1371/journal.pgen.1006075.g005
Nutrient Control of Yeast Gametogenesis Is Mediated by TORC1, PKA and Energy Availability
PLOS Genetics | DOI:10.1371/journal.pgen.1006075 June 6, 2016 12 / 26
and levels of IME1 induction in the mutant cells treated with PKA inhibitor alone closelyresembled that of control cells treated with both PKA inhibitor and rapamycin. The tco89Δand gtr1Δ cells treated with rapamycin and PKA inhibitors did not express IME1, which is con-sistent with the observation that these mutants did not induce meiosis under this condition. Asexpected, in tor1Δmutant cells, rapamycin only had a minor effect on IME1 promoter activity.
In order to compare the tco89Δmutant to control cells more closely, we monitored IME1induction and meiosis in a detailed time-course. When PKA was inhibited in tco89Δ cells,IME1 promoter activity increased significantly faster than in control cells (Fig 5F). In contrast,the IME1 promoter was not induced even at later time points (12h or 24h) in tco89Δ cellstreated with rapamycin and PKA inhibitors. Moreover, the kinetics of meiosis in tco89Δ cellstreated with PKA inhibitor alone closely resembled that of control cells treated with PKA andTORC1 inhibitors and both underwent meiosis efficiently (Fig 5G). These data show that a cer-tain level TORC1 activity is required for IME1 transcription and entry into sporulation. WhenTORC1 activity is high or completely blocked, IME1 expression and sporulation are repressed.
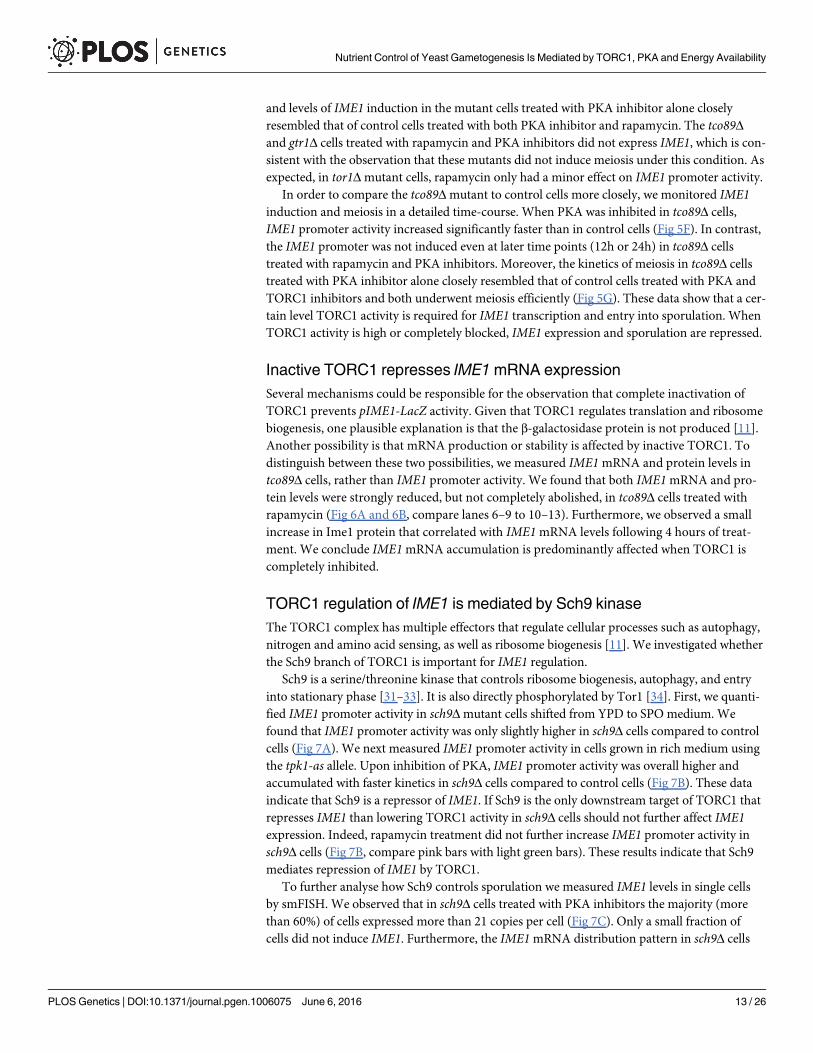
Inactive TORC1 represses IME1mRNA expressionSeveral mechanisms could be responsible for the observation that complete inactivation ofTORC1 prevents pIME1-LacZ activity. Given that TORC1 regulates translation and ribosomebiogenesis, one plausible explanation is that the β-galactosidase protein is not produced [11].Another possibility is that mRNA production or stability is affected by inactive TORC1. Todistinguish between these two possibilities, we measured IME1mRNA and protein levels intco89Δ cells, rather than IME1 promoter activity. We found that both IME1mRNA and pro-tein levels were strongly reduced, but not completely abolished, in tco89Δ cells treated withrapamycin (Fig 6A and 6B, compare lanes 6–9 to 10–13). Furthermore, we observed a smallincrease in Ime1 protein that correlated with IME1mRNA levels following 4 hours of treat-ment. We conclude IME1mRNA accumulation is predominantly affected when TORC1 iscompletely inhibited.
TORC1 regulation of IME1 is mediated by Sch9 kinaseThe TORC1 complex has multiple effectors that regulate cellular processes such as autophagy,nitrogen and amino acid sensing, as well as ribosome biogenesis [11]. We investigated whetherthe Sch9 branch of TORC1 is important for IME1 regulation.
Sch9 is a serine/threonine kinase that controls ribosome biogenesis, autophagy, and entryinto stationary phase [31–33]. It is also directly phosphorylated by Tor1 [34]. First, we quanti-fied IME1 promoter activity in sch9Δmutant cells shifted from YPD to SPO medium. Wefound that IME1 promoter activity was only slightly higher in sch9Δ cells compared to controlcells (Fig 7A). We next measured IME1 promoter activity in cells grown in rich medium usingthe tpk1-as allele. Upon inhibition of PKA, IME1 promoter activity was overall higher andaccumulated with faster kinetics in sch9Δ cells compared to control cells (Fig 7B). These dataindicate that Sch9 is a repressor of IME1. If Sch9 is the only downstream target of TORC1 thatrepresses IME1 than lowering TORC1 activity in sch9Δ cells should not further affect IME1expression. Indeed, rapamycin treatment did not further increase IME1 promoter activity insch9Δ cells (Fig 7B, compare pink bars with light green bars). These results indicate that Sch9mediates repression of IME1 by TORC1.
To further analyse how Sch9 controls sporulation we measured IME1 levels in single cellsby smFISH. We observed that in sch9Δ cells treated with PKA inhibitors the majority (morethan 60%) of cells expressed more than 21 copies per cell (Fig 7C). Only a small fraction ofcells did not induce IME1. Furthermore, the IME1mRNA distribution pattern in sch9Δ cells
Nutrient Control of Yeast Gametogenesis Is Mediated by TORC1, PKA and Energy Availability
PLOS Genetics | DOI:10.1371/journal.pgen.1006075 June 6, 2016 13 / 26
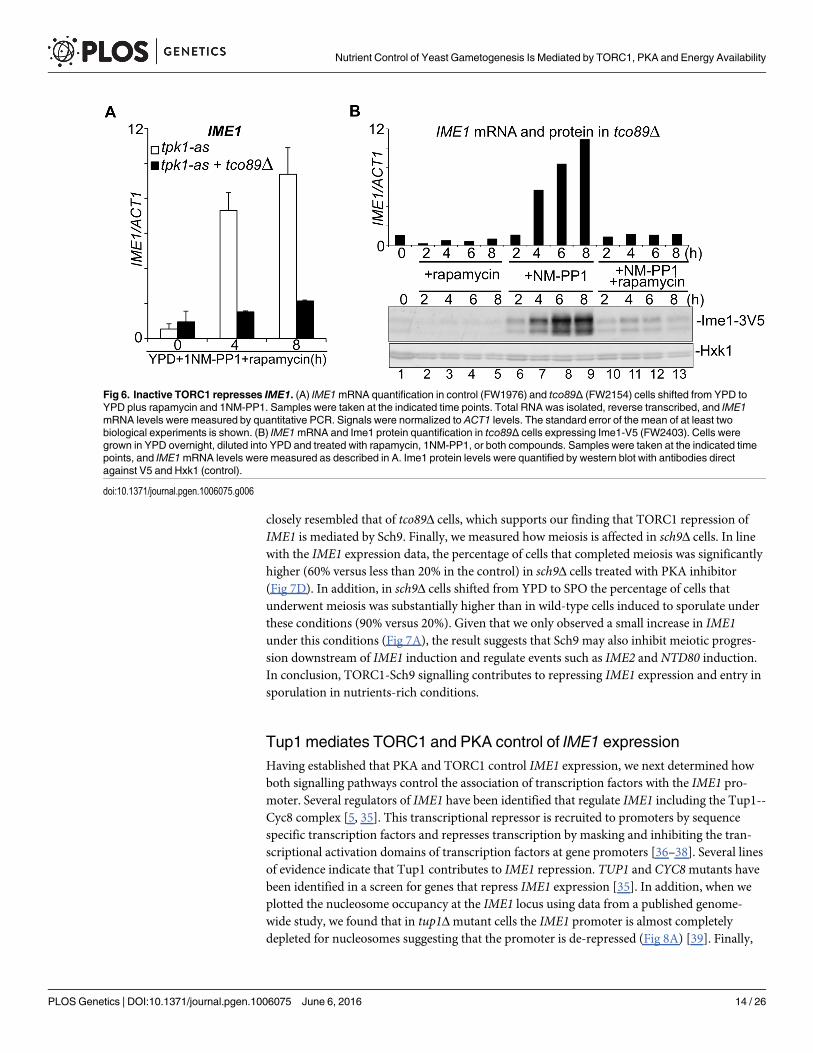
closely resembled that of tco89Δ cells, which supports our finding that TORC1 repression ofIME1 is mediated by Sch9. Finally, we measured how meiosis is affected in sch9Δ cells. In linewith the IME1 expression data, the percentage of cells that completed meiosis was significantlyhigher (60% versus less than 20% in the control) in sch9Δ cells treated with PKA inhibitor(Fig 7D). In addition, in sch9Δ cells shifted from YPD to SPO the percentage of cells thatunderwent meiosis was substantially higher than in wild-type cells induced to sporulate underthese conditions (90% versus 20%). Given that we only observed a small increase in IME1under this conditions (Fig 7A), the result suggests that Sch9 may also inhibit meiotic progres-sion downstream of IME1 induction and regulate events such as IME2 and NTD80 induction.In conclusion, TORC1-Sch9 signalling contributes to repressing IME1 expression and entry insporulation in nutrients-rich conditions.
Tup1 mediates TORC1 and PKA control of IME1 expressionHaving established that PKA and TORC1 control IME1 expression, we next determined howboth signalling pathways control the association of transcription factors with the IME1 pro-moter. Several regulators of IME1 have been identified that regulate IME1 including the Tup1--Cyc8 complex [5, 35]. This transcriptional repressor is recruited to promoters by sequencespecific transcription factors and represses transcription by masking and inhibiting the tran-scriptional activation domains of transcription factors at gene promoters [36–38]. Several linesof evidence indicate that Tup1 contributes to IME1 repression. TUP1 and CYC8mutants havebeen identified in a screen for genes that repress IME1 expression [35]. In addition, when weplotted the nucleosome occupancy at the IME1 locus using data from a published genome-wide study, we found that in tup1Δmutant cells the IME1 promoter is almost completelydepleted for nucleosomes suggesting that the promoter is de-repressed (Fig 8A) [39]. Finally,
Fig 6. Inactive TORC1 represses IME1. (A) IME1mRNA quantification in control (FW1976) and tco89Δ (FW2154) cells shifted from YPD toYPD plus rapamycin and 1NM-PP1. Samples were taken at the indicated time points. Total RNA was isolated, reverse transcribed, and IME1mRNA levels were measured by quantitative PCR. Signals were normalized to ACT1 levels. The standard error of the mean of at least twobiological experiments is shown. (B) IME1mRNA and Ime1 protein quantification in tco89Δ cells expressing Ime1-V5 (FW2403). Cells weregrown in YPD overnight, diluted into YPD and treated with rapamycin, 1NM-PP1, or both compounds. Samples were taken at the indicated timepoints, and IME1mRNA levels were measured as described in A. Ime1 protein levels were quantified by western blot with antibodies directagainst V5 and Hxk1 (control).
doi:10.1371/journal.pgen.1006075.g006
Nutrient Control of Yeast Gametogenesis Is Mediated by TORC1, PKA and Energy Availability
PLOS Genetics | DOI:10.1371/journal.pgen.1006075 June 6, 2016 14 / 26
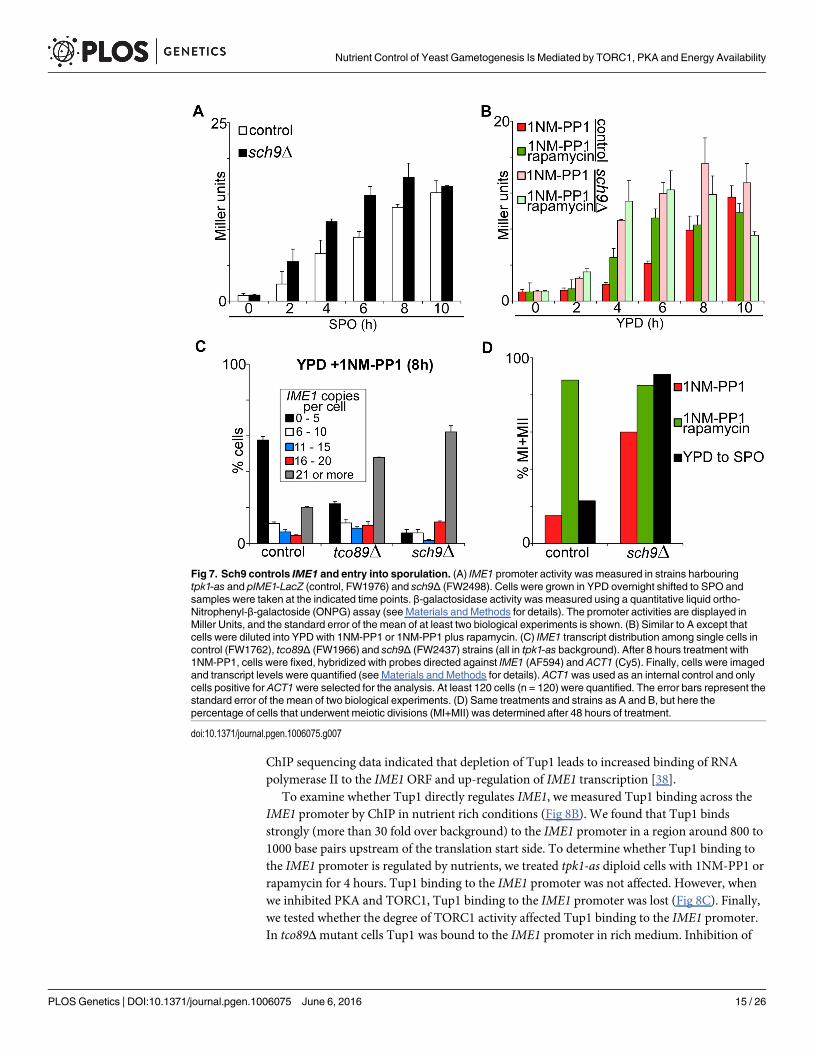
ChIP sequencing data indicated that depletion of Tup1 leads to increased binding of RNApolymerase II to the IME1ORF and up-regulation of IME1 transcription [38].
To examine whether Tup1 directly regulates IME1, we measured Tup1 binding across theIME1 promoter by ChIP in nutrient rich conditions (Fig 8B). We found that Tup1 bindsstrongly (more than 30 fold over background) to the IME1 promoter in a region around 800 to1000 base pairs upstream of the translation start side. To determine whether Tup1 binding tothe IME1 promoter is regulated by nutrients, we treated tpk1-as diploid cells with 1NM-PP1 orrapamycin for 4 hours. Tup1 binding to the IME1 promoter was not affected. However, whenwe inhibited PKA and TORC1, Tup1 binding to the IME1 promoter was lost (Fig 8C). Finally,we tested whether the degree of TORC1 activity affected Tup1 binding to the IME1 promoter.In tco89Δmutant cells Tup1 was bound to the IME1 promoter in rich medium. Inhibition of
Fig 7. Sch9 controls IME1 and entry into sporulation. (A) IME1 promoter activity was measured in strains harbouringtpk1-as and pIME1-LacZ (control, FW1976) and sch9Δ (FW2498). Cells were grown in YPD overnight shifted to SPO andsamples were taken at the indicated time points. β-galactosidase activity was measured using a quantitative liquid ortho-Nitrophenyl-β-galactoside (ONPG) assay (see Materials and Methods for details). The promoter activities are displayed inMiller Units, and the standard error of the mean of at least two biological experiments is shown. (B) Similar to A except thatcells were diluted into YPD with 1NM-PP1 or 1NM-PP1 plus rapamycin. (C) IME1 transcript distribution among single cells incontrol (FW1762), tco89Δ (FW1966) and sch9Δ (FW2437) strains (all in tpk1-as background). After 8 hours treatment with1NM-PP1, cells were fixed, hybridized with probes directed against IME1 (AF594) and ACT1 (Cy5). Finally, cells were imagedand transcript levels were quantified (see Materials and Methods for details). ACT1was used as an internal control and onlycells positive for ACT1were selected for the analysis. At least 120 cells (n = 120) were quantified. The error bars represent thestandard error of the mean of two biological experiments. (D) Same treatments and strains as A and B, but here thepercentage of cells that underwent meiotic divisions (MI+MII) was determined after 48 hours of treatment.
doi:10.1371/journal.pgen.1006075.g007
Nutrient Control of Yeast Gametogenesis Is Mediated by TORC1, PKA and Energy Availability
PLOS Genetics | DOI:10.1371/journal.pgen.1006075 June 6, 2016 15 / 26
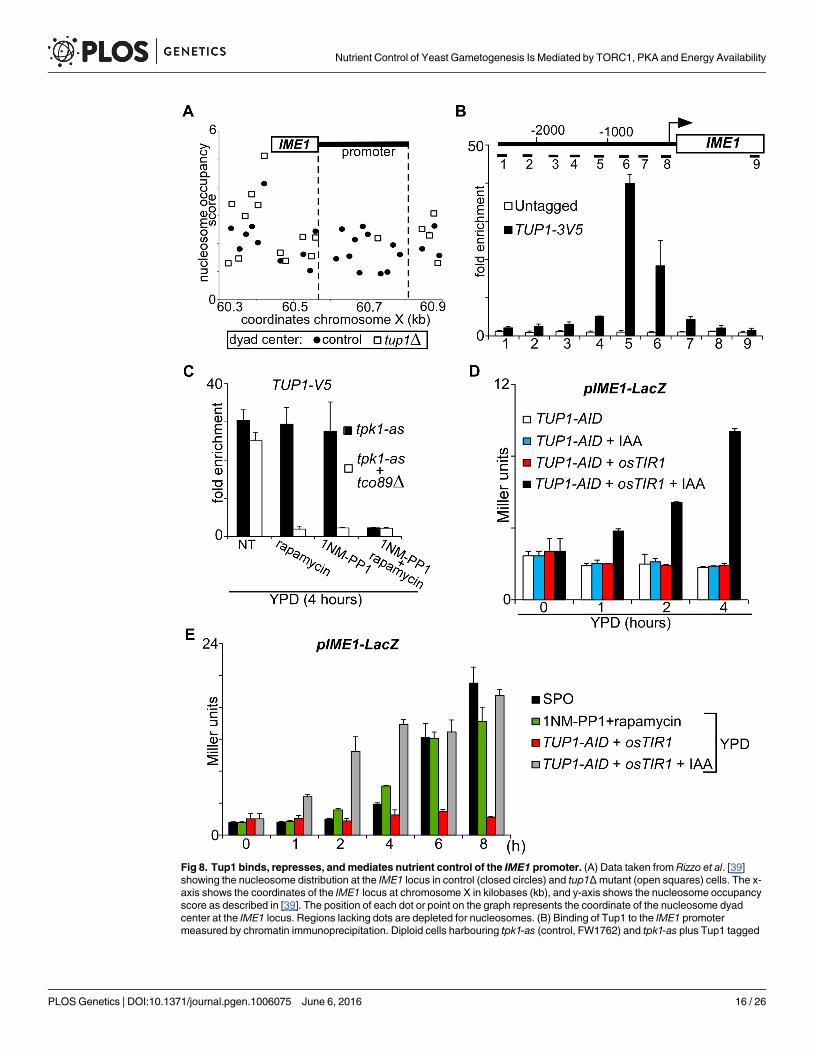
Fig 8. Tup1 binds, represses, andmediates nutrient control of the IME1 promoter. (A) Data taken from Rizzo et al. [39]showing the nucleosome distribution at the IME1 locus in control (closed circles) and tup1Δmutant (open squares) cells. The x-axis shows the coordinates of the IME1 locus at chromosome X in kilobases (kb), and y-axis shows the nucleosome occupancyscore as described in [39]. The position of each dot or point on the graph represents the coordinate of the nucleosome dyadcenter at the IME1 locus. Regions lacking dots are depleted for nucleosomes. (B) Binding of Tup1 to the IME1 promotermeasured by chromatin immunoprecipitation. Diploid cells harbouring tpk1-as (control, FW1762) and tpk1-as plus Tup1 tagged
Nutrient Control of Yeast Gametogenesis Is Mediated by TORC1, PKA and Energy Availability
PLOS Genetics | DOI:10.1371/journal.pgen.1006075 June 6, 2016 16 / 26
PKA in this mutant background was sufficient to disassociate Tup1 from the IME1 promoter(Fig 8C). Interestingly, when we treated tco89Δ cells with rapamycin to inactivate TORC1,Tup1 binding to the IME1 promoter was also not detectable. We conclude that Tup1 bindingto the IME1 promoter is controlled by PKA and TORC1 activity.
Depletion of Tup1 leads to rapid activation of IME1 transcriptionWe next tested whether Tup1-Cyc8 association with the IME1 promoter is important for IME1repression. We found that Tup1 depletion was sufficient for the activation of the IME1 pro-moter (Fig 8D). In diploids cells harbouring a TUP1-AID fusion and expressing pTEF1-osTIR1,IME1 promoter activity (pIME1-LacZ) increased after treatment with IAA. In contrast, β-galactosidase expression was not induced in untreated cells or cells that only expressedTup1-AID. Finally, we compared the level of IME1 induction between Tup1 depleted cells,wild type starved cells (SPO medium), and cells treated with PKA and TORC1 inhibitorsgrown in rich medium (Fig 8E). Overall IME1 promoter activity was similar under the differentconditions, but increased more rapidly in Tup1 depleted cells compared to cells starved in SPOmedium or treated with PKA and TORC1 inhibitors. We conclude that Tup1-Cyc8 is a keyrepressor of the IME1 promoter, and that PKA and TORC1 control Tup1 association with theIME1 promoter.
DiscussionIn yeast, the decision to stop vegetative growth and enter gametogenesis is dictated by nutrientavailability regulating the expression of the master regulator IME1. Here, we describe hownutrient sensing and signalling regulate IME1 expression.
Entry into sporulation requires cooperation between PKA and TORC1signallingPrevious work implicated both the PKA and TORC1 signalling pathways in regulating IME1.Constitutively active PKA, as observed in hyperactivated RAS2 and in BCY1 loss of functionmutants, inhibits sporulation [9, 10]. Conversely, when PKA signalling is inhibited or reduced,sporulation occurs in a subpopulation of cells even in nutrient-rich conditions. Furthermore,inhibition of TORC1 with rapamycin leads to IME1 induction and sporulation in saturated
at the C-terminus with 3xV5 (FW3078) were grown in rich medium (YPD) to mid-log and cross-linked with formaldehyde. Tup1was immunoprecipitated from chromatin extracts. The recovered DNA was quantified by real-time PCR with 9 different primersets across the IME1 promoter and gene. Signals were normalized to the silent mating type locus (HMR), which does not bindTup1. The error bars represent the standard error of the mean of two biological experiments. (C) Tup1 binding to the IME1promoter was measured by chromatin immunoprecipitation in control (FW3078) and tco89Δ (FW3096) cells. Cells were grownin YPD and shifted to YPD and were either untreated or treated with rapamycin, 1NM-PP1 or both compounds. Tup1 taggedwith 3xV5 epitope was immunoprecipitated from chromatin extracts. The recovered DNA was quantified by real-time PCR withprimer set five corresponding to middle of the IME1 promoter. Signals were normalized to the silent mating type locus (HMR),which does not bind Tup1. The error bars represent the standard error of the mean of two biological experiments. (D) IME1promoter activity upon depletion of Tup1. Cells harbouring IME1 promoter fused to LacZ (pIME1-LacZ) and expressing eitherTup1 fused to the auxin induced degron (TUP1-AID) (FW3188) or TUP1-AID together with pTEF1-osTIR1 (FW3184) were grownin YPD overnight. Cells were diluted to fresh YPD, either untreated or treated with indole-3-acetic acid (IAA) (500 μM), andsamples were taken at the indicated time points. β-galactosidase activity was measured using a quantitative liquid ortho-Nitrophenyl-β-galactoside (ONPG) assay (see Materials and Methods for details). The promoter activities are displayed in MillerUnits, and the standard error of the mean of at least two biological experiments is shown. (E) Comparison of IME1 promoteractivity during different treatments and growth conditions. Diploid cells harbouring tpk1-as and pIME1-LacZ (FW1976) weregrown overnight in YPD, and diluted to YPD with 1NM-PP1 and rapamycin or cells were washes with water before transferred tosporulation medium. Diploid cells harbouring TUP1-AID and pTEF1-osTIR1 (FW3188) were grown and treated as described D.Samples were taken at the indicated time points, and β-galactosidase activity was measured as described in D.
doi:10.1371/journal.pgen.1006075.g008
Nutrient Control of Yeast Gametogenesis Is Mediated by TORC1, PKA and Energy Availability
PLOS Genetics | DOI:10.1371/journal.pgen.1006075 June 6, 2016 17 / 26
YPD cultures [7, 21]. Our work shows that entry into sporulation can be achieved in nutrient-rich conditions by inhibiting PKA and lowering TORC1 signalling. Inhibition of these path-ways leads to sporulation with similar kinetics and efficiency as starvation induced sporulation.It has been shown that multiple other signalling pathways can also contribute to IME1 regula-tion including G1 cyclins, several MAPK pathways and the Snf1 pathway [40–45]. Given thatPKA and TORC1 signalling control the phosphorylation status of a large number of proteins[46, 47], we propose that some of the previously described regulators of IME1 act downstreamof PKA and TORC1 signalling. Further work is needed to decipher how the different signallingnetworks are connected to each other and how they control entry into sporulation.
Our data suggests that TORC1 and PKA do not only control IME1, but also downstreamevents such as meiotic divisions and packaging into spores. For example, in cells with lowPKA, inhibition of TORC1 with rapamycin further stimulates IME1 induction but also has aprofound effect on progression into meiotic divisions and spore formation (Fig 3A). How PKAand TORC1 control other stages of sporulation is not well understood. Our observation thattriad formation is significantly enhanced and spore viability is reduced when PKA and TORC1are inhibited implicates that the two pathways must be tightly regulated during gametogenesis.Further analyses is needed to dissect how PKA and TORC1 themselves are controlled through-out sporulation.
How is repression of IME1 by TORC1 and PKAmediated?In our efforts to understand how TORC1 and PKA repress IME1, we identified two factors:Sch9 and Tup1. We find that Sch9, a major mediator of TORC1 signalling, negatively regulatesIME1. Interestingly, Sch9 and PKA are genetically redundant and functionally overlap [48].Global gene expression analyses indicate that Sch9 and PKA regulate a common set of genes[49]. These observations suggest that PKA and Sch9 may share one or multiple downstreameffectors to control IME1 and entry into sporulation. Indeed, it is known that Sch9 and PKAphosphorylation inhibits the protein kinase Rim15, which is required for quiescence, IME1expression and sporulation [32, 50]. However, a constitutive active allele of RIM15 cannot de-repress IME1 in the presence of ample nutrients suggesting that Rim15 is not the only target ofSch9 and PKA [51]. PKA and TORC1 could also repress IME1 expression by controlling G1cyclins. It was previously shown that the G1 cyclins CLN1, 2 and 3 repress IME1 [40]. Giventhat TORC1 and PKA control CLN1-3 expression, it is possible that CLN1-3 partially mediatePKA and TORC1 repression of IME1 [52–54]. PKA is also known to phosphorylate the tran-scription factors Sok2, Msn2/4, Sko1 and Com2, which directly bind and control the IME1 pro-moter [15, 42, 55]. Further efforts are needed to identify downstream effectors of PKA andTORC1 that mediate the regulation of IME1.
Our data show that the Tup1-Cyc8 complex is a direct repressor of IME1 that mediates thesignals coming from PKA and TORC1. Tup1 binds to the IME1 promoter in nutrient rich con-ditions, but dissociates from the promoter when both PKA and TORC1 are inhibited. TheTup1-Cyc8 complex functions as a global repressor of transcription and is recruited to promot-ers by sequence specific DNA binding proteins [36–38]. Identifying transcription factors thatrecruit Tup1 to the IME1 promoter will give important insights into how IME1 is regulated byTORC1 and PKA signalling. Interestingly, Tup1 depleted cells do not enter sporulation, eventhough these cells strongly induce IME1. It is possible that other downstream factors, whichcontrol entry into sporulation, are not activated under these conditions. For example it hasbeen known that Ime1 translation, phosphorylation, and localization are also affected by nutri-ents [20, 56–58]. In addition, Tup1 is also required for sporulation. Starving Tup1 depleted
Nutrient Control of Yeast Gametogenesis Is Mediated by TORC1, PKA and Energy Availability
PLOS Genetics | DOI:10.1371/journal.pgen.1006075 June 6, 2016 18 / 26
cells to induce sporulation, did not result in spore formation. We hypothesize that Tup1 alsoregulates the transcription of genes that are important for preventing sporulation.
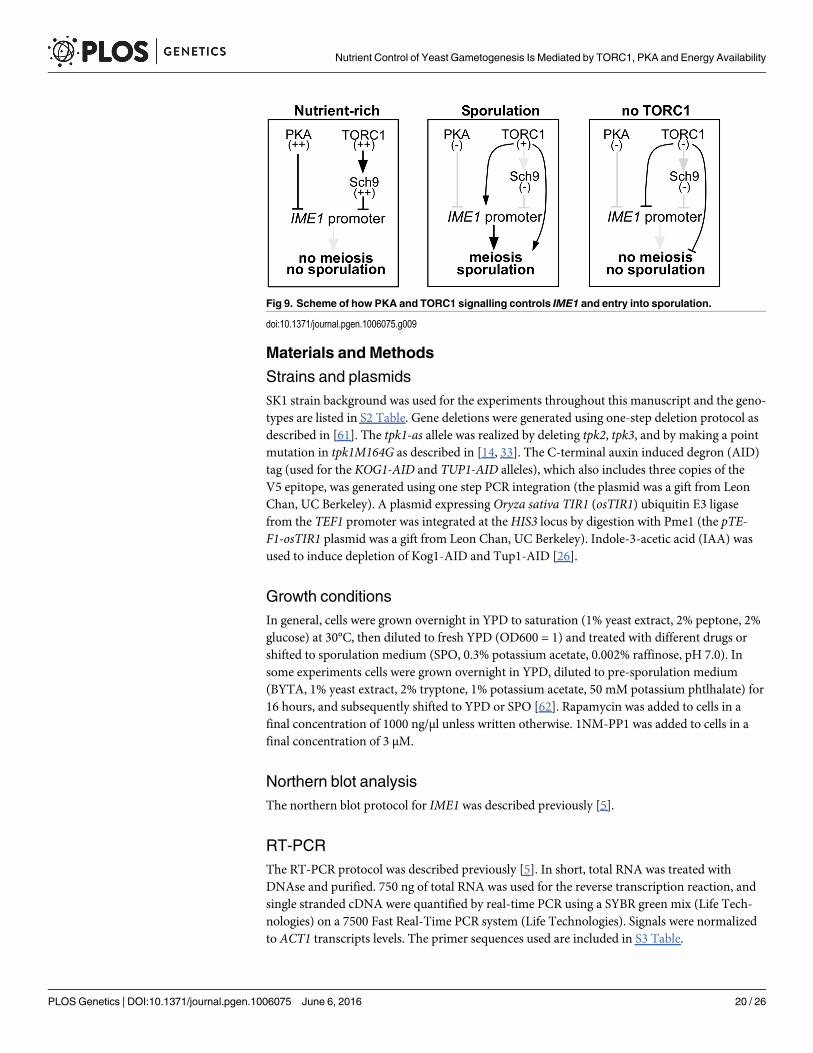
Intermediate levels of TORC1 activity are required for entry intosporulationOur analyses revealed a positive role for TORC1 in inducing sporulation. When TORC1 iscompletely inactive, IME1 is not induced and entry into sporulation does not occur (Figs 5 and9). We propose that downstream effectors of TORC1 must have opposite effects on IME1expression and entry into sporulation. Reduced levels of TORC1 activity are required to inacti-vate Sch9 (discussed in previous section). Some TORC1 signalling however is needed to induceIME1 expression via as yet unidentified downstream mediators. Our findings also reconciletwo previous contradictory observations regarding the effect of rapamycin on sporulation.Rapamycin treatment was shown to induce IME1 and sporulation [7, 12, 21] but when rapa-mycin was combined with nutrient starvation, sporulation was reduced [21]. The observationthat intermediate levels of TORC1 are needed for IME1 induction also implies that there is adefined window of activity to induce sporulation. Given that sporulation is energy consuming,perhaps TORC1 senses whether there are sufficient nutrients available for cells to induce IME1and undergo sporulation.
The effect of ATP/energy production on IME1To facilitate the energy and metabolic needs throughout sporulation, metabolism is finely anddynamically controlled [59, 60]. Mitochondrial respiration activity is essential for both IME1expression and sporulation in starvation medium [7, 8]. Previous work showed that inhibitionof TORC1 in rich medium induces IME1 in respiration competent, but not in respiration defi-cient cells [7]. However, in this study TORC1 activity was inhibited in cells grown to a rela-tively high density (OD600 = 5.5). It is likely that glucose was already consumed from themedium for some extent and not abundant enough to support IME1 expression when respira-tion is blocked. Our system enabled us to challenge the role of respiration during IME1induction in rich medium plus glucose. By inhibiting both PKA and TORC1 pathways, wedemonstrate that IME1 can be expressed in respiration deficient cells when a fermentable car-bon source such as glucose is available. Thus ATP/energy production via either respiration orfermentation is required for IME1 activation. It is interesting to speculate that IME1 functionsas an energy sensor that ensures that sporulation is induced by the lack of nutrients and onlyoccurs when the energy source is sufficient for cells to complete sporulation. We further notethat the kinetics of IME1 induction in respiration deficient cells is somewhat slower than inwild-type cells (Fig 4C). Even though we cannot exclude the possibility that other functions ofmitochondria are contributing to IME1 expression, we favour the idea that in wild-type cellsglycolysis is simply not sufficient to produce the energy needed for rapid activation of IME1expression due to a reduced glucose uptake from the medium. Taken together, we propose thatrespiration is an essential provider of ATP during starvation induced sporulation.
Concluding remarksSignal sensing and signal integration are key determinants of cell fate specification and devel-opment. In mammalian cells multiple signals often integrate at master regulatory genes to con-trol cell specialization. The IME1 promoter serves as a model for signal integration at complexpromoters because it can sense multiple nutrient signals and is regulated by transcription oflong noncoding RNAs. Understanding the regulation of yeast entry into gametogenesis mayshed light on how complex cell fate choices are made in mammalian cells during development.
Nutrient Control of Yeast Gametogenesis Is Mediated by TORC1, PKA and Energy Availability
PLOS Genetics | DOI:10.1371/journal.pgen.1006075 June 6, 2016 19 / 26
Materials and Methods
Strains and plasmidsSK1 strain background was used for the experiments throughout this manuscript and the geno-types are listed in S2 Table. Gene deletions were generated using one-step deletion protocol asdescribed in [61]. The tpk1-as allele was realized by deleting tpk2, tpk3, and by making a pointmutation in tpk1M164G as described in [14, 33]. The C-terminal auxin induced degron (AID)tag (used for the KOG1-AID and TUP1-AID alleles), which also includes three copies of theV5 epitope, was generated using one step PCR integration (the plasmid was a gift from LeonChan, UC Berkeley). A plasmid expressing Oryza sativa TIR1 (osTIR1) ubiquitin E3 ligasefrom the TEF1 promoter was integrated at theHIS3 locus by digestion with Pme1 (the pTE-F1-osTIR1 plasmid was a gift from Leon Chan, UC Berkeley). Indole-3-acetic acid (IAA) wasused to induce depletion of Kog1-AID and Tup1-AID [26].
Growth conditionsIn general, cells were grown overnight in YPD to saturation (1% yeast extract, 2% peptone, 2%glucose) at 30°C, then diluted to fresh YPD (OD600 = 1) and treated with different drugs orshifted to sporulation medium (SPO, 0.3% potassium acetate, 0.002% raffinose, pH 7.0). Insome experiments cells were grown overnight in YPD, diluted to pre-sporulation medium(BYTA, 1% yeast extract, 2% tryptone, 1% potassium acetate, 50 mM potassium phtlhalate) for16 hours, and subsequently shifted to YPD or SPO [62]. Rapamycin was added to cells in afinal concentration of 1000 ng/μl unless written otherwise. 1NM-PP1 was added to cells in afinal concentration of 3 μM.
Northern blot analysisThe northern blot protocol for IME1 was described previously [5].
RT-PCRThe RT-PCR protocol was described previously [5]. In short, total RNA was treated withDNAse and purified. 750 ng of total RNA was used for the reverse transcription reaction, andsingle stranded cDNA were quantified by real-time PCR using a SYBR green mix (Life Tech-nologies) on a 7500 Fast Real-Time PCR system (Life Technologies). Signals were normalizedto ACT1 transcripts levels. The primer sequences used are included in S3 Table.
Fig 9. Scheme of how PKA and TORC1 signalling controls IME1 and entry into sporulation.
doi:10.1371/journal.pgen.1006075.g009
Nutrient Control of Yeast Gametogenesis Is Mediated by TORC1, PKA and Energy Availability
PLOS Genetics | DOI:10.1371/journal.pgen.1006075 June 6, 2016 20 / 26
Western blot analysis and antibodiesA tricarboxylic acid (TCA) extraction protocol was used to make total protein extracts. Sam-ples were separated by SDS page, blotted onto PVDF blotting membrane, and subsequentlyincubated with anti V5/1:2000 dilution (Life Technologies) and anti-hexokinase/1:8000 dilu-tion (Stratech Scientific) antibodies. As secondary antibodies IRDye800CV/1:15000 dilution(anti-mouse, LI-COR Biosciences) and IRDye680RD/1:15000 dilution (anti-rabbit, LI-CORBiosciences) were used. Western blot images generated using the Odyssey system (LI-CORBiosciences).
Nuclei/DAPI countingCells were fixed overnight in 80% ethanol, and stained with 0.05 μg/ml 40,6-diamidino-2-phe-nylindole (DAPI) solution in 100 mM phosphate buffer (pH 7). The number of DAPI massesin at least one hundred cells (n = 100) was counted.
β-galactosidase liquid assayLiquid ortho-Nitrophenyl-β-galactoside (ONPG) assay was performed as described previously[5]. In short, 2 ml of OD600 = 1 cell pellets were washed with buffer Z (Phopsphate buffer pH7, KCl 10 mM, MgCl 1mM) and were snap frozen in liquid nitrogen. Samples for each biologi-cal replicate were collected on different days, but ONGP assays were performed together at thesame time. Cells were chemically disrupted using Y-PER buffer (Thermo Scientific). Subse-quently cells were incubated with ONPG (Sigma) (1 mg/ml in Z buffer plus 50 mM β-mercap-toethanol) till yellow colouring occurred. The reaction was quenches using sodium carbonate(1 mM) and cell debris was cleared by centrifugation. Absorption of each sample was measuredat OD420 using a 96 well plate reader. Miller Units were calculated according to a standard for-mula [63]: Miller Unit = (signal from plate reader (OD420) x 1000) / (cell density (OD600) xtime of incubation with ONPG (min)). The data from the experiments represents the standarderror of the mean of at least two biological experiments.
Chromatin immunoprecipitationChromatin immunoprecipitation (ChIP) experiments were performed as described previously[5]. Cells were fixed with 1% formaldehyde for 20 min, the reaction was quenched with 125mM glycine. Cells were disrupted using mini beadbeater (BioSpec), and crosslinked chromatinwas sheered by sonication using Bioruptor (Diagenode, 6 cycles of 30 sec on/off). Chromatinextracts were then incubated with anti V5 agarose beads (Sigma) for 2 hours at room tempera-ture, and beads were washed accordingly. To measure Tup1 binding, input and ChIP sampleswere quantified by real-time PCR using SYBR green mix (Life Technologies) and primers cor-responding to the IME1 promoter on a 7500 Fast Real-Time PCR system (Life Technologies).The mating type locus (HMR) was used as a non-binding negative control. The primersequences used are included in S3 Table.
Single molecule RNA FISHThe single molecule RNA fish was performed as described previously [5]. In short, cells werefixed with formaldehyde overnight, treated with zymolyase and further fixed in 80% ethanol.Subsequently cells were hybridized with fluorophore labelled probes directed to IME1 (AF594)and the internal control ACT1 (Cy5). Cells were imaged using a 100x oil objective, NA 1.4, ona Nikon TI-E imaging system (Nikon). DIC, DAPI, AF594 (IME1), Cy5 (ACT1) images werecollected every 0.3 micron (20 stacks) using an ORCA-FLASH 4.0 camera (Hamamatsu) and
Nutrient Control of Yeast Gametogenesis Is Mediated by TORC1, PKA and Energy Availability
PLOS Genetics | DOI:10.1371/journal.pgen.1006075 June 6, 2016 21 / 26
NIS-element software (Nikon). ImageJ software was used to make maximum intensity Z pro-jections of the images [64]. Subsequently, StarSearch software (http://rajlab.seas.upenn.edu/StarSearch/launch.html, Raj laboratory, University of Pennsylvania) was used to determinenumber transcripts in single cells. Comparable thresholds were used to count the RNA foci insingle cells. Only cells positive for the internal control ACT1 were used for the analysis. At leasta total n = 60 cells were counted for each experiment.
Supporting InformationS1 Fig. (A) Cells harbouring the tpk1M164G, tpk2Δ, tpk3Δ alleles (tpk1-as, FW1762) weregrown in YPD overnight, diluted to 0.2 (OD600), and subsequently cells were treated with1NM-PP1, rapamycin, both or untreated. Cell density (OD600) was measured over time at theindicated time points. (B) IME1 promoter activity was measured in a diploid control strain har-bouring the IME1 promoter fused to LacZ reporter (pIME1-LacZ) (FW612), and a strain har-bouring tpk1-as and pIME1-LacZ (FW1976). Cells were grown in YPD overnight, shifted tosporulation medium (SPO), and samples were taken at the indicated time point. β-galactosi-dase activity was measured using a quantitative liquid ortho-nitrophenyl-β-galactoside(ONPG) assay (see Materials and Methods for details). The promoter activities are displayed inMiller Units, and the standard error of the mean of at least two biological experiments isshown. (C) Similar as B except that IME1 tpk1-as (FW1976) cells were diluted into YPD andtreated with rapamycin (1000 ng/ml), 1NM-PP1, or both compounds, or shifted to SPO. Sam-ples were taken after 0, 1, 2, and 4 hours. (D) Similar to C, except that samples shifted to YP-acetate (YPA), YPA plus rapamycin or YPA plus 1NM-PP1.(PDF)
S2 Fig. Single molecule RNA FISH of IME1 in control and ime1Δ cells. (A) Representativeimages used for the analyses of IME1 and ACT1 transcript levels in diploid control (FW1511)and ime1Δ (FW81) cells. Cells were grown overnight in YPD and shifted to sporulationmedium for 3 hours. Cells were fixed, hybridized with probes directed against IME1 (AF594)and ACT1 (Cy5), and imaged (see Materials and Methods for details). ACT1 was used as aninternal control and only ACT1 positive cells were selected for the analysis. (B) Mean of IME1and ACT1 transcripts’ number among single cells as described A. At least, 60 cells (n = 60)were quantified per time point. The standard error of the mean of at least two biological experi-ments is shown.(PDF)
S3 Fig. Inactive TORC1 represses IME1. (A) Spot assay of strains harbouring KOG1-AID(FW1894), Oryza sativa TIR1 (pTEF1-osTIR1) (FW1818), and the combined KOG1-AID/pTE-F1-osTIR1 in haploid (FW1887) and diploid (FW1905) cells. Cells were grown in YPD over-night and spotted in five-fold serial dilutions on YPD agar plates in the absence or presence ofindole-3-acetic acid (IAA) (500 μM). (B) Western blot analysis of Kog1-AID in the absence orpresence of IAA. KOG1-AID/pTEF1-osTIR1 expressing cells (FW1887) were grown in YPDovernight, diluted into fresh YPD, and treated with IAA. Samples were taken at the indicatedtime points. Kog1-AID protein levels were quantified by western blot with antibodies directedagainst V5 and Hxk1 (control). (C) Doubling times of control (FW1976), tco89Δ (FW2154),gtr1Δ (FW2164) and tor1Δ (FW2162) strains. Cells were grown overnight, diluted into freshYPD in the absence of presence of rapamycin and a growth curve was determined by OD600readings. Doubling times were calculated from the exponential part of the growth curve.(PDF)
Nutrient Control of Yeast Gametogenesis Is Mediated by TORC1, PKA and Energy Availability
PLOS Genetics | DOI:10.1371/journal.pgen.1006075 June 6, 2016 22 / 26
S1 Table. Sporulation efficiencies. Sporulation efficiencies during different conditions asdescribed in Fig 1.(DOCX)
S2 Table. Table of yeast strains.(DOCX)
S3 Table. Oligonucleotide sequence information.(DOCX)
S1 Data. Supporting data.(XLSX)
AcknowledgmentsWe are grateful to Leon Chan for providing the plasmids of the auxin induced degron system.We thank the members of the Amon and VanWerven labs for discussion and critical readingof the manuscript. We thank the editor and the anonymous reviewers for their insightfulcomments.
Author ContributionsConceived and designed the experiments: HW AA FJvW. Performed the experiments: HWFJvW FM GS. Analyzed the data: HW FJvW. Contributed reagents/materials/analysis tools:HW FJvW. Wrote the paper: HW FJvW AA.
References1. vanWerven FJ, Amon A. Regulation of entry into gametogenesis. Philos Trans R Soc Lond B Biol Sci.
2011; 366(1584):3521–31. doi: 10.1098/rstb.2011.0081 PMID: 22084379; PubMed Central PMCID:PMC3203461.
2. Honigberg SM, Purnapatre K. Signal pathway integration in the switch from the mitotic cell cycle to mei-osis in yeast. J Cell Sci. 2003; 116(Pt 11):2137–47. doi: 10.1242/jcs.00460 PMID: 12730290.
3. Kassir Y, Granot D, Simchen G. IME1, a positive regulator gene of meiosis in S. cerevisiae. Cell. 1988;52(6):853–62. PMID: 3280136.
4. Nachman I, Regev A, Ramanathan S. Dissecting timing variability in yeast meiosis. Cell. 2007; 131(3):544–56. doi: 10.1016/j.cell.2007.09.044 PMID: 17981121.
5. vanWerven FJ, Neuert G, Hendrick N, Lardenois A, Buratowski S, van Oudenaarden A, et al. Tran-scription of two long noncoding RNAs mediates mating-type control of gametogenesis in buddingyeast. Cell. 2012; 150(6):1170–81. doi: 10.1016/j.cell.2012.06.049 PMID: 22959267; PubMed CentralPMCID: PMC3472370.
6. Mitchell AP, Herskowitz I. Activation of meiosis and sporulation by repression of the RME1 product inyeast. Nature. 1986; 319(6056):738–42. doi: 10.1038/319738a0 PMID: 3513021.
7. Jambhekar A, Amon A. Control of meiosis by respiration. Curr Biol. 2008; 18(13):969–75. doi: 10.1016/j.cub.2008.05.047 PMID: 18595705; PubMed Central PMCID: PMC2504020.
8. Treinin M, Simchen G. Mitochondrial activity is required for the expression of IME1, a regulator of meio-sis in yeast. Curr Genet. 1993; 23(3):223–7. PMID: 8435851.
9. Cameron S, Levin L, Zoller M, Wigler M. cAMP-independent control of sporulation, glycogen metabo-lism, and heat shock resistance in S. cerevisiae. Cell. 1988; 53(4):555–66. PMID: 2836063.
10. Matsuura A, Treinin M, Mitsuzawa H, Kassir Y, Uno I, Simchen G. The adenylate cyclase/protein kinasecascade regulates entry into meiosis in Saccharomyces cerevisiae through the gene IME1. EMBO J.1990; 9(10):3225–32. PMID: 2209544; PubMed Central PMCID: PMC552053.
11. Loewith R, Hall MN. Target of rapamycin (TOR) in nutrient signaling and growth control. Genetics.2011; 189(4):1177–201. PMID: 22174183. doi: 10.1534/genetics.111.133363
12. Nakazawa N, Niijima S, Tanaka Y, Ito T. Immunosuppressive drug rapamycin restores sporulationcompetence in industrial yeasts. J Biosci Bioeng. 2012; 113(4):491–5. doi: 10.1016/j.jbiosc.2011.11.026 PMID: 22197499.
Nutrient Control of Yeast Gametogenesis Is Mediated by TORC1, PKA and Energy Availability
PLOS Genetics | DOI:10.1371/journal.pgen.1006075 June 6, 2016 23 / 26
13. Toda T, Cameron S, Sass P, Zoller M, Wigler M. Three different genes in S. cerevisiae encode the cata-lytic subunits of the cAMP-dependent protein kinase. Cell. 1987; 50(2):277–87. PMID: 3036373.
14. Stephan JS, Yeh YY, Ramachandran V, Deminoff SJ, Herman PK. The Tor and PKA signaling path-ways independently target the Atg1/Atg13 protein kinase complex to control autophagy. Proc Natl AcadSci U S A. 2009; 106(40):17049–54. doi: 10.1073/pnas.0903316106 PMID: 19805182; PubMed Cen-tral PMCID: PMC2761351.
15. Shenhar G, Kassir Y. A positive regulator of mitosis, Sok2, functions as a negative regulator of meiosisin Saccharomyces cerevisiae. Mol Cell Biol. 2001; 21(5):1603–12. doi: 10.1128/MCB.21.5.1603-1612.2001 PMID: 11238897; PubMed Central PMCID: PMC86706.
16. Santangelo GM. Glucose signaling in Saccharomyces cerevisiae. Microbiol Mol Biol Rev. 2006; 70(1):253–82. doi: 10.1128/MMBR.70.1.253-282.2006 PMID: 16524925; PubMed Central PMCID:PMCPMC1393250.
17. Raj A, van Oudenaarden A. Single-molecule approaches to stochastic gene expression. Annu Rev Bio-phys. 2009; 38:255–70. doi: 10.1146/annurev.biophys.37.032807.125928 PMID: 19416069; PubMedCentral PMCID: PMC3126657.
18. Bowdish KS, Yuan HE, Mitchell AP. Positive control of yeast meiotic genes by the negative regulatorUME6. Mol Cell Biol. 1995; 15(6):2955–61. PMID: 7760793; PubMed Central PMCID: PMC230526.
19. Bachmair A, Finley D, Varshavsky A. In vivo half-life of a protein is a function of its amino-terminal resi-due. Science. 1986; 234(4773):179–86. PMID: 3018930.
20. Colomina N, Liu Y, Aldea M, Gari E. TOR regulates the subcellular localization of Ime1, a transcriptionalactivator of meiotic development in budding yeast. Mol Cell Biol. 2003; 23(20):7415–24. PMID:14517308; PubMed Central PMCID: PMC230322.
21. Zheng XF, Schreiber SL. Target of rapamycin proteins and their kinase activities are required for meiosis.Proc Natl Acad Sci U S A. 1997; 94(7):3070–5. PMID: 9096347; PubMedCentral PMCID: PMC20323.
22. Weisman R, Choder M, Koltin Y. Rapamycin specifically interferes with the developmental response offission yeast to starvation. J Bacteriol. 1997; 179(20):6325–34. PMID: 9335279; PubMed CentralPMCID: PMC179546.
23. Evans SK, Burgess KE, Gray JV. Recovery from rapamycin: drug-insensitive activity of yeast target ofrapamycin complex 1 (TORC1) supports residual proliferation that dilutes rapamycin among progenycells. J Biol Chem. 2014; 289(38):26554–65. doi: 10.1074/jbc.M114.589754 PMID: 25104356; PubMedCentral PMCID: PMC4176226.
24. Loewith R, Jacinto E, Wullschleger S, Lorberg A, Crespo JL, Bonenfant D, et al. Two TOR complexes,only one of which is rapamycin sensitive, have distinct roles in cell growth control. Mol Cell. 2002; 10(3):457–68. PMID: 12408816.
25. Nakashima A, Maruki Y, Imamura Y, Kondo C, Kawamata T, Kawanishi I, et al. The yeast Tor signalingpathway is involved in G2/M transition via polo-kinase. PLoS One. 2008; 3(5):e2223. doi: 10.1371/journal.pone.0002223 PMID: 18493323; PubMed Central PMCID: PMC2375053.
26. Nishimura K, Fukagawa T, Takisawa H, Kakimoto T, Kanemaki M. An auxin-based degron system forthe rapid depletion of proteins in nonplant cells. Nat Methods. 2009; 6(12):917–22. doi: 10.1038/nmeth.1401 PMID: 19915560.
27. Binda M, Peli-Gulli MP, Bonfils G, Panchaud N, Urban J, Sturgill TW, et al. The Vam6 GEF controlsTORC1 by activating the EGO complex. Mol Cell. 2009; 35(5):563–73. doi: 10.1016/j.molcel.2009.06.033 PMID: 19748353.
28. Dubouloz F, Deloche O, Wanke V, Cameroni E, De Virgilio C. The TOR and EGO protein complexesorchestrate microautophagy in yeast. Mol Cell. 2005; 19(1):15–26. doi: 10.1016/j.molcel.2005.05.020PMID: 15989961.
29. Zurita-Martinez SA, Puria R, Pan X, Boeke JD, Cardenas ME. Efficient Tor signaling requires a func-tional class C Vps protein complex in Saccharomyces cerevisiae. Genetics. 2007; 176(4):2139–50.PMID: 17565946.
30. Reinke A, Anderson S, McCaffery JM, Yates J 3rd, Aronova S, Chu S, et al. TOR complex 1 includes anovel component, Tco89p (YPL180w), and cooperates with Ssd1p to maintain cellular integrity in Sac-charomyces cerevisiae. J Biol Chem. 2004; 279(15):14752–62. doi: 10.1074/jbc.M313062200 PMID:14736892.
31. Jorgensen P, Rupes I, Sharom JR, Schneper L, Broach JR, Tyers M. A dynamic transcriptional networkcommunicates growth potential to ribosome synthesis and critical cell size. Genes Dev. 2004; 18(20):2491–505. doi: 10.1101/gad.1228804 PMID: 15466158; PubMed Central PMCID: PMC529537.
32. Pedruzzi I, Dubouloz F, Cameroni E, Wanke V, Roosen J, Winderickx J, et al. TOR and PKA signalingpathways converge on the protein kinase Rim15 to control entry into G0. Mol Cell. 2003; 12(6):1607–13. PMID: 14690612.
Nutrient Control of Yeast Gametogenesis Is Mediated by TORC1, PKA and Energy Availability
PLOS Genetics | DOI:10.1371/journal.pgen.1006075 June 6, 2016 24 / 26
33. Yorimitsu T, Zaman S, Broach JR, Klionsky DJ. Protein kinase A and Sch9 cooperatively regulateinduction of autophagy in Saccharomyces cerevisiae. Mol Biol Cell. 2007; 18(10):4180–9. doi: 10.1091/mbc.E07-05-0485 PMID: 17699586; PubMed Central PMCID: PMC1995722.
34. Urban J, Soulard A, Huber A, Lippman S, Mukhopadhyay D, Deloche O, et al. Sch9 is a major target ofTORC1 in Saccharomyces cerevisiae. Mol Cell. 2007; 26(5):663–74. doi: 10.1016/j.molcel.2007.04.020 PMID: 17560372.
35. Mizuno T, Nakazawa N, Remgsamrarn P, Kunoh T, Oshima Y, Harashima S. The Tup1-Ssn6 generalrepressor is involved in repression of IME1 encoding a transcriptional activator of meiosis in Saccharo-myces cerevisiae. Curr Genet. 1998; 33(4):239–47. PMID: 9560430.
36. Keleher CA, Redd MJ, Schultz J, Carlson M, Johnson AD. Ssn6-Tup1 is a general repressor of tran-scription in yeast. Cell. 1992; 68(4):709–19. PMID: 1739976.
37. Tzamarias D, Struhl K. Functional dissection of the yeast Cyc8-Tup1 transcriptional co-repressor com-plex. Nature. 1994; 369(6483):758–61. doi: 10.1038/369758a0 PMID: 8008070.
38. Wong KH, Struhl K. The Cyc8-Tup1 complex inhibits transcription primarily by masking the activationdomain of the recruiting protein. Genes Dev. 2011; 25(23):2525–39. doi: 10.1101/gad.179275.111PMID: 22156212; PubMed Central PMCID: PMCPMC3243062.
39. Rizzo JM, Mieczkowski PA, Buck MJ. Tup1 stabilizes promoter nucleosome positioning and occupancyat transcriptionally plastic genes. Nucleic Acids Res. 2011; 39(20):8803–19. doi: 10.1093/nar/gkr557PMID: 21785133; PubMed Central PMCID: PMCPMC3203618.
40. Colomina N, Gari E, Gallego C, Herrero E, Aldea M. G1 cyclins block the Ime1 pathway to make mitosisand meiosis incompatible in budding yeast. EMBO J. 1999; 18(2):320–9. doi: 10.1093/emboj/18.2.320PMID: 9889189; PubMed Central PMCID: PMC1171127.
41. Honigberg SM, Lee RH. Snf1 kinase connects nutritional pathways controlling meiosis in Saccharomy-ces cerevisiae. Mol Cell Biol. 1998; 18(8):4548–55. PMID: 9671464; PubMed Central PMCID:PMCPMC109040.
42. Kahana-Edwin S, Stark M, Kassir Y. Multiple MAPK cascades regulate the transcription of IME1, themaster transcriptional activator of meiosis in Saccharomyces cerevisiae. PLoS One. 2013; 8(11):e78920. doi: 10.1371/journal.pone.0078920 PMID: 24236068; PubMed Central PMCID: PMC3827324.
43. Purnapatre K, Piccirillo S, Schneider BL, Honigberg SM. The CLN3/SWI6/CLN2 pathway and SNF1 actsequentially to regulate meiotic initiation in Saccharomyces cerevisiae. Genes Cells. 2002; 7(7):675–91. PMID: 12081645.
44. Shah JC, ClancyMJ. IME4, a gene that mediatesMAT and nutritional control of meiosis inSaccharomycescerevisiae. Mol Cell Biol. 1992; 12(3):1078–86. PMID: 1545790; PubMedCentral PMCID: PMC369539.
45. Su SS, Mitchell AP. Molecular characterization of the yeast meiotic regulatory gene RIM1. NucleicAcids Res. 1993; 21(16):3789–97. PMID: 8367297; PubMed Central PMCID: PMCPMC309893.
46. Ptacek J, Devgan G, Michaud G, Zhu H, Zhu X, Fasolo J, et al. Global analysis of protein phosphoryla-tion in yeast. Nature. 2005; 438(7068):679–84. doi: 10.1038/nature04187 PMID: 16319894.
47. Soulard A, Cremonesi A, Moes S, Schutz F, Jeno P, Hall MN. The rapamycin-sensitive phosphopro-teome reveals that TOR controls protein kinase A toward some but not all substrates. Mol Biol Cell.2010; 21(19):3475–86. doi: 10.1091/mbc.E10-03-0182 PMID: 20702584; PubMed Central PMCID:PMC2947482.
48. Toda T, Cameron S, Sass P, Wigler M. SCH9, a gene of Saccharomyces cerevisiae that encodes aprotein distinct from, but functionally and structurally related to, cAMP-dependent protein kinase cata-lytic subunits. Genes Dev. 1988; 2(5):517–27. PMID: 3290050.
49. Zaman S, Lippman SI, Schneper L, Slonim N, Broach JR. Glucose regulates transcription in yeastthrough a network of signaling pathways. Mol Syst Biol. 2009; 5:245. doi: 10.1038/msb.2009.2 PMID:19225458; PubMed Central PMCID: PMC2657534.
50. Vidan S, Mitchell AP. Stimulation of yeast meiotic gene expression by the glucose-repressible proteinkinase Rim15p. Mol Cell Biol. 1997; 17(5):2688–97. PMID: 9111339.
51. Pnueli L, Edry I, Cohen M, Kassir Y. Glucose and nitrogen regulate the switch from histone deacetyla-tion to acetylation for expression of early meiosis-specific genes in budding yeast. Mol Cell Biol. 2004;24(12):5197–208. doi: 10.1128/MCB.24.12.5197-5208.2004 PMID: 15169885; PubMed CentralPMCID: PMC419861.
52. Barbet NC, Schneider U, Helliwell SB, Stansfield I, Tuite MF, Hall MN. TOR controls translation initia-tion and early G1 progression in yeast. Mol Biol Cell. 1996; 7(1):25–42. PMID: 8741837; PubMed Cen-tral PMCID: PMCPMC278610.
53. Moreno-Torres M, Jaquenoud M, De Virgilio C. TORC1 controls G1-S cell cycle transition in yeast viaMpk1 and the greatwall kinase pathway. Nat Commun. 2015; 6:8256. doi: 10.1038/ncomms9256PMID: 26356805; PubMed Central PMCID: PMCPMC4579850.
Nutrient Control of Yeast Gametogenesis Is Mediated by TORC1, PKA and Energy Availability
PLOS Genetics | DOI:10.1371/journal.pgen.1006075 June 6, 2016 25 / 26

54. MizunumaM, Tsubakiyama R, Ogawa T, Shitamukai A, Kobayashi Y, Inai T, et al. Ras/cAMP-depen-dent protein kinase (PKA) regulates multiple aspects of cellular events by phosphorylating theWhi3cell cycle regulator in budding yeast. J Biol Chem. 2013; 288(15):10558–66. doi: 10.1074/jbc.M112.402214 PMID: 23471970; PubMed Central PMCID: PMCPMC3624437.
55. Kahana S, Pnueli L, Kainth P, Sassi HE, Andrews B, Kassir Y. Functional dissection of IME1 transcrip-tion using quantitative promoter-reporter screening. Genetics. 2010; 186(3):829–41. doi: 10.1534/genetics.110.122200 PMID: 20739709; PubMed Central PMCID: PMCPMC2975282.
56. Sherman A, Shefer M, Sagee S, Kassir Y. Post-transcriptional regulation of IME1 determines initiationof meiosis in Saccharomyces cerevisiae. Mol Gen Genet. 1993; 237(3):375–84. PMID: 8483452.
57. Bowdish KS, Yuan HE, Mitchell AP. Analysis of RIM11, a yeast protein kinase that phosphorylates themeiotic activator IME1. Mol Cell Biol. 1994; 14(12):7909–19. PMID: 7969131; PubMed Central PMCID:PMCPMC359330.
58. Rubin-Bejerano I, Sagee S, Friedman O, Pnueli L, Kassir Y. The in vivo activity of Ime1, the key tran-scriptional activator of meiosis-specific genes in Saccharomyces cerevisiae, is inhibited by the cyclicAMP/protein kinase A signal pathway through the glycogen synthase kinase 3-beta homolog Rim11.Mol Cell Biol. 2004; 24(16):6967–79. doi: 10.1128/MCB.24.16.6967-6979.2004 PMID: 15282298;PubMed Central PMCID: PMCPMC479714.
59. Ray D, Ye P. Characterization of the metabolic requirements in yeast meiosis. PLoS One. 2013; 8(5):e63707. doi: 10.1371/journal.pone.0063707 PMID: 23675502; PubMed Central PMCID: PMC3650881.
60. Walther T, Letisse F, Peyriga L, Alkim C, Liu Y, Lardenois A, et al. Developmental stage dependentmetabolic regulation during meiotic differentiation in budding yeast. BMC Biol. 2014; 12:60. doi: 10.1186/s12915-014-0060-x PMID: 25178389; PubMed Central PMCID: PMC4176597.
61. Longtine MS, McKenzie A 3rd, Demarini DJ, Shah NG,Wach A, Brachat A, et al. Additional modulesfor versatile and economical PCR-based gene deletion and modification in Saccharomyces cerevisiae.Yeast. 1998; 14(10):953–61. doi: 10.1002/(SICI)1097-0061(199807)14:10<953::AID-YEA293>3.0.CO;2-U PMID: 9717241.
62. Falk JE, Chan AC, Hoffmann E, Hochwagen A. A Mec1- and PP4-dependent checkpoint couples cen-tromere pairing to meiotic recombination. Dev Cell. 2010; 19(4):599–611. doi: 10.1016/j.devcel.2010.09.006 PMID: 20951350.
63. Amberg DCBDJSJN. Methods in Yeast Genetics. 2005 ed: Cold Spring Harbor Laboratories Press;2005.
64. Schneider CA, RasbandWS, Eliceiri KW. NIH Image to ImageJ: 25 years of image analysis. Nat Meth-ods. 2012; 9(7):671–5. PMID: 22930834.
Nutrient Control of Yeast Gametogenesis Is Mediated by TORC1, PKA and Energy Availability
PLOS Genetics | DOI:10.1371/journal.pgen.1006075 June 6, 2016 26 / 26