Nutrient Control Best Management Practices · Plant Tissue Analysis Role of Plant Analysis: •Does...
23
Nutrient Control Best Management Practices Mabry McCray
Transcript of Nutrient Control Best Management Practices · Plant Tissue Analysis Role of Plant Analysis: •Does...

Nutrient Control Best Management Practices
Mabry McCray

Topics Included
1) BMPs
• Soil Testing
• Leaf Analysis
• Fertilizer Application
• Spill Prevention
2) Other Nutrient Management Research

Soil Testing
Importance of Soil Testing:
• An approved BMP for water quality improvement in the EAA
• An essential tool for a sound amendment and nutrient management program
• Important for economic and environmental reasons

Soil Testing: 3-Step Process
1. Soil Sampling:
Collection of Soil Samples
Handling and Submitting
2. Laboratory Extraction and Analysis:
Sample Preparation
Extraction and Measurement of Nutrients
3. Interpretation and Fertilizer Recommendation:
Research-based fertilizer recommendations for specific crops
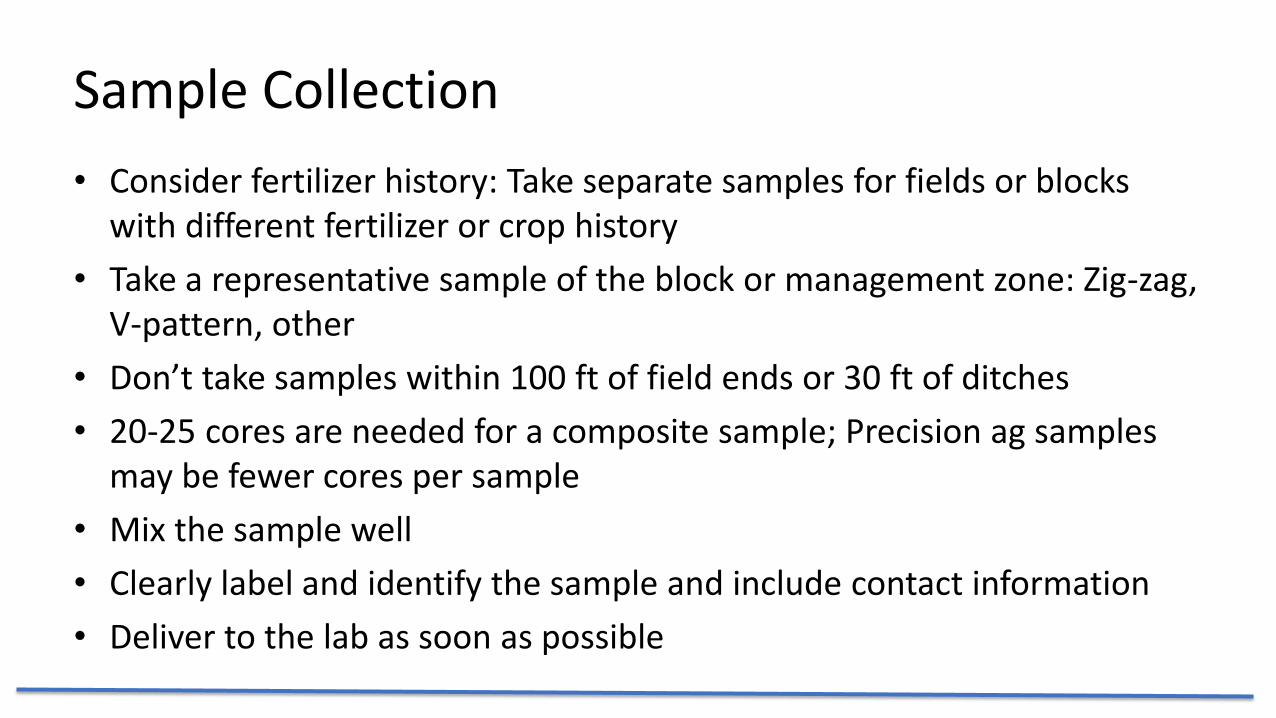
Sample Collection
• Consider fertilizer history: Take separate samples for fields or blocks with different fertilizer or crop history
• Take a representative sample of the block or management zone: Zig-zag, V-pattern, other
• Don’t take samples within 100 ft of field ends or 30 ft of ditches
• 20-25 cores are needed for a composite sample; Precision ag samples may be fewer cores per sample
• Mix the sample well
• Clearly label and identify the sample and include contact information
• Deliver to the lab as soon as possible

Laboratory Analysis: Sample Preparation

Laboratory Analysis: Measurement

95% Relative Yield
Critical Level
95% Relative Yield
Critical Level
Response of Crisphead Lettuce to Soil-Test P Levels
Interpretation and Recommendation

0
10
20
30
40
50
60
70
80
90
100
0 25 50 75 100 125 150
Soil Test P (Index Value)
Rela
tiv
e C
rop
Yie
ld (
%)
Relationship Between Soil Test P, Crop Yield, and Potential for
Environmental Problems due to Excessive Soil P
H M L Excessive
Potential
Environmental
Problems

Plant Tissue Analysis
Role of Plant Analysis:
• Does not replace soil testing but provides additional information for nutrient management decisions
• Gives a snapshot of plant nutritional status at the time of sampling
• Allows for adjustment of next fertilizer application

Sugarcane Leaf Nutrient Optimum Ranges Nutrient Optimum Range Est. 5-10% Loss Est. 25% Loss
----------------------------------%--------------------------------
N 2.0-2.6 1.8 1.6
P 0.22-0.30 0.19 0.17
K 1.0-1.6 0.9 0.8
Ca 0.22-0.45 0.20 0.18
Mg 0.15-0.32 0.13 0.11
Si >0.60 0.50 0.20
--------------------------------mg/kg----------------------------
Fe 55-105 50 40
Mn 20-100 16 12
Zn 17-32 15 13
Cu 4-8 3 2

McCray, J. M., and R. Mylavarapu. 2010. Sugarcane
nutrient management using leaf analysis.
http://edis.ifas.ufl.edu/AG435
McCray, J.M., V.I. Ezenwa, R.W. Rice, and T.A. Lang.
2010. Sugarcane plant nutrient diagnosis.
http://edis.ifas.ufl.edu/SC075
Ezenwa V.I., J.M. McCray, P.R. Newman, and R.W.
Rice. 2008. Sugarcane leaf tissue sample preparation
for diagnostic analysis. http://edis.ifas.ufl.edu/SC076
Excel Spreadsheet to calculate DRIS indices for
Sugarcane
http://erec.ifas.ufl.edu/DRIS/DRISCalculator.zip
Additional Leaf Analysis Information

Fertilizer Application
Follow 4Rs of Nutrient Stewardship
• Right source: Match fertilizer type to crop needs
• Right rate: Match amount of fertilizer to crop needs
• Right time: Apply nutrients so they are available when needed
• Right place: Proper placement of nutrients so crops can use them

Fertilizer Application: Banding P Fertilizer
• More efficient P uptake
• Less P fixation in soil
• Reduces overlapping application
• Reduces P rate, especially for vegetables

Prevent Fertilizer Misapplication
• Don’t apply nutrients at higher than recommended rates
• Turn off spreader at ends of fields
• Calibrate equipment
• Train personnel

Nutrient BMPs Reduce P Load in Drainage Water
Reducing P concentration in drainage water:
• Prevents algal blooms
• Limits aquatic weed growth which could reduce drainage capacity
• Helps maintain adequate dissolved oxygen levels
• Reduces P loads off the farm
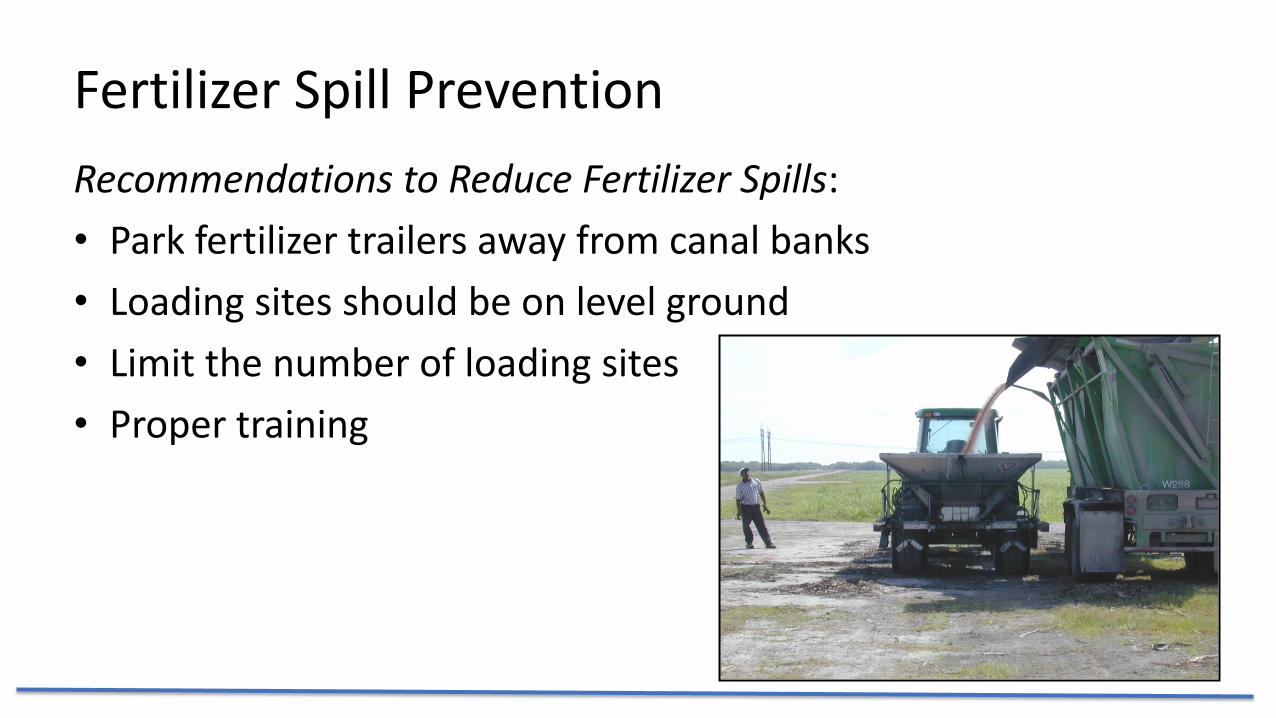
Fertilizer Spill Prevention
Recommendations to Reduce Fertilizer Spills:
• Park fertilizer trailers away from canal banks
• Loading sites should be on level ground
• Limit the number of loading sites
• Proper training

Fertilizer Spill Prevention
Ways to Prevent the Impact of Fertilizer Spills:
• Contain spills on tarps
• Have buckets and shovels available for cleanup
• Apply small spills to target field
• All personnel should be trained in handling spills

Other Nutrient Management Research

New Potassium Recommendations for Sugarcane on Organic Soils
Sugarcane Crop
Acetic Acid Soil Test K
0-19 20-29
30-39
40-49
50-59
60-69
70-79
80-89
90-99
100-109
110-119
120-129
130-139
140-149
150-159
Recommended lb K2O/acre
Plant cane 250 250 250 200 200 150 150 150 100 100 100 100 100 100 0
1st ratoon 200 200 200 150 150 150 150 150 150 150 150 150 150 150 150
2nd ratoon 200 150 150 150 150 150 150 150 150 150 150 150 150 150 150
3rd ratoon + 150 150 150 150 150 150 150 150 150 150 150 150 150 150 150
Sugarcane Crop
Acetic Acid Soil Test K
160-169
170-179
180-189
190-199
200-209
210-219
220-229
230-239
240-249
250-259
260-269
270-279
280-289
290-299
300+
Recommended lb K2O/acre
Plant cane 0 0 0 0 0 0 0 0 0 0 0 0 0 0 0
1st ratoon 100 100 100 100 0 0 0 0 0 0 0 0 0 0 0
2nd ratoon 150 150 150 150 150 150 150 150 100 100 100 100 100 100 0
3rd ratoon + 150 150 150 150 150 150 150 150 150 150 150 150 150 150 150

New Elemental Sulfur Recommendations for Sugarcane on Organic Soils
Soil pH Elemental Sulfur Recommendation
lb S/acre banded in furrow
7.0 100
7.1 100
7.2 150
7.3 200
7.4 200
>7.5 250-500
Notes: 1) It is suggested to apply the first 100 lb S/acre as STM5 and a blend of STM5 and 85 or 90% S is suggested at higher rates. Granular materials that will dissolve and react in moist soil should be used.
2) For pH > 7.5, a range of S rates allows flexibility for the symptoms observed at a given location. 3) Because of the variable nature of soil pH as soils become shallower, variable rate application of elemental S may be a good option. 4) Where a lot of visual Mn deficiency symptoms are observed growers also may want to add one or more foliar Mn applications (5 lb Mn/acre suggested rate).

Suggested Calcium Silicate Rates for Sands Based on Organic Matter Content
Acetic Acid-Extractable Soil Silicon (g/m3) Calcium Silicate
1% OM 2% OM 3% OM tons/acre
0-39 0-30 0-21 3
40-78 31-60 22-42 2.5
79-116 61-90 43-64 2
117-155 91-120 65-85 1.5
156-194 121-150 86-106 1
>194 >150 >106 0

• Nutrient BMPs very successful and economical
• Requires proper annual training of personnel
• Research with nutrient management continues and includes:
P and K calibration for sugarcane on sands
Response of sugarcane to N on shallow mucks
Si calibration for sugarcane on sands
Take Home Summary