Nutrient budget ( Phosphorus ) - unepscs.org · it passes through various part of mangrove ......
59
Nutrient budget ( Phosphorus ) Foong Swee Yeok School of Biological Sciences, Universiti Sains Malaysia
Transcript of Nutrient budget ( Phosphorus ) - unepscs.org · it passes through various part of mangrove ......

Nutrient budget( Phosphorus )
Foong Swee YeokSchool of Biological Sciences,
Universiti Sains Malaysia

Mangroves are considered to be one of the most productive natural ecosystems on earth.
‘Outwelling’, a concept proposed by Odum (1968) that hypothesized on the role of salt marshes in supporting offshore community through the export of nutrients and organic detritus.
This outwelling concept has been ‘borrowed’ from the salt marshes to apply in the mangroves ecosystem and since then has been used as an argument for mangrove conservation.
The high productivity of mangrove forests, its geomorphologicalposition at stronger tidal regime with regular rainstorm, plus non litter retaining feature of mangrove tree have made the ‘outwelling’ hypothesis more conceivable than in salt marshes.
Mangrove ‘outwelling’

Mangrove ‘outwelling’There are, however, many uncertainty exists (Lee, 1995) :
Only a small number of published paper discussed on the outwelling from mangroves (only 34 papers published between 1971-1992).Even though most of the 34 papers reported that mangroves generally capable of exporting organic matter and nutrients, there are, however, reports showed that mangrove acts as net organic carbon importers.A few papers reported on the use of stable isotope technique show that the significance of mangrove outwelling is much lower than expected. High variability in the behavior of mangrove with different element (carbon vs. nitrogen; dissolved vs. particulate form).
It is obvious that greater emphasis is needed to study the food chains and nutrient cycles linking mangrove and adjacent habitats.

Phosphorus Budget Objective : to quantify the amounts of nutrients in various mangrove ecosystem components and the amount cycling between these components.
In the long run, the nutrient status (as source or sink) of a mangrove ecosystem is dependent on the balance between inputs and outputs of nutrient.
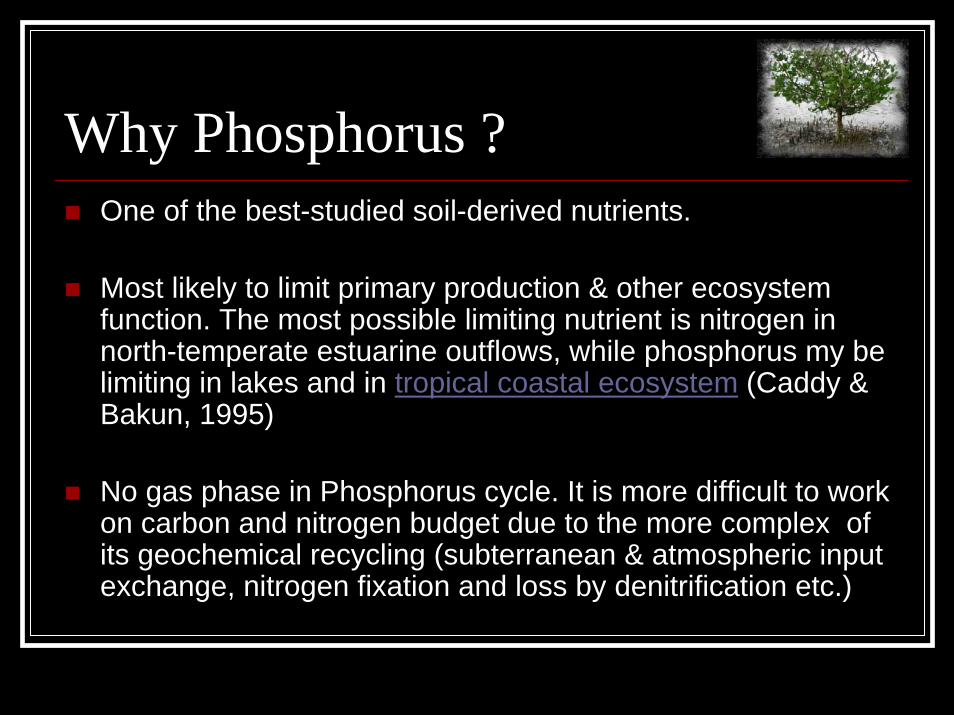
Why Phosphorus ?One of the best-studied soil-derived nutrients.
Most likely to limit primary production & other ecosystem function. The most possible limiting nutrient is nitrogen in north-temperate estuarine outflows, while phosphorus my be limiting in lakes and in tropical coastal ecosystem (Caddy & Bakun, 1995)
No gas phase in Phosphorus cycle. It is more difficult to work on carbon and nitrogen budget due to the more complex of its geochemical recycling (subterranean & atmospheric input exchange, nitrogen fixation and loss by denitrification etc.)

Major pool, input and outputof P in a mangrove ecosystem
Major pools = Biomass (above and under ground) and soil.Input = Atmospheric (dry and wet deposition), mangrove (canopy nutrient transfer and litter fall), mineralization from soil, and anthropogenic sources (sewage, agriculture, aquaculture etc.).Output = Mangrove plant assimilation, microbial uptake, uptake by macro-feeder, tidal exchange, and soil immobilization.

Major pool, input and outputof P in a mangrove ecosystem
Agriculture
Aquaculture
Municipal waste
Sediment
Mineralization
Above ground Biomass
Mangrove assimilation
Dry & Wet Atmospheric Deposition Microbial activity
Macro-feeder
Available for export
Under ground Biomass
Throughfall & Stemflow
Sediment
Leaf litter
Tidal export

The study siteMerbok Mangrove Ecosystem (100º25’E, 5º 30’N), in the state of Kedah.Watershed area = 520 km2.Main river = SungaiMerbok (length 35 km; width 2m-2.5 km; depth 3m-15m).
Mangrove forest
SungaiMerbok
SungaiPetani
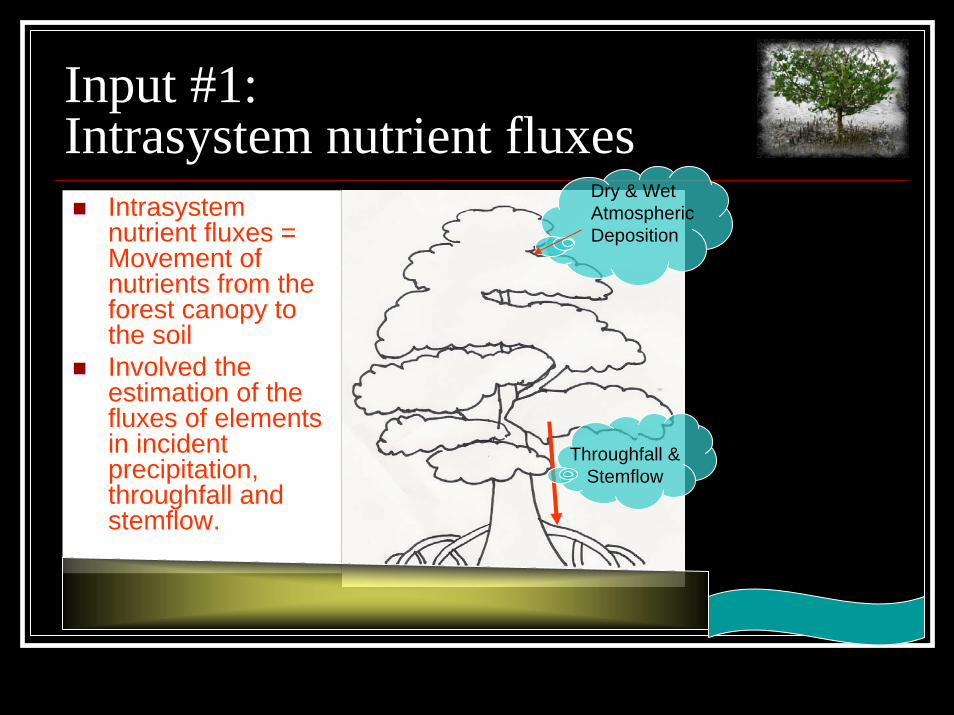
Input #1: Intrasystem nutrient fluxes
Intrasystemnutrient fluxes = Movement of nutrients from the forest canopy to the soil Involved the estimation of the fluxes of elements in incident precipitation, throughfall and stemflow.
Dry & Wet Atmospheric Deposition
Throughfall & Stemflow

Importance of Input #1It is interesting to look at how the chemistry of precipitation changed when it passes through various part of mangrove tree. Especially in a wet tropical mangrove ecosystem like the Merbok which receives as high as 2400 mm of rain yearly.
Various processes could have carry out during the brief interacting period of falling precipitation on surfaces of plant.
Leaching of nutrients absorbed from roots, foliar uptake of nutrients and removal of atmospheric fallout are of relative importance to the P budget in an ecosystem.
Scientists have often assumed nutrients in the litterfall represented all or nearly all the lost when investigating nutrient cycle under forest. However, The fluxes in the intrasystem nutrient fluxes represent the pathway that add element directly and rapidly to the available nutrients pool without involving the slow process of litter decomposition

Many papers recorded chemical impurities in the incident precipitation.
Various sources of atmospheric phosphorus:Ocean Aerosols from biomass (solid products of fire, decomposed litter and soil humus etc.)Fossil fuel (fly ash from coal burning)
Mangrove trees projected an impaction surface to trap precipitation and the atmospheric phosphorus. The amount of P capture by mangrove tree depends on how tightly the tree surface (leaf & bark) hold the atmospheric phosphorus.
The dry and wet deposit of atmospheric together with the P leached from the mangrove tree surface will eventually brought down to the ground in the form of stemflow or throughfall.
The conventions used in the study of mangrove intrasystem nutrient fluxes are diagrammed in Fig.1.
Importance of Input #1

Fig 1: Intrasystem Nutrient CycleIncident / incipient /gross
precipitation = water,mist & cloud water falling vertically on a forest as measured above the canopy or in openings adjacent to the forest.
Throughfall = water that falls on ground as drip from leaves & branches and through gaps in the canopy.
Stemflow = water running down stems & trunks.
Interception loss = precipitation that retained on the above-ground part of vegetation It is either absorbed or evaporated into the atmosphere.
Canopy nutrient transfer = the quantity of nutrient which actually reaches the ground via throughfall+ stemflow
Incident Precipitaion
(direct deposition)
Throughfall
Stemflow
Interception
loss
Aerosol (indirect deposition)

Stemflow CollectionStudy site = a 400 m2 plot in the Merbok Mangrove Ecosystem.10 aluminium collars were fixed to 10 trees with modeling clay. At the lowest point of the collar a slot was made.A funnel, attached by tygontubing to a polyethylene collection bottle, was position below the slot.Large volume of water may be channelled into stemflowduring very heavy rain-storm.
Aluminium collar
funnel
tubing
Collecting drum

Stemflow Collection
Wire net to protect the collar from monkeys
Aluminiumcollar
Funnel
TubingCollection
drum

Stemflow volume conversion to cm of rainfall (Killingbeck & Wali, 1978).
Where,S = Stemflow precipitation (cm)D1= Total tree density (stems per plot)D2= Tree density of non-girdled trees (stems per plot)B1= Total tree basal area (cm2 per plot)B2= Basal area of non-girdled trees (cm2 per plot)Vc= Volume of stemflow collected (cm3 per plot)A = Area of plot (cm2)
D1 + D2D1
+B1 + B2
B1
2X
Vc
AS =
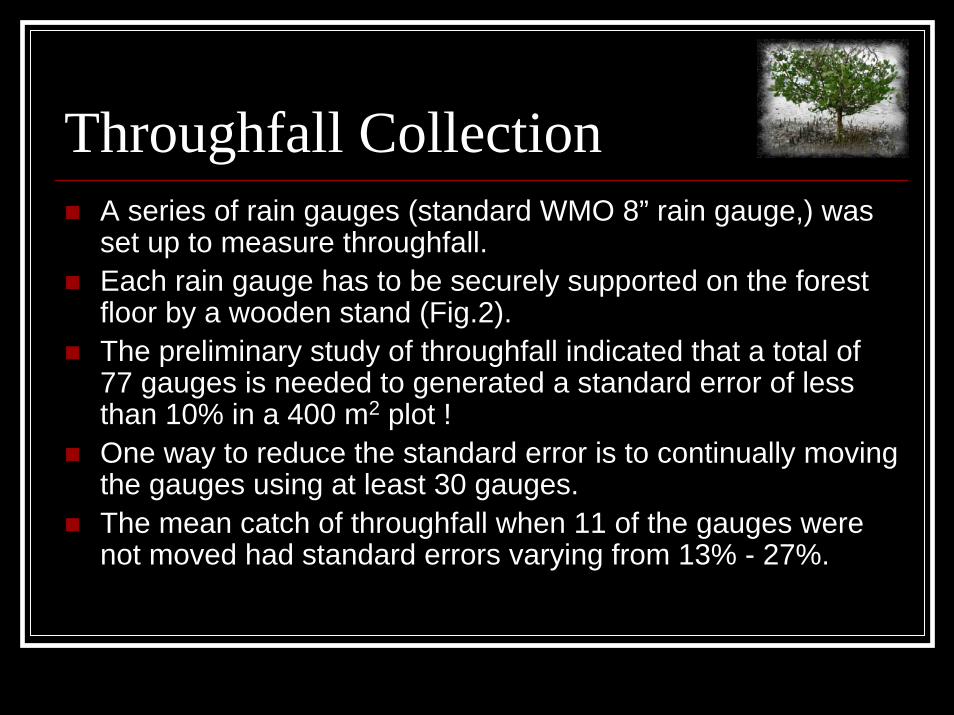
Throughfall CollectionA series of rain gauges (standard WMO 8” rain gauge,) was set up to measure throughfall. Each rain gauge has to be securely supported on the forest floor by a wooden stand (Fig.2).The preliminary study of throughfall indicated that a total of 77 gauges is needed to generated a standard error of less than 10% in a 400 m2 plot !One way to reduce the standard error is to continually moving the gauges using at least 30 gauges.The mean catch of throughfall when 11 of the gauges were not moved had standard errors varying from 13% - 27%.

Fig 2: Throughfall collection
↑
30cm
↓
16cm
← →20cm
12cm
↑
↓
↓
↑
1.5m
STANDARD WMO 8"RAIN GAUGE

Throughfall collectionPossible errors in measurement of P deposition in througfall:
1. contamination in the rainfall collector by bird droppings and leaves.
2. P uptake by the microbial growth in the collector.
Solutions = Cover the outlet of the funnel with mesh, empty the collector frequently, and add Toluene (C5H6CH3) (1 ml).

Incident Precipitation Collection
Precipitation in the open was measured by two rain gauges.One standard WMO 8”rain gauges and a 400 cm2 opening area rain gauges attached to an automated weather station (Model ELE MM900) were placed at a nearby clearing.
Weather station
Standard 8” WMO rain gauge

Intrasystem Nutrient Fluxes -Discussion
There is very little information in the literature about the chemistry of intrasystem nutrient fluxes on mangrove for comparison purposes.
The difficulty of avoiding contamination of throughfall or stemflow below the vegetation by soil splash and tidal water contamination in field conditions has inhibited work on the chemistry of these water.
One way of checking of possible tidal-water contamination is to carry out salinity reading on every water sample collected for chemical analysis.

Intrasystem Nutrient Fluxes -Discussion
The stemflow and throughfall volume are dependent on the amount of precipitation and can amount to more than half of the precipitation in mangrove forest.
Aliran Laluan4 8 %
Aliran Batang 3 %
Pintasan Air Terhilang 49 %Interception loss (49%)
Throughfall(48%)
Stemflow (3%)

Intrasystem Nutrient Fluxes -Discussion
It was found that 49% of the annual precipitation was intercepted. This is relatively high compared to other forest such as the alluvial swamp forest and tropical rain forest, but comparative to spruce and sitkaforest.
Of the precipitation reaching the ground, only a small proportion flowed down the trunk (3%).
Overall, the concentration of P in the incident precipitation is very low.
The amounts of P in the throughfall and stemflow are consistently and significantly greater than in the rainfall.
However, the P concentrations were similar in both throughfall and stemflow.

Intrasystem Nutrient Fluxes -Discussion
P fluxes in precipitation, throughfall and stemflow were determined by multiplying total volumes for each collection by the concentration.
Net fluxes of P (i.e. Throughfall flux minus incident precipitation flux) showed that P leached from foliar and brought down to forest floor via throughfall was the main pathway (accounted for more than 70% of total aqueous deposition of P) in the intrasystem nutrient fluxes.
The faith of the P reaching the ground via throughfall or stemflow is unknown. It is likely that the localized effects of intrasystem nutrient fluxes have greatly been reduced by the dissipation and dilution of these fluxes by standing water and tidal inundation in mangrove ecosystem.
Anyway, stemflow is still important in wetland for its influence on the growth and nutrition of epiphytic organisms that grow on the tree stem.
For the intrasystem nutrient fluxes, P flux in litterfall exceeds that in aqueous deposition by a large margin.

Intrasystem Nutrient Cycling -Discussion
Dry & Wet Atmospheric Deposition4 ton TP/yr
Throughfall & Stemflow
7 ton TP/yr

Intrasystem Nutrient Cycling -Discussion
Merbok mangrove trees in general deposited 1.63 kg TP/ha/yr from throughfall and stemflow.
EcosystemTP deposited from
SF+TF(kg TP/ha/yr)
Source
Alluvial Swamp Forest, North Carolina, USA 1.55
Brinson et al., 1980
Coastal Subtropical Eucalypt Forest, Australia Non detectable
Westman, 1978
Amazon Rain Forest30
Jordan, 1982

Input #2: Litter fallLeaf litter from the mangrove is a major source of nutrients for outwelling to the adjacent coastal area.
Leaf litter productivity of world wide mangrove ranged from 1.2 ton/ha/yr to as high as 26 ton/ha/yr.
Ong et al. (1981) has found that the litter production is about 10.07 ton/ha/yr in Merbok.
Mean TP content for above ground biomass ~ 0.0825% (by dry weight) (Gong & Ong, 1990).
Based on the secondary data, we have managed to estimate the TP flux from mangrove leaf litter:
Flux TP (mangrove litter) = (annual litter productivity) x (total forested area) x (% TP in litter)= 10.07 ton/ha/yr x 3106 ha x 0.0825% = 26 ton TP/yr

Input #2: Litter fallNot all of the litter produced from the mangrove tree are available for export out of the system. Japar (1989) who has done some work on the faith of the mangrove litter has estimated that around 36% -78% of litter fall will eventually exported out of the system indissolved or particulate form.
Another 10% - 48% of mangrove litter is usually eaten or buried by macro-feeder (especially the “sesarmid” crab).
A smaller proportion of the litter loss (0%- 20%) could be attributed to microbial uptake (fungi, bacteria and protozoa).

Input #2: Litter fallBased on the study done by Japar (1989) and some other references, we have estimated that about half of the litter production is potentially exported out of the forest. This agrees quite well with Robertson (1986) for his mangrove study done in Australia.
TP from litter fall potentially exported out of the mangrove forest:= 50% x (Flux TP in mangrove litter)= 50% x 26 ton TP/ha/yr= 13 ton TP/ha/yr
TP from litter fall potentially consumed/buried by macro-feeder:= 35% x (Flux TP in mangrove litter)= 35% x 26 ton TP/ha/yr= 9 ton TP/ha/yr
TP from litter fall potentially degraded by micro-organism:= 15% x (Flux TP in mangrove litter)= 15% x 26 ton TP/ha/yr= 4 ton TP/ha/yr

Input #2: Litter fall
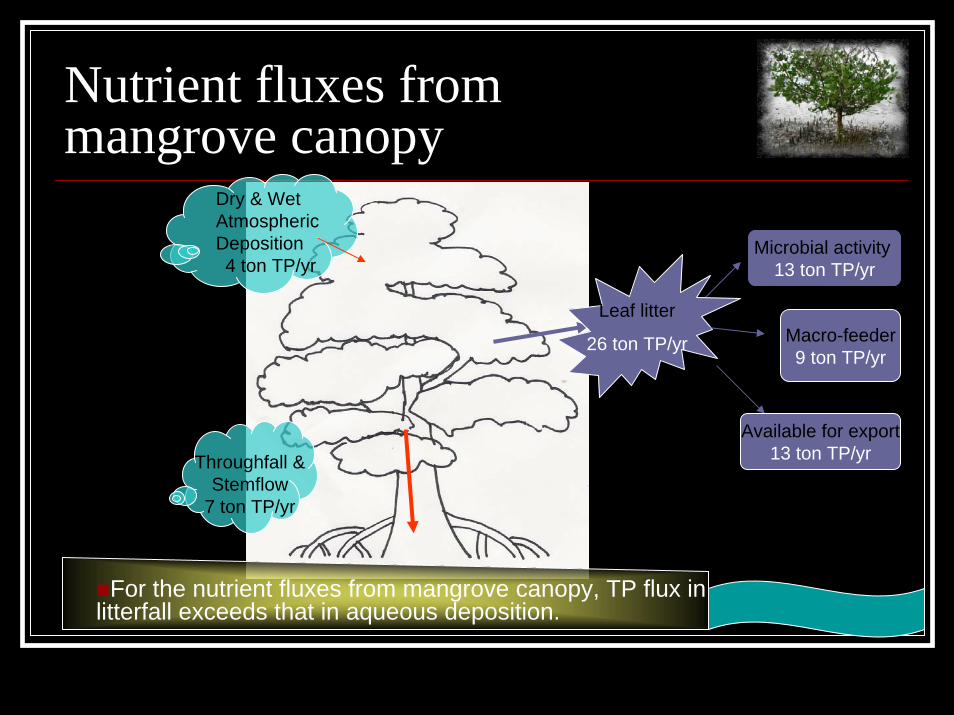
Microbial activity13 ton TP/yr
Macro-feeder9 ton TP/yr
Available for export13 ton TP/yr
Leaf litter
26 ton TP/yr
Nutrient fluxes frommangrove canopy
Microbial activity13 ton TP/yr
Macro-feeder9 ton TP/yr
Available for export13 ton TP/yr
Leaf litter
26 ton TP/yr
Dry & Wet Atmospheric Deposition4 ton TP/yr
Throughfall & Stemflow
7 ton TP/yr
For the nutrient fluxes from mangrove canopy, TP flux in litterfall exceeds that in aqueous deposition.

Input #3:P input from aquaculture(shrimp pond)
We have constructed a P budget following the method suggested by Robertson & Phillips (1995) (Fig.3) and McGlone & Garingal (1998) (Fig.4) to estimate P loads in the effluent derived from shrimp ponds
Sampling were done at 4 different locations with various shrimp pond size and practice (Plat 1,Plat 2 & Plat 3).

P input from aquaculture
Plat 1:Shrimp pond in its early stage of culture period
Plat 3: Canal receiving effluent from shrimp ponds
Plat 2: Pre-harvesting semi-intensive shrimp pond

Fig.3: P Budget for semi-intensive shrimp ponds (Foong, 2002).
Pond managementStocking density 300 post larva/haCulture period 4-5 monthsSize of pond 0.5 – 1 hectareDepth of pond 1 meterFeed input 23 ton FW/ha/yrYield of shrimp 8 ton FW/ha/yr
Nutrient concentration (Robertson & Phillips, 1995)
P content of shrimp 0.19% FWP content of feed 1.64% FW
TP Budget (kg TP/ha/yr)
Inputs
Feed 377
Pond inflow 11
Shrimp larva trace
(total input) 388
Outputs
Shrimp harvest 15
Pond discharge 14
Remainder 359
(sediment)
(total output) 388

Fig.3: P Budget for semi-intensive shrimp ponds
The total shrimp pond area in Merbok was around 391.22 ha (LKIM, 1998).
More than half (60%) of the ponds were in ‘break cycle’ due to diseases (Choo, 1996).
The estimation of shrimp production for the whole of Merbok area:= (total pond area) x (operation rate) x ( shrimp production in wet weight)= 391.22 ha x 40% x 8 ton wet weight/ha/yr~ 1252 ton ww/ha/yr
Total TP estimated to be exported from shrimp ponds based on Robertson & Phillips method:
= (total pond area) x (operation rate) x (TP in pond discharge water)= 391.22 ha x 40% x 14 kg TP/ha/yr (refer to Fig.3)= 2.2 ton TP/yr

Fig.3: P Budget for semi-intensive shrimp ponds
Total TP estimated to be exported from shrimp ponds based on McGlone & Garingal (1998) method:= (shrimp production) x ( residual coefficient)= 1252 ton/yr x 4.69 kg TP/ton = 5.9 ton TP/yr

Input #3:P input from aquaculture(floating cages)
Plat 4: Smaller scale floating cages(less than 30 cages)
Plat 5: Bigger scale floating cages(less than 150 cages) in the main tributary
Input #3:P input from aquaculture(floating cages)
As for the effluent from floating cages, we estimated the P loads based on the residual coefficient suggested by McGlone & Garingal (1998).(Plat 4 & Plat 5)
Total TP estimated to be exported from floating cages based on McGlone & Garingal(1998) method:
= (fish production) x ( residual coefficient)= 128.5 ton/yr x 2.60 kg TP/ton = 0.3 ton TP/yr
The overall input of P from shrimp ponds (5.9 ton TP/yr) was a magnitude higher than the input from floating cages (0.3 ton TP/yr).
As compared to the Robertson & Phillips method, the TP input to the estuary from shrimp ponds estimated from the McGlone & Garingal is 3x higher. This is due to the overall underestimation in the Robertson & Phillips method that didn’t take into consideration of the removal of pond sediments at the end of every production cycle.
The overall input of TP from aquaculture (shrimp pond+floating cages) was estimated to be 4.4 ton/yr after averaging the results from both methods.

Input #4:P input from agriculture
Much of the mangrove area in Merbok has been converted to paddy field. The input of P from the paddy field is not to be ignored as most of the paddy fields are heavily fertilized.
Reports from The Agricultural Department, fertilizers chemical analysis, interview with the farmers and the residual coefficient value (4%) suggested by Chauvelon (1998), were used in establishing the input value of P to the ecosystem.
Input TP from paddy = (2 production cycle/yr) x (total paddy area) x (TP in fertilizer) x (residual
coefficient)= 2 planting/yr x 11,583 ha x 17.5 kg TP/ha x 4% ~ 16 ton TP/yr

Input #5:P input from municipal sewage
Mangrove ecosystem have been recognized for its large capacity to reduce pollutants from municipal sewage.
The underground component (soil-roots-microbial communities) were found to be more important than above ground vegetation (mangrove assimilation) in retention and transformation of municipal waste-borne pollutants.
The municipal sewage loads were calculated base on secondary data:Input TP = [(population in catchment area) x ( Dry weather flow) x ( TP in raw sewage)]
– 10% of sewage removal efficiency (World Bank, 1993)= (243,750 x 225 liter/capita/day x 10 mg/l ) – 10%= 180 ton TP/yr
The municipal sewage loads in the Merbok catchment was the highest source of TP input (> 85% of the total TP input).

Input #5:P input from municipal sewage
The removal capacity of the underground component in mangrove ecosystem is finite. After long periods of wastewater application the binding sites in soil becomes saturated.
The use of mangrove ecosystem as an alternate, low cost for treating domestic waste in a long run need to be evaluated .

P input from anthropogenicsources
Aquaculture4.4 ton TP/yr(Shrimp pond
=4.1 ton/yr Floating cages
=0.3 ton/yr)
Municipal waste
180 ton TP/yr
Agriculture16 ton TP/yr(Paddy only)

Input #6:P Stocks & Fluxes from Sediment
To estimate the TP fluxes from the sediment, we have to first look at how much of TP is tied up in soil.
Ong (1993) & Kamaludin (1989) estimated that each hectare of mangrove sediment is about 10 meters thick and with density of 0.7.
The TP store in the sediment pool := (dry weight/ha) x ( total mangrove area + estuaries area) x (TP content in
dry weight)= 70,000 ton dry weight/ha x (3106 + 1500) ha x 0.05% dry weight= 1.6 x 10⁵ ton TP
The sediments contained the largest amount of TP.

Input #6:P Stocks & Fluxes from Sediment
Phosphorus has the property of low solubility and high adsorptivity in the soil-water system.
Mangrove wetlands characterised by it’s reduced intertidal soil condition and high sulfide and Fe concentration in the sediment, also favor the immobilization of phosphorus.
However, there’s still a detectable mobilization rate of TP from the sediment to the overlying water through the mineralization process by the microb activity (Alongi, 1990; Pomeroy et al.,1965).
The mineralization rate of TP := (total area) x (mineralization rate of TP) x (molecular weight conversion) = (4.606 x 10⁷ m2) x (1 x 10-6 mol TP m-2 day-1) x (30.97 g atom) x (10-6 ton) x (365 days)= 0.52 ton TP/yr

Input #6:P Stocks & Fluxes from Sediment
How much TP/yr is tied up in the mangrove ecosystem through the sedimentation process?
Sedimentation rate := (sediment build up rate to match sea-level rise) X ( total
mangrove estuarine area) x (sediment density) x (% TP in dry weight)
= (10 m3/ha/yr) x (4606 ha) x (0.7) x (0.05%)= 16.1 ton TP/yr

Input #6:P Stocks & Fluxes from Sediment
Mineralization
0.52 ton TP/yr
Sediment1.6 x 105 ton TP
Sedimentation
16.1 ton TP/yr

Input #6:P Stocks & Fluxes from Sediment
The mineralization rate of sediment P from non-available form to available form is extremely low (0.52 ton TP/yr) relative to the amount store in the sediment (1.6 x 10⁵ ton TP).
This indicates that the turnover rate of P in sediment is very slow suggesting a great buffering intensity of the mangrove sediment.
The capacity of the Merbok mangrove ecosystem to retain P loading from various sources (especially the ever increasing anthropogenic sources) is strongly influence by the sedimentation rate and sediment P sorption capacity.

Output #1:P stock & assimilation in mangrove biomass
Merbok mangrove trees could act as a P sink in the form of P sequestered in the standing biomass.
Gong & Ong (1990) has estimated the % content of TP in various plant part of the mangrove tree (an average of 0.0825% of dry weight for the above ground biomass; 0.099% of dry weight for the below ground biomass).
Stock TP in the mangrove above ground standing biomass:= (mean mangrove biomass) x (91.5% above ground biomass) x (total mangrove area) x ( %
content of TP in dry weight)= (231 ton/ha) x (91.5%) x (3106 ha) x (0.0825%)= 542 ton TP
Stock TP in the mangrove below ground standing biomass:= (mean mangrove biomass) x (8.5% below ground biomass) x (total mangrove area) x ( %
content of TP in dry weight)= (231 ton/ha) x (8.5%) x (3106 ha) x (0.099%)= 60 ton TP

Output #1:P stock & assimilation in mangrove biomass
To estimate TP requirements to support total net mangrove production, we converted dry mass production to P equivalent:TP assimilation in mangrove tree = (total mangrove area) x (TP assimilation rate)= (3106 ha) x (15 kg TP/ha/yr) (Clough et al., 1983; Boto,
1991) = 47 ton TP/yr

Output #1:P stock & assimilation in mangrove biomass
Leaf litter
26 ton TP/yr
Dry & Wet Atmospheric Deposition4 ton TP/yr
Throughfall & Stemflow
7 ton TP/yr
Above ground Biomass550 ton
Mangrove assimilation
47 ton/yr
Under ground Biomass60 ton
TP uptake by the mangrove vegetation is mostly (70%) released from the system through canopy nutrient fluxes (litter fall + throughfall + stemflow).
About 30% of TP assimilated by the mangrove vegetation is retained in its biomass.

Output #2:P fluxes in tidal exchange
Nutrient transport between the mangrove ecosystem and the adjacent coast has been classically estimated using the mass-balance studies.This hydrodynamic approach calculates the material fluxes by multiplying velocity, cross-section area and concentration of the material.Material fluxes by the tidal action were determined at a single cross-section near the mouth of the Merbok estuarine following the Kjerfve (1979) method.
Sampling Cross section
Mangrove forest
Output #2:P fluxes in tidal exchange
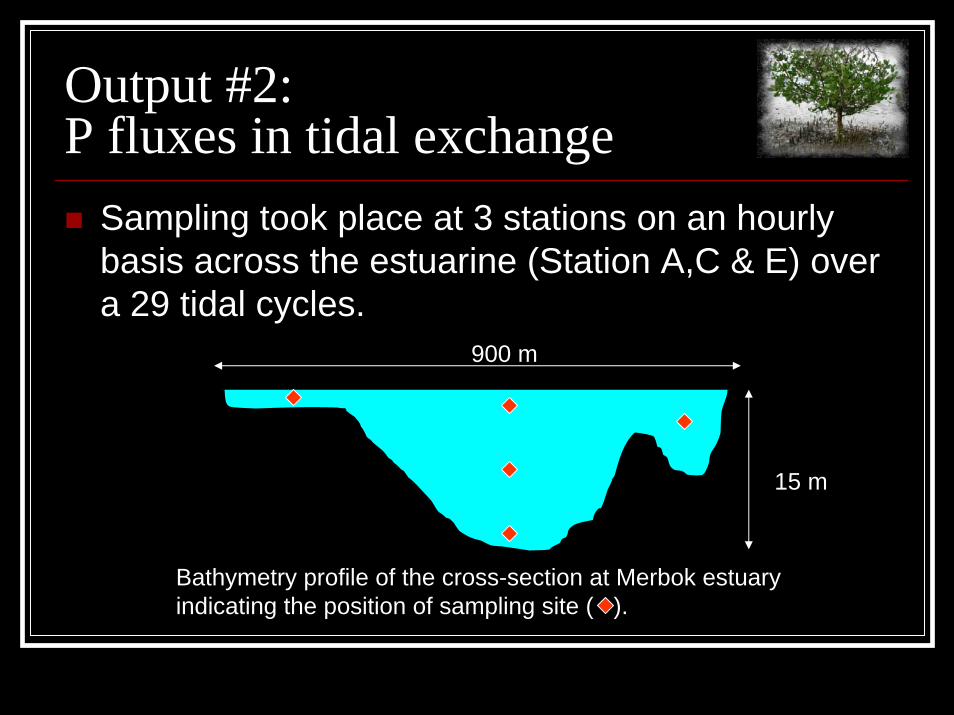
Sampling took place at 3 stations on an hourly basis across the estuarine (Station A,C & E) over a 29 tidal cycles.
Bathymetry profile of the cross-section at Merbok estuary indicating the position of sampling site ( ).
15 m
900 m
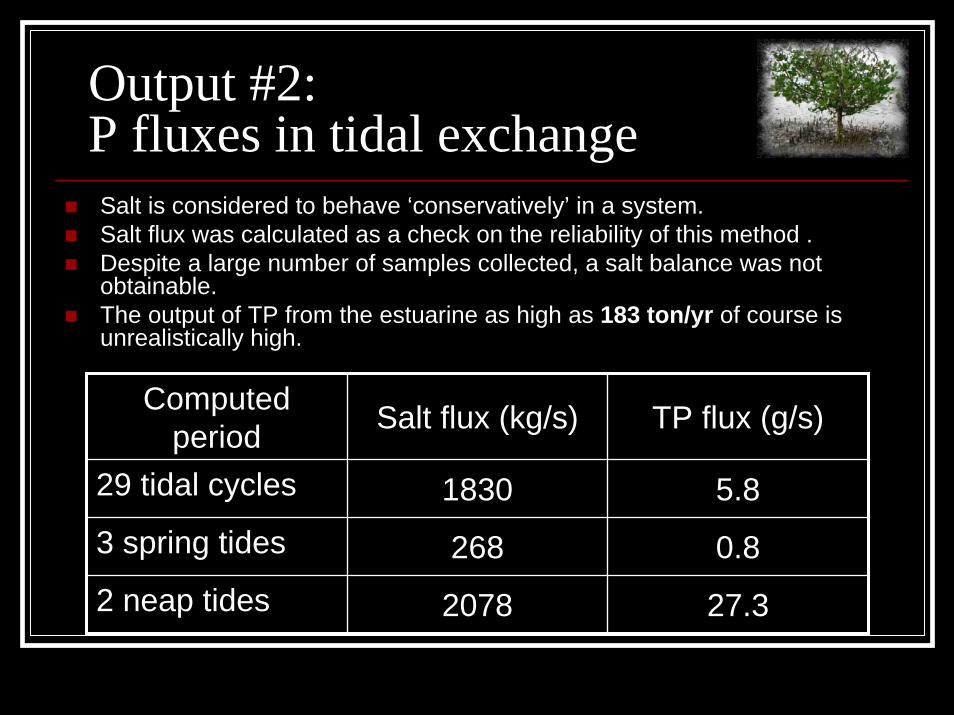
Salt is considered to behave ‘conservatively’ in a system.Salt flux was calculated as a check on the reliability of this method .Despite a large number of samples collected, a salt balance was not obtainable. The output of TP from the estuarine as high as 183 ton/yr of course is unrealistically high.
Output #2:P fluxes in tidal exchange
Computed period Salt flux (kg/s) TP flux (g/s)
29 tidal cycles 1830 5.83 spring tides 268 0.82 neap tides 2078 27.3

TP Budget (ton/yr) (Foong, 2002)Dry & Wet Atmospheric Deposition
4 ton/yr
Above ground Biomass550 ton
Mangrove assimilation
47 ton/yr
Leaf litter 26 ton/yr
Microbial activity 4 ton/yr
Macro-feeder9 ton/yr
Available for export13 ton/yr
Under ground Biomass60 ton
Sediment1.6 x 105 ton
Mineralization 0.5 ton/yr
Municipal waste180 ton/yr
Agriculture16 ton/yr
Aquaculture4.4 ton/yr
Tidal export
183 ton/yr ??
Throughfall & Stemflow7 ton/yr
Sedimentation 16.1 ton/yr

TP Budget (ton/yr)No Source Input (ton/yr) Output (ton/yr)1 Atmospheric (Dry + Wet deposition) 4
2 Intrasystem nutrient flux (Throughfall+ stemflow) 7
3 Domestic waste 1804 Agriculture (paddy only) 165 Aquaculture 4.46 Mineralization (sediment) 0.5
Total Input (211.9)7 Leaf litter (available for export) 138 Tidal exchange 183 (?)
Total output (without tidal exchange)
(13)
Total output (with tidal exchange) (196)

P-cycle (Overall discussion)Despite the over-estimation of P output from tidal exchange, the Merbok mangrove ecosystem acted as sink for TP during the course of study.
Analysis of data from various sources balancing the input, output and fluxes between the major pools of P in the Merbok ecosystem led to a conclusion that the mangrove ecological role as P source/sink has been greatly masked by the huge input of P from human activities.
The effort to look at the P flux between coastal mangrove with coastal water did not provide the data needed to estimate the tidal exchange of P. This is due to the inherent variability of a tidal system on both temporal and spatial scales.

P-budget (Overall discussion)The ground water and pore water P turnover are excluded due to the limited amount of information available.
Virtually all of the secondary data reported are for total P, and do not include available inorganic P (Dissolved Inorganic Phosphorus, DIP) or phosphorus bound in organic matter (Dissolved Organic Phosphorus, DOP). This greatly restricted the study of P cycle.
The growing human population in the Merbokcatchment post a major concern for the ecosystem.

P-cycle (Overall discussion)
With the present load of sewage, study of the carrying capacity of the ecosystem would be needed.
The full significant of the export of P by the Merbok Mangrove ecosystem remains to be explored.
However, the overall budget could be used to understand the relative importance of various input, output and pools as source or sinks of P to the Merbok mangrove ecosystem.

ReferenceAlongi, D.M.(1990). Effect of mangrove detrital outwelling on nutrient regeneration & oxygen fluxes in coastal sediments of the Central Great Barrier Reef lagoon. Est.Coast.& Shelf Sci. 31:581-598.Caddy, J.F. & Bakun, A.(1995). Marine catchment basins & antrhopogenic effects on coastal fishery ecosystems. FAO Fisheries Technical Paper. No. 349. FAO, Rome: Effects of riverine inputs on coastal ecosystems & fisheries resources. P119-133.Chauvelon, P.(1998). A wetland managed for agriculture as an interface between the Rhône river and the Vaccarès laggon (Camargue, France): transfers of water and nutrients. Hydrobiologia 372/374,p181-191.Foong, S.Y. (2002). Phosphorus Budget In A Mangrove Ecosystem. Ph.D thesis. Universiti Sains Malaysia.Gong, W.K. & Ong, J.E.(1990). Plant biomass & nutrient flux in a managed mangrove forest in Malaysia. Estuarine, Coastal & Shelf Science 31, 519-530.Japar, S.B.(1989). Studies on Leaf litter decomposition of the mangrove, Rhizophoraapiculata BL. Ph.D. Thesis. Universiti Sains Malaysia, 322p.

ReferenceKillingbeck, K.T. & Wali, M.K.(1978). Analysis of a North Dakota gallery forest: Nutrient, trace element and productivity relations. Oikos 30:29-60.Kjerfve, B. (1979). Measurement & analysis of water current, temperature, salinity, and denstiy. Pp 186-226. In: Estuarine Hydrography & sedimentation. K.R.Dyer (ed.). Cambridge University Press, Cambridge.LKIM (1998). Penyenaraian penternak sistem akuakultur (Kolam air payau). Daerah Kuala Muda, Kedah. Lembaga Kemajuan Ikan Malaysia.Lee, S.Y.(1997). Mangrove outwelling: a review. Asia-Pacific Symposium on Mangrove Ecosystems. Proceedings of the Int.Conference. Hong Kong,Sept 1-3, 1993. p203-212.McGlone, D. & Garingal, H.(1998). Determination of residuals generation from anthropogenic activitities. In: SARCS/WOTRO/LOICZ Phillippine Core Research Site. 1998 annual report: Economic evaluation & biophysical modelling of the Lingayen Gulf in support of management for sustainable use. Marine Science Institute, University of Phillippines.Pomeroy, L.R., Smith, E.E. & Grant, C.M.(1965). The exchange of phosphate between estuarine water & sediments. Limnology & Oceanography, 10(2): 167-172.Robertson, A.I. & Phillips, M.J.(1995). Mangrove as filters of shrimp pond effluent: prediction & biogeochemical research needs. Asia-Pacific Symposium on Mangrove Ecosystems. Proceedings of the Int.Conference. Hong Kong,Sept 1-3, 1993. p311-321.