Nursing Facility Quality Review 2015 - Texas Health … A. Nursing Facility Quality Review 2015...
81
Nursing Facility Quality Review 2015 Health and Human Services 6/1/2017
Transcript of Nursing Facility Quality Review 2015 - Texas Health … A. Nursing Facility Quality Review 2015...

Nursing Facility
Quality Review 2015
Health and Human Services
6/1/2017

ii
Table of Contents
1. Executive Summary ....................................................................................... 1
Findings .......................................................................................................... 2
Use of Antipsychotic Medications .................................................................. 2
Measures demonstrating statistically significant improvements over time .......... 3
Measures that demonstrated statistically significant declines over time ............. 4
Next Steps ...................................................................................................... 5
Current Initiatives and Those in Development ...................................................... 6
2. Introduction .................................................................................................. 7
3. Background ................................................................................................... 8
Data Collection and Analysis .............................................................................. 8
Demographics .................................................................................................. 9
4. Key Findings ................................................................................................ 11
Use of Antipsychotic Medications ...................................................................... 11
Statistically Significant Linear Trends, Improving Over Time ................................ 13
Statistically Significant Linear Trends, Declining Over Time .................................. 15
Measures of Interest, but not Statistically Significant Linear Trends ...................... 17
5. Conclusion ................................................................................................... 19
Next Steps .................................................................................................... 20
Current Initiatives and Those in Development .................................................... 21
Music and Memory ................................................................................... 21
Reminiscence Activity ............................................................................... 22
Director of Nursing Academy ..................................................................... 22
The Center for Excellence in Long-Term Care ............................................... 23
Texas OASIS: Dementia Care Academy ...................................................... 23
Abuse, Neglect and Exploitation Academy ................................................... 23
Certified Nurse Aide (CNA) Advanced Academy ............................................ 24
Life Enrichment in a Person-Directed Environment ....................................... 24
Advanced Person-Centered Behavior Training for NF Residents with Dementia . 24
List of Acronyms .............................................................................................. 26
Appendix A. Nursing Facility Quality Review 2015 Findings ............................... 1

iii
Advance Care Planning ..................................................................................... 1
Depression ...................................................................................................... 2
Diabetes Mellitus .............................................................................................. 3
Fall Risk Management Practices .......................................................................... 7
Immunizations ............................................................................................... 10
Infectious Illnesses ......................................................................................... 12
Medication Practices and Safety ....................................................................... 14
Nutrition, Unintended Weight Changes, and Hydration ........................................ 17
Pain Assessment and Control ........................................................................... 20
Pressure Injuries ............................................................................................ 22
Psychotropic Medications ................................................................................. 25
Antipsychotic Medications ................................................................................ 26
Anti-anxiety Medications ................................................................................. 28
Sedative and Hypnotic Medications ................................................................... 31
Restraints ..................................................................................................... 32
Urinary Continence ......................................................................................... 36
Quality of Life/Consumer Satisfaction ............................................................... 38
References .................................................................................................... 50

1
1. Executive Summary
The General Appropriations Act (House Bill 1, Article II,
Department of Aging and Disability Services, 84th Texas
Legislature, Regular Session, 2015) allocated funds to the Texas
Department of Aging and Disability Services (DADS) to conduct a
statewide survey of people residing in Medicaid-certified nursing
facilities to assess their satisfaction with quality of life and care.
The Nursing Facility Quality Review (NFQR) has been conducted
since 2002. Since 2010, the NFQR report has been published on
a biennial basis. The previous NFQR report provided findings for
2013 and was published in January 2015. It is available on the
Quality Monitoring Program's (QMP) Reports, Manuals &
Brochures page at hhs.texas.gov.
DADS contracted with The University of Texas at Austin (UT
Austin) for data collection for the 2015 NFQR. Nurses hired by
the university visited over 800 nursing facilities across the state,
using a structured survey instrument to evaluate the quality of
care provided to a random sample of residents. While on-site,
the nurses also interviewed residents to determine satisfaction
with services received and their overall quality of life in the
facility.
In addition to information collected on-site, data from residents’
medication administration records (MARs) and the Centers for
Medicare and Medicaid Services (CMS) are included in this
report.
A number of changes were made to the survey instrument for
the 2015 NFQR, including:
● expanding the Quality of Life/Consumer Satisfaction section;
and

2
● adding new questions about the use of psychotropic
medications, and whether informed consent was obtained
prior to their use.
In February 2015, the contract with UT Austin was amended to
include the collection of facility level data regarding the Texas
Reducing Antipsychotics in Nursing Homes (TRAIN) initiative.
Launched in 2014, TRAIN was a collaborative effort between
DADS and the Texas Medical Foundation Quality Innovation
Network Quality Improvement Organization (TMF QIN-QIO) to
help nursing facilities reduce inappropriate use of antipsychotic
medications.
Findings
DADS staff analyzed the data, evaluating for linear trends across
time; either from the first year of data collection for a specific
measure, or when the wording of questions were revised. Any
trends identified were then tested for statistical significance.
Use of Antipsychotic Medications
The overuse of antipsychotic medications in nursing facility
residents has been a major quality concern, not only across the
state of Texas, but also nationally. In many cases, antipsychotics
were found to be used inappropriately to treat the behavioral
and psychological symptoms of dementia, despite warnings from
the Food and Drug Administration against their use in older
adults with dementia. (CMS, National Partnership to Improve
Dementia Care, 2016).
CMS data confirmed a decrease in the use of antipsychotics in
Texas nursing facilities from 25.19 percent in July 2014 (the
beginning of the TRAIN Initiative) to 20.06 percent in December
2015, and then to 19.07 percent in April 2016. NFQR 2015
findings were consistent with the data from CMS, indicating 21
percent of Texas residents in the sample were receiving an

3
antipsychotic medication. While this represents a marked
decrease in the use of these medications, efforts continue across
the state to further reduce the use of antipsychotics in Texas
nursing facilities.
Many of the facilities surveyed responded to the TRAIN survey.
In general, most had some knowledge of the TRAIN initiative,
and were familiar with the various resources available to them in
their efforts to reduce antipsychotic medication use in their
facilities. Staff from over 38 percent of the responding facilities
had attended at least one of the TRAIN conferences. Nearly all of
the facilities were focusing on antipsychotic reduction, and had
identified residents appropriate for gradual dose reductions.
Some of the facilities (42 percent) stated they would like to be
contacted by QMP for additional assistance with antipsychotic
reduction. If the facility requested additional assistance, their
contact information was provided to QMP staff for follow-up.
The following measures demonstrated statistically significant
improvements or declines over time. A statistically significant
change (improvement or decline) is one that is likely to be due
to a real effect, rather than random chance.
Measures demonstrating statistically significant
improvements over time
● Residents diagnosed with depression were more likely to
show improvement in depressive symptoms with treatment.
● Residents were more likely to be assessed for weight loss and
dehydration risk factors.
● Residents diagnosed with an anxiety disorder were more
likely to have on-going assessments to evaluate the goals of
therapy.
● Residents were less likely to be restrained than in previous
years.

4
Measures that demonstrated statistically
significant declines over time
● Residents were less likely to have an advance directive in
place.
● Residents were more likely to be diagnosed with diabetes,
and less likely to have had all the recommended assessments
and lab tests conducted.
● Residents were less likely to have received the influenza or
pneumonia vaccine.
● Residents were more likely to have been diagnosed with a
urinary tract infection (UTI) or a skin/wound infection in the
previous 30 days.
● The percent of residents with a comprehensive nutritional
assessment conducted decreased.
● Residents were more likely to have had an unintentional 10
percent weight change (loss or gain) in the previous six
months.
● Residents were less likely to be satisfied with their level of
pain control in the previous 24 hours.
● Residents were more likely to state they had concerns the
facility did not address and concerns they did not express due
to a fear of retaliation.
Other measures of interest were either new in 2015 or
demonstrated changes that were not statistically significant.
● More than three-quarters of the residents in the sample had
an active prescription for a psychotropic medication (e.g.,
antipsychotics, antidepressants, anti-anxiety medications, and
sedatives/hypnotics).1
● Of those residents diagnosed with diabetes, nearly one-half
had physician’s orders for sliding scale insulin.
● More than three-quarters of the residents who had an active
prescription for a psychotropic medication also had care plans
including behavior modification interventions addressing the
1 New measure for 2015.

5
specific behaviors for which psychoactive medications were
prescribed.2
● Most of the residents in the sample stated they felt safe and
secure in their nursing facility.
● Residents generally felt their possessions were safe in their
nursing facility.
● Residents were usually satisfied with the food served at the
nursing facility, and most stated their favorite foods were
available.
In general, residents interviewed during the on-site visits
expressed satisfaction with their overall experience in their
nursing facility (89 percent) and the healthcare they received
there (88 percent).
Next Steps
The HHSC QMP used the information gathered during the NFQR
to identify topics for focus area development. By fiscal year
2018, the QMP will be implementing two new focus areas:
● Diabetes Management
● Infection Prevention and Control (including updated
recommendations for vaccination)
In addition, QMP will continue developing training opportunities
for nursing facility staff, particularly front-line, direct care staff
to address learning deficits in specific areas including:
● care of residents with Alzheimer’s Disease or other forms of
dementia;
● recognizing and preventing abuse, neglect and exploitation;
and
● implementing person-centered care practices.
2 New measure for 2015.

6
Current Initiatives and Those in
Development
The QMP obtained approval from CMS to use Civil Monetary
Penalty funds to implement a number of initiatives to help
nursing facilities improve the quality of care and quality of life for
residents. Among those initiatives are programs such as Music &
Memory℠, Reminiscence Activity, the Director of Nursing
Academy, and Texas OASIS: Dementia Care Academy.
HHSC, in partnership with UT Austin School of Nursing, also
launched The Center for Excellence in Long-Term Care. The
Center for Excellence in Long-Term Care is a web-based
educational platform for disseminating evidence-based best
practices to professionals and other caregivers who work with
older adults and individuals with intellectual and developmental
disabilities.
Additional initiatives are in development and will be released
throughout 2017 and 2018.

7
2. Introduction
During the 84th Legislature, Regular Session, 2015, funds were
allocated by the Texas Legislature for a statewide survey of
Texas nursing facility residents to evaluate the quality of care
residents received and how satisfied they were with quality of
life in the nursing facility. NFQR has been conducted since 2002;
annually between 2002 and 2010, and biennially since 2010. For
each NFQR conducted, a written report of the findings has been
completed and submitted to the Legislature, Governor, and
HHSC Executive Commissioner. In 2015, funding for the NFQR
was no longer included as a Rider to the General Appropriations
Act, and was instead included in funding for base long-term care
strategies. As a result, submission of the report to the
Legislature, Governor, and HHSC Executive Commissioner is no
longer a requirement.
HHSC uses NFQR data to identify opportunities for statewide
improvement and measure statewide changes in the quality of
services provided across time. The NFQR examines care provided
to a sample of nursing facility residents to determine whether
that care was clinically appropriate. The standards for
appropriateness of care are evidence-based, determined from
systematic reviews of the clinical research literature.

8
3. Background
Data Collection and Analysis
Data collection for NFQR 2015 began in March 2015 and
continued through April 2016. Structured survey tools were used
to evaluate the quality of life and quality of care for 1,556
residents in 815 Medicaid-certified nursing facilities across the
state. Information was obtained from residents’ medical records
and interviews. If a resident was unable to participate in the
interview, attempts were made to contact the resident’s
responsible party to obtain their input on selected interview
questions.
Census information from a facility’s most recent survey visit by
DADS Regulatory Services was used to establish that facility’s
sample size; usually one to three residents in each facility. A list
of randomly generated numbers was then prepared for each
facility. This list, and a roster provided by the nursing facility,
was used by the nurse reviewers to select residents for the
sample. For example, if the random number was five, then the
fifth resident on the facility’s roster was selected for the sample.
DADS staff analyzed the data using statistical software to test for
linear trends across time, either from the first year data was
collected on a particular measure, or from when there was a
change in the wording of a question that prevented comparison
to the data from previous years.3
3 Statistically significant differences that are unlikely to be due to
chance are indicated by a footnote and corresponding p-value throughout this report. A p-value of <.01 means that there is a 99%
chance that the observed difference is due to a real effect.

9
The findings documented in the report came directly from the
resident assessments and interviews completed by the nurse
reviewers. Additional information was obtained from:
● evaluations of residents’ MARs and supporting
documentation; and
● data provided by the Centers for Medicare and Medicaid
Services (CMS).
Data were gathered in several areas of care including, but not
limited to, advance care planning, depression, diabetes,
medication management, restraints, falls, and pressure injuries.
The resident interview portion of the survey addressed quality of
life, including dietary preferences, activities, privacy and dignity,
and resident autonomy.
Beginning in February 2015, the nurse reviewers also collected
facility level data regarding the TRAIN Initiative. Each facility’s
administrator (or his/her designee) was provided with a paper
survey to complete. The survey included questions regarding
his/her familiarity with the TRAIN initiative and any changes the
facility had implemented as a result of TRAIN activities.
Responses were received from 758 facilities; in some cases, the
facilities refused to return the questionnaire. Other facilities
answered some, but not all questions.
Demographics
The residents in the sample ranged in age from 18 to 108 years,
with an average age of 78 years. The majority of residents in the
sample were female (66 percent), and many had been diagnosed
with dementia or another form of cognitive impairment (60
percent). The median length of stay was nearly two and one-
half years.
The racial and ethnic breakdown of the residents in the sample
was:
● 67 percent White

10
● 14 percent Hispanic/Latino
● 16 percent Black/African American
● Less than 1 percent Asian
● Less than 1 percent American Indian/Alaska Native
● Less than 1 percent Native Hawaiian/Other Pacific Islander
● 2 percent Other

11
4. Key Findings
This section includes selected measures demonstrating
statistically significant changes over time, or which are important
indicators of residents’ quality of care and life. A detailed report
of the survey findings is in Appendix A.
Improvements or declines in a particular measure may be
represented by an increase or decrease in the percent of
residents affected. For example, the percent of residents
assessed for weight loss risk factors increased, while the percent
of residents restrained decreased. In both situations, this would
represent an improvement from previous survey findings.
Use of Antipsychotic Medications
One key measure of quality is the use of antipsychotic
medications in nursing facilities. These medications have often
been prescribed to manage the behavioral and psychological
symptoms of dementia, despite warnings from the Food and
Drug Administration (FDA) against the use of antipsychotics in
older adults with dementia.
Data gathered during the 2015 NFQR and data published by CMS
confirm the continued drop in the use of antipsychotic
medications in Texas nursing facilities.
● In July 2014, the prevalence of antipsychotic medication
usage in Texas nursing facilities was 25.19 percent, according
to CMS data. By December 2015, CMS data confirmed
antipsychotic use had decreased to 20.06 percent, and then
to 19.07 percent in April 2016.
● NFQR 2015 data indicated 21 percent of residents in the
sample received at least one antipsychotic medication.

12
DADS/HHSC and the TMF QIN-QIO launched The TRAIN Initiative
in July 2014. This initiative was developed to help nursing
facilities reduce the inappropriate use of antipsychotic
medications. TRAIN also addressed a lack of training for facility
staff, particularly in the care of residents with dementia and in
managing resident behaviors more effectively through non-
pharmacological interventions.
In addition to the initial conferences, other activities conducted
in support of the TRAIN initiative include:
● intense evaluation of antipsychotic use in facilities with each
Quality Monitoring visit;
● dementia-related training for nursing facility staff conducted
on-site by DADS/HHSC employees, including Alzheimer’s
Disease and Dementia Care Seminars and Virtual Dementia
Tours;
● a series of webinars focusing on decreasing antipsychotic use
and improving quality of care for residents with dementia,
including one developed specifically for prescribers; and
● the Geriatric Symposium, Texas Taking the Next Step:
Dementia in Long-Term Care and Community Settings.
The final TRAIN conferences were presented in December 2015,
and the educational content transitioned to the DADS
Educational Services Division. DADS/HHSC continues to
collaborate with the TMF QIN-QIO, the Texas Health Care
Association (THCA), providers, and other stakeholders on
additional projects to help nursing facilities reduce the use of
antipsychotic medications. The marked decrease in the use of
antipsychotics since 2014 reflects on-going efforts of all partners
involved in this initiative.
Of facilities responding to the TRAIN survey:
● 97 percent stated they received information regarding the
TRAIN initiative;
● 38 percent stated they attended at least one of the TRAIN
workshops held in July 2014 and October 2014;

13
● 89 percent stated they were familiar with the resources
available to assist with antipsychotic medication reduction,
including the QMP Rapid Response Team process, DADS
YouTube channel and the QMP Website;
● nearly 98 percent were focusing on antipsychotic medication
reduction;
● 98 percent stated they had identified residents who were
appropriate for gradual dose reductions; and
● nearly 97 percent stated they started gradual dose reductions
for those residents identified as appropriate.
Facilities were also asked about the percent of residents
receiving antipsychotic medications at two different points in
time: in July 2014 (the launch of the TRAIN initiative) and then
on the date the facility was visited by the nurse reviewer. The
percent of residents receiving antipsychotic medications in July
2014 ranged from 0 to 98 percent. When asked about
prevalence of antipsychotic medication use at the time of the
NFQR visit, the responses ranged from less than 1 percent to 98
percent.
Finally, the facilities were asked if they would like additional
assistance from QMP as they worked to reduce the prevalence of
antipsychotic medication use. About 42 percent of the facilities
responding to the survey stated they would like to be contacted
by a QMP staff member for additional assistance with
antipsychotic reduction. If a facility requested additional
assistance, contact information for a facility representative was
provided to QMP staff for follow-up.
Statistically Significant Linear Trends,
Improving Over Time
Measures demonstrating statistically significant improvements
over time included:

14
● Residents diagnosed with depression were more likely to
demonstrate improvement with treatment than in previous
years.
Over one-half of the residents in the sample were
diagnosed with depression, and nearly all were receiving
medication to treat their depressive symptoms.
Improvement in the symptoms of depression positively
impacts health status, as well as overall quality of life.
● Residents were more likely to be assessed for risk factors that
could lead to unintended weight loss and/or dehydration.
Unplanned weight loss can lead to loss of muscle tissue,
poor wound healing, and cognitive declines.
Dehydration can result in low blood pressure, increased
pulse rate, confusion and even death.
If the risk factors are identified, a care plan can be
developed and implemented to address those risks.
● Residents who had a diagnosis of an anxiety disorder were
more likely to have on-going assessments to determine if
they are meeting their treatment goals.
On-going assessments can guide changes in treatment
when the resident’s treatment goals are not being met.
● Residents were less likely to be restrained than in previous
years.
Restraints (chemical and physical) have been used for
many years to manage behaviors, prevent falls, and
prevent wandering and possible elopements.
Recent research has demonstrated restraints are not
effective interventions in most situations, and residents
who are restrained are at risk for serious adverse effects.
Adverse psychological effects include depression, agitation,
and withdrawal from social activities.
In addition, residents who are restrained are at risk for
pressure injuries, incontinence, fractures, and even death.

15
Statistically Significant Linear Trends,
Declining Over Time
Findings demonstrating statistically significant declines over
time, included:
Residents were less likely to have an advance directive in
place.
Advance directives are legal documents outlining a
resident’s decisions about current and future healthcare,
including end-of-life care such as cardio-pulmonary
resuscitation, use of a ventilator to assist with breathing,
or whether to begin artificial nutrition and hydration.
● The percent of residents diagnosed with diabetes mellitus
continues to increase over time, and residents do not always
have the recommended assessments and lab test completed.
Diabetes is a chronic metabolic disease that can have
devastating complications if not adequately treated,
including vision loss, kidney failure, and limb amputations.
The recommended lab tests and assessments provide
information about how well the resident’s diabetes is
controlled and guide decisions on treatment.
● Residents were less likely to have received the influenza or
pneumonia vaccine.
Individuals over the age of 65 and those with chronic
medical conditions are at higher risk for developing
significant complications if they contract influenza or
pneumonia.
Vaccination is recommended for all residents, and has
been shown to decrease the risk of hospitalization and
death in this population.
● Residents were more likely to have been diagnosed with a UTI
or a skin/wound infection in the previous 30 days.
Healthcare-associated infections (HAIs) can lead to
significant illness and even death in nursing facility
residents.

16
A number of factors impact residents’ risk of developing an
infection, including close-quarter living, changes in
immune response with aging ,and the use of invasive
medical devices such as intravenous lines and indwelling
bladder catheters.
● Residents were less likely to have had a comprehensive
nutritional assessment conducted.
A comprehensive nutritional assessment should be
completed by a licensed dietitian at least annually, and
include a calculation of the resident’s nutritional needs,
such as caloric intake and hydration needs.
● Residents were more likely to have had an unintentional 10
percent weight change (loss or gain) in the previous six
months.
An unintentional change in weight may be related to a
number of factors, such as chronic medical conditions or
medications.
In addition, cognitive impairments can impact a resident’s
nutritional status.
● Residents were less likely to be satisfied with their level of
pain control in the previous 24 hours.
Pain is subjective; there is no objective method for
measuring a resident’s level of pain.
The primary goal for each resident is to achieve a level of
pain control that is acceptable to him or her.
If a resident is not satisfied with level of pain control, the
facility staff need to reassess the resident and revise the
pain management plan.
● Residents were more likely to state they had concerns the
facility did not address, and concerns they did not express
due to a fear of retaliation.
Residents must be able to freely express their concerns
without fear of retaliation.
Residents need to be confident their concerns will be
addressed, even if the facility cannot resolve a specific
concern fully (such as a regulatory requirement).

17
Measures of Interest, but not
Statistically Significant Linear Trends
Measures demonstrating potentially negative outcomes for
residents included:
● More than three-quarters of residents in the sample were
receiving a psychotropic medication (e.g. antipsychotics,
antidepressants, anxiolytics, sedatives, or hypnotics). 4
This may reflect the increase in diagnoses of depression
and/or anxiety, and the treatment of those disorders.
In addition, residents with sleep disturbances were more
likely to have an active prescription for a sedative/hypnotic
than in previous years.
● Nearly one-half of the residents diagnosed with diabetes had
orders for sliding scale insulin.
Sliding scale is not recommended for blood glucose control
in this population, and may lead to episodes of severe
hypoglycemia.
Potentially positive measures of interest included:
● When residents were prescribed a psychotropic medication,
their care plans usually included non-pharmacological
interventions to address the specific behaviors for which those
medications were prescribed.5
Non-pharmacological interventions can be very effective
and, when used consistently, can lead to a reduction in
antipsychotic use.
● Residents were usually satisfied with the food served at the
nursing facility, and most stated their favorite foods were
available.
In general, residents interviewed during the on-site visits
expressed satisfaction with their overall experience in the
nursing facility and the care received there. In addition, most of
4 New measure for 2015. 5 New measure for 2015.

18
the residents stated they felt safe and secure in their facility, and
that their possessions were safe as well.

19
5. Conclusion
The NFQR 2015 assessed the quality of care and quality of life of
a sample of more than 1,500 individuals residing in nursing
facilities in Texas. Survey results indicate residents were
generally satisfied with their overall experience and the health
care services they received in their nursing facility. Residents
were also likely to feel safe and secure in their facilities, and that
their possessions were safe in the facility.
The overuse of antipsychotic medications in nursing facility
residents has been a significant quality concern. CMS data and
NFQR 2015 findings showed a large decrease in the numbers of
residents receiving an antipsychotic medication. The decrease
reflects the continued efforts of all stakeholders to ensure
antipsychotics are only prescribed when needed and clinically
appropriate.
Additional improvements were identified in the care of residents
diagnosed with anxiety disorders and depression. In addition,
residents were less likely to be restrained than in previous years.
While residents were more likely to have been assessed for
weight loss and dehydration risk factors, fewer residents had a
comprehensive nutritional assessment conducted.
Declines in measures were demonstrated through the increased
number of residents found to have exhibited an unintended
weight change (loss or gain) of 10 percent in the previous six
months than in prior years, and the decrease in the proportion of
residents who received the influenza and pneumococcal
vaccines. Residents were also less likely to have executed an
advance directive, a legal document outlining decisions about
health care, including end-of-life care. Finally, residents were

20
less likely to be satisfied with the level of pain control they
achieved in the 24 hours prior to being interviewed.
The information gathered through the NFQR process is shared
with a variety of programs throughout the Texas Health and
Human Services, as well as providers, industry groups, and other
stakeholders.
Next Steps
The data gathered through the NFQR is used by QMP to identify
focus areas for future development or other initiatives to help
nursing facilities improve the quality of care they provide. Based
on an analysis of the data, QMP has identified two new focus
areas for development:
● Diabetes Management
● Infection Prevention and Control
These focus areas will be beta-tested by QMP field staff, and will
be fully implemented by the beginning of fiscal year 2018.
The QMP works with nursing facilities in a collaborative manner,
conducting on-site visits to evaluate facility practices in specific
clinical areas and the residents’ overall quality of life. The QMP is
not a regulatory program and does not cite deficient practices;
rather, QMP staff use an educational approach to quality
improvement. The QMP uses the Early Warning System (EWS), a
statistical risk model, to identify facilities that will receive visits:
● Facilities identified as medium to high risk through the EWS,
or who have a history of resident care deficiencies, receive
Quality Monitoring Visits.
● Facilities identified as high risk, or having three deficiency
citations in a 24-month period constituting an immediate
threat to the health and safety related to the abuse or neglect
of a resident, receive Rapid Response Team (RRT) visits.
RRTs are an intensive form of a Quality Monitoring Visit, and
the process usually continues for a six-month period of time.
The team includes multiple disciplines, including a QMP

21
pharmacist, nurse, and dietitian; the Long-Term Care
Ombudsman assigned to the facility and the regional
regulatory services facility liaison may also participate as
necessary.
● Quality Monitoring and RRT visits can also be provider-
solicited.
The QMP will continue to work with TMF QIN-QIO, THCA, UT
Austin and other partners to develop training opportunities for
nursing facility staff. In particular, the QMP is targeting front-
line, direct care staff as new training programs are developed to
address their learning needs in areas such as:
● care of residents with Alzheimer’s Disease or other forms of
dementia;
● recognizing and preventing abuse, neglect, and exploitation;
and
● implementing person-centered care practices.
Current Initiatives and Those in
Development
The QMP, in collaboration with a variety of partners, has
implemented innovative programs designed to help nursing
facilities improve the quality of care provided (with a particular
focus on residents with dementia) while reducing the use of
antipsychotic medications. Some of those initiatives include:
Music and Memory
Music and Memory is a non-profit organization dedicated to
providing personalized music playlists to individuals struggling
with dementia or other cognitive and physical impairments.
Research confirms the positive effects of familiar music on brain
activity and the program is an effective intervention for reducing
the use of antipsychotic medications.

22
QMP received permission from CMS to use Civil Monetary Penalty
funds to implement Music and Memory in 400 nursing facilities
across the state. By the end of 2018, nearly 10,000 nursing
facility residents will have participated in the Music and Memory
program.
Reminiscence Activity
Using Civil Monetary Penalty funds, QMP provided participating
facilities with Memorable Moments bags containing tangible
prompts relating to a specific theme, such as the beach or
baseball. Objects and familiar items from the past, as well as
pictures and archive sound recordings, are used to stimulate
discussion of past activities and experiences. Discussions that
prompt memories of residents’ lives and past experiences can
improve well-being and reduce reliance on antipsychotic
medications to manage behavioral symptoms often associated
with Alzheimer's disease and dementia.
Director of Nursing Academy
The Director of Nursing (DON) Academy was presented in seven
locations across the state in 2016. These three-day conferences
provided participants with resources necessary to succeed as a
DON in a nursing facility. The Academy emphasized a team
approach to quality improvement and creating a person-centered
care culture, ultimately improving quality of care and quality of
life for residents.
Participants also received information on state and federal
regulations for long-term care, staff engagement and retention,
leadership, culture change, and dementia care. Once the initial
conferences were completed, the Academy transitioned to the
DADS Educational Services Division. Division staff will continue
to offer the training periodically.

23
The Center for Excellence in Long-Term Care
The Center for Excellence in Long-Term Care is a partnership
between HHSC and UT Austin School of Nursing. This web-based
educational platform is designed to deliver best practices to
nurses and other professionals who work with older adults and
individuals with disabilities.
The first series of modules focuses on improving dementia care
in Texas nursing homes and reducing inappropriate use of
antipsychotic medications. Content is available for nurses at all
levels of licensure, as well as administrators, nurse aides, and
physicians. Additional content will be added in the future,
including:
● Phase II: Geriatric Nursing Specialty Education
The Geriatric Nursing Specialty Education training program
will provide education, best practices, and clinical
guidelines, in an effort to transition nurses into geriatric
care, specifically to long-term care settings.
● Phase III: Geriatric Transition to Practice
The modules in this phase of the project will focus on the
learning needs of nurses (Licensed Vocational Nurses and
Registered Nurses) entering the long-term care setting for
the first time.
Texas OASIS: Dementia Care Academy
This two-day educational offering focuses on dementia basics,
including person-centered care, managing dementia-related
behaviors, and alternatives to the use of antipsychotic
medications. The first conferences were held in November 2016
and were then offered in locations across the state through
February 2017.
Abuse, Neglect, and Exploitation Academy
The Abuse, Neglect, and Exploitation (ANE) Academy focuses on
screening for and preventing ANE, as well as changing

24
environments in which ANE develops. These two-day
conferences are open to all nursing facility staff; however, the
curriculum was designed and intended for front-line staff
providing care to residents. The conferences began in May 2017
and will continue through July 2017.
Certified Nurse Aide Advanced Academy
The QMP was awarded Civil Monetary Penalty funds for the
creation of the Certified Nurse Aide (CNA) Academy. The
academy’s purpose is to provide a comprehensive training
program for CNAs in Texas nursing facilities, beyond the basic
Nurse Aide Training & Competency Program required for
certification. Through this academy, CNAs gain additional
information on their role in the nursing facility, with a focus on
caring for the geriatric population. This training will be presented
around the state beginning in 2018.
Life Enrichment in a Person-Directed Environment
In October 2016, QMP was awarded funds to create this training
program for nursing facility staff. This training will assist direct
care staff in providing the residents with individualized activities,
particularly activities that are important to the residents based
on their preferences, customary habits, and lifestyle. This
training will be presented beginning in 2018.
Advanced Person-Centered Behavior Training for NF
Residents with Dementia
The QMP is developing this course using Civil Monetary Penalty
Funds. The purpose of this training is to help nursing facility staff
understand how to most effectively work with residents who
have dementia and display out of character behaviors. The
training emphasizes the importance of individualized care that
includes identifying the resident’s specific behaviors and
effectively working with the resident to prevent the behaviors
from becoming an issue. This training will initially be presented

25
in 20 nursing facilities around the state in 2018, and then will be
provided by QMP staff for other nursing facilities on request.

26
List of Acronyms
Acronym Full Name
ADA American Diabetes Association
ANE Abuse, Neglect and Exploitation
CMS Centers for Medicare & Medicaid Services
CNA Certified Nursing Academy
DADS Department of Aging and Disability Services
DON Director of Nursing
EWS Early Warning System
FDA Food and Drug Administration
HHSC Health and Human Services Commission
MARs Medication Administration Records
NFQR Nursing Facility Quality Review
NPUAP National Pressure Ulcer Advisory Panel
OTC Over-the-counter
QMP Quality Monitoring Program
RRT Rapid Response Team
TMF QIN-QIO Texas Medical Foundation Quality Innovation Network-Quality
Improvement Organization
THCA Texas Health Care Association
TRAIN Texas Reducing Antipsychotics in Nursing Homes
UT Austin The University of Texas at Austin
UTI Urinary tract infection

Appendix A. Nursing Facility Quality Review 2015 Findings
Advance Care Planning
Advance care planning encourages residents and/or their family members to
make decisions about current and future healthcare. Ideally, advance care
planning should begin while the resident still has the ability to participate;
this is particularly important when a resident has been diagnosed with
dementia or another form of cognitive impairment. Advance care planning
helps ensure the care received is in accord with the resident’s values and
wishes.
Advance directives are legal documents reflecting the healthcare decisions
made, including whether to initiate cardio-pulmonary resuscitation, the use
of a machine to assist with breathing, or the resident’s wishes regarding
artificial nutrition and hydration.
Findings
● Fewer residents had an advance directive than in previous years.6
● Residents were less likely to receive care consistent with their advance
directive.7
Table 1. Percent of Residents with an Advance Directive and Consistent Care
2007 2008 2009 2010 2013 2015
Residents who had
an advance directive
in place
69% 63% 63% 61% 60% 57%
Residents receiving
care consistent with
their advance
directive
99% 97% 99% 99% 99% 96%
6 Statistically significant linear trend at p <0.1. 7 Statistically significant linear trend at p <0.1.

A-2
Figure 1. Percent of Residents with an Advance Directive and Consistent Care
0 25 50 75 100
2015
2013
2010
2009
2008
2007
Percentage of Residents (%)
Residents withan advancedirective
Residentsreceiving careconsistent withtheir advancedirective
Depression
Depression is estimated to affect nearly half of all nursing facility residents.
(Harris-Kojetin, et al, 2013). Because depression often occurs concurrently
with other physical and cognitive disorders symptoms may go unrecognized,
delaying diagnosis and treatment. Appropriate diagnosis and treatment can
significantly improve residents’ quality of life.
Antidepressant medications are often the first-line treatment, and while
generally effective, antidepressants can have undesirable side effects. Other
treatment options include group and/or individual psychotherapy, cognitive-
behavioral therapy, and exercise.
Findings
● Residents were more likely to be diagnosed with depression than in
previous years.8
● Residents were more likely to have on-going assessment of their
depressive symptoms.9
● Most residents received medication to treat their depressive symptoms.
● Residents were more likely to have improvement in depressive symptoms
with treatment.10
8 Statistically significant linear trend at p <0.1. 9 Statistically significant linear trend at p <0.1.

A-3
Table 2. Percent of Residents with Depression Diagnosis, and Assessment and
Treatment
2010 2013 2015
Residents with a diagnosis of depression 38% 54% 57%
Residents who had on-going assessment of
depressive symptoms
37% 52% 70%
Residents with depression, treated with
medication
91% 89% 93%
Residents with improvement in depressive
symptoms with treatment
48% 59% 72%
Figure 2. Percent of Residents with Depression Diagnosis, and Assessment and
Treatment
Diabetes Mellitus
Diabetes is a chronic disease that can lead to serious complications,
including vision loss, kidney failure, and amputations. Individuals with
diabetes are twice as likely to develop heart disease or have a stroke as
those who do not. In 2013, diabetes was the seventh leading cause of death
in the U.S. (CDC, Diabetes at a Glance, 2016). The financial impact is
significant as well; one out of every three Medicare dollars is spent caring for
0 25 50 75 100
2015
2013
2010
Percentage of Residents (%)
Residents diagnosedwith depression
Residents with on-going assessment ofsymptoms
Residents treatedwith medication
Residentsdemonstratingimprovement withtreatment
10 Statistically significant linear trend at p <0.1.

A-4
people with diabetes (American Diabetes Association [ADA], The Staggering
Costs of Diabetes in America, 2012).
Findings
● The proportion of residents diagnosed with diabetes increased in 2015.11
Table 3. Percent of Residents with Diabetes Diagnosis
2010 2013 2015
Residents with a diagnosis of diabetes 33% 34% 37%
Figure 3. Percent of Residents with Diabetes Diagnosis
0 5 10 15 20 25 30 35 40
2015
2013
2010
Percentage of Residents (%)
Certain assessments and laboratory tests are recommended to determine
how well an individual’s diabetes is controlled, and to identify any evidence
of microvascular complications, including a dilated eye exam, a complete
foot assessment, blood lipid (cholesterol and triglyceride) levels, and urine
protein. The resident’s Hemoglobin A1C should be checked as well (ADA,
Standards of Medical Care, 2016).
Findings
● Over half of residents diagnosed with diabetes received a foot
assessment.
● Less than a third of residents had a comprehensive eye exam conducted.
11 Statistically significant linear trend at p <0.1.

A-5
● Fewer residents had received all of the recommended assessments,
exams, and lab tests.
● Less than one-half of residents with diabetes had their lipid profile12 or
urine protein13 checked.
● Most of the residents had their hemoglobin A1C tested within the previous
12 months.
Table 4. Percent of Residents Who Received Recommended Exams, Tests, and
Assessments
2010 2013 2015
Residents with diabetes who had received an eye
exam, a foot assessment and all recommended lab
tests
6%
15%
5%
Residents with diabetes who had received an eye
exam
28% 31% 28%
Residents with diabetes who had received a foot
assessment
54% 53% 53%
Residents with diabetes who had a lipid profile
completed
43% 60% 44%
Residents with diabetes who had a urine protein
completed
33% 50% 41%
Residents with diabetes who had a HgB A1C
completed
71% 74% 72%
12 Statistically significant linear trend at p <0.1. 13 Statistically significant linear trend at p <0.1.

A-6
Figure 4. Percent of Residents Who Received Recommended Exams, Tests, and
Assessments
0
10
20
30
40
50
60
70
80
2010 2013 2015
Hgb A1C
Urine protein
Lipid profile
Foot assessment
Eye exam
All recommendedexams and lab tests
Treatment for diabetes varies according to the needs of the resident.
Available treatments include dietary management, oral medications, and
insulin therapy. Sliding scale is a form of insulin therapy; giving a prescribed
dose of insulin based on the capillary blood sugar level at a specific time,
usually with no consideration to meal intake. Sliding scale dosing is an
ineffective way to manage diabetes, but is still frequently used (AMDA-The
Society for Post-Acute and Long-term Care Medicine, Choosing Wisely: Don’t
Use Sliding Scale Insulin for Long-Term Diabetes Management for
Individuals Residing in Nursing Homes, 2013).
Findings
● Nearly one-half, 47 percent, of the residents diagnosed with diabetes had
orders for sliding scale insulin.14
Table 5. Percent of Residents with Physician Orders for Sliding Scale Insulin
2015
Residents with a diagnosis of diabetes and an order for sliding scale insulin 47%
14 The wording of the question and answer options were revised for 2015,
preventing comparison to previous year’s data.

A-7
Figure 5. Percent of Residents with Physician Orders for Sliding Scale Insulin
0 10 20 30 40 50 60
2015
Percentage of Residents (%)
Fall Risk Management Practices
Falls are a leading cause of fatal and non-fatal injuries in older adults. In
2014, around 2.8 million people over the age of 65 were treated in hospital
emergency rooms for fall-related injuries, and approximately 800,000 were
hospitalized for further treatment. About 27,000 older adults died as a result
of fall-related injuries (Bergen G, Stevens M, Burns E, Falls and Fall Injuries
Among Adults Aged ≥65 Years - United States, 2014).
Residents often have multiple risk factors for falls, including medications,
mobility or functional deficits (such as lower extremity weakness and
impaired balance), and changes in cognition. A comprehensive fall risk
assessment will identify a resident’s specific risk factors and guide staff as
they develop a care plan to address those risk factors.
Findings
● Residents were usually assessed for fall risk within 24 hours of admission
to the facility.
Table 6. Percent of Residents Assessed for Fall Risk within 24 Hours of Admission
2010 2013 2015
Residents assessed for fall risk within 24 hours of
admission
85% 77% 85%

A-8
Figure 6. Percent of Residents Assessed for Fall Risk within 24 Hours of Admission
0 10 20 30 40 50 60 70 80 90
2015
2013
2010
Percentage of Residents (%)
Findings
● The percent of residents who experienced at least one fall remained
relatively stable relative to previous measurement years.
Table 7. Percent of Residents Experiencing at Least One Fall
2010 2013 2015
Residents who experienced at least one fall in the
previous 30 days
10% 9% 10%

A-9
Figure 7. Percent of Residents Experiencing at Least One Fall
0 2 4 6 8 10 12
2015
2013
2010
Percentage of Residents (%)
While a fall does not always result in an injury, older adults are at higher risk
for fall-related injuries, including fractures and head trauma. Certain
fractures, including hip and spinal fractures, can significantly increase the
risk of long-term impairment and death. Older adults in general have an
increased risk of death in the first year after a hip fracture, and the mortality
risk increases about four percent each year thereafter (Schnell S., Friedman
SM., et al, The 1-Year Mortality of Patients Treated in a Hip Fracture
Program for Elders, 2010).
Findings
● Residents were less likely to be injured as a result of a fall, and the
percent of residents who experienced a fracture of the hip, upper
extremity, or pelvis decreased.
● The percent of residents who had a fall-related fracture (other than hip,
upper extremity, or pelvic fracture) or head injury increased.
Table 8. Percent of Residents with Fall-related Injury
2010 2013 2015
Of residents who had fallen, those with any injury 34% 38% 29%
Of residents who had fallen, those with a fractured
hip, upper extremity, or pelvis
2% 3% 2%

A-10
2010 2013 2015
Of residents who had fallen, those with any other
fracture
2% 3% 6%
Of residents who had fallen, those with a head injury 3% 5% 8%
Figure 8. Percent of Residents with Fall-related Injury
0 5 10 15 20 25 30 35 40
2015
2013
2010
Percentage of Residents (%)
Any fall related injury
Fracture of hip, upperextremtiy or pelvis
Any other fracture
Head injury
Immunizations
Influenza (flu) is a viral infection that is easily spread from person to person.
The flu leads to nearly 200,000 hospitalizations and an average of 23,607
deaths annually in the United States. In a typical flu season, up to 90
percent of flu-related deaths are in people over the age of 65 (CDC,
Epidemiology and Prevention of Vaccine-Preventable Diseases 13th Edition,
2015).
Pneumococcal pneumonia is a common bacterial infection, leading to nearly
175,000 hospitalizations each year in the U.S. The overall death rate for
pneumococcal pneumonia is an estimated 5 to 7 percent; however, in older
adults the fatality rate can reach over 50 percent (CDC, 2015).
Nursing facility residents should receive the flu vaccine on an annual basis.
Residents who have never received a pneumococcal vaccine should receive
the 13-valent pneumococcal conjugate vaccine (PCV 13 or Prevnar 13),

A-11
followed by a dose of the 23-valent pneumococcal polysaccharide vaccine
(PPSV 23). If the resident has already received the PPSV 23, he or she
should then be given a dose of the PCV 13 at least one year later (CDC,
Recommended Immunizations for Adults by Age, 2016).
Findings
● Residents were less likely to receive the influenza vaccine than in
previous years.15
● Residents were less likely to receive the pneumococcal vaccine than in
previous years.16
Table 9. Percent of Residents Receiving Influenza and Pneumococcal Vaccines
2008 2009 2010 2013 2015
Residents who received the
influenza vaccine
74% 76% 76% 70% 70%
Residents who received the
pneumococcal vaccine
61% 66% 61% 58% 58%
Figure 9. Percent of Residents Receiving Influenza and Pneumococcal Vaccines
0 10 20 30 40 50 60 70 80
2015
2013
2010
2009
2008
Percentage of Residents (%)
Influenzavaccine
Pneumococcalvaccine
15 Statistically significant linear trend at p <0.1. 16 Statistically significant linear trend at p <0.1.

A-12
Infectious Illnesses
As individuals age, changes in immune response occur; in addition, nursing
facility residents often have multiple chronic medical conditions that can
affect their immune systems, increasing the risk of developing an infection.
Between one and three million serious infections occur each year in long-
term care facilities, with as many as 380,000 deaths annually related to
infection (CDC, Nursing Homes and Assisted Living (Long-term Care
Facilities [LTCFs]), 2016).
Findings
● Residents were more likely to have a UTI than in previous years.17
● Residents were more likely to have a skin or wound infection than in
previous years.18
● A larger proportion of residents had been diagnosed with pneumonia.
● Residents were rarely diagnosed with bacterial diarrhea.
Table 10. Percent of Residents with UTI, Skin Wound Infection, or Bacterial
Diarrhea
2010 2013 2015
Residents diagnosed with a UTI in the previous 30
days
12% 12% 21%
Residents diagnosed with a skin or wound infection
in the previous 30 days
6% 5% 10%
Residents diagnosed with pneumonia in the previous
30 days
4% 3% 6%
Residents diagnosed with bacterial diarrhea in the
previous 30 days
2% 1% 1%
17 Statistically significant linear trend at p <0.1. 18 Statistically significant linear trend at p <0.1.

A-13
Figure 10. Percent of Residents with UTI, Skin Wound Infection, or Bacterial
Diarrhea
0 3 6 9 12 15 18 21 24
2015
2013
2010
Percentage of Residents (%)
UTI
Skin/WoundInfection
Pneumonia
BacterialDiarrhea
Antibiotic resistance is an emerging public health threat, related to the wide-
spread use of antibiotics. Antibiotics are among the most commonly used
medications, but are often prescribed inappropriately, including for the
treatment of non-bacterial illnesses, incorrect dosages, or when used for
longer than necessary. When antibiotics are used inappropriately, organisms
can become resistant to treatment and can be transmitted by the person or
environment to others (CDC, Antibiotic/Antimicrobial Resistance, 2016).
Findings
● Over one-third of residents received an antibiotic medication in the
previous 90 days.
● A culture was often, but not always, obtained before initiating antibiotics.
● When cultures were obtained, the organism identified was often
susceptible to the antibiotic ordered.
● Antibiotic orders were not usually revised when the cultures identified
bacteria resistant to the original antibiotic prescribed.
Table 11. Percent of Residents Receiving Antibiotics and Related Services
2015
Residents who received an antibiotic within the previous 90 days 37%
Residents who had a culture obtained prior to the first dose of an antibiotic 61%

A-14
2015
Residents whose cultures identified an organism susceptible to the antibiotic
ordered
69%
Residents whose antibiotic orders were changed when the culture identified
bacteria resistant to the initial antibiotic prescribed
4%
Figure 11. Percent of Residents Receiving Antibiotics and Related Services
0
15
30
45
60
75
2015
Antibioticchanged basedon culture
Bacteriasusceptible toantibioticorderedCulture obtainedbefore first dose
Received anantibiotic inprevious 90 days
Medication Practices and Safety
In the United States, people aged 65 and older make up approximately 20
percent of the population, but account for around 33 percent of medication
use (CMS, National Health Expenditure Data: Health Expenditures by Age
and Gender, 2012).
Findings
● Residents were prescribed an average of 16 medications, including over-
the-counter (OTC) drugs.
● Residents were prescribed an average of 10 medications, when OTC
medications were excluded.

A-15
Table 12. Average Number of Medications Prescribed Per Resident
Average number of
prescribed medications per
resident, including OTCs
Average number of prescribed
medications per resident,
excluding OTCs
2005 11 8
2006 11 8
2007 11 8
2008 11 8
2009 12 8
2010 12 9
2013 11 8
2015 16 10
Figure 12. Average Number of Prescribed Medications Per Resident
0 2 4 6 8 10 12 14 16
2015
2013
2010
2009
2008
2007
2006
2005
Number of Prescribed Medications
Prescribedmedications,includingOTCs
Prescribedmedications,excludingOTCs

A-16
As people age, changes in muscle mass, a decrease in the percentage of
body fat, and impairments in liver and kidney function can affect the way
medications are metabolized and excreted from the body. When older adults
take multiple medications (polypharmacy), they are at higher risk for drug
interactions. AMDA maintains a list of potential drug interactions that could
be especially harmful for nursing home residents (AMDA, Top10 Particularly
Dangerous Drug Interactions in PA/LTC, 2016).
Findings
● The most commonly identified medication combination on the Top 10 list
were ACE inhibitors (a type of blood pressure medication) with a
potassium supplement.
● Eight percent of residents in the sample had prescriptions for an ACE
inhibitor and a potassium supplement.
Table 13. Percent of Residents Prescribed an ACE Inhibitor and Potassium
Supplement
Residents prescribed an ACE inhibitor and a potassium supplement
2005 9%
2006 9%
2007 9%
2008 9%
2009 10%
2010 8%
2013 5%
2015 8%

A-17
Figure 13. Percent of Residents Prescribed an ACE Inhibitor and Potassium
Supplement
0 1 2 3 4 5 6 7 8 9 10
2015
2013
2010
2009
2008
2007
2006
2005
Percentage of Residents (%)
Nutrition, Unintended Weight Changes, and
Hydration
In an older adult, unplanned changes in weight may reflect an underlying
medical condition. Healthy body weight is defined as a body mass index
(BMI) of 18.5 to 24.9 kg/m². A BMI of 25-29.9 kg/m² is considered
overweight and a BMI of 30 or greater is considered obese. Weight loss is
considered significant when there is more than a 5 percent loss of body
weight in a 30 day period, or more than 10 percent loss in 180 days.
Significant weight gain occurs when a resident’s BMI increases from
overweight to obese (QMP, Healthy Weight Management, 2016).
Risk factors for unintended weight changes include, but are not limited to:
● chronic medical conditions, such as diabetes, cardiovascular disease or
cancer;
● medications;
● oral factors, such as dental disease or tooth loss; and
● physical inactivity and functional impairments.
Risk factors for dehydration are similar, as well as acute illnesses with fever,
vomiting, and diarrhea. Residents who need assistance with eating and
drinking are also at risk for dehydration. Severe dehydration can lead to low

A-18
blood pressure, rapid heartbeat, confusion, loss of consciousness, and even
death (QMP, Healthy Hydration, 2016).
Findings
● Residents were less likely to have had a comprehensive nutritional
assessment completed.19
● Residents were more likely to be assessed for weight loss risk factors.
● Most of the residents in the sample had been assessed for weight gain
risk factors.20
● Residents were more likely to be assessed for dehydration risk factors.21
Table 14. Percent of Residents Who Received Nutritional Assessments
2007 2008 2009 2010 2013 2015
Residents who had
a comprehensive
nutritional
assessment
93% 93% 93% 92% 93% 90%
Residents who were
assessed for weight
loss risk factors
65% 69% 71% 75% 80% 82%
Residents who were
assessed for weight
gain risk factors
- - - - - 73%
Residents who were
assessed for
dehydration risk
factors
53% 63% 70% 78% 83% 84%
19 Statistically significant linear trend at p <0.1. 20 New measure for 2015. 21 Statistically significant linear trend at p <0.1

A-19
Figure 14. Percent of Residents Who Received Nutritional Assessments
0
10
20
30
40
50
60
70
80
90
100
2015 2013 2010 2009 2008 2007
Pe
rce
nta
ge o
f R
esi
de
nts
(%
)
Assessed fordehydration riskfactors
Assessed for weightgain risk factors
Assessed for weightloss risk factors
Comprehensivenutritional assessment
Findings
● The percent of residents who had an unintentional 10 percent change in
weight over the prior 6 months increased.22
Table 15. Percent of Residents with Unintentional 10 Percent Change in Weight
over the Prior 6 Months
2010 2013 2015
Residents with an unintentional weight change of 10
percent in the previous 6 months
9% 11% 14%
22 Statistically significant linear trend at p <0.1

A-20
Figure 15. Percent of Residents with Unintentional 10 Percent Change in Weight
over the Prior 6 Months
0
2
4
6
8
10
12
14
16
2015 2013 2010
Pe
rce
nta
ge o
f R
esi
de
nts
(%
)
Pain Assessment and Control
Older adults often experience pain; however, pain is not a normal part of
aging. It is estimated that more than 50 percent of those aged 65 or older
experience “bothersome” pain (Patel KV., Guralnik JM., et al., Prevalence
and Impact of Pain Among Older Adults in the United States: Findings from
the 2011 National Health and Aging Trends Study, 2013). Inadequately
treated pain can lead to sleep disturbances, changes in cognition, impaired
physical function, and social isolation. Residents with dementia may have
trouble reporting pain, increasing the risk for under-treatment of pain and
inappropriate use of antipsychotic medications.
Pain is subjective; there is no objective measure that can be used to
determine the level of pain an individual is experiencing. Therefore, pain is
present when the resident says it is and is as severe as stated by the
resident. A pain management plan must be based on a thorough assessment
and then individualized to meet the resident’s goals for treatment.

A-21
Findings
● Residents were less likely to be satisfied with their level of pain control in
the 24 hours prior to being interviewed.23
Table 16. Percent of Residents Satisfied with Level of Pain Control
2006 2007 2008 2009 2010 2013 2015
Residents
expressing
satisfaction
with level of
pain control
in previous
24 hours
93% 94% 95% 95% 92% 92% 84%
Figure 16. Percent of Residents Satisfied with Level of Pain Control
0 25 50 75 100
2015
2013
2010
2009
2008
2007
2006
Percentage of Residents (%)
Pain medication is often the first line of treatment; however, non-
pharmacological interventions can be an important part of a resident’s pain
management program. Non-pharmacological therapies can include, but are
not limited to, biofeedback, massage therapy, physical therapy, and
cognitive behavioral therapy.
23 Statistically significant linear trend at p <0.1.
A-22
Findings
● Non-pharmacological therapies were rarely a part of residents’ pain
management plans.
● When residents had orders for non-pharmacological therapies, they were
used more frequently than in 2013.24
Table 17. Percent of Residents with Orders for Non-pharmacological Pain
Therapies
2013 2015
Residents with orders for non-pharmacological therapies for pain
management
12% 12%
Residents with orders for non-pharmacological therapies, who
received those interventions
6% 9%
Figure 17. Percent of Residents with Orders for Non-pharmacological Pain
Therapies
0 2 4 6 8 10 12 14
2015
2013
Percentage of Residents (%)
Orders for non-pharmacolgicaltherapies
Received non-pharmacological therapies inthe previous 7days
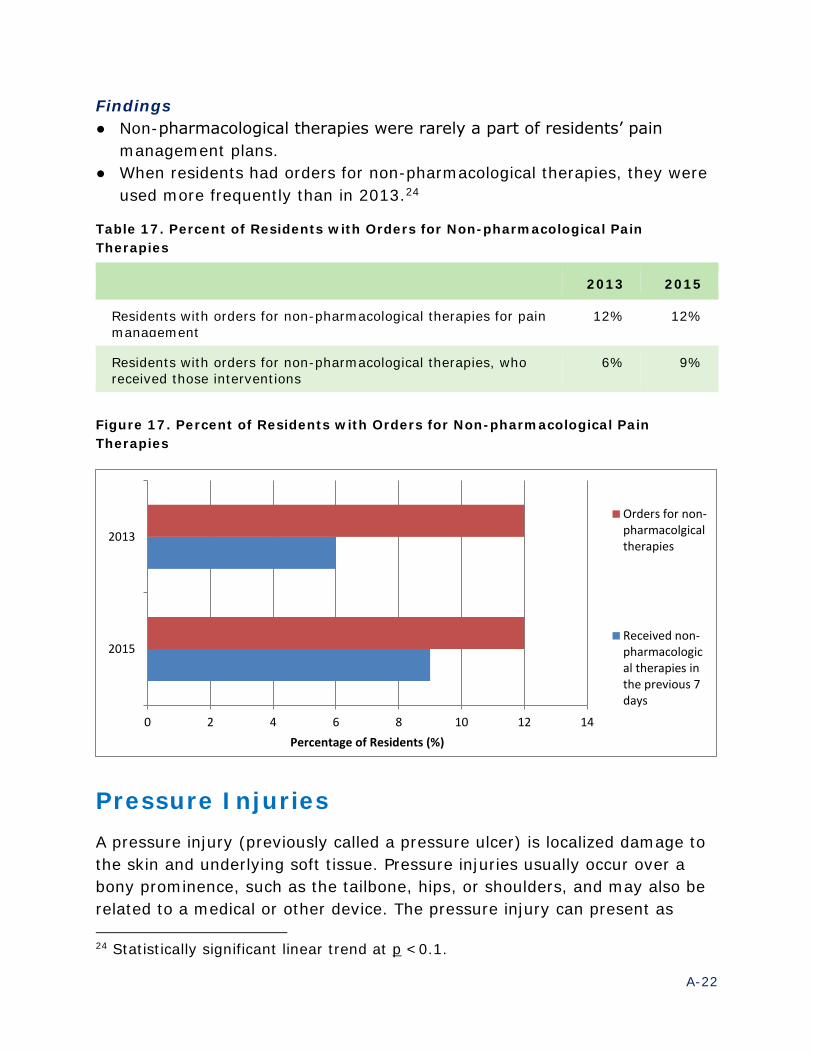
Pressure Injuries
A pressure injury (previously called a pressure ulcer) is localized damage to
the skin and underlying soft tissue. Pressure injuries usually occur over a
bony prominence, such as the tailbone, hips, or shoulders, and may also be
related to a medical or other device. The pressure injury can present as
24 Statistically significant linear trend at p <0.1.

A-23
intact skin or an open ulcer, and the individual may experience pain related
to the injury. Pressure injuries occur as a result of intense and/or prolonged
pressure or pressure in combination with shear. Many different factors can
impact how the soft tissue is affected by pressure and shear, including a
resident’s nutritional status and other medical conditions.
In 2016, the National Pressure Ulcer Advisory Panel (NPUAP) released an
update to the staging system. With that update, NPUAP included a change in
terminology from “pressure ulcer” to “pressure injury.” This change more
accurately reflects the current research into the how pressure injuries
develop, and recognizes that tissue injury may be present even when the
skin is intact (NPUAP, Pressure Injury Stages, 2016).
Findings
The percent of residents with a pressure injury has remained relatively
stable over time.
Table 18. Percent of Residents with a Pressure Injury, Regardless of Stage
2009 2010 2013 2015
Residents with a pressure injury 9% 8% 7% 8%
Figure 18. Percent of Residents with a Pressure Injury, Regardless of Stage
0 1 2 3 4 5 6 7 8 9 10
2015
2013
2010
2009
Percentage of Residents (%)

A-24
Pressure injuries are staged or categorized by the degree of injury to the
skin and underlying tissues, ranging from reddened, but intact skin (Stage
1) to an open wound that exposes bone and/or cartilage (Stage 4). In some
situations, the degree of injury may be difficult to assess; those wounds are
categorized as Unstageable or as a Deep Tissue Injury.
Findings
Residents may have had more than one pressure ulcer; this represents the
highest stage present at the time of data collection. The distribution of
pressure injuries by stage was:
● 11 percent Stage 1
● 40 percent Stage 225
● 14 percent Stage 3
● 12 percent Stage 4
● 17 percent Unstageable pressure injuries
● 7 percent Deep tissue injuries26
Table 19. Percent of Residents with Pressure Injury, by Highest Stage
2009 2010 2013 2015
Residents with a pressure injury,
percentage with a Stage 1 pressure
injury
18% 15% 21% 11%
Residents with a pressure injury,
percentage with a Stage 2 pressure
injury
45% 53% 31% 40%
Residents with a pressure injury,
percentage with a Stage 3 pressure
injury
9% 9% 13% 14%
Residents with a pressure injury,
percentage with a Stage 4 pressure
injury
14% 9% 7% 12%
Residents with a pressure injury,
percentage with an Unstageable
pressure injury
15% 13% 25% 17%
25 Statistically significant linear trend at p <0.1. 26 Statistically significant linear trend at p <0.1.

A-25
2009 2010 2013 2015
Of residents with a pressure injury,
percentage with a Deep Tissue Injury
n/a n/a 2% 7%
Figure 19. Percent of Residents with Pressure Injury, by Highest Stage
0 5 10 15 20 25 30 35 40 45 50 55
2015
2013
2010
2009
Percentage of Residents (%)
Stage 1
Stage 2
Stage 3
Stage 4
Unstageable
Deep TissueInjury
Psychotropic Medications
Psychotropic medications act on the central nervous system, causing
changes in mood, cognition, or consciousness. Antipsychotics,
antidepressants, anti-anxiety medications (anxiolytics), sedatives, and
hypnotics are all examples of psychotropic medications.
Findings27
● The majority of residents in the sample had an active psychotropic
medication prescription.
● Informed consent was usually obtained prior to administration of the first
dose of a psychotropic medication.
● Care plans for residents receiving psychotropic medications often included
behavior modification interventions addressing the specific behaviors for
which the medications were prescribed.
27 New measures for 2015.

A-26
Table 20. Percent of Residents with Active Psychotropic Medication Prescriptions
2015
Residents who had an active prescription for a psychotropic medication 76%
Residents with an active prescription for a psychotropic medication, and
who gave informed consent prior to administering the first dose (resident or
responsible party)
90%
Residents with an active prescription for a psychotropic medication, and
whose care plan included behavior modification interventions to address
specific behaviors for which the medications were prescribed
78%
Figure 20. Percent of Residents with Active Psychotropic Medication Prescriptions
0
25
50
75
100
2015
Pe
rce
nta
ge o
f R
esi
de
nts
(%
) Care plan includedbehaviormodificationinterventions
Informed consentobtained
Active prescriptionfor psychotropicmedications
Antipsychotic Medications
Antipsychotic medications are those used for the treatment of specific
psychiatric disorders such as schizophrenia or bipolar disorder.
In 2005, the FDA issued a “black box warning” (the strongest FDA warning)
noting an increased risk of death in older adults with dementia when taking
atypical (or second generation) antipsychotics such as risperidone,
olanzapine, or quetiapine. In 2008, the warning was expanded to include

A-27
typical (or first generation) antipsychotics including haloperidol,
chlorpromazine, and loxapine.
In 2012, CMS launched the National Partnership to Improve Dementia Care
in Nursing Homes. A goal of the partnership was reducing inappropriate use
of antipsychotic medications. Antipsychotic medications have often been
prescribed to manage dementia-related behaviors and are not an
appropriate of FDA-approved therapy or intervention for treating behavioral
or psychological symptoms of dementia.
Findings
● 21 percent of residents were receiving at least one antipsychotic
medication.
Table 21. Percent of Residents Receiving at Least One Antipsychotic Medication
2015
Residents who received at least one antipsychotic medication 21%
Figure 21. Percent of Residents Receiving at Least One Antipsychotic Medication
0 5 10 15 20 25
2015
Percentage of Residents (%)

A-28
Anti-anxiety Medications
Anxiety is a general term that covers a number of psychiatric disorders,
including generalized anxiety disorder, panic disorder, obsessive-convulsive
disorder, and post-traumatic stress disorder. An estimated 15.3 percent of
adults over 60 have been diagnosed with an anxiety disorder, with women
more likely to be affected than men (Tampi R., et al., Anxiety Disorders in
Late Life: A Comprehensive Review. 2014).
Findings
● Residents were more likely to be diagnosed with an anxiety disorder than
in previous years.28
● Residents diagnosed with an anxiety disorder were more likely to have
on-going assessments (at least every two weeks) to evaluate the goals of
therapy.29
Table 22. Percent of Residents with an Anxiety Disorder and On-going Assessment
Residents diagnosed with
an anxiety disorder
Residents with an anxiety disorder
and on-going assessment to evaluate
the goals of therapy
2005 12% 22%
2006 7% 7%
2007 7% 22%
2008 16% 45%
2009 16% 48%
2010 21% 45%
2013 27% 53%
28 Statistically significant linear trend at p <0.1. 29 Statistically significant linear trend at p <0.1.

A-29
Residents diagnosed with
an anxiety disorder
Residents with an anxiety disorder
and on-going assessment to evaluate
the goals of therapy
2015 33% 70%
Figure 22. Percent of Residents with an Anxiety Disorder and On-going
Assessment
0 15 30 45 60 75
2015
2013
2010
2009
2008
2007
2006
2005
Percentage of Residents (%)
Diagnosedwith ananxietydisorder
On-goingassessment toevaluategoals oftherapy
Medications are often prescribed in the treatment of an anxiety disorder, but
may not always be the best choice as the primary treatment for nursing
facility residents. These individuals tend to have multiple medical conditions
and receive a number of medications, increasing the potential for adverse
drug reactions. Non-pharmaceutical treatments, including psychotherapy,
have been found to be useful in treating anxiety disorders (National Institute
of Mental Health, Anxiety Disorders, 2016).
The percent of residents diagnosed with an anxiety disorder was based on
NFQR 2015 data, while the data on anti-anxiety medication usage was based
on information nursing facilities reported to CMS. The data, methodology,
and sample population were different for the percent diagnosed with an
anxiety disorder and those receiving anti-anxiety medications. Given the
different methodology and sampling techniques used by each, no inferences
should be drawn between Figures 22 and 23.

A-30
Findings
● The percent of residents with a diagnosed anxiety disorder and who
received anti-anxiety medications has increased over time.30
Table 23. Percent of Residents with Anxiety Disorders Receiving Anti-Anxiety
Medications
Residents with anxiety disorders receiving anti-anxiety
medications
2007 21%
2008 22%
2009 23%
2010 23%
2011 25%
2012 24%
2013 25%
2015 24%
30 Statistically significant linear trend at p <0.1.

A-31
Figure 23. Percent of Residents with Anxiety Disorders Receiving Anti-Anxiety
Medications
0 5 10 15 20 25 30
2015
2013
2012
2011
2010
2009
2008
2007
Percentage of Residents (%)
Sedative and Hypnotic Medications
While sleep needs remain constant in older adults, sleep patterns often
change with age. Those changes can result in trouble falling asleep, difficulty
remaining asleep, and frequent awakening during the night. A number of
factors can contribute to sleep disturbances, including pain, depression,
dementia, certain medications, and stimulants such as caffeine (CDC, How
Much Sleep Do I Need? 2015).
Medications, particularly benzodiazepines, are often prescribed to treat
insomnia and other sleep disorders, but can have undesirable side effects
and increase the risk of falls and fractures in older adults. Sedatives and
hypnotics should be used only for short periods of time, and at lower doses
than those given to younger adults. Non-drug interventions should be
attempted first, including managing environmental and other factors that
could interfere with sleep (e.g., sleep hygiene).
Findings
● The percent of residents who reported trouble sleeping increased.31
● Residents were more likely to be evaluated for sleep hygiene.32
31 Statistically significant linear trend at p <0.1. 32 Statistically significant linear trend at p <0.1.

A-32
● Residents were more likely to have an active prescription for sleep
medication.33
Table 24. Percent of Residents with Sleep Problems, Assessments, and
Medications
2007 2008 2009 2010 2013 2015
Residents who reported
sleeping problems
5% 8% 8% 15% 9% 12%
Residents who were
evaluated for sleep
hygiene
2% 12% 12% 12% 24% 18%
Residents who had an
active prescription for
sleep medication
13% 15% 16% 19% 18% 22%
Figure 24. Percent of Residents with Sleep Problems, Assessments, and
Medications
0 5 10 15 20 25
2015
2013
2010
2009
2008
2007
Percentage of Residents (%)
Sleepproblemsreported
Evaluatedfor sleephygiene
Activeprescriptionfor sleepmedication
Restraints
Physical restraints are any device or practice that restricts a resident’s
freedom of movement or prevents the resident from accessing any part of
his or her body, which the resident cannot easily remove without assistance. 33 Statistically significant linear trend at p <0.1.

A-33
This includes devices such as a seat belt or other waist restraints, a tray
table attached to a wheelchair, wrist restraints or hand mitts, and bed rails.
Chemical restraints are psychoactive medications used to manage behavioral
symptoms distressing to the resident, other residents, or facility staff
without addressing the underlying cause of the behavior (CMS, State
Operations Manual, 2016).
Findings
● Residents were less likely to be restrained than in previous years.34
Table 25. Percent of Residents Restrained in Any Manner
2008 2009 2010 2013 2015
Residents who were restrained in
any manner
29% 26% 41% 27% 7%
Figure 25. Percent of Residents Restrained in Any Manner
0 5 10 15 20 25 30 35 40 45
2015
2013
2010
2009
2008
Percentage of Residents (%)
Physical restraints were the most common form of restraint identified in
2015, and bed rails were the most frequently used physical restraint. The
reasons documented most often for use of physical restraints included fall
prevention, positioning issues, and to prevent self-transfers from a bed or
chair.
34 Statistically significant linear trend at p <0.1

A-34
Research shows restraints do not prevent falls and residents are more likely
to be seriously injured if they fall while restrained. Other, more appropriate
interventions are available to manage these issues. A number of poor
outcomes have been linked to the use of physical restraints, including
depression, agitation, incontinence, pressure ulcers, and even death.
Findings
● The percent of residents with full bedrails decreased when compared to
previous years.35
● Other types of bedrails (i.e., partial bedrails) were used more frequently
than in previous years.36
● Trunk restraints were used more frequently than in previous years.
● Residents were less likely to be placed in a chair that prevented rising.37
Table 26. Percent of Physical Restraint Use by Device Type
2008 2009 2010 2013 2015
Of residents with a physical
restraint, those with full bed rails
58% 51% 46% 27% 11%
Of residents with a physical
restraint, those with other types
of bedrails
32% 39% 48% 60% 73%
Of residents with a physical
restraint, those with trunk
restraints
3% 5% 4% 2% 6%
Of residents with a physical
restraint, those with limb
restraints
1% <1% <1% <1% 1%
Of residents with a physical
restraint, those placed in a chair
that prevents rising
18% 9% 10% 8% 9%
35 Statistically significant linear trend at p <0.1. 36 Statistically significant linear trend at p <0.1. 37 Statistically significant linear trend at p <0.1.

A-35
Figure 26. Percent of Physical Restraint Use by Device Type
0 15 30 45 60 75
2015
2013
2010
2009
2008
Percentage of Residents (%)
Fullbedrails
Otherbedrails
Trunkrestraint
Limbrestraint
Chairpreventsrising
Findings
● Residents were more likely to be restrained at the request of a family
member or guardian than in previous years.38
Table 27. Percent of Time Restraints were Initiated at the Request of a Family
Member or Guardian
2009 2010 2013 2015
Of residents who were restrained, those
who were restrained at the request of a
family member or responsible party
31% 25% 39% 41%
38 Statistically significant linear trend at p <0.1.

A-36
Figure 27. Percent of Time Restraints were Initiated at the Request of a Family
Member or Guardian
0 5 10 15 20 25 30 35 40 45
2015
2013
2010
2009
Percentage of Residents (%)
Urinary Continence
Urinary incontinence, or loss of bladder control, is estimated to affect
between 43 percent and 81 percent of all nursing facility residents.
Incontinence is not a normal part of the aging process, but is often related
to underlying issues including chronic medical conditions, dementia, and
functional or mobility impairments. Incontinence often plays a part in the
decision to pursue nursing facility placement and can increase the risk of
falls, fractures, and skin breakdown. Residents with incontinence are often
reluctant to participate in activities, leading to social isolation. Residents in
several studies have self-reported decreases in their quality of life due to
urinary incontinence, particularly in the areas of dignity, autonomy, and
mood (Kane R., Dongjuan X., Effect of Urinary Incontinence on Older
Nursing Home Residents’ Self-Reported Quality of Life, 2013).
Findings
● The percent of residents who were usually incontinent decreased in
2015.39
● Residents who were incontinent were more likely to have a continence
promotion plan in place, when compared to previous years.40
39 Statistically significant linear trend at p <0.1.

A-37
Table 28. Percent of Residents with Urinary Incontinence and Continence
Promotion Plans
2009 2010 2013 2015
Residents who were usually incontinent
of urine
64% 63% 66% 56%
Residents who were incontinent of urine
and had a continence promotion plan
16% 22% 19% 20%
Figure 28. Percent of Residents with Urinary Incontinence and Continence
Promotion Plans
0 15 30 45 60 75
2015
2013
2010
2009
Percentage of Residents (%)
Usuallyincontinentof urine
AnyContinencePromotionPlan
A continence promotion plan should be based on a thorough assessment of
the resident’s needs, identifying any reversible conditions and determining
the most appropriate type of plan and schedule for that individual.
Findings
● Continence promotion plans were more likely to be based on residents’
specific voiding patterns and needs than in previous years.41
40 Statistically significant linear trend at p <0.1. 41 Statistically significant linear trend at p <0.1.

A-38
Table 29. Percent of Continence Promotion Plans Based on Resident’s Voiding
Patterns and Needs
2009 2010 2013 2015
Residents with a continence promotion
plan based on their voiding patterns and
needs
77% 84% 75% 96%
Figure 29. Percent of Continence Promotion Plans Based on Resident's Voiding
Patterns and Needs
0 25 50 75 100
2015
2013
2010
2009
Percentage of Residents (%)
Quality of Life/Consumer Satisfaction
Quality of life is a subjective measurement of a resident’s experiences in the
nursing facility and his or her ability to enjoy the normal activities of life.
This includes the resident’s satisfaction with relationships, activities,
autonomy, privacy, and feelings of safety/security at the facility.
Information for this section was gathered through face-to-face interviews. If
the resident was unable to participate, a family member or guardian was
contacted to complete the questions regarding overall satisfaction with their
experience in the facility and the health care services received. If the
resident was unable to participate and the family member or guardian was
unavailable, the quality of life section of the survey was not completed.

A-39
Most of the residents (or family members/guardians) stated they were either
very satisfied, satisfied, or somewhat satisfied with their experience in the
facility, as well as the healthcare services they received.
Findings – Overall Satisfaction
The percent of residents (or family members/guardians) who expressed satisfaction with their experience in the nursing facility and the health
care services they received has remained relatively stable over time.
Table 30. Percent of Residents Satisfied with Experience in the Facility and
Healthcare Services Received
2008 2009 2010 2013 2015
Residents who expressed
satisfaction with their
experience in the facility
88% 88% 90% 88% 89%
Residents who expressed
satisfaction with the
healthcare services they
received in the facility
88% 89% 90% 90% 88%
Figure 30. Percent of Residents Satisfied with Experience in the Facility and
Healthcare Services Received
0 10 20 30 40 50 60 70 80 90
2015
2013
2010
2009
2008
Percentage of Residents (%)
Satisfaction withexperience inthe facility
Satisfaction withhealthcareservicesreceived

A-40
Findings – Addressing Concerns
Residents were asked about their ability to express concerns or grievances
to facility staff, and whether they had fears of retaliation if their concerns
were expressed. The answer options for these questions were simply “yes”
or “no.” While most of the residents stated they felt comfortable expressing
their concerns, there were some residents who stated they did not express
their concerns due to a fear of retaliation.
● The percent of residents who stated they had concerns the facility did not
address increased when compared to previous years.42
● The percent of residents who stated they had concerns they did not
express due to a fear of retaliation also increased.43
Table 31. Percent of Residents with Concerns Not Addressed, or Not Expressed
Due to Fear of Retaliation
2010 2013 2015
Residents who had concerns the facility did not
address
13% 15% 20%
Residents who had concerns they did not express
due to the fear of retaliation
4% 7% 8%
42 Statistically significant linear trend at p <0.1. 43 Statistically significant linear trend at p <0.1.

A-41
Figure 31. Percent of Residents with Concerns Not Addressed, or Not Expressed
Due to Fear of Retaliation
0 5 10 15 20 25
2015
2013
2010
Percentage of Residents (%)
Concerns thefacility did notaddress
Did notexpressconcerns dueto fear ofretaliation
For the other questions in the Quality of Life section, the residents had the
following answer options:
● Always
● Most of the time
● Sometimes
● Rarely
● Never
● No answer
For this report, “always,” “most of the time,” and “sometimes,” were
combined into a single response indicating satisfaction. The answer option
“most of the time” was new in 2015, therefore testing changes across time
for statistical significance was not conducted for those questions.
Findings – Food and Dining Services
The majority of the residents in the sample expressed satisfaction with the
food and dining services at the facility.
● Most of the residents stated they liked the food served at the facility.
● Residents were often able to get their favorite foods at the facility.
● Most of the residents stated they enjoyed mealtimes at the facility.

A-42
Table 32. Percent of Residents Satisfied with Food and Dining Services
2007 2008 2009 2010 2013 2015
Residents who liked the
food at the facility
78% 84% 85% 85% 83% 81%
Residents who stated
their favorite foods
were available
64% 67% 67% 71% 66% 70%
Residents who stated
they enjoyed
mealtimes
85% 87% 87% 89% 89% 86%
Figure 32. Percent of Residents Satisfied with Food and Dining Services
Findings – Activities
● The majority of residents interviewed stated they enjoyed the organized
activities offered at the facility.
● Most residents interviewed stated weekend activities (other than religious
activities) were available.
2015
2013
2010
2009
2008
2007
0 10 20 30 40 50 60 70 80 90Percentage of Residents (%)
Liked the food
Favorite foodswere available
Enjoyedmealtimes

A-43
Table 33. Percent of Residents Satisfied with Organized Activities
2007 2008 2009 2010 2013 2015
Residents who enjoyed
the organized activities
offered
66% 64% 62% 62% 63% 75%
Residents who stated
weekend activities
(other than religious
activities) were
available
37% 40% 44% 49% 52% 70%
Figure 33. Percent of Residents Satisfied with Organized Activities
0 10 20 30 40 50 60 70 80
2015
2013
2010
2009
2008
2007
Percentage of Residents (%)
Enjoyedorganizedactivities atthe facility
Weekendactivities(other thanreligiousactivities)were available
Findings – Access to Outdoor Spaces
Residents were asked whether they had access to outdoor spaces, and if
outdoor spaces were available, if they could go outside when they wished to.
● Most of the residents stated they had access to outdoor spaces.
● Residents were usually able to go outdoors when they wished to.
Table 34. Percent of Residents Satisfied with Access to and Ability to Use Outdoor
Spaces
2015
Residents who stated they had access to outdoor spaces at the facility 86%

A-44
2015
Residents who stated they could go outdoors when they wished to 86%
Figure 34. Percent of Residents Satisfied with Access to and Ability to Use Outdoor
Spaces
0
10
20
30
40
50
60
70
80
90
100
2015
Pe
rce
nta
ge o
f R
esi
de
nts
(%
)
Able to gooutdoors whenwants to
Access tooutdoor spacesavailable
Findings – Safety and Security
● Residents generally felt safe and secure at the facility, and also felt their
possessions were safe.
Table 35. Percent of Residents Satisfied with Safety of Self and Possessions
2007 2008 2009 2010 2013 2015
Residents who stated
they felt safe and
secure
94% 97% 98% 98% 97% 97%
Residents who stated
they felt their
possessions were safe
79% 89% 89% 92% 88% 88%

A-45
Figure 35. Percent of Residents Satisfied with Safety of Self and Possessions
0 10 20 30 40 50 60 70 80 90 100
2015
2013
2010
2009
2008
2007
Percentage of Residents (%)
Felt safe andsecure
Feltpossessionswere safe
Findings – Privacy, Dignity, and Respect
Residents generally stated they were called by their preferred name. People usually knocked and waited for an answer before entering their
room. Nearly all of the residents stated the staff members treated them with
respect. A few residents stated their mail was read by others without first asking
their permission.
Table 36. Percent of Residents Satisfied with Level of Privacy, Dignity, and Respect
2015
Residents who stated they were called by their preferred name 96%
Residents who stated people knocked first and waited for an answer
before entering their room
89%
Residents who stated staff members treated them with respect 98%
Residents who stated their mail was read before asking their permission 6%

A-46
Figure 36. Percent of Residents Satisfied with Level of Privacy, Dignity, and
Respect
0 10 20 30 40 50 60 70 80 90 100
2015
Percentage of Residents (%)
Called bypreferred name
Peopleknock/wait foran answer
Staff isrespectful
Mail readbefore askingpermission
Findings - Autonomy
Autonomy is an important dimension of person-centered care, with staff
respecting and supporting the residents’ choices about their daily schedules
and their care.
● Most residents could choose their daily schedule.
● Most residents could choose how and when to bathe.
● Most residents could choose the clothing they wanted to wear each day.
Table 37. Percent of Residents Satisfied with Autonomy
2015
Residents who stated they could choose their daily schedule 71%
Residents who stated they could choose how and when to bathe 64%
Residents who stated they could choose the clothing they wanted to wear
each day
91%

A-47
Figure 37. Percent of Residents Satisfied with Autonomy
0
10
20
30
40
50
60
70
80
90
100
2015
Pe
rce
nta
ge o
f R
esi
de
nts
(%
) Chooseclothing towear
Choosehow/whento bathe
Choose dailyschedule
Findings – Consistent Assignment
Residents were asked whether they had a favorite caregiver and, if so, were
they able to choose to have that caregiver take care of them. Residents were
also asked about consistent assignment of caregivers; in other words, did
the same caregiver take care of them most of the time?
Consistent assignment has been shown to improve the quality of care and
the quality of life for residents. When a caregiver is consistently assigned to
the same residents, he or she becomes familiar with each resident’s
preferences and routines, strengthening the relationship between the
resident and the caregiver (National Nursing Home Quality Improvement
Campaign, Consistent Assignment, 2016).
● Just over one-third of residents stated they had a favorite caregiver.
● Of those who had a favorite caregiver, less than half of residents were
able to choose to have that caregiver take care of them.
● A majority of residents stated they usually received assistance from the
same caregiver.
Table 38. Percent of Residents with Favorite Caregiver, Able to Choose a
Caregiver, and with Consistent Caregiver Assignment
2015
Residents who stated they had a favorite caregiver 35%

A-48
2015
Residents who stated they were able to have their favorite caregiver take
care of them
48%
Residents who stated they received assistance from the same caregiver
most days
65%
Figure 38. Percent of Residents with Favorite Caregiver, Able to Choose a
Caregiver, and with Consistent Caregiver Assignment
05
10152025303540455055606570
2015
Pe
rce
nta
ge o
f R
esi
de
nts
(%
)
Receivedassistancefrom samecaregiver mostdays
Able to havefavoritecaregiver takecare of them
Had a favoritecaregiver
Findings – Care Planning
A resident’s comprehensive care plan is developed by the interdisciplinary
team, and addresses his or her health care needs, as well as retained
abilities, preferences, and routines. The interdisciplinary team includes the
resident, and he or she has the right to be involved in care plan meetings. If
the resident is unable to participate, a family member (with the resident’s
permission) or legal representative may take part in planning the resident’s
care.
For the first time in 2015, residents in the sample were asked if they had
participated in their care plan meetings.
● Less than one-third of residents stated they had participated in care plan
meetings.

A-49
Table 39. Percent of Residents Who Participated in Care Plan Meetings
2015
Residents who stated they participated in care plan meetings 31%
Figure 39. Percent of Residents Who Participated in Care Plan Meetings
0 10 20 30 40
2015
Percentage of Residents (%)

A-50
References
AMDA-The Society for Post-Acute and Long-Term Care Medicine. Choosing
Wisely: Don’t Use Sliding Scale Insulin for Long-Term Diabetes Management
for Individuals Residing in Nursing Homes, 2013.
http://www.choosingwisely.org/clinician-lists/amda-sliding-scale-insulin-for-
long-term-diabetes-management/
AMDA-The Society for Post-Acute and Long-Term Care Medicine. Top10
Particularly Dangerous Drug Interactions in PA/LTC.
http://www.paltc.org/top-10-particularly-dangerous-drug-interactions-paltc
American Diabetes Association. Standards of Medical Care – 2016. Diabetes
Care, 2016; 39 (suppl 1):S1-S112.
American Diabetes Association. The Staggering Costs of Diabetes in America,
2012. http://www.diabetes.org/diabetes-basics/statistics/infographics/adv-
staggering-cost-of-diabetes.html
Bergen G, Stevens M, Burns E. Falls and Fall Injuries Among Adults Aged
≥65 Years — United States, 2014. MMWR Morbidity and Mortality Weekly
Report 2016; 65:993–998.
http://www.cdc.gov/mmwr/volumes/65/wr/mm6537a2.htm
Centers for Disease Control and Prevention. 2016 Recommended
Immunizations for Adults: By Age. Atlanta, GA. 2016.
http://www.cdc.gov/vaccines/schedules/downloads/adult/adult-schedule-
easy-read.pdf
Centers for Disease Control and Prevention. Antibiotic/Antimicrobial
Resistance. Atlanta, GA. https://www.cdc.gov/drugresistance/
Centers for Disease Control and Prevention. Diabetes at a Glance. Atlanta,
GA. 2016.
https://www.cdc.gov/chronicdisease/resources/publications/aag/diabetes.ht
m
Centers for Disease Control and Prevention. Epidemiology and Prevention of
Vaccine-Preventable Diseases, 13th Edition. Atlanta, GA. 2015.
http://www.cdc.gov/vaccines/pubs/pinkbook/index.html
http://www.diabetes.org/diabetes-basics/statistics/infographics/adv-staggering-cost-of-diabetes.html

A-51
Centers for Disease Control and Prevention. How Much Sleep Do I Need?
Atlanta GA. http://www.cdc.gov/sleep/about_sleep/how_much_sleep.html
Centers for Disease Control and Prevention. Nursing Homes and Assisted
Living (Long-term Care Facilities [LTCFs]). Atlanta, GA.
http://www.cdc.gov/longtermcare/
Centers for Medicare & Medicaid Services. National Partnership to Improve
Dementia Care in Nursing Homes. Baltimore, MD.
https://www.cms.gov/Medicare/Provider-Enrollment-and-
Certification/SurveyCertificationGenInfo/National-Partnership-to-Improve-
Dementia-Care-in-Nursing-Homes.html
Centers for Medicare & Medicaid Services. National Health Expenditure Data:
Health Expenditures by Age and Gender, 2012. Baltimore, MD.
https://www.cms.gov/Research-Statistics-Data-and-Systems/Statistics-
Trends-and-Reports/NationalHealthExpendData/Age-and-Gender.html
Centers for Medicare & Medicaid Services. State Operations Manual.
Baltimore, MD. https://www.cms.gov/Regulations-and-
Guidance/Guidance/Manuals/Downloads/som107c02.pdf
Harris-Kojetin L, Sengupta M, Park-Lee E, Valverde R. Long-term care
services in the United States: 2013 overview. Hyattsville, MD: National
Center for Health Statistics. 2013.
Kane RL, Dongjuan X, Effect of Urinary Incontinence on Older Nursing Home
Residents’ Self-Reported Quality of Life. Journal of the American Geriatrics
Society. 2013 Sept; 61(9): 1473-1481.
National Institute of Mental Health. Anxiety Disorders. Bethesda, MD.
http://www.nimh.nih.gov/health/topics/anxiety-disorders/index.shtml
National Nursing Home Quality Improvement Campaign. Consistent
Assignment. https://www.nhqualitycampaign.org/goalDetail.aspx?g=ca
National Pressure Ulcer Advisory Panel. Pressure Injury Stages, 2016.
http://www.npuap.org/resources/educational-and-clinical-resources/npuap-
pressure-injury-stages/

A-52
Patel KV, Guralnik JM, et al. Prevalence and Impact of Pain Among Older
Adults in the United States: Findings from the 2011 National Health and
Aging Trends Study. Pain. 2013 Dec; 154(12): 2649-57.
Schnell S, Friedman SM, et al. The 1-Year Mortality of Patients Treated in a
Hip Fracture Program for Elders. Geriatric Orthopaedic Surgery &
Rehabilitation. 2010 Sept; 1(1): 6-14.
Tampi R, Tampi D. Anxiety Disorders in Late Life: A Comprehensive Review.
Healthy Aging Research. 2014 Dec; 3:14.
Texas Health and Human Services Commission, Quality Monitoring Program.
Healthy Hydration. https://hhs.texas.gov/doing-business-hhs/provider-
portals/long-term-care-providers/nursing-facilities-nf/quality-monitoring-
program-qmp/healthy-hydration
Texas Health and Human Service Commission, Quality Monitoring Program.
Healthy Weight Management. https://hhs.texas.gov/doing-business-
hhs/provider-portals/long-term-care-providers/nursing-facilities-nf/quality-
monitoring-program-qmp/healthy-weight-management