Nursery Cost & Profit Estimator - University of Arizona introduce you to the Nursery Cost & Profit...
29
Nursery Cost & Profit Estimator Introductory Presentation
Transcript of Nursery Cost & Profit Estimator - University of Arizona introduce you to the Nursery Cost & Profit...
Nursery Cost & Profit Estimator
Introductory Presentation

The purpose of this presentation is to introduce you to the Nursery Cost
& Profit Estimator by giving you a brief overview of what the
spreadsheet does.
The underlying idea of this spreadsheet:Think of your operation as a hotel for plants
where you have a number of identical rooms. The amount a guest is charged depends on how many rooms are used, and for how long the guest stays.
Similarly, what a plant costs depends on the square footage occupied and the number of weeks that space is used.

Let’s start with a preview of where we will end up, with the sheet “Plant Profit Summary”

This sheet summarizes all the results of the template.
The first part lists (1) each product. You enter (2) the expected sales price. (3) is the cost estimated by the spreadsheet, and (4) is the expected profit for each product.
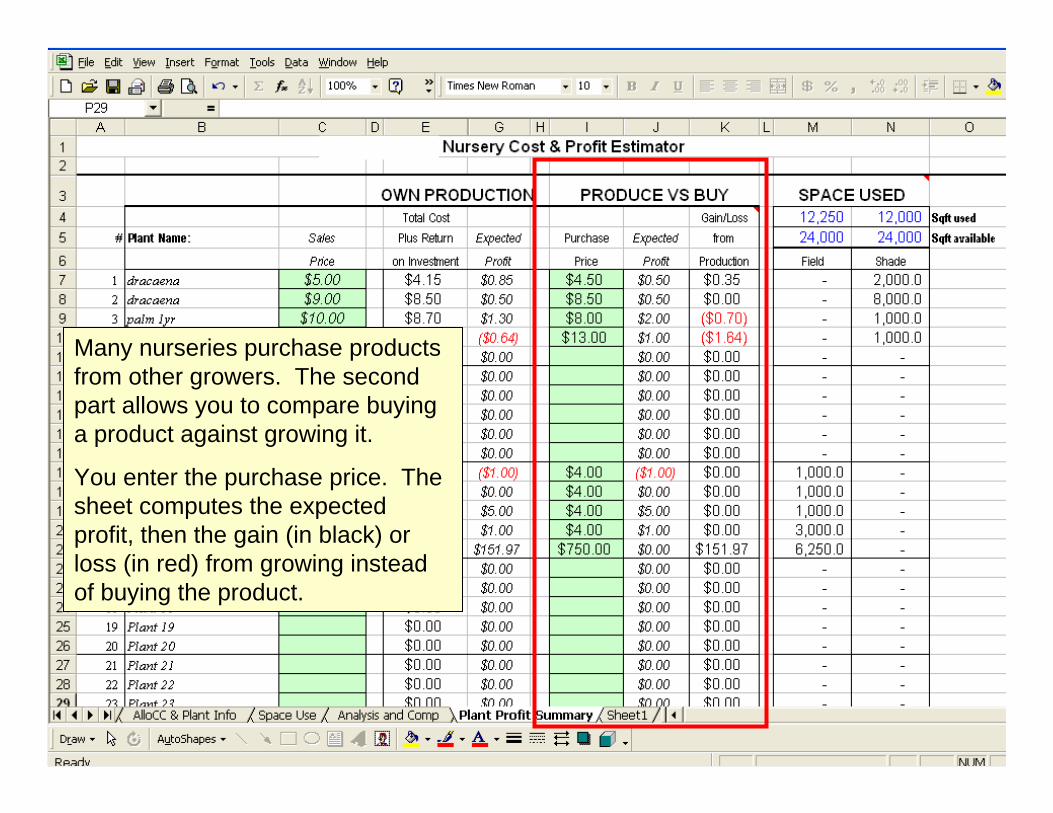
Many nurseries purchase products from other growers. The second part allows you to compare buying a product against growing it.
You enter the purchase price. The sheet computes the expected profit, then the gain (in black) or loss (in red) from growing instead of buying the product.

Finally, the summary provides information on the space used by each product and in total.

The following information is needed to use the spreadsheet
First, a map or diagram of your operation, showing all your production areas.
Second, your Federal Schedule F or other tax form that shows your expenses.
Finally, your knowledge and/or any production records for specific products.
As with any other spreadsheet, the accuracy of the results will depend on the accuracy of the data going in. So if you use ballpark figures, you should treat results as ballpark figures even if the spreadsheet makes the numbers look very precise.
Let’s move now to the Production Space page.
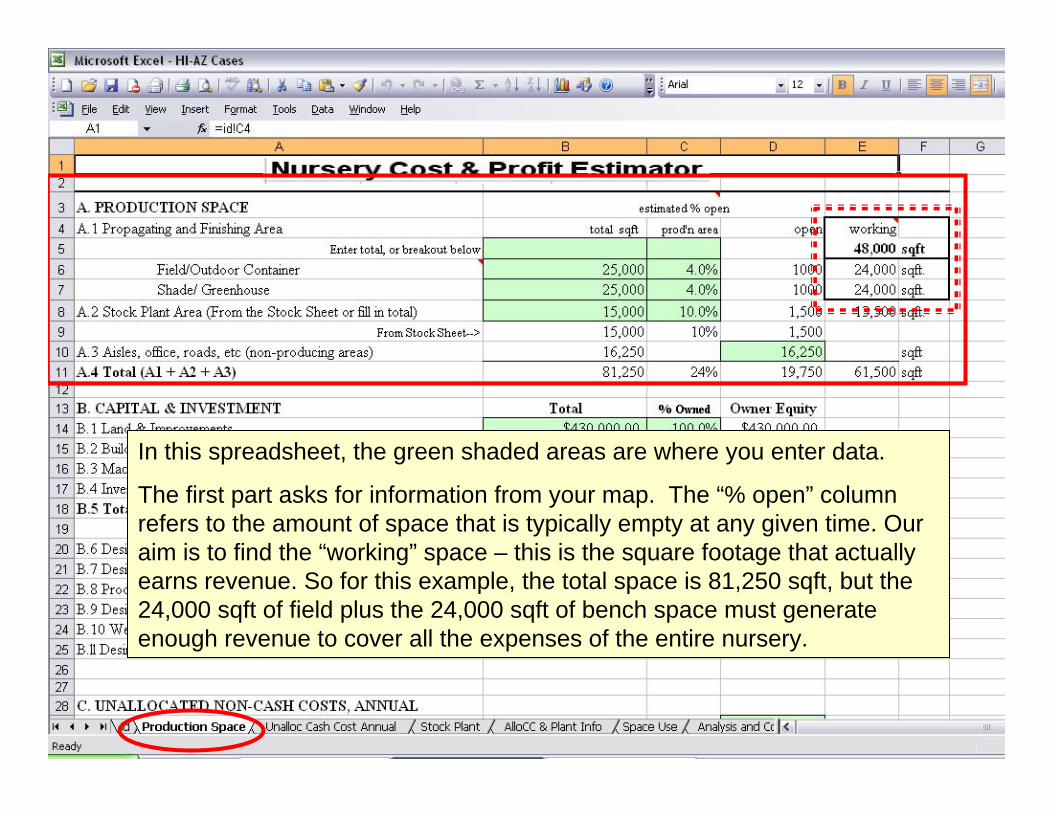
In this spreadsheet, the green shaded areas are where you enter data.
The first part asks for information from your map. The “% open” column refers to the amount of space that is typically empty at any given time. Our aim is to find the “working” space – this is the square footage that actually earns revenue. So for this example, the total space is 81,250 sqft, but the 24,000 sqft of field plus the 24,000 sqft of bench space must generate enough revenue to cover all the expenses of the entire nursery.

Area B is concerned with the money you have invested in the operation. It lists the assets of the nursery and asks for the percentage of owners’ equity (as opposed to borrowed money).
In our example, the owners have a total of $480 thousand tied up in the business.
If that money was invested somewhere else, the owners expect to earn 10%, or $48,000 per year. This is $1 per working square foot every year, or 1.92¢ from each sqft every week. We set this information aside for now.
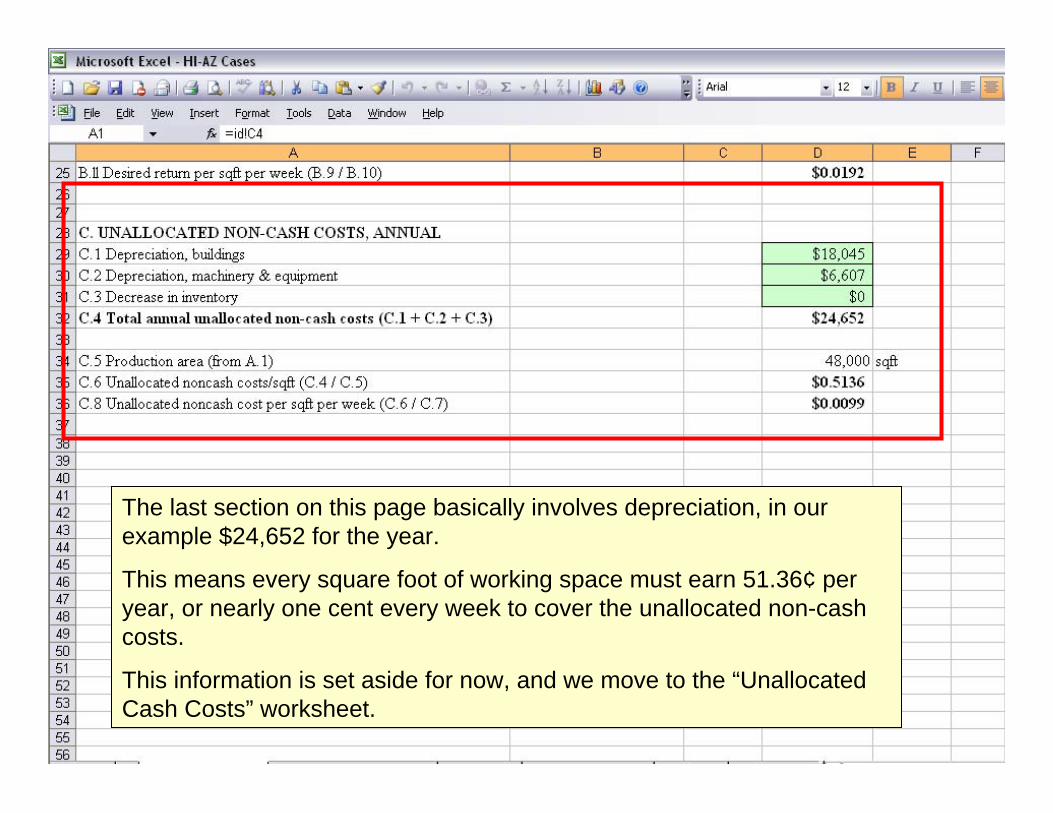
The last section on this page basically involves depreciation, in our example $24,652 for the year.
This means every square foot of working space must earn 51.36¢ per year, or nearly one cent every week to cover the unallocated non-cash costs.
This information is set aside for now, and we move to the “Unallocated Cash Costs” worksheet.

Unallocated cash costs are out-of-pocket expenses that we cannot tie to a specific product. For example, we typically would not know how much of the manager’s time or the electricity bill went into producing the petunias. We may have, however, an idea of the split between field and shade house.
In the example, we see how labor for this operation was divided. If we did not know, the total would go under “Other” and the program would split it according to the space available for each production area and calculate subtotals. The $1,000 under Other is an example that was split $500:$500. The italics means the $1,000 subtotal is for information only.
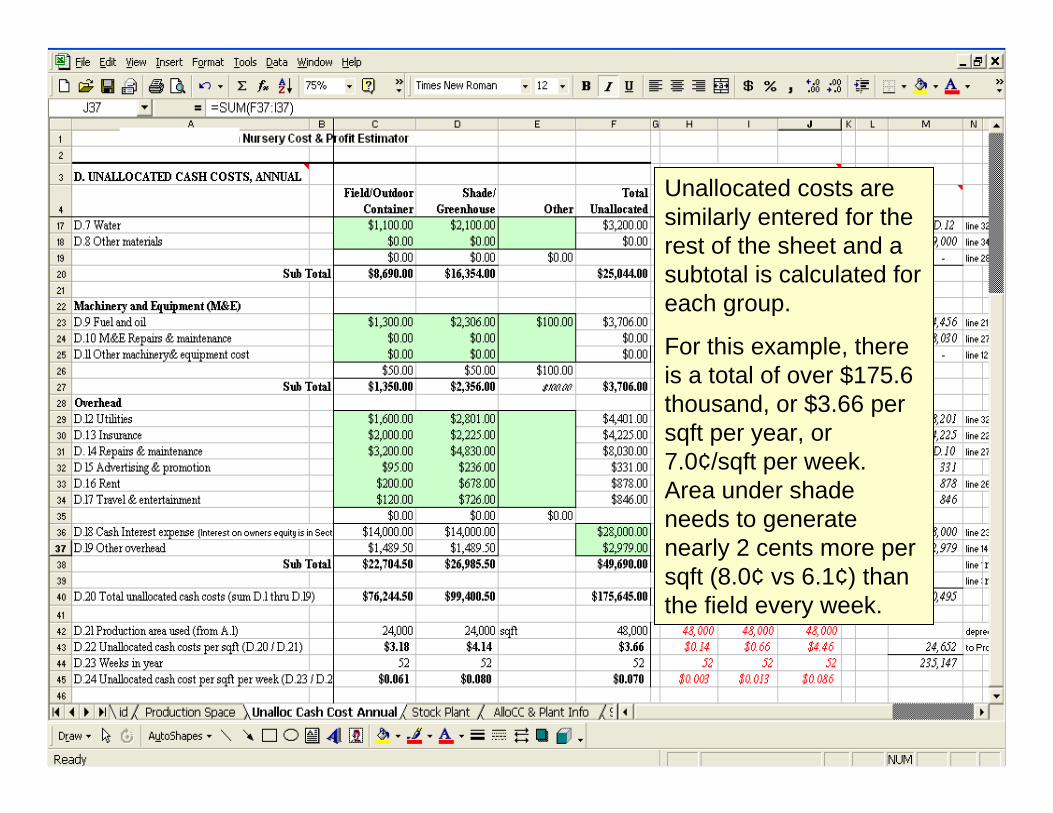
Unallocated costs are similarly entered for the rest of the sheet and a subtotal is calculated for each group.
For this example, there is a total of over $175.6 thousand, or $3.66 per sqft per year, or 7.0¢/sqft per week. Area under shade needs to generate nearly 2 cents more per sqft (8.0¢ vs 6.1¢) than the field every week.

As a side note, the section in red summarizes cost information that eventually will be entered in all the sheets.
One problem that might occur is double counting. The “Grand Total” is a check to see that the information entered is not more than what shows up on your Schedule F.
Using that Grand Total...

from Schedule FGrand TotalUsing that Grand Total, you can compare it to
information from your Schedule F to check for double counting, or for items that might
have been missed.
For the next worksheet, we take a detour to look at stock plants and estimate the costs of producing our own stock such as cuttings or buds.
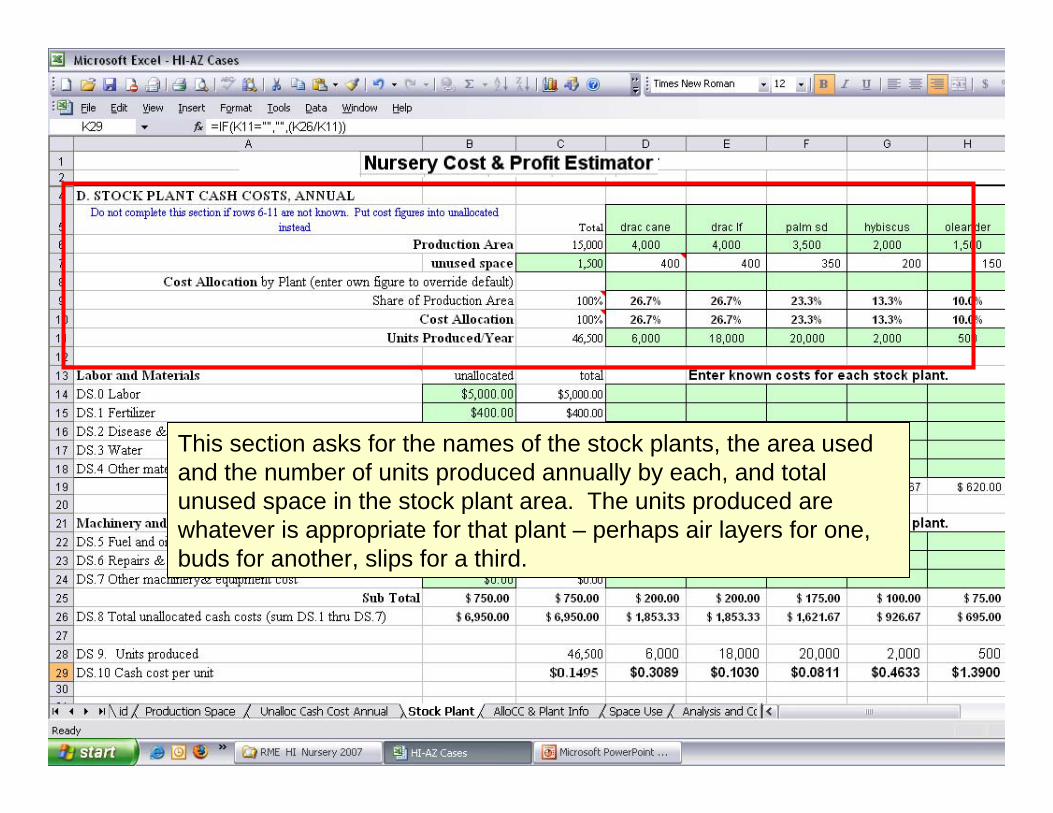
This section asks for the names of the stock plants, the area used and the number of units produced annually by each, and total unused space in the stock plant area. The units produced are whatever is appropriate for that plant – perhaps air layers for one, buds for another, slips for a third.

If the costs are known for each plant, they can be entered in their respective columns. Otherwise the totals for all the stock plants are entered in the “unallocated” column. The spreadsheet then divides the subtotals according to how much area is used by each plant.
At the bottom, the total for each stock plant is divided by the number of units to get the cost per unit. This can be used as the “stock cost” in the next worksheet on “Allocated Cash Cost (ACC) and Plant Info”

This section starts by asking for the product name, whether the product is grown in the field, then information on the area used.
The area information is entered for either container tight (pots are touching) or spaced out situations.
If container-tight, we enter the container length and width, or the diameter twice. If separated, enter the spacing dimensions.
The spreadsheet then calculates the area used by each container.
We then enter the weeks that the space is occupied and the number of times the crop is repeated over the year. Next is the number of containers in each batch or lot.

Using the space per container, number of containers, and weeks grown, the spreadsheet calculates the total production space used by each product and keeps a running total of the area used now and over the course of the year by all the products that were entered.
We will see this information again in the Space Use analysis.

Next, we enter information on the expected losses for each plant, either as a percentage or the actual number of units lost.
In our example for dracaena (plant 1), we estimate that we will not be able to sell 50 of the original 2000 containers. The spreadsheet calculates this as 2.5% of the original.

Finally, if we have the information, we enter the costs that can be allocated to each product.
In our example, we didn’t know labor for Plant 1 so left it blank, the containers cost $1,500 or 75¢ per unit, stock totaled $620 or about 31¢ per unit, and so on. The computer also keeps a running total for all the products.
The bottom (in blue) is a calculator that will compute the total cost for when we have the per unit cost. It also give a preview of the total cost for the plant.
Once we are done, we can move to the Space Use worksheet.

This worksheet compares our estimated percentage of open space against the percentage calculated from the data we entered in the Allocated Cash Costs sheet. If the figures do not agree, our cost estimates will be inaccurate. In the example here, over half the bench space is unused so our actual costs will be much higher than estimated – each working sqft must earn more to make up for the idle space.
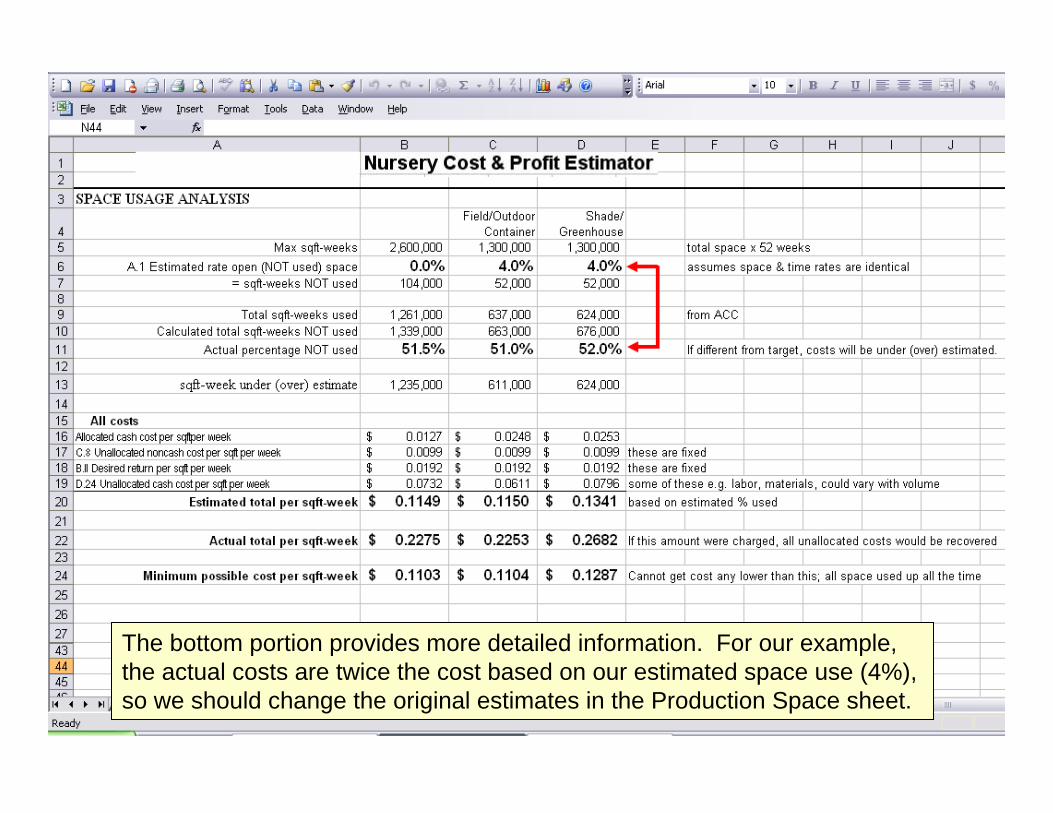
The bottom portion provides more detailed information. For our example, the actual costs are twice the cost based on our estimated space use (4%), so we should change the original estimates in the Production Space sheet.

The Analysis sheet summarizes all the information and calculations in the preceding worksheets to get the total cost per unit for each plant.
At the very bottom, the worksheet calculates the expected profitfor the sales price that was entered in Plant Profit Summary.

For our example, the cash costs for dracaena add up to $3.67 per plant.
We then add the 12.8¢ for unallocated non-cash costs, then the return on investment and cost of plant losses to get a grand total for dracaena of $4.15 per plant.
At a sales price of $5.00, we expect to make $0.85 per plant.
The last three lines are presented in a more compact form in the next worksheet.

In the Plant Profit Summary worksheet we end up where we started. This sheet presents the bottom-line information in a format for easy comparison, and allows the produce vs buy as well as space used analyses discussed previously.

This concludes our overview. The nursery cost estimator is a joint effort between the University of Hawaii and The University of Arizona. If you are interested in obtaining a copy of the software with the users guide, please contact your CES agent or any of the persons to the left.
Acknowledgements
This research supported in part by funding from
USDA-Risk Management Agency and
Hawaii State Agribusiness Development Corporation