Numerical study on a hybrid mooring system with clump ... · PDF fileNumerical study on a...
24
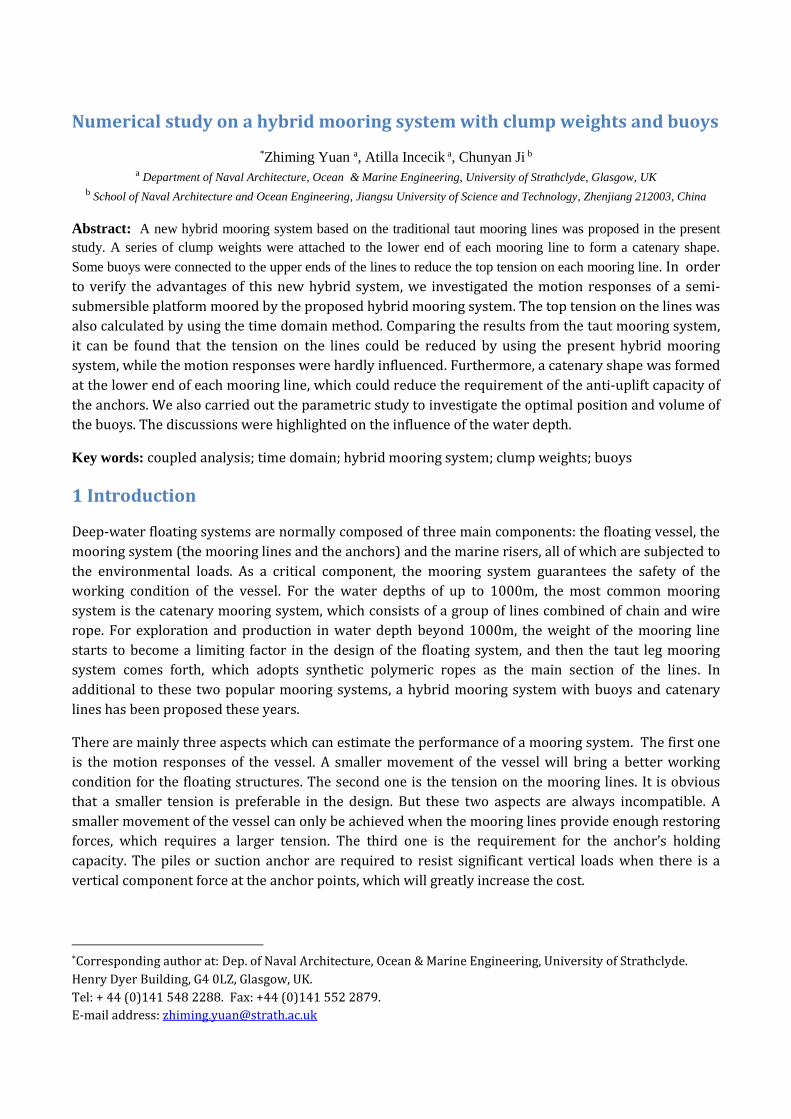
Numerical study on a hybrid mooring system with clump weights and buoys * Zhiming Yuan a , Atilla Incecik a , Chunyan Ji b a Department of Naval Architecture, Ocean & Marine Engineering, University of Strathclyde, Glasgow, UK b School of Naval Architecture and Ocean Engineering, Jiangsu University of Science and Technology, Zhenjiang 212003, China Abstract: A new hybrid mooring system based on the traditional taut mooring lines was proposed in the present study. A series of clump weights were attached to the lower end of each mooring line to form a catenary shape. Some buoys were connected to the upper ends of the lines to reduce the top tension on each mooring line. In order to verify the advantages of this new hybrid system, we investigated the motion responses of a semi- submersible platform moored by the proposed hybrid mooring system. The top tension on the lines was also calculated by using the time domain method. Comparing the results from the taut mooring system, it can be found that the tension on the lines could be reduced by using the present hybrid mooring system, while the motion responses were hardly influenced. Furthermore, a catenary shape was formed at the lower end of each mooring line, which could reduce the requirement of the anti-uplift capacity of the anchors. We also carried out the parametric study to investigate the optimal position and volume of the buoys. The discussions were highlighted on the influence of the water depth. Key words: coupled analysis; time domain; hybrid mooring system; clump weights; buoys 1 Introduction Deep-water floating systems are normally composed of three main components: the floating vessel, the mooring system (the mooring lines and the anchors) and the marine risers, all of which are subjected to the environmental loads. As a critical component, the mooring system guarantees the safety of the working condition of the vessel. For the water depths of up to 1000m, the most common mooring system is the catenary mooring system, which consists of a group of lines combined of chain and wire rope. For exploration and production in water depth beyond 1000m, the weight of the mooring line starts to become a limiting factor in the design of the floating system, and then the taut leg mooring system comes forth, which adopts synthetic polymeric ropes as the main section of the lines. In additional to these two popular mooring systems, a hybrid mooring system with buoys and catenary lines has been proposed these years. There are mainly three aspects which can estimate the performance of a mooring system. The first one is the motion responses of the vessel. A smaller movement of the vessel will bring a better working condition for the floating structures. The second one is the tension on the mooring lines. It is obvious that a smaller tension is preferable in the design. But these two aspects are always incompatible. A smaller movement of the vessel can only be achieved when the mooring lines provide enough restoring forces, which requires a larger tension. The third one is the requirement for the anchor’s holding capacity. The piles or suction anchor are required to resist significant vertical loads when there is a vertical component force at the anchor points, which will greatly increase the cost. * Corresponding author at: Dep. of Naval Architecture, Ocean & Marine Engineering, University of Strathclyde. Henry Dyer Building, G4 0LZ, Glasgow, UK. Tel: + 44 (0)141 548 2288. Fax: +44 (0)141 552 2879. E-mail address: [email protected]
Transcript of Numerical study on a hybrid mooring system with clump ... · PDF fileNumerical study on a...
Numerical study on a hybrid mooring system with clump weights and buoys
*Zhiming Yuan a, Atilla Incecik a, Chunyan Ji b
a Department of Naval Architecture, Ocean & Marine Engineering, University of Strathclyde, Glasgow, UK
b School of Naval Architecture and Ocean Engineering, Jiangsu University of Science and Technology, Zhenjiang 212003, China
Abstract: A new hybrid mooring system based on the traditional taut mooring lines was proposed in the present
study. A series of clump weights were attached to the lower end of each mooring line to form a catenary shape.
Some buoys were connected to the upper ends of the lines to reduce the top tension on each mooring line. In order
to verify the advantages of this new hybrid system, we investigated the motion responses of a semi-
submersible platform moored by the proposed hybrid mooring system. The top tension on the lines was
also calculated by using the time domain method. Comparing the results from the taut mooring system,
it can be found that the tension on the lines could be reduced by using the present hybrid mooring
system, while the motion responses were hardly influenced. Furthermore, a catenary shape was formed
at the lower end of each mooring line, which could reduce the requirement of the anti-uplift capacity of
the anchors. We also carried out the parametric study to investigate the optimal position and volume of
the buoys. The discussions were highlighted on the influence of the water depth.
Key words: coupled analysis; time domain; hybrid mooring system; clump weights; buoys
1 Introduction
Deep-water floating systems are normally composed of three main components: the floating vessel, the
mooring system (the mooring lines and the anchors) and the marine risers, all of which are subjected to
the environmental loads. As a critical component, the mooring system guarantees the safety of the
working condition of the vessel. For the water depths of up to 1000m, the most common mooring
system is the catenary mooring system, which consists of a group of lines combined of chain and wire
rope. For exploration and production in water depth beyond 1000m, the weight of the mooring line
starts to become a limiting factor in the design of the floating system, and then the taut leg mooring
system comes forth, which adopts synthetic polymeric ropes as the main section of the lines. In
additional to these two popular mooring systems, a hybrid mooring system with buoys and catenary
lines has been proposed these years.
There are mainly three aspects which can estimate the performance of a mooring system. The first one
is the motion responses of the vessel. A smaller movement of the vessel will bring a better working
condition for the floating structures. The second one is the tension on the mooring lines. It is obvious
that a smaller tension is preferable in the design. But these two aspects are always incompatible. A
smaller movement of the vessel can only be achieved when the mooring lines provide enough restoring
forces, which requires a larger tension. The third one is the requirement for the anchor’s holding
capacity. The piles or suction anchor are required to resist significant vertical loads when there is a
vertical component force at the anchor points, which will greatly increase the cost.
*Corresponding author at: Dep. of Naval Architecture, Ocean & Marine Engineering, University of Strathclyde.
Henry Dyer Building, G4 0LZ, Glasgow, UK.
Tel: + 44 (0)141 548 2288. Fax: +44 (0)141 552 2879.
E-mail address: [email protected]
As for the catenary mooring system, the catenary chains or wires rely heavily on their own weight to
provide restoring forces. As a result, it will not only increase the production costs, but also bring an
increase to the top tension of the lines and enlarge the vertical loads on the vessel when the line is lifted
from the sea bottom (Johanning, et al., 2007). This growth in vertical load can be important as it
effectively decreases the vessel’s useful payload. The restoring forces provided by catenary chain are
not adequate to keep a small platform offset. However, the main advantage is that the anchors are only
subjected to the horizontal force component since the lower end of the mooring line is resting on the
seabed. As for the taut mooring system, the synthetic polymeric ropes can provide large restoring
forces through their axial stiffness, which can reduce mean- and low-frequency platform offsets and
improve the drilling condition. Meanwhile, the synthetic fibre lines are considerably light, very flexible
and can absorb imposed dynamic motions through extension without causing an excessive dynamic
tension. But the disadvantage is that the anchors need to handle a very large vertical.
The idea and application of the clump weights on the offshore mooring lines can be found in some
previous publications. Finn (1976) proposed a new deep water offshore platform which was called ‘the
guyed tower’, and the platform was held upright by multiple guy lines. Each line has three main
portions: (1) A catenary from the fairlead connection at the tower to the clump weight; (2) a clump
weight that is relatively massive compared with the cable; and (3) a line and an anchor pile to anchor
the line. The clump weight rests almost entirely on the sea bottom during relatively small tower
response. However, during the extreme sea state, the clump weights lift off the bottom to form part of
an extended catenary from anchor pile to the tower. Morrison and Asce (1983) carried out the analysis
for the dynamic properties of the guyed tower mooring lines. However, these researches are limited to
the water depth up to 1500ft. Some other component mooring lines with additional sinkers and buoys
are proposed recently. Smith and MacFarlane (2001) used catenary equations to solve a three
component mooring made up of two lines, connected at a point buoy or sinker where water depth and
fairlead tension were given. Vicente et al. (2011) investigated different mooring configurations with
slack chain mooring lines of a floating point absorber with or without additional sinkers or floaters. It
was found that the different arrangement of the buoys and weights would bring significant differences
in terms of average and maximum tensions on the mooring cables. Hong and Kim (2004) carried out an
experimental study for a compliant mooring system keeping a floating OWC device. The compliant buoy
mooring system consists of four mooring systems, each of which has a buoy connected to horizontal
and vertical mooring lines. However, this wave energy device was damaged by mooring line failure
during a severe storm. This study has been made to clarify the mechanism of mooring line failure for
future improvements in mooring line design.
Based on the guyed tower mooring lines, Ji et al. (2011) proposed a mooring system integrating
catenary with taut mooring for deep water platform. In their study, some clump weights were applied
to the lower end of the taut lines at fixed intervals, which could form a catenary end, tangent to the
seabed. In that way, the anchor points were only subjected to the horizontal forces. They carried out the
simulation for a semi-submersible. The results showed that the vessel’s offsets and the line’s tensions
could be greatly reduced when the new mooring system was used. Besides, a catenary shape was
formed at the lower end of the line, which lowered the requirement of the anti-uplift capacity of the
anchors. It is also demonstrated by Yuan et al. (2011) that this combined mooring system was
applicable for a wide range of water depth. But, as pointed by the author, the maximum tension of the
new mooring system turned out to be a little larger when the water depth exceeds 1000m.
In this paper, a new hybrid mooring system with the clump weights and buoys will be proposed. It is
based on the combined mooring system proposed by Ji et al. (2011). In the present work, some

improvements are made by attaching some buoys to the previous mooring lines. In this way, the top
tension on the lines could be reduced. Meanwhile, this new hybrid system is expected to keep the
merits of the previous one since the clump weights are retained.
2 Description of the new mooring system
The design of the present hybrid mooring lines is based on the traditional taut mooring lines. It can be
seen from Fig. 1 that the mooring lines are connected to the floating structures and go in a fairly straight
line to the bottom. This is only possible with light lines, therefore modern polyester lines are needed to
achieve this. These lines have a large axial resistance and good fatigue properties. When the platform
drifts horizontally with wind or current, the lines stretch and this sets up an opposing force. The lines
usually come in at a 30 to 45 degree angle on the seabed where they meet the anchor, which is loaded
vertically. Therefore, the suction piles must be used for deep water taut mooring lines to resist the
vertical forces. Suction piles can be used in sand, clay and mud soils, but not gravel, as water can flow
through the ground during installation, making suction difficult. And also suction piles are usually not
allowed to be applied in reefs for the environmental protection. Furthermore, the installation and
maintenance of the suction piles is very expensive.
In order to reduce the vertical component of the mooring force at the lower end of the mooring line, a
series of clump weights are attached at the lower end of each line, which is shown in Fig. 2. And a couple
of these mooring lines with clump weights can constitute a hybrid system, which can be called hybrid
mooring system with weights (HMSW). It can be seen from Fig. 2 that the weights are attached to the
lines at uniform intervals and the sizes of these weights decrease gradually from the sea bottom
upwards. Therefore, the lower end of each line is expected to behavior as a catenary if the weights are
arranged properly. When the lines are subjected to the maximum tension, it should be designed to fulfill
the following condition: the clump weight (m1 in Fig. 6) next to the anchor point should never be lifted
off from the sea floor. Thus, it can be guaranteed that there is no vertical force at the lower end of the
mooring line. When the tension decreases, the weights will be supported by the sea floor, thereby
lowering the tension at the fairlead. However, in the numerical simulation (Ji et al., 2011), the tensions
could be increased by the gravity of the weights. In order to lower the tension on the line, a buoy is
attached to each mooring line, shown in Fig. 3. A couple of mooring lines with weights and buoys
constitute a new hybrid system, which can be called hybrid mooring system with weights and buoys
(HMSWB). The buoyancy of these buoys will counteract some of the gravity, and as a result, the tension
on each mooring line can be reduced. The angle between the water line and the mooring line could also
be reduced consequently. Thus, the horizontal restoring force provided by the line can be increased
while the restoring forces in vertical direction will be reduced. Based on the same principle as the
HMSW, the proper arrangement of the weights in HMSWB should also guarantee a horizontal alignment
of the mooring line near the sea bed.
In engineering practice, the weights can be made from different materials with various shapes. The
typical weights should be steel cubes, which are connected to the mooring chain by shackles. Each
mooring line can be assembled onshore or on the board. Tugboats are in charge of towing the lines to
the designated points. The buoys are widely used in deep water risers, and the installation technology
could be similar. Compared to the suction piles, the manufacturing costs of the weights and buoys could
be much lower. The difficulties involved in the installation of the new mooring system are quite
different from the taut mooring system. The former rests with the towage of the lines to the designated
points, while the latter involves in a suction (relative to seabed water pressure), which is applied within
the pile and forces the pile to embed itself, leaving the top flush with the seabed. The scope of
application of the new hybrid mooring lines can be expanded to a wide range of seabed conditions,
including sand, clay and mud soils, but also gravel and reefs. Besides, the new mooring lines are easy to
recycle.
3 Formulations
The motion equation of the platform is combined with the mooring lines in the time domain as follows:
0
( ) fk d sd w c mM x R t xd Cx F F F F F F
(1)
In the left hand side of Eq. (1), M is the structure mass, μ is the infinite added mass, R(t-τ) is the
retardation function, C is the hydrostatic restoring coefficients. The added mass and radiation damping
can be obtained by solving boundary value problem (BVP) and the retardation function can be obtained
by inverse cosine Fourier transform of radiation damping. In the right hand side of Eq. (1), Ffk is the
Froude-Krylov force, Fd is the diffraction force, Fsd is the second-order wave load, Fw is the wind load, Fc
is the current load, Fm is transmitted force from the mooring line. The Froude-Krylov force and
diffraction force can be obtained by solving boundary value problem (BVP) in frequency domain with
the Fourier transformation. The second-order wave load is calculated by far field integration method in
frequency domain with the Fourier transformation. Only horizontal second-order wave forces are
calculated in the present study. The wave load is caused by average wind velocity and fluctuating wind
velocity. It can be expressed by
2w
w wF C A v (2)
where Cw is the wind force coefficient; Aw is projected area; v is the wind velocity. The time history of
fluctuating wind velocity can be calculated by wind spectrum with Fourier transformation. In the
present study, only horizontal wind loads (surge, sway and yaw) are calculated.
All body current forces are computed using the current velocity at the surface (z = 0). Traditionally, the
viscous surge and sway force and yaw moment have been calculated based on current coefficients and
the instantaneous magnitude of the translational relative velocity between the vessel and the fluid. The
current drag forces are then expressed by (SIMO, 2009):
2
1 2( , ) ( ) | | ( ) | |cF t C u C u (3)
2 2 2
1 1 2 2| | ( ) ( )u v x v x (4)
2 2
1 1
arctanv x
v x
(5)
where C1 and C2 are the linear and quadratic current force coefficients respectively; u is the relative
velocity between low-frequency body velocity and current velocity; α is the relative angle between
direction of low-frequency body velocity and current velocity; v1 and v2 are the longitudinal and
transverse components of current velocity respectively; 1x and 2x are the surge and sway velocity
respectively.
The present hybrid mooring lines are composed of four components: chain, polyester line, clump
weights and buoys. Since the chain and polyester line are slender structures, the wave forces on these
slender lines are calculated by using Morison’s equation. The inertia and drag forces are usually
computed separately for directions normal and tangential to the line, since the hydrodynamic
coefficients in the two directions are different in general. The drag force per unit length is calculated as:
21 1
2 2
D
dt t t dn nF DC v v DC v (6)
where ρ is water density; D is the diameter of the line; Cdt is the nondimensional quadratic tangential
drag force; Cdn is the nondimensional quadratic normal drag force; vt and vn are the tangential and
normal flow velocity respectively. The inertia force per unit length is likewise calculated as:
2 21 1
4 4
I
mt t mn nF D C v D C v (7)
where Cmt is the nondimensional quadratic tangential inertia force; Cmn is the nondimensional quadratic
normal inertia force; tv and nv are the tangential and normal flow acceleration respectively.
The clump weights and buoys are treated as special elements with different mechanical properties. The
loads on these elements are determined by their mass, volume and hydrodynamic coefficients. The drag
forces acting on a buoy (or clump weight) are calculated according to the following formulae (DeepC,
2010):
1
2
D
x x dx x xF B C v v (8)
1
2
D
y y dy y yF B C v v (9)
1
2
D
z z dz z zF B C v v (10)
where Bx, By and Bz are the projected area for flow in x, y and z direction individually; Cdx, Cdy and Cdz are
the corresponding nondimensional drag coefficients; vx, vy and vz are the flow velocity in x, y and z
direction. The inertia forces acting on a buoy (or clump weight) are likewise calculated as:
I
x ax xF VC v (11)
I
y ay yF VC v (12)
I
z az zF VC v (13)
where V is the volume of the clump weights (or buoys); Cax, Cay and Caz are the nondimensional inertia
coefficients in x, y and z direction; xv , yv and zv are the corresponding flow acceleration in x, y and z
direction.

4 Numerical study
4.1 Description of the platform
A typical semi-submersible (as shown in Fig. 4) in Gulf of Mexico is simulated to investigate the
effectiveness of the proposed hybrid mooring system in different water depths. The horizontal x-y plane
of the model is set on the base line with its origin placed on the center of the body, and z-axis is positive
upward. The main particulars of the platform are summarized in Table 1. For the loading condition of
the analysis, the 100-year extreme hurricane condition at GoM is used, which is one of the severest in
the world. The summary of the environmental condition for this study is shown in Table 2. In the time
domain analysis, the simulation duration of time is 600s with the time step of 0.2s. The ramp duration is
10s. Newmark integration procedure is applied with its integration operator β=0.25 and γ=0.5. The
viscous roll damping fixed at 1500000 kNs/m.
4.2 Description of the mooring lines
The semi-submersible platform is moored by three different mooring systems: taut mooring system
(TMS), hybrid mooring system with weights (HMSW) and hybrid mooring system with weights and
buoys (HMSWB). The latter two systems can be classified as the hybrid mooring system (HMS). The
only difference between TMS and HMS should be the weights and buoys as shown in Fig. 1-Fig. 3. Each
mooring system is composed of 12 hybrid mooring lines, which is shown in Fig. 5. Table 3 gives the
details of each mooring line. To compensate for the pretension from the risers and mooring lines, a
vertical force of magnitude 2233kN pointing upwards is specified at CG of the platform.
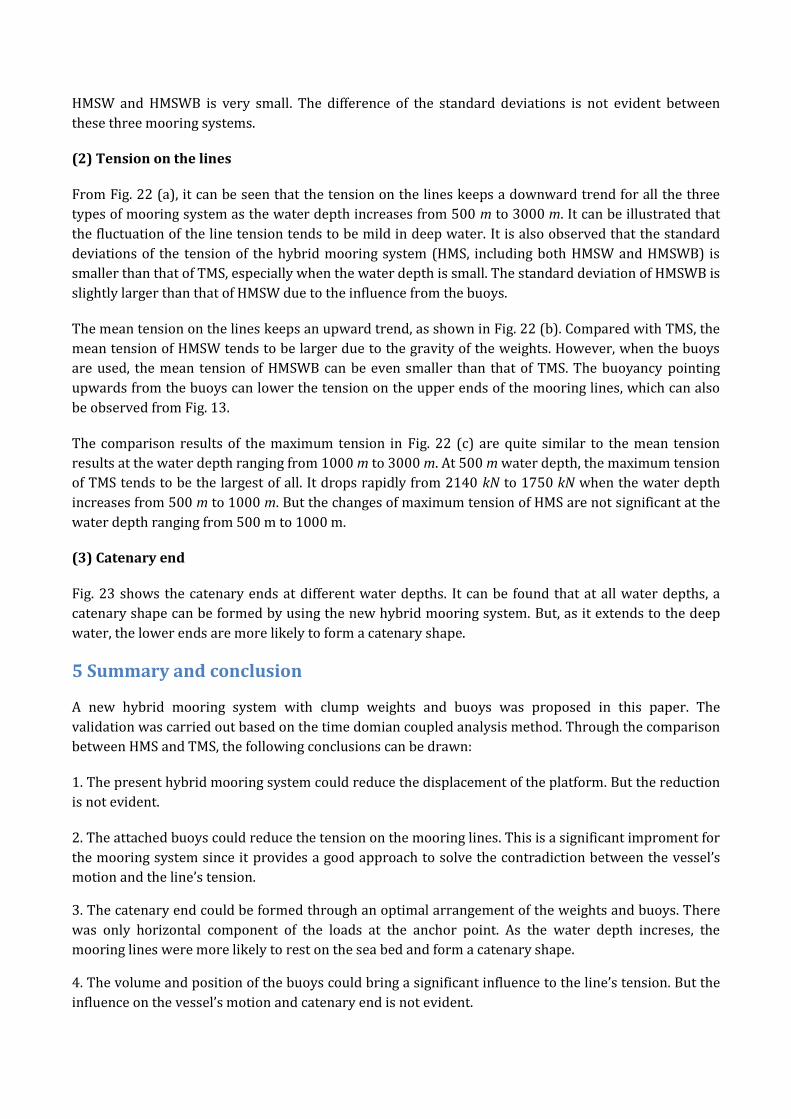
As for the hybrid mooring system, five weights are attached at the lower end of each mooring line with
a uniform spacing of 20 m (Fig. 6). The size of the weights decreases from the bottom upwards, where
m1=20 t, m2=15 t, m3=10 t, m4=5 t, m5=2 t. The buoys on each mooring line are designed to be sphere,
attached 152 m away from the fairleads. The mass of the buoy is 2 t. The volume is 18m3, and Cd=0.5,
Ca=0.1.
4.3 Motion responses of the platform
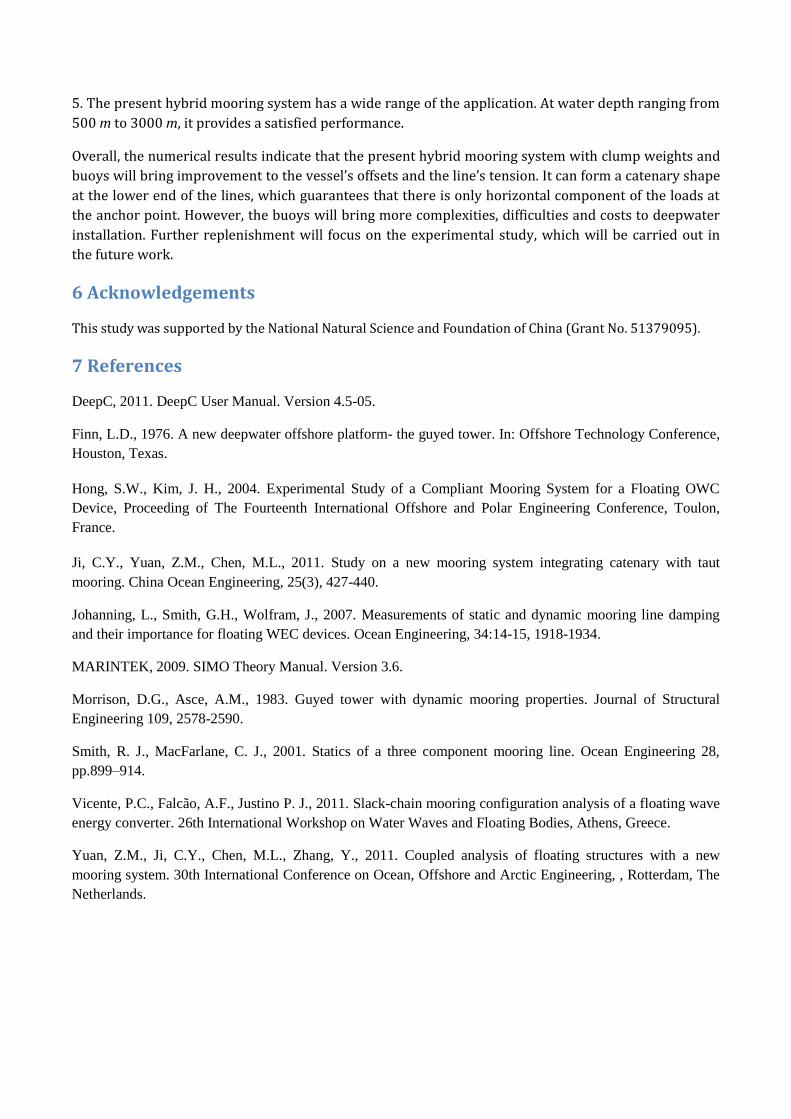
The time history of sway, heave and roll motions of the platform moored by TMS, HMSW and HMSWB is
shown in Fig. 7-Fig. 9. Table 4 gives the statistical variability of the standard deviations, the maximum
and mean values of the motion responses. It can be found that the standard deviations of the sway
response can be slightly reduced by using HMS (HMSW and HMSWB). The clump weights modify the
configuration of the mooring lines. The static equilibrium position will be changed consequently. That is
the reason for the large discrepancies of the maximum and mean values between TMS and HMS. For
heave and roll motions, the difference of standard deviations between TMS and HMS is not evident. But,
it can be observed that in heave motion, the mean value is slightly increased by using HMSW. This is
because the clump weights will enlarge the top tension of the lines (as shown in Fig. 13) and the draft of
the platform will be increased accordingly. But HMSWB can reduce the mean value of heave motion,
since the top tension of the lines can be reduced by the attached buoys. By using fast Fourier Transform
(FFT), the motion spectra of the platform can be obtained and plotted in Fig. 10-Fig. 12. The shapes of
the spectral are similar and the difference of peak values is very small. The sway, heave and roll
motions are dominated by wave frequency (WF) responses. Low frequency (LF) responses can also be
observed in sway and roll motions, but it is not significant.
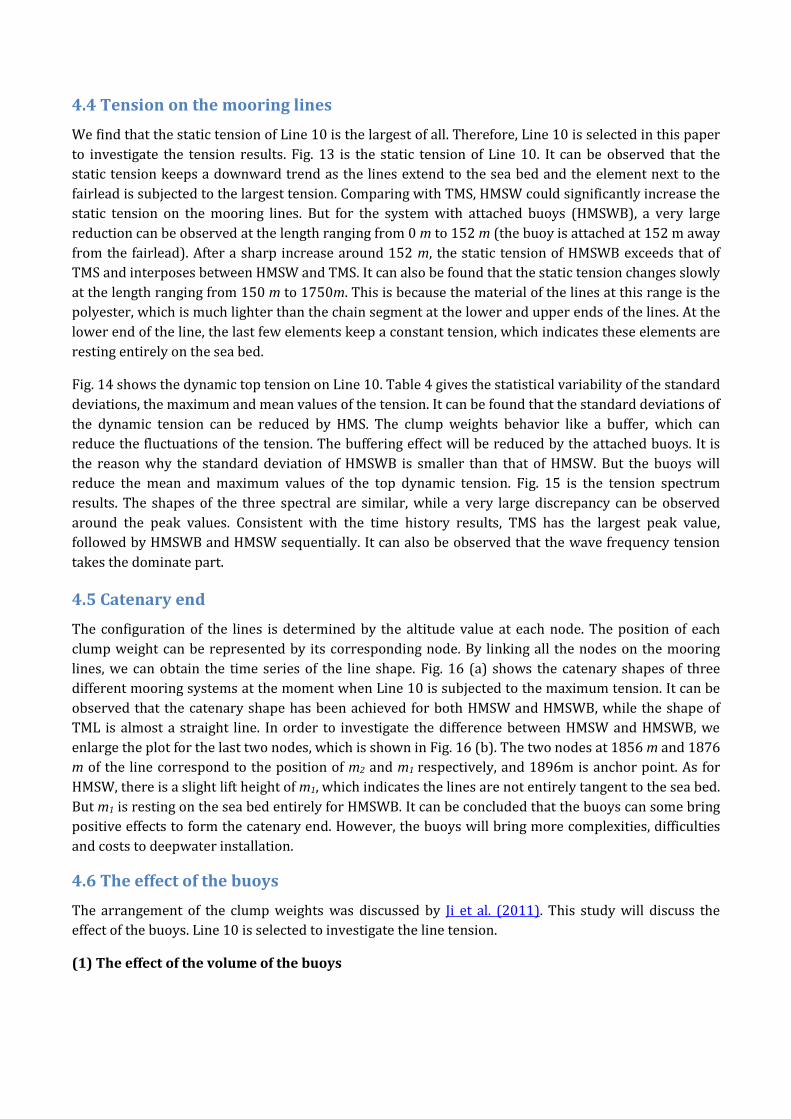
4.4 Tension on the mooring lines
We find that the static tension of Line 10 is the largest of all. Therefore, Line 10 is selected in this paper
to investigate the tension results. Fig. 13 is the static tension of Line 10. It can be observed that the
static tension keeps a downward trend as the lines extend to the sea bed and the element next to the
fairlead is subjected to the largest tension. Comparing with TMS, HMSW could significantly increase the
static tension on the mooring lines. But for the system with attached buoys (HMSWB), a very large
reduction can be observed at the length ranging from 0 m to 152 m (the buoy is attached at 152 m away
from the fairlead). After a sharp increase around 152 m, the static tension of HMSWB exceeds that of
TMS and interposes between HMSW and TMS. It can also be found that the static tension changes slowly
at the length ranging from 150 m to 1750m. This is because the material of the lines at this range is the
polyester, which is much lighter than the chain segment at the lower and upper ends of the lines. At the
lower end of the line, the last few elements keep a constant tension, which indicates these elements are
resting entirely on the sea bed.
Fig. 14 shows the dynamic top tension on Line 10. Table 4 gives the statistical variability of the standard
deviations, the maximum and mean values of the tension. It can be found that the standard deviations of
the dynamic tension can be reduced by HMS. The clump weights behavior like a buffer, which can
reduce the fluctuations of the tension. The buffering effect will be reduced by the attached buoys. It is
the reason why the standard deviation of HMSWB is smaller than that of HMSW. But the buoys will
reduce the mean and maximum values of the top dynamic tension. Fig. 15 is the tension spectrum
results. The shapes of the three spectral are similar, while a very large discrepancy can be observed
around the peak values. Consistent with the time history results, TMS has the largest peak value,
followed by HMSWB and HMSW sequentially. It can also be observed that the wave frequency tension
takes the dominate part.
4.5 Catenary end
The configuration of the lines is determined by the altitude value at each node. The position of each
clump weight can be represented by its corresponding node. By linking all the nodes on the mooring
lines, we can obtain the time series of the line shape. Fig. 16 (a) shows the catenary shapes of three
different mooring systems at the moment when Line 10 is subjected to the maximum tension. It can be
observed that the catenary shape has been achieved for both HMSW and HMSWB, while the shape of
TML is almost a straight line. In order to investigate the difference between HMSW and HMSWB, we
enlarge the plot for the last two nodes, which is shown in Fig. 16 (b). The two nodes at 1856 m and 1876
m of the line correspond to the position of m2 and m1 respectively, and 1896m is anchor point. As for
HMSW, there is a slight lift height of m1, which indicates the lines are not entirely tangent to the sea bed.
But m1 is resting on the sea bed entirely for HMSWB. It can be concluded that the buoys can some bring
positive effects to form the catenary end. However, the buoys will bring more complexities, difficulties
and costs to deepwater installation.
4.6 The effect of the buoys
The arrangement of the clump weights was discussed by Ji et al. (2011). This study will discuss the
effect of the buoys. Line 10 is selected to investigate the line tension.
(1) The effect of the volume of the buoys

The volume of the buoys will influence the motions of the platform and the tension on the lines. In this
paper, we make the optimal study over a wide range of the volumes (V=7m3, 12m3, 17m3, 22m3, 27m3,
32m3). The other parameters are kept unchanged.
The displacement in Fig. 17 indicates the offset ( 222 zyxD , x, y and z are the motion
responses in surge, sway and heave direction) of CG. It can be observed that the displacement changes
slowly as the buoy’s volume increases from 7 m3 to 22 m3. But a sharp increase of displacement can be
observed at the volume ranging from 22 m3 to 32 m3. To the contrary, the maximum tension on the lines
keeps a downward trend (as shown in Fig. 18). It drops rapidly as the volume of the buoy increases
from 7 m3 to 22 m3. The slope becomes very mild as the volume exceeds 22 m3. Table 6 shows the effect
of the volume on the hoisting height of m1 and m2 when the line is subjected to the maximum tension. As
the volume varies from 12 m3 to 22 m3, the hoisting height of m1 is 0, which indicates that m1 is entirely
resting on the sea bed. While in the other cases, there is a slight elevation of m1. The hoisting height of
m2 experiences a decrease until the buoy volume increases to 17 m3, and then the trend reverses. It can
be concluded that the optimal volume should locate among 7 m3 to 22 m3 in the present study.
(2) The effect of the buoy position
In order to explore the effect of the buoy’s position on the floating system, we make the parametric
study over a range of distances (d=30 m, 60 m, 90 m, 120 m, 152 m; where d is the distance between the
fairlead and the buoy). The volume of the buoys is fixed at 18 m3. Meanwhile, all the other parameters
keep unchanged.
The displacement in Table 7 indicates that there is only a very slight decrease of the displacement as the
distance increases from 30 m to 152 m. But the static tension on the lines will be greatly influenced by
the distance, as shown in Fig. 19. As the distance increases, the maximum static tension can be reduced
accordingly. The maximum static tension can be found at the node corresponding to the buoys as the
distance is smaller than 90 m. When the distance is greater than 90 m, the static tension at the fairlead
becomes the largest one. An optimal design should guarantee that the distribution of the tension on the
line is as equivalent as possible. Based on this principle, the distance in the present case study should be
greater than 90 m. Consistent with the static tension results, the maximum dynamic tension also keep a
downward trend as the as the distance increases from 30 m to 152 m, which can be observed from Fig.
20. Table 8 gives the hoisting height of m1 and m2 at different distance. We find m1 is resting on the sea
bed for all the distances we adopted in the present case study. However, the hoisting height of m2 keeps
a downward trend as the distance increases from 30 m to 152 m.
4.7 The effect of the water depths
In order to explore the application range of the proposed hybrid system, we make the comparison over
a range of water depths (h=500 m, 750 m, 1000 m, 1500 m, 2000 m, 3000 m; where h is the water
depth). All the parameters keep unchanged except the water depth and the line length shown in Table 9.
(1) Displacement of the platform
The statistical variability of the displacement is shown in Table 10 and Fig. 21. Overall, the trend of the
displacement is upward as the water depth increases from 500 m to 3000 m. It can be found that the
mean values of the displacement can be reduced by using the present HMS. But the difference between
HMSW and HMSWB is very small. The difference of the standard deviations is not evident between
these three mooring systems.
(2) Tension on the lines
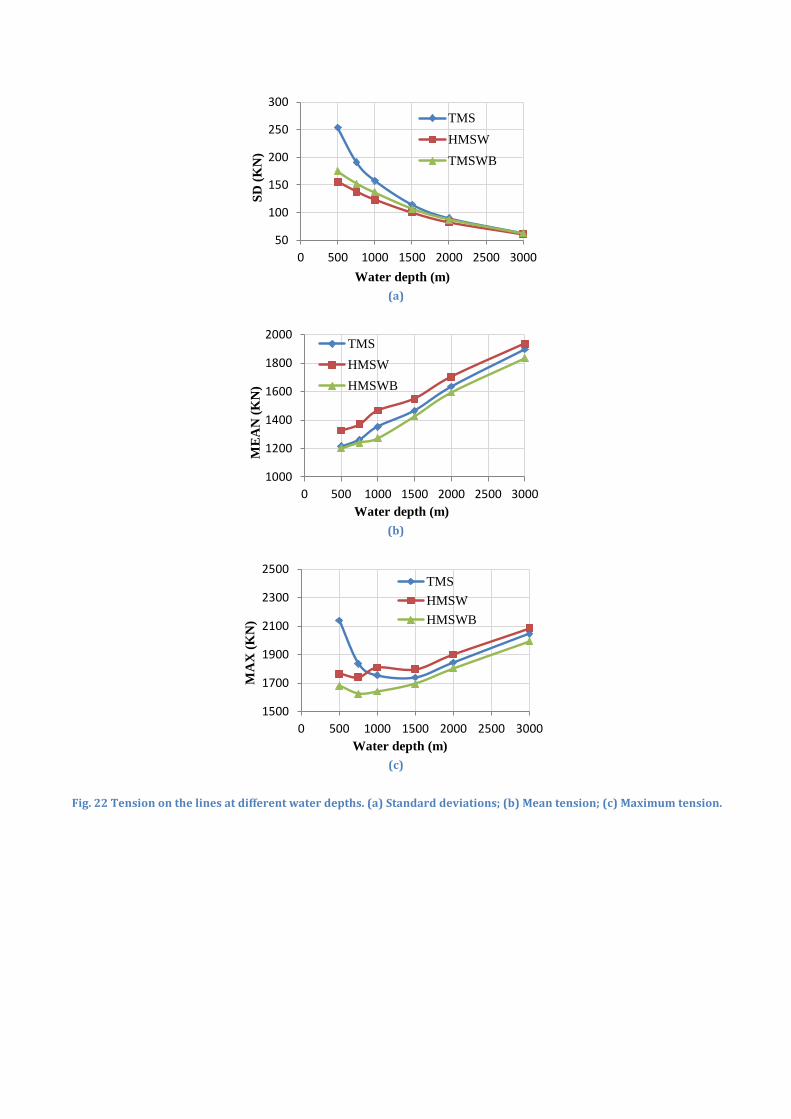
From Fig. 22 (a), it can be seen that the tension on the lines keeps a downward trend for all the three
types of mooring system as the water depth increases from 500 m to 3000 m. It can be illustrated that
the fluctuation of the line tension tends to be mild in deep water. It is also observed that the standard
deviations of the tension of the hybrid mooring system (HMS, including both HMSW and HMSWB) is
smaller than that of TMS, especially when the water depth is small. The standard deviation of HMSWB is
slightly larger than that of HMSW due to the influence from the buoys.
The mean tension on the lines keeps an upward trend, as shown in Fig. 22 (b). Compared with TMS, the
mean tension of HMSW tends to be larger due to the gravity of the weights. However, when the buoys
are used, the mean tension of HMSWB can be even smaller than that of TMS. The buoyancy pointing
upwards from the buoys can lower the tension on the upper ends of the mooring lines, which can also
be observed from Fig. 13.
The comparison results of the maximum tension in Fig. 22 (c) are quite similar to the mean tension
results at the water depth ranging from 1000 m to 3000 m. At 500 m water depth, the maximum tension
of TMS tends to be the largest of all. It drops rapidly from 2140 kN to 1750 kN when the water depth
increases from 500 m to 1000 m. But the changes of maximum tension of HMS are not significant at the
water depth ranging from 500 m to 1000 m.
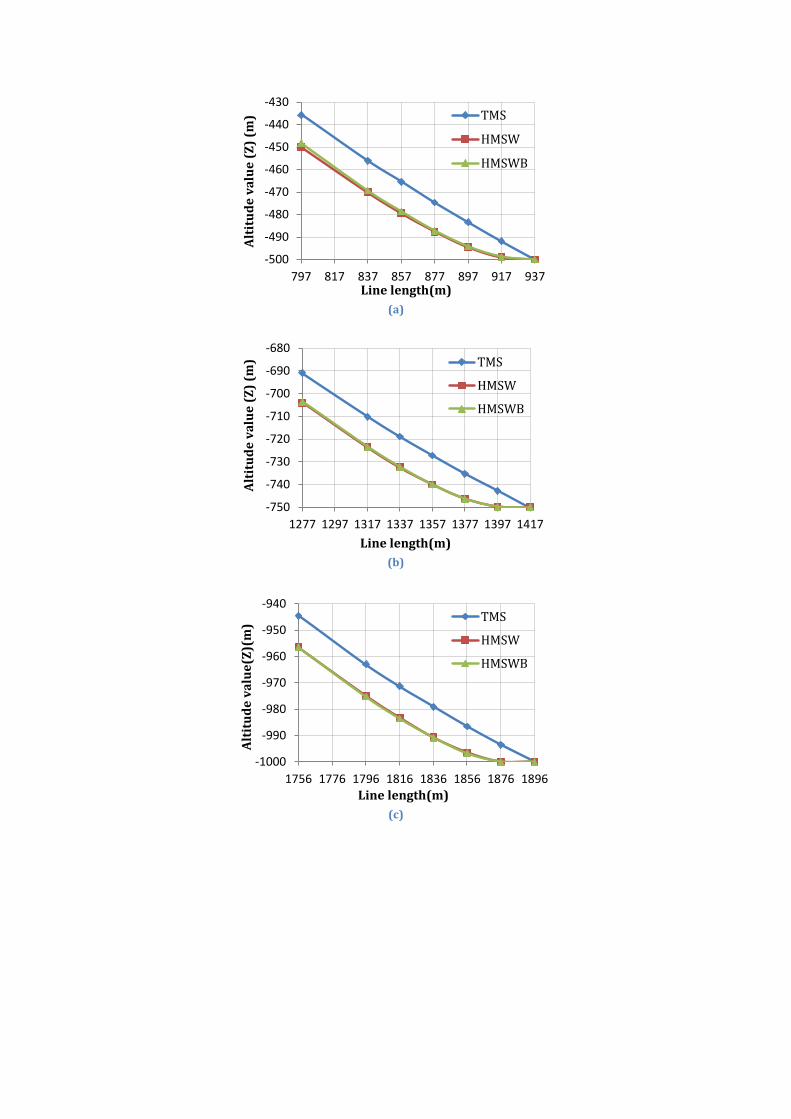
(3) Catenary end
Fig. 23 shows the catenary ends at different water depths. It can be found that at all water depths, a
catenary shape can be formed by using the new hybrid mooring system. But, as it extends to the deep
water, the lower ends are more likely to form a catenary shape.
5 Summary and conclusion
A new hybrid mooring system with clump weights and buoys was proposed in this paper. The
validation was carried out based on the time domian coupled analysis method. Through the comparison
between HMS and TMS, the following conclusions can be drawn:
1. The present hybrid mooring system could reduce the displacement of the platform. But the reduction
is not evident.
2. The attached buoys could reduce the tension on the mooring lines. This is a significant improment for
the mooring system since it provides a good approach to solve the contradiction between the vessel’s
motion and the line’s tension.
3. The catenary end could be formed through an optimal arrangement of the weights and buoys. There
was only horizontal component of the loads at the anchor point. As the water depth increses, the
mooring lines were more likely to rest on the sea bed and form a catenary shape.
4. The volume and position of the buoys could bring a significant influence to the line’s tension. But the
influence on the vessel’s motion and catenary end is not evident.
5. The present hybrid mooring system has a wide range of the application. At water depth ranging from
500 m to 3000 m, it provides a satisfied performance.
Overall, the numerical results indicate that the present hybrid mooring system with clump weights and
buoys will bring improvement to the vessel’s offsets and the line’s tension. It can form a catenary shape
at the lower end of the lines, which guarantees that there is only horizontal component of the loads at
the anchor point. However, the buoys will bring more complexities, difficulties and costs to deepwater
installation. Further replenishment will focus on the experimental study, which will be carried out in
the future work.
6 Acknowledgements
This study was supported by the National Natural Science and Foundation of China (Grant No. 51379095).
7 References
DeepC, 2011. DeepC User Manual. Version 4.5-05.
Finn, L.D., 1976. A new deepwater offshore platform- the guyed tower. In: Offshore Technology Conference,
Houston, Texas.
Hong, S.W., Kim, J. H., 2004. Experimental Study of a Compliant Mooring System for a Floating OWC
Device, Proceeding of The Fourteenth International Offshore and Polar Engineering Conference, Toulon,
France.
Ji, C.Y., Yuan, Z.M., Chen, M.L., 2011. Study on a new mooring system integrating catenary with taut
mooring. China Ocean Engineering, 25(3), 427-440.
Johanning, L., Smith, G.H., Wolfram, J., 2007. Measurements of static and dynamic mooring line damping
and their importance for floating WEC devices. Ocean Engineering, 34:14-15, 1918-1934.
MARINTEK, 2009. SIMO Theory Manual. Version 3.6.
Morrison, D.G., Asce, A.M., 1983. Guyed tower with dynamic mooring properties. Journal of Structural
Engineering 109, 2578-2590.
Smith, R. J., MacFarlane, C. J., 2001. Statics of a three component mooring line. Ocean Engineering 28,
pp.899–914.
Vicente, P.C., Falcão, A.F., Justino P. J., 2011. Slack-chain mooring configuration analysis of a floating wave
energy converter. 26th International Workshop on Water Waves and Floating Bodies, Athens, Greece.
Yuan, Z.M., Ji, C.Y., Chen, M.L., Zhang, Y., 2011. Coupled analysis of floating structures with a new
mooring system. 30th International Conference on Ocean, Offshore and Arctic Engineering, , Rotterdam, The
Netherlands.

Fig. 1 Taut mooring line (TML)
Fig. 2 Hybrid mooring line with clump weights (HMLW)
Fig. 3 Hybrid mooring line with clump weights and buoys (HMLWB)

Fig. 4 Semi-submersible platform model
Fig. 5 The arrangement of the mooring lines
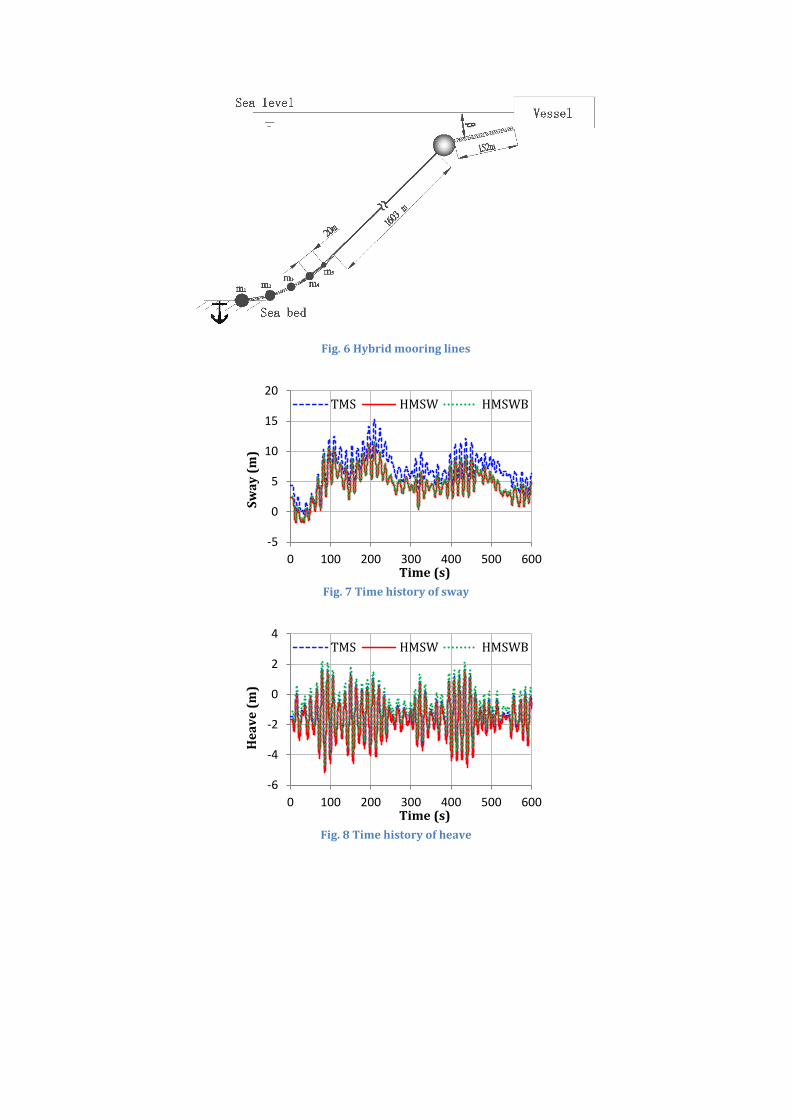
Fig. 6 Hybrid mooring lines
Fig. 7 Time history of sway
Fig. 8 Time history of heave
-5
0
5
10
15
20
0 100 200 300 400 500 600
Sw
ay
(m
)
Time (s)
TMS HMSW HMSWB
-6
-4
-2
0
2
4
0 100 200 300 400 500 600
He
av
e (
m)
Time (s)
TMS HMSW HMSWB

Fig. 9 Time history of roll
Fig. 10 Spectral density of sway
Fig. 11 Spectral density of heave
-6
-4
-2
0
2
4
6
8
0 100 200 300 400 500 600
Ro
ll (
de
g)
Time (s)
TMS HMSW HMSWB
0.E+00
1.E+02
2.E+02
3.E+02
4.E+02
5.E+02
6.E+02
7.E+02
0 0.025 0.05 0.075 0.1
Sp
ect
rum
of
swa
y(m
2s/
rad
)
Frequency (rad/s)
TMS
HMSW
HMSWB
0.E+00
1.E+02
2.E+02
3.E+02
4.E+02
5.E+02
0 0.025 0.05 0.075 0.1
Sp
ect
rum
of
he
av
e(m
2s/
rad
)
Frequency (rad/s)
TMS
HMSW
HMSWB
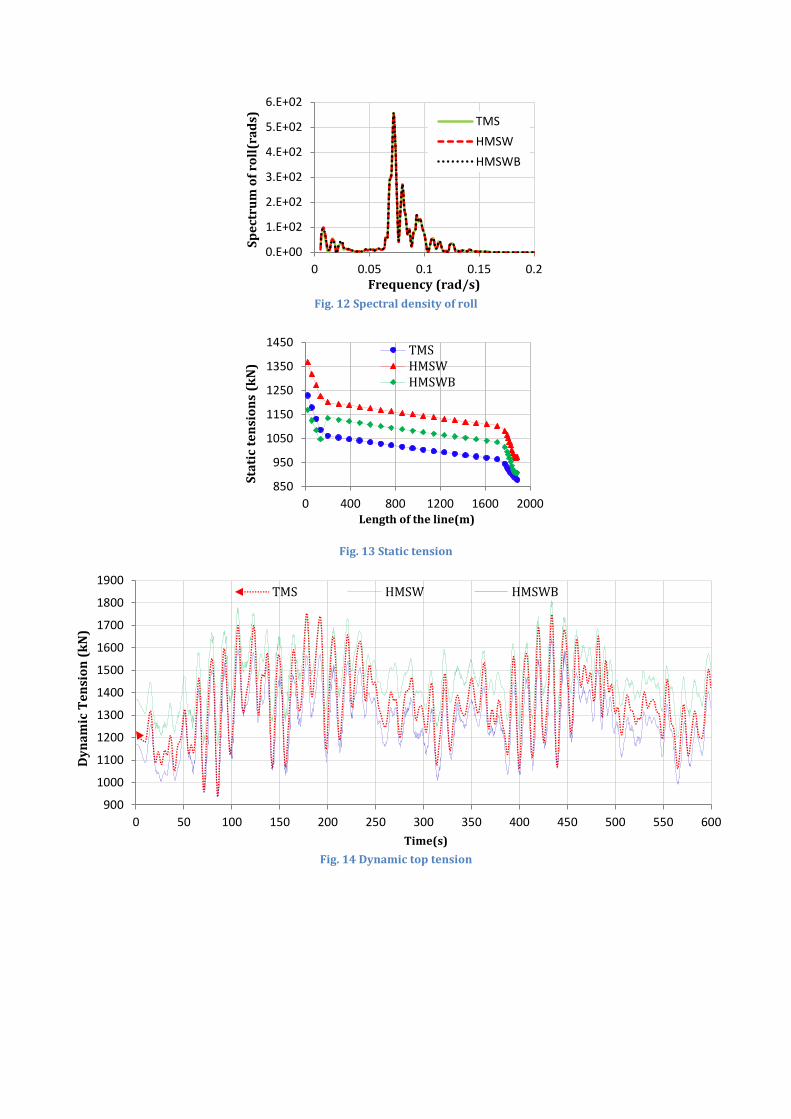
Fig. 12 Spectral density of roll
Fig. 13 Static tension
Fig. 14 Dynamic top tension
0.E+00
1.E+02
2.E+02
3.E+02
4.E+02
5.E+02
6.E+02
0 0.05 0.1 0.15 0.2
Sp
ect
rum
of
roll
(ra
ds)
Frequency (rad/s)
TMS
HMSW
HMSWB
850
950
1050
1150
1250
1350
1450
0 400 800 1200 1600 2000
Sta
tic
ten
sio
ns
(kN
)
Length of the line(m)
TMSHMSWHMSWB
900
1000
1100
1200
1300
1400
1500
1600
1700
1800
1900
0 50 100 150 200 250 300 350 400 450 500 550 600
Dy
na
mic
Te
nsi
on
(k
N)
Time(s)
TMS HMSW HMSWB

Fig. 15 Tension spectra
(a)
(b)
Fig. 16 Catenary end
0.E+00
2.E+05
4.E+05
6.E+05
8.E+05
1.E+06
1.E+06
0 0.05 0.1 0.15 0.2 0.25 0.3
Sp
ect
rum
of
top
te
nsi
on
(N
2s/
rad
)
Frequency (rad/s)
TMS
HMSW
HMSWB
-1000
-990
-980
-970
-960
-950
-940
1756 1776 1796 1816 1836 1856 1876 1896
Alt
itu
de
va
lue
(Z
) (m
)
Line length (m)
HMSW TMS
HMSWB
-1000
-999
-998
-997
-996
1856 1866 1876 1886 1896
Alt
itu
de
va
lue
(Z
) (m
)
Line length (m)
HMSW HMSWB
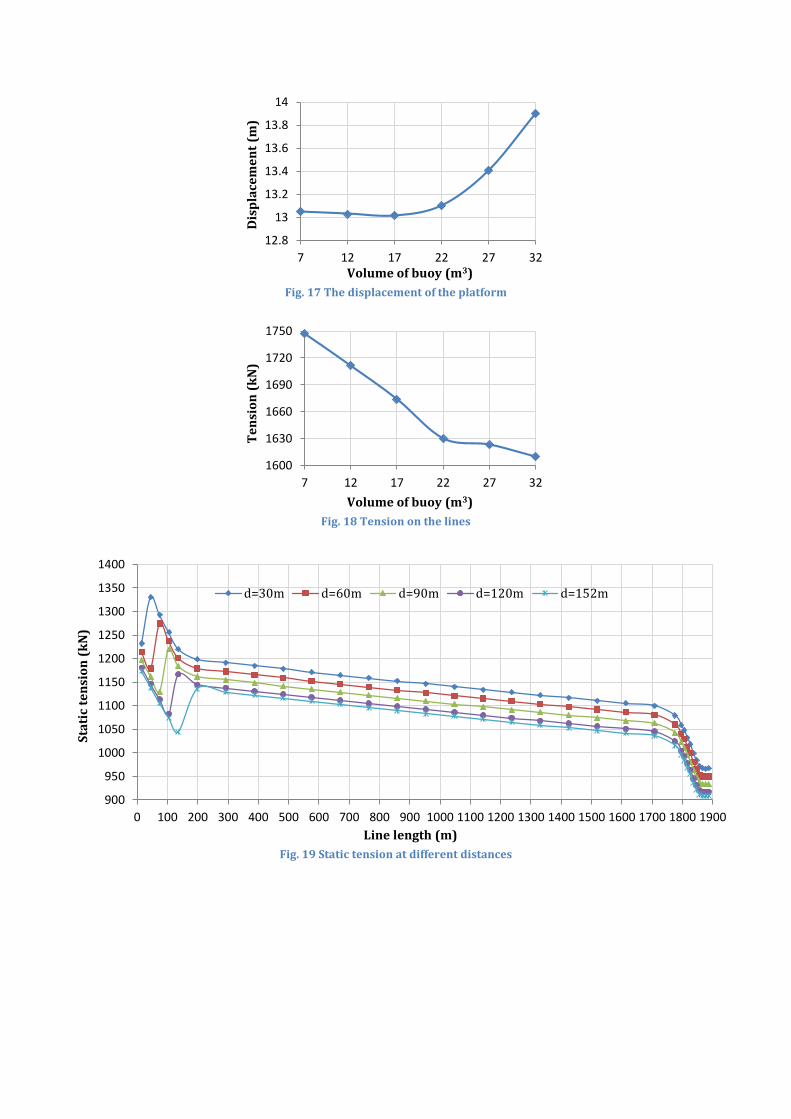
Fig. 17 The displacement of the platform
Fig. 18 Tension on the lines
Fig. 19 Static tension at different distances
12.8
13
13.2
13.4
13.6
13.8
14
7 12 17 22 27 32D
isp
lace
me
nt
(m)
Volume of buoy (m3)
1600
1630
1660
1690
1720
1750
7 12 17 22 27 32
Te
nsi
on
(k
N)
Volume of buoy (m3)
900
950
1000
1050
1100
1150
1200
1250
1300
1350
1400
0 100 200 300 400 500 600 700 800 900 1000 1100 1200 1300 1400 1500 1600 1700 1800 1900
Sta
tic
ten
sio
n (
kN
)
Line length (m)
d=30m d=60m d=90m d=120m d=152m

Fig. 20 The maximum dynamic tension of different distances
(a)
(b)
Fig. 21 The displacement at different water depths. (a) Mean values; (b) Standard deviations.
1600
1650
1700
1750
1800
1850
30 60 90 120 150
Te
nsi
on
(k
N)
Distance (m)
0
5
10
15
20
25
0 500 1000 1500 2000 2500 3000
Me
an
va
lue
(m
)
Water depth (m)
TMS HMSW HMSWB
0
0.5
1
1.5
2
2.5
3
0 500 1000 1500 2000 2500 3000
Sta
nd
ard
de
via
tio
n (
m)
Water depth (m)
TMS HMSW HMSWB
(a)
(b)
(c)
Fig. 22 Tension on the lines at different water depths. (a) Standard deviations; (b) Mean tension; (c) Maximum tension.
50
100
150
200
250
300
0 500 1000 1500 2000 2500 3000S
D (
KN
)
Water depth (m)
TMS
HMSW
TMSWB
1000
1200
1400
1600
1800
2000
0 500 1000 1500 2000 2500 3000
ME
AN
(K
N)
Water depth (m)
TMS
HMSW
HMSWB
1500
1700
1900
2100
2300
2500
0 500 1000 1500 2000 2500 3000
MA
X (
KN
)
Water depth (m)
TMS
HMSW
HMSWB
(a)
(b)
(c)
-500
-490
-480
-470
-460
-450
-440
-430
797 817 837 857 877 897 917 937
Alt
itu
de
va
lue
(Z
) (m
)
Line length(m)
TMS
HMSW
HMSWB
-750
-740
-730
-720
-710
-700
-690
-680
1277 1297 1317 1337 1357 1377 1397 1417
Alt
itu
de
va
lue
(Z
) (m
)
Line length(m)
TMS
HMSW
HMSWB
-1000
-990
-980
-970
-960
-950
-940
1756 1776 1796 1816 1836 1856 1876 1896
Alt
itu
de
va
lue
(Z)(
m)
Line length(m)
TMS
HMSW
HMSWB

(d)
(e)
(f)
Fig. 23 The catenary ends at different water depths. (a) 500 m; (b) 750 m; (c) 1000 m; (d) 1500 m; (e) 2000 m; (f) 3000 m.
-1500
-1490
-1480
-1470
-1460
-1450
2720 2740 2760 2780 2800 2820 2840 2860
Alt
itu
de
va
lue
(Z)(
m)
Line length(m)
TMS
HMSW
HMSWB
-2000
-1990
-1980
-1970
-1960
-1950
3683 3703 3723 3743 3763 3783 3803 3823
Alt
itu
de
va
lue
(Z)(
m)
Line length(m)
TMS
HMSW
HMSWB
-3000
-2995
-2990
-2985
-2980
-2975
-2970
-2965
-2960
5621 5641 5661 5681 5701 5721 5741 5761
Alt
itu
de
va
lue
(Z)(
m)
Line length(m)
TMS
HMSW
HMSWB

Table 1 Main particulars of the platform
Length (m) 80.6
Breadth of pontoon (m) 16
Height of pontoon (m) 7.5
Diameter of columns (m) 12.9
Spacing of columns (m) (centre to centre) 54.72
Displacement (m3) 23548
Distance between pontoons (m) 1.17
Vertical position of CG (above BL) (m) 14.9
Longitudinal coordinate of CG (forward midship) (m) 0
Radius of inertia for pitch (m) 30
Coordinate of Fairlead 1 (m) (33.6, 29.0, 0)
Coordinate of Fairlead 2 (m) (31.9, 32.9, 0)
Coordinate of Fairlead 3 (m) (29.0, 33.6, 0)
CG, centre of gravity; BL, base line
Table 2 Environmental loading condition
Wave
Wave spectrum JONSWAP
Significant wave height (m) 12.19
Peak period (s) 14
Direction (deg) 90
Wind
Wind spectrum API RP 2A-WSD
Velocity (m/s) 41.12
Direction (deg) 60
Current
at free surface (0 m) (m/s) 1.0668
at 60.96 m (m/s) 1.0668
at 91.44 m (m/s ) 0.0914
on the sea bottom (m/s) 0.0914
Direction (deg) 120
Table 3 Main particulars of the mooring lines
Segment Length
(m) Diameter
(m) Wet Weight
(t/m) EA(MN) dnC / dtC mnC / mtC
MBL (kN)
Chain 152 0.098 0.192 802 2.45/0.65 2/0.5 8927
Polyester 1603 0.178 0.007 300 1.2/0.3 1.15/0.2 9786
Chain 141 0.098 0.192 802 2.45/0.65 2/0.5 8927

Table 4 Statistical variability of the motions
Motion Statistical variability TMS HMSW HMSWB
Sway(m)
MAX 15.21 11.48 11.57
Mean 6.92 4.53 4.75
SD 2.98 2.62 2.55
Heave(m)
MAX -4.92 -5.15 -4.62
Mean -1.47 -1.64 -1.07
SD 1.25 1.27 1.27
Roll(deg)
MAX 6.74 6.82 6.76
Mean 1.36 1.28 1.37
SD 1.86 1.88 1.89
MAX: maximum value; SD: standard deviations
Table 5 Statistical variability of tension (unit: kN)
Mean SD Max
TMS 1355 158 1753
HMSW 1469 123 1810
HMSWB 1274 137 1641
Table 6 The hoisting height of m1 and m2
Volume (m3)
Hoisting height of m1 (m)
Hoisting height of m2 (m)
7 0.02 3.34
12 0 3.31
17 0 3.3
22 0 3.33
27 0.01 3.46
32 0.02 3.81
Table 7 Displacement (unit: m)
d 30 60 90 120 152
Disp. 13.34 13.33 13.32 13.18 13.10
Table 8 The hoisting height of m1 and m2
Volume (m3) 30 60 90 120 152
Hoisting height of m1 (m) 0 0 0 0 0 Hoisting height of m2 (m) 3.33 3.26 3.23 3.17 3.12
Table 9 The length of the mooring lines at different water depths (unit: m)
Water depth 500 750 1000 1500 2000 3000
Upper Chain 152 152 152 152 152 152 Polyester Line 644 1124 1603 2567 3530 5468 Lower Chain 141 141 141 141 141 141 Total Length 937 1417 1896 2860 3823 5761
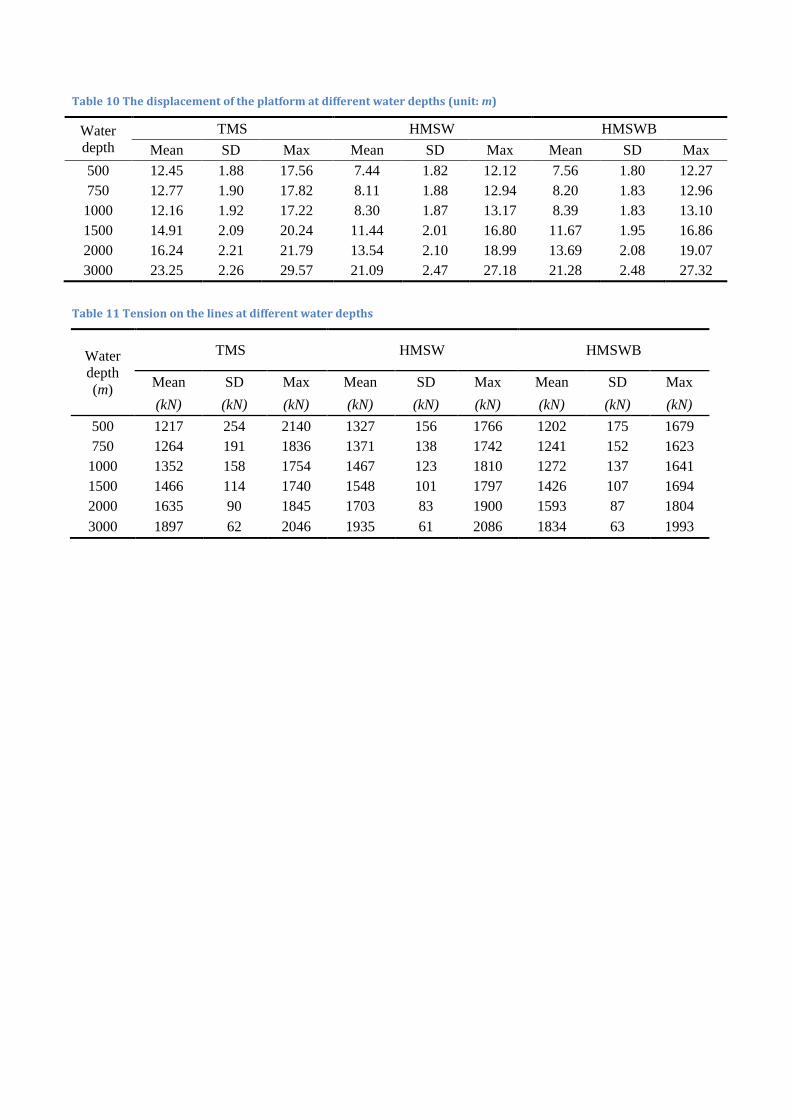
Table 10 The displacement of the platform at different water depths (unit: m)
Water
depth
TMS HMSW HMSWB
Mean SD Max Mean SD Max Mean SD Max
500 12.45 1.88 17.56 7.44 1.82 12.12 7.56 1.80 12.27
750 12.77 1.90 17.82 8.11 1.88 12.94 8.20 1.83 12.96
1000 12.16 1.92 17.22 8.30 1.87 13.17 8.39 1.83 13.10
1500 14.91 2.09 20.24 11.44 2.01 16.80 11.67 1.95 16.86
2000 16.24 2.21 21.79 13.54 2.10 18.99 13.69 2.08 19.07
3000 23.25 2.26 29.57 21.09 2.47 27.18 21.28 2.48 27.32
Table 11 Tension on the lines at different water depths
Water
depth
(m)
TMS HMSW HMSWB
Mean SD Max Mean SD Max Mean SD Max
(kN) (kN) (kN) (kN) (kN) (kN) (kN) (kN) (kN)
500 1217 254 2140 1327 156 1766 1202 175 1679
750 1264 191 1836 1371 138 1742 1241 152 1623
1000 1352 158 1754 1467 123 1810 1272 137 1641
1500 1466 114 1740 1548 101 1797 1426 107 1694
2000 1635 90 1845 1703 83 1900 1593 87 1804
3000 1897 62 2046 1935 61 2086 1834 63 1993