Numerical study of the swirl flow in F-5E intake with
21
Mathematical and Computer Modelling 48 (2008) 447–467 www.elsevier.com/locate/mcm Numerical study of the swirl flow in F-5E intake with subsonic speeds Y.L. Wu a , E.Y.K. Ng b,a,* , K. Wong c a Thermal and Fluids Engineering, School of Mechanical and Aerospace Engineering, 50 Nanyang Ave., Nanyang Technological University, Singapore 639798, Singapore b Office of Biomedical Research, National University Hospital of Singapore, Singapore c Air Logistic Department, 2 Air Logistic Department, 506 Airport Road, Singapore 534395, Singapore Received 13 June 2007; received in revised form 21 September 2007; accepted 12 October 2007 Abstract At an S-duct, there are two types of swirl flow in the F-5E intake flow, i.e., bulk and twin swirl components. It is well-known that the intake swirl is one of the major disturbance parameters in engine/intake compatibility. In this study, a numerical simulation is conducted for the F-5E intake in order to study the swirl flow under subsonic speed. Both bulk and twin swirl components of the intake at the angles of attack (AOAs) and the angles of sideslip (AOSSs) with subsonic speed are investigated. The relevance of swirl flow and the possibility of engine surge are also discussed. c 2007 Elsevier Ltd. All rights reserved. Keywords: Aero-engine; F-5E; Intake swirl; Subsonic speed 1. Introduction In modern combat aircraft, the S-type intake is very commonly used. However, the swirl flow which is always accompanied by an S-type intake may cause serious engine/intake compatibility problems, such as engine surge and fan vibration. Aulehla [1] found that the swirl in S-type intake may be classified into two components: (1) the twin swirl or vortices due to the internal S-duct profile; (2) the bulk swirl which is independent of the bend (in the S-duct) itself. The twin swirl is the more stable component and less easily attenuated. In contrast, the bulk swirl is rather sensitive, and changes considerably with the flow conditions. For the starboard intake of the twin side-by-side intake system, the bulk swirl rotates in a direction opposite to that in which the engine rotates, which can cause engine surges, while the port engine is surge-free at the same operating * Corresponding address: Nanyang Technological University, College of Engineering, School of Mechanical and Aerospace Engineering, 50 Nanyang Avenue, Singapore 639798, Singapore. Tel.: +65 6790 4455; fax: +65 6791 1859. E-mail address: [email protected] (E.Y.K. Ng). 0895-7177/$ - see front matter c 2007 Elsevier Ltd. All rights reserved. doi:10.1016/j.mcm.2007.10.009
-
Upload
theodoros-triantafyllou -
Category
Documents
-
view
71 -
download
4
Transcript of Numerical study of the swirl flow in F-5E intake with

Mathematical and Computer Modelling 48 (2008) 447–467www.elsevier.com/locate/mcm
Numerical study of the swirl flow in F-5E intake withsubsonic speeds
Y.L. Wua, E.Y.K. Ngb,a,∗, K. Wongc
a Thermal and Fluids Engineering, School of Mechanical and Aerospace Engineering, 50 Nanyang Ave., Nanyang Technological University,Singapore 639798, Singapore
b Office of Biomedical Research, National University Hospital of Singapore, Singaporec Air Logistic Department, 2 Air Logistic Department, 506 Airport Road, Singapore 534395, Singapore
Received 13 June 2007; received in revised form 21 September 2007; accepted 12 October 2007
Abstract
At an S-duct, there are two types of swirl flow in the F-5E intake flow, i.e., bulk and twin swirl components. It is well-knownthat the intake swirl is one of the major disturbance parameters in engine/intake compatibility. In this study, a numerical simulationis conducted for the F-5E intake in order to study the swirl flow under subsonic speed. Both bulk and twin swirl components of theintake at the angles of attack (AOAs) and the angles of sideslip (AOSSs) with subsonic speed are investigated. The relevance ofswirl flow and the possibility of engine surge are also discussed.c© 2007 Elsevier Ltd. All rights reserved.
Keywords: Aero-engine; F-5E; Intake swirl; Subsonic speed
1. Introduction
In modern combat aircraft, the S-type intake is very commonly used. However, the swirl flow which is alwaysaccompanied by an S-type intake may cause serious engine/intake compatibility problems, such as engine surge andfan vibration.
Aulehla [1] found that the swirl in S-type intake may be classified into two components:
(1) the twin swirl or vortices due to the internal S-duct profile;(2) the bulk swirl which is independent of the bend (in the S-duct) itself.
The twin swirl is the more stable component and less easily attenuated. In contrast, the bulk swirl is rather sensitive,and changes considerably with the flow conditions.
For the starboard intake of the twin side-by-side intake system, the bulk swirl rotates in a direction opposite to thatin which the engine rotates, which can cause engine surges, while the port engine is surge-free at the same operating
∗ Corresponding address: Nanyang Technological University, College of Engineering, School of Mechanical and Aerospace Engineering, 50Nanyang Avenue, Singapore 639798, Singapore. Tel.: +65 6790 4455; fax: +65 6791 1859.
E-mail address: [email protected] (E.Y.K. Ng).
0895-7177/$ - see front matter c© 2007 Elsevier Ltd. All rights reserved.doi:10.1016/j.mcm.2007.10.009

448 Y.L. Wu et al. / Mathematical and Computer Modelling 48 (2008) 447–467
Fig. 1. F-5E fighter (From Northrop Grumman).
conditions, as the bulk swirl rotates in the same direction as does the engine. That is the essential requirement for theearly intake/engine incompatibility of a Tornado which is called the “handed” effect.
For this reason, the swirling effect is at least of equal importance for intake aerodynamics, as total pressure recovery,flow distortion, and spillage drag.
In this paper, the swirling flow in F-5E intake is studied using Computational Fluid Dynamics (CFD). The bulkand twin swirl components of the intake at different angles of attack (AOAs) and angles of sideslip (AOSSs) withsubsonic speed are investigated. The relevancy of swirl flow and possibility of compressor stall and engine surge arealso included in this study.
2. Review on the theoretical analysis of swirl flow
Swirl flow refers to the 3D flow angularity in an S-type duct which has two bends. This type of flow is usually isthe combination of a twin swirl and a certain level bulk swirl [2].
2.1. Twin swirl
The existence of twin swirl in S-type duct flows is caused by the following facts:Centrifugal forces tend to displace the fluid core, which has the highest energy compared to flow near the wall,
against the outer wall at the bend, i.e. wall with greater radius of curvature. This results in a positive adverse pressuregradient distribution at the outer wall, while the pressure gradient at the inner wall is negative. The pressure gradients,therefore, act to balance the centrifugal forces generated in the fluid. At the same time, low energy near-wall flows aredeflected from the outer wall to the inner wall circumferentially by the pressure gradients. Thus, the movement of lowenergy fluid towards the inside of the bend, coupled with the deflection of the high energy fluid core, establishes twocounter-rotating cells of secondary flow, i.e., twin swirl.
The twin swirl is the more stable component and less easily affected by an external flow (such as M∞, α, β) orintake internal geometric modification (e.g. a flow straightener, IGV).
2.2. Bulk swirl
Bulk swirl is defined as the circumferential mean value of the circumferential flow angles for each radius R whichis a constant. This swirl type is similar to the solid body type rotation. Its generation can be explained as: A region oflow kinetic energy (low total pressure) located asymmetrically at one portion of the duct perimeter, is pushed towardsthe inner radius of the bend while the high energy air is moved outwards by centrifugal forces.
In contrast to the twin swirl, the bulk swirl is rather sensitive i.e., it changes considerably in magnitude and also insign for varying external flow conditions. It can be reduced significantly by flow straightening devices.
In summary, the swirling flow in S-type intake is determined with factors such as [3]:
(1) The adverse pressure gradients related with the curvature of the duct and the angle of incidence of the intake.(2) The pressure gradients related with the diffusion and the incidence of the intake.

Y.L. Wu et al. / Mathematical and Computer Modelling 48 (2008) 447–467 449
Fig. 2. The air intake of F-5E (generated by Pro/Engineer, Wildfire 2.0).
(3) Centrifugal force of the flow.(4) Flow separation.(5) Cross section geometry.
Factor (1) is the major factor used to determine the swirling flow map at the outflow whereas Factor (2) is the majorreason for the flow separation. For strong bulk swirling flow, flow separation is the necessary condition.
Strong bulk swirl is always harmful to the engine operation. Actually, if the local reverse rotated swirl flow is strongenough; any combination of the twin swirl and bulk swirl will cause the surge of the compressor.
The swirling flow will result in the distortion of the velocity at the engine face. Its axial and radial componentscan change the flow angle of attack on the compressor blades which can then lead to stalling. In other words, it canincrease the instantaneous pressure distortion. Swirling flow aggravates the effect of total pressure distortion and surgeis encountered when the swirl is contrarotational to the direction of the fan rotor blades.

450 Y.L. Wu et al. / Mathematical and Computer Modelling 48 (2008) 447–467
Fig. 3. 3D Mesh generated by GAMBIT 2.2.
Fig. 4. Mesh generation for F-5E intake (enlarged figure).
(a) PR vs AOA. (b) PR vs AOSS.
Fig. 5. Pressure Recovery for different AOAs, AOSSs.

Y.L. Wu et al. / Mathematical and Computer Modelling 48 (2008) 447–467 451
(a) DC60 and SC60 vs AOA. (b) DC60 and SC60 vs AOSS.
Fig. 6. DC(60) and SC(60) for different AOAs and AOSSs.
(a) α = 0, β = 0. (b) α = −4, β = 0.
(c) α = −10, β = 0. (d) α = −20, β = 0
Fig. 7. Total pressure contours at AIP for AOA (α) of 0, −4, −10, −20 degrees. (AOSS (β) = 0).
452 Y.L. Wu et al. / Mathematical and Computer Modelling 48 (2008) 447–467
(a) α = 0, β = 0. (b) α = 4, β = 0.
(c) α = 10, β = 0. (d) α = 20, β = 0.
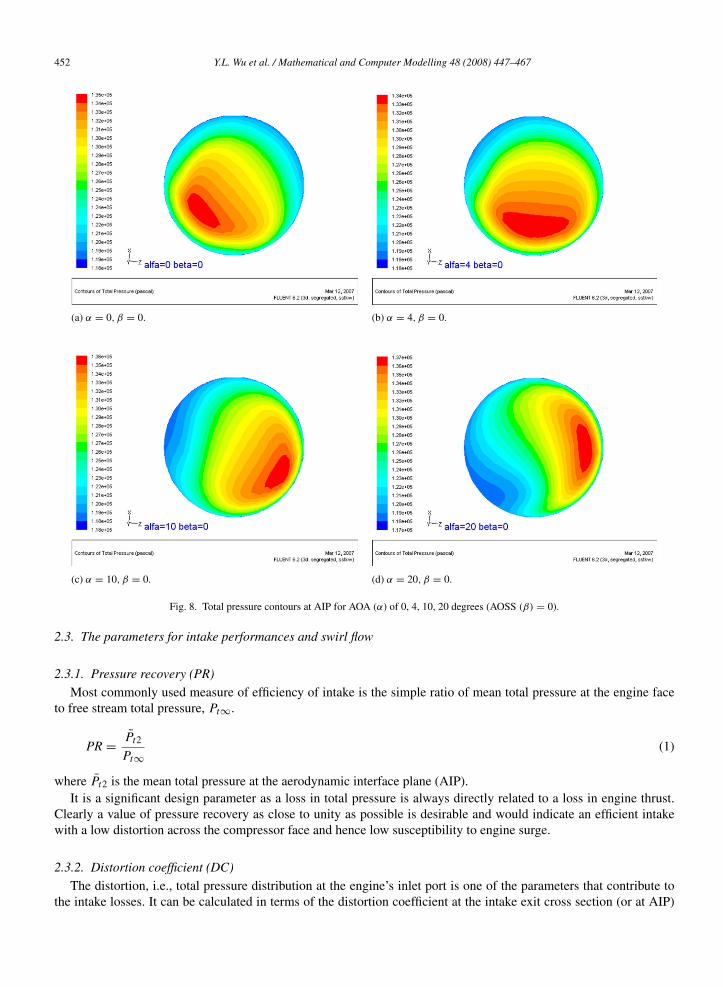
Fig. 8. Total pressure contours at AIP for AOA (α) of 0, 4, 10, 20 degrees (AOSS (β) = 0).
2.3. The parameters for intake performances and swirl flow
2.3.1. Pressure recovery (PR)Most commonly used measure of efficiency of intake is the simple ratio of mean total pressure at the engine face
to free stream total pressure, Pt∞.
PR =Pt2
Pt∞(1)
where Pt2 is the mean total pressure at the aerodynamic interface plane (AIP).It is a significant design parameter as a loss in total pressure is always directly related to a loss in engine thrust.
Clearly a value of pressure recovery as close to unity as possible is desirable and would indicate an efficient intakewith a low distortion across the compressor face and hence low susceptibility to engine surge.
2.3.2. Distortion coefficient (DC)The distortion, i.e., total pressure distribution at the engine’s inlet port is one of the parameters that contribute to
the intake losses. It can be calculated in terms of the distortion coefficient at the intake exit cross section (or at AIP)
Y.L. Wu et al. / Mathematical and Computer Modelling 48 (2008) 447–467 453
(a) α = 0, β = 0. (b) α = 0, β = −4.
(c) α = 0, β = −10. (d) α = 0, β = −20.
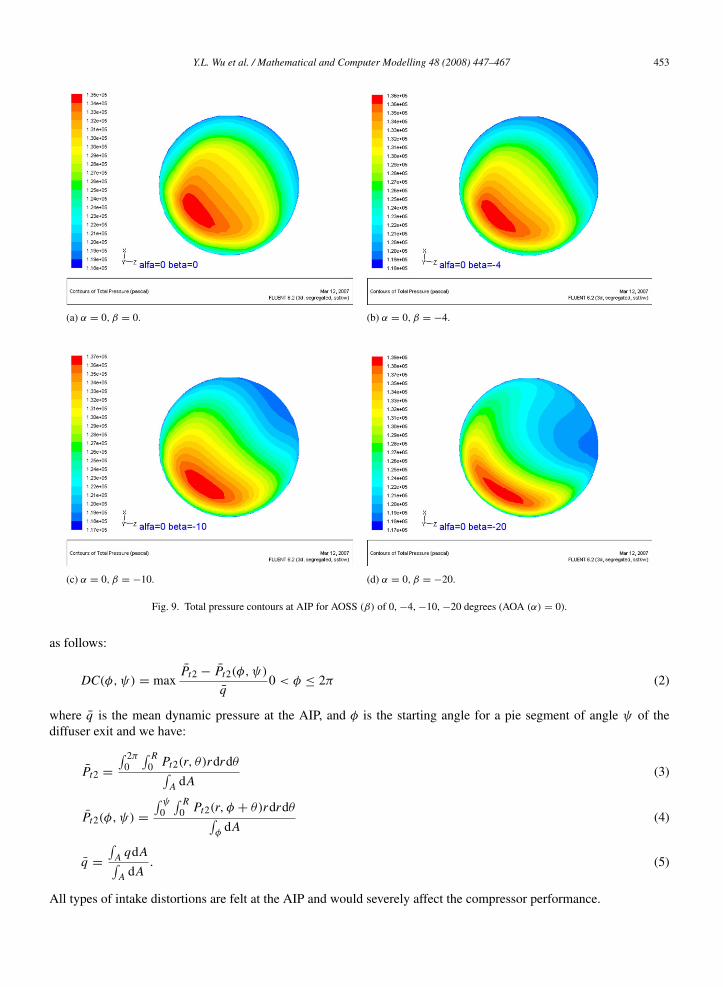
Fig. 9. Total pressure contours at AIP for AOSS (β) of 0, −4, −10, −20 degrees (AOA (α) = 0).
as follows:
DC(φ, ψ) = maxPt2 − Pt2(φ, ψ)
q0 < φ ≤ 2π (2)
where q is the mean dynamic pressure at the AIP, and φ is the starting angle for a pie segment of angle ψ of thediffuser exit and we have:
Pt2 =
∫ 2π0
∫ R0 Pt2(r, θ)rdrdθ∫
A dA(3)
Pt2(φ, ψ) =
∫ ψ0
∫ R0 Pt2(r, φ + θ)rdrdθ∫
φdA
(4)
q =
∫A qdA∫A dA
. (5)
All types of intake distortions are felt at the AIP and would severely affect the compressor performance.

454 Y.L. Wu et al. / Mathematical and Computer Modelling 48 (2008) 447–467
(a) α = 0, β = 0. (b) α = 0, β = 4.
(c) α = 0, β = 10. (d) α = 0, β = 20.
Fig. 10. Total pressure contours at AIP for AOSS (β) of 0, 4, 10, 20 degrees (AOA (α) = 0).
2.3.3. Swirl coefficient (SC)
Swirl coefficient is the maximum circumferential cross flow velocity in ψ section, non-dimensionalized by themean axial velocity at the exit cross section. It is defined as follows [4]:
SC(φ, ψ) = maxvθ (φ, ψ)
U, 0 < φ ≤ 2π (6)
where vθ is the circumferential cross flow velocity, U is the mean axial velocity over the exit cross section and φ isthe starting angle for a pie segment of angle ψ of the diffuser exit.
vθ (φ, ψ) =
∫ ψ0
∫ R0 vθ (r, φ + θ)rdrdθ∫
φdA
(7)
U =
∫A UdA∫
A dA. (8)
In our study, the values of ψ for both DC and SC are chosen to be 60◦, and termed as DC(60), SC(60).

Y.L. Wu et al. / Mathematical and Computer Modelling 48 (2008) 447–467 455
(a) α = 0, β = 0. (b) α = −4, β = 0.
(c) α = −10, β = 0. (d) α = −20, β = 0.
Fig. 11. Vectors of velocity on the exit for AOA (α) of 0, −4, −10, −20 degrees (AOSS (β) = 0).
3. Numerical approach
As common steps of CFD, the inlet flow area is firstly divided into a large number of cells or control volumes,collectively referred to as the “mesh” or “grid”. In each of the cells, the Navier–Stokes equations, i.e. the partialdifferential equations that describe fluid flow are discretized properly, to relate such variables as pressure, velocityand temperature in the neighboring cells. The equations are then solved numerically yielding a picture of the flowcorresponding to the level of resolution of the mesh.
3.1. Description of the inlet geometry
In the twin engine F-5E, each intake lies within the wing-root section of the aircraft as shown in Fig. 1. The F-5Einlet is basically a rectangular duct that transfers initially to a circular outlet [5]. The geometry of the F-5E inlet modelis shown in Fig. 2. Solid modeling for the inlet geometry is done by the computer-aided design program Pro/Engineer,Wildfire 2.0 [6].
3.2. Mesh generation
In this work, mesh generation is done by GAMBIT 2.2 [7]. There is a total of 380 380 hexahedral cells, and 393 024nodes (Fig. 3). There are 10 levels of boundary layer meshes, as shown in Fig. 4 (enlarged figure). The y+ values forthe first grid line are in the range 40–200, which satisfies the requirement of the near-wall function model.

456 Y.L. Wu et al. / Mathematical and Computer Modelling 48 (2008) 447–467
(a) α = 0, β = 0. (b) α = 4, β = 0.
(c) α = 10, β = 0. (d) α = 20, β = 0.
Fig. 12. Vectors of velocity on the exit for AOA (α) of 0, 4, 10, 20 degrees. (AOSS (β) = 0).
3.3. Flow solver
Fluent 6.2 is a commercial software package which is based on Finite Volume Method (FVM) for modeling fluidflow and heat transfer in complex geometries [7]. Due to the promising capabilities of FLUENT 6.2, we chose it asour numerical solver to simulate the flow through the F-5E inlet.
In this simulation the 3D compressible N–S equations with the hybrid of k − ω model termed the shear stresstransport (SST) model [8] is used. The k − ω turbulence model is a two-equation model [9]. The eddy viscosityis determined from the solution of two partial differential equations – one for the turbulent kinetic energy (k) andone for the specific dissipation rate (ω).The SST turbulence closure is a two-equation model which is a hybrid ofthe k − ω model. Closures that are based on the Boussinesq hypothesis are notoriously unreliable for flows withsecondary motions. The SST model was devised in order to improve the prediction of the extent of separation in flowsdominated by adverse pressure gradients. It is likely that SST predictions would show improvements over standardk − ω predictions for flows in diffusing offset intakes [10].
In this study, the 3D segregated, implicit solver is selected in FLUENT 6.2. In this approach, each discretegoverning equation is linearized implicitly with respect to that equation’s dependent variable, which means that for agiven variable, the unknown value in each cell is computed using a relation that includes both existing and unknownvalues from neighboring cells. Therefore each unknown will appear in more than one equation in the system, andthese equations must be solved simultaneously to give the unknown quantities. This will result in a system of linearequations with one equation for each cell in the domain. A point implicit (Gauss–Seidel) linear equation solver isused in conjunction with an Algebraic Multi-Grid (AMG) method to solve the resultant scalar system of equationsfor the dependent variable. The systems responding to each governing equation for the whole domain are solved

Y.L. Wu et al. / Mathematical and Computer Modelling 48 (2008) 447–467 457
(a) α = 0, β = 0. (b) α = 0, β = −4.
(c) α = 0, β = −10. (d) α = 0, β = −20.
Fig. 13. Vectors of velocity on the exit for AOSS (β) of 0, −4, −10, −20 degrees. (AOA (α) = 0).
sequentially. Because the governing equations are non-linear (and coupled), several iterations of the solution loopmust be performed before a converged solution is obtained. Each iteration consists of the below steps [7]:
1. Fluid properties are updated, based on the current solution. (If the calculation has just begun, the fluid propertieswill be given by initialized solution.)
2. The momentum equations for u, v and w are solved one by one using current values for pressure and face massfluxes, so that the velocity field is updated.
3. Since the velocities obtained in Step 2 may not satisfy the continuity equation, the pressure correction equation isderived from the continuity equation and the linearized momentum equations. This pressure correction equation isthen solved to obtain the necessary corrections to the pressure and velocity fields and the face mass fluxes such thatcontinuity is satisfied.
4. The equations for turbulence, energy are solved using the previously updated values of the other variables.5. Check for convergence of the equations: if convergence criteria are met, then the calculation stops; if not, go back
to Step 1 until the convergence criteria are met.
In this study, the first order upwind scheme is applied for all the governing equations except the pressure. TheSIMPLEC scheme is used for the pressure–velocity coupling.
3.4. Boundary conditions
At inflow, the far field pressure condition is employed, that means total pressure with Mach number, temperature,tangential and swirl flow angles is held constant. At outflow, the constant static pressure is used, which is the moststraightforward method for strictly subsonic outflow.

458 Y.L. Wu et al. / Mathematical and Computer Modelling 48 (2008) 447–467
(a) α = 0, β = 0. (b) α = 0, β = 4.
(c) α = 0, β = 10. (d) α = 0, β = 20.
Fig. 14. Vectors of velocity on the exit for AOSS (β) of 0, 4, 10, 20 degrees (AOA (α) = 0).
To determine the static pressure at the AIP, we assume that the capture flow ratio (CFR) is equal to 1. That meansthat the intake is being supplied with sufficient air to meet the demand from the same area as the throat area. Since themass flow for compressible air can be written in terms of the mass flow function q(M) [11]:
m = KPt
√Tt
Aq(M) (9)
K is a function of γ and R,
K =
√√√√ γ
R
(2
γ + 1
) γ+1γ−1
(10)
where γ is the ratio of specific heats, R is the gas constant. For specified γ and R, K is a constant. Pt and Tt are thetotal pressure and the total temperature, A is the area of the cross section, q(M) is the mass flow function with Manumber which can be given as:
q(M) = M
[2
γ + 1
(1 +
γ − 12
M2)] γ+1
2(γ−1)
. (11)
Based on the mass conservation law, we have:
m1 = m2 (12)
Y.L. Wu et al. / Mathematical and Computer Modelling 48 (2008) 447–467 459
(a) Total pressure distribution. (b) Axial velocity.
(c) Circumferential cross flow velocity. (d) Mach number.
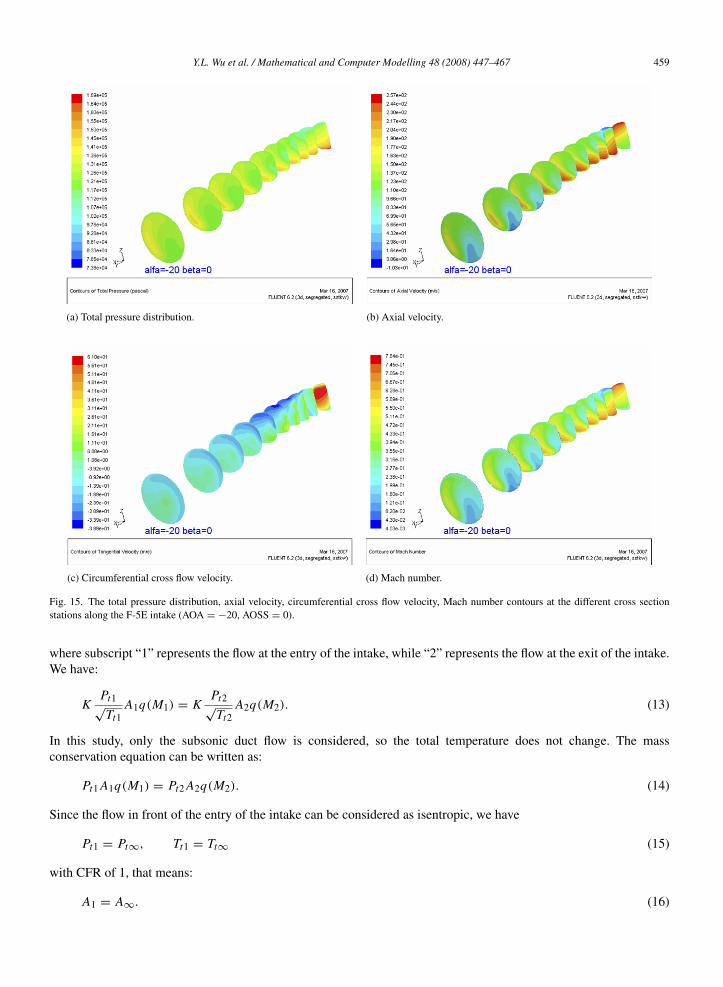
Fig. 15. The total pressure distribution, axial velocity, circumferential cross flow velocity, Mach number contours at the different cross sectionstations along the F-5E intake (AOA = −20, AOSS = 0).
where subscript “1” represents the flow at the entry of the intake, while “2” represents the flow at the exit of the intake.We have:
KPt1
√Tt1
A1q(M1) = KPt2
√Tt2
A2q(M2). (13)
In this study, only the subsonic duct flow is considered, so the total temperature does not change. The massconservation equation can be written as:
Pt1 A1q(M1) = Pt2 A2q(M2). (14)
Since the flow in front of the entry of the intake can be considered as isentropic, we have
Pt1 = Pt∞, Tt1 = Tt∞ (15)
with CFR of 1, that means:
A1 = A∞. (16)

460 Y.L. Wu et al. / Mathematical and Computer Modelling 48 (2008) 447–467
(a) Total pressure distribution. (b) Axial velocity.
(c) Circumferential cross flow velocity. (d) Mach number.
Fig. 16. The total pressure distribution, axial velocity, circumferential cross flow velocity, Mach number contours at the different cross sectionstations along the F-5E intake (AOA = −10, AOSS = 0).
Table 1Flow conditions of port side intake
Pressure p∞ (Pa) 101325Temperature T∞ (K) 288Mach number Ma 0.6Angles of attack α 0◦,±4◦,±10◦,±20◦
Angles of sideslip β 0◦,±4◦,±10◦,±20◦
At this stage, an estimation of the pressure recovery across the intake should be made along with the determination ofthe free stream Mach number (normally, PR for subsonic flow in the intake is within the range 0.96–0.98). Then it ispossible to determine the Mach number at the engine face, and the static pressure at the exit can then be obtained.
4. Numerical results and discussions
In this study, we choose the port side intake. The flow conditions are given in Table 1.Figs. 5 and 6 illustrate the predicted results as listed in Table 2. It is found that the loss total pressure, the distortion
index (DC(60)) and the swirl flow index (SC(60)) all increase when the AOA or AOSS increases. For cases with

Y.L. Wu et al. / Mathematical and Computer Modelling 48 (2008) 447–467 461
(a) Total pressure distribution. (b) Axial velocity.
(c) Circumferential cross flow velocity. (d) Mach number.
Fig. 17. The total pressure distribution, axial velocity, circumferential cross flow velocity, Mach number contours at the different cross sectionstations along the F-5E intake (AOA = −4, AOSS = 0).
Table 2Metrics of intake performance and swirl flow for different α and β
PR DC(60) SC(60)
α = 0◦, β = 0◦ 0.9881 0.3143 0.0317α = −4◦, β = 0◦ 0.9880 0.4221 0.0366α = −10◦, β = 0◦ 0.9860 0.5756 0.0684α = −20◦, β = 0◦ 0.9776 0.7213 0.1283α = 4◦, β = 0◦ 0.9880 0.3275 0.0372α = 10◦, β = 0◦ 0.9869 0.5359 0.0392α = 20◦, β = 0◦ 0.9815 0.7267 0.0695α = 0◦, β = −4◦ 0.9884 0.5073 0.0365α = 0◦, β = −10◦ 0.9857 0.6794 0.0359α = 0◦, β = −20 0.9766 0.7630 0.0419α = 0◦, β = 4◦ 0.9878 0.1462 0.0271α = 0◦, β = 10◦ 0.9863 0.1731 0.0428α = 0◦, β = 20◦ 0.9833 0.7477 0.0451

462 Y.L. Wu et al. / Mathematical and Computer Modelling 48 (2008) 447–467
(a) Total pressure distribution. (b) Axial velocity.
(c) Circumferential cross flow velocity. (d) Mach number.
Fig. 18. The total pressure distribution, axial velocity, circumferential cross flow velocity, Mach number contours at the different cross sectionstations along the F-5E intake (AOA = 20, AOSS = 0).
large angles of AOA and AOSS, the Pressure Recovery (PR) drops steeply and DC and SC increase dramatically. Itindicates that a large flow separation occurs in the duct. However, the significant change in the value does not occuruntil the angle of incidence exceeds 10◦. This conclusion is the same as that drawn by Guo and Seddon [12]. Theeffects of AOA and AOSS are not the same. The F-5E intake is more sensitive to AOA, especially for the angle largerthan 10◦.
Figs. 7–10 show the contours of total pressure distributions at the exit plane of the intake. It is found that with theincrease in the angles of AOA and AOSS, the distributions of total pressure are deviated from being symmetric. Itcontributes to the rise of the DC(60). It also indicates that there is a large flow separation which may occur in the ductthat is responsible for the loss of the total pressure.
Figs. 11–14 present the vectors of velocity on the plane of the exit. It can be clearly seen from the figures thatat zero incidence, the F-5E intake, as an S-duct, creates a twin swirl at AIP. The twin swirl model seems to be verystable. It exists for most of the cases. This implies that the twin swirl is determined by the S-duct geometry frame(cross section shape, curvature, etc.) itself. With the increase in the angles of AOA and AOSS (both negative andpositive), the bulk swirl component becomes stronger and obvious.
It is found that the F-5E intake at the port side is very sensitive to the negative angles of AOA and AOSS. Insome cases with a large negative angle, such as the AOA of −20◦ and the AOSS of −20◦, the very strong bulk swirldominates the swirl flow in the AIP. It is found that for a negative large AOA and a negative large AOSS, the bulk swirl
Y.L. Wu et al. / Mathematical and Computer Modelling 48 (2008) 447–467 463
(a) Total pressure distribution. (b) Axial velocity.
(c) Circumferential cross flow velocity. (d) Mach number.
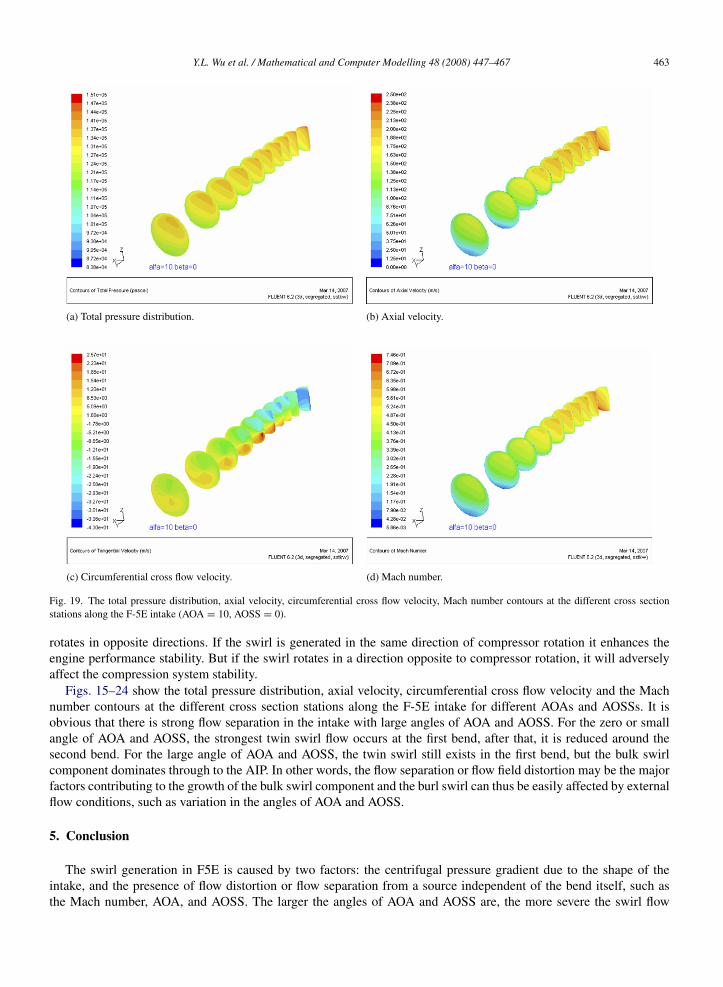
Fig. 19. The total pressure distribution, axial velocity, circumferential cross flow velocity, Mach number contours at the different cross sectionstations along the F-5E intake (AOA = 10, AOSS = 0).
rotates in opposite directions. If the swirl is generated in the same direction of compressor rotation it enhances theengine performance stability. But if the swirl rotates in a direction opposite to compressor rotation, it will adverselyaffect the compression system stability.
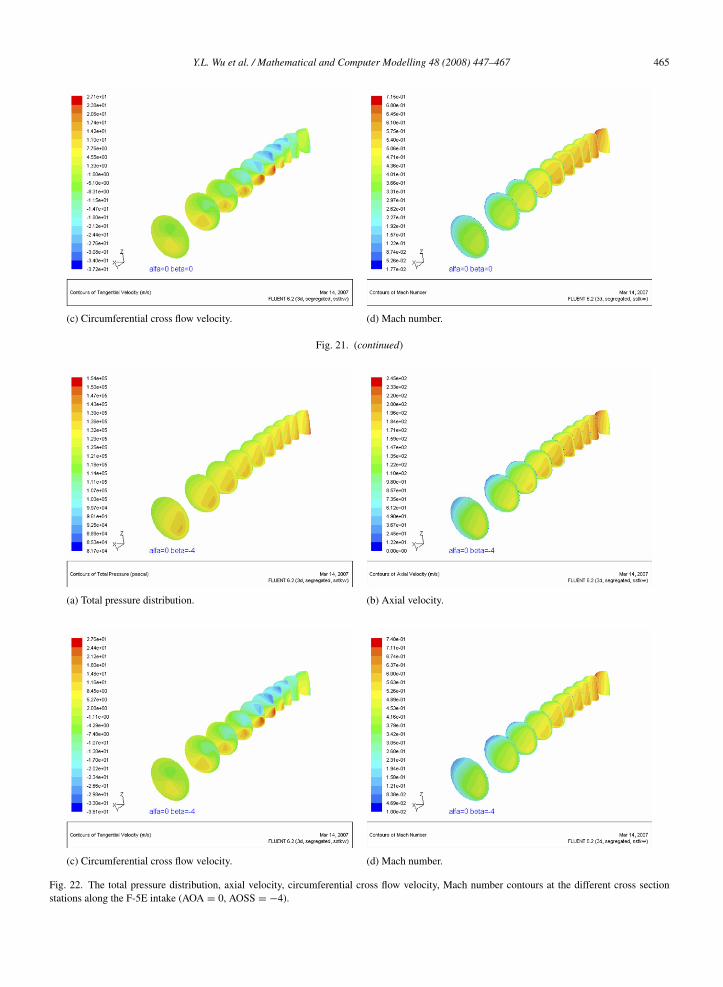
Figs. 15–24 show the total pressure distribution, axial velocity, circumferential cross flow velocity and the Machnumber contours at the different cross section stations along the F-5E intake for different AOAs and AOSSs. It isobvious that there is strong flow separation in the intake with large angles of AOA and AOSS. For the zero or smallangle of AOA and AOSS, the strongest twin swirl flow occurs at the first bend, after that, it is reduced around thesecond bend. For the large angle of AOA and AOSS, the twin swirl still exists in the first bend, but the bulk swirlcomponent dominates through to the AIP. In other words, the flow separation or flow field distortion may be the majorfactors contributing to the growth of the bulk swirl component and the burl swirl can thus be easily affected by externalflow conditions, such as variation in the angles of AOA and AOSS.
5. Conclusion
The swirl generation in F5E is caused by two factors: the centrifugal pressure gradient due to the shape of theintake, and the presence of flow distortion or flow separation from a source independent of the bend itself, such asthe Mach number, AOA, and AOSS. The larger the angles of AOA and AOSS are, the more severe the swirl flow

464 Y.L. Wu et al. / Mathematical and Computer Modelling 48 (2008) 447–467
(a) Total pressure distribution. (b) Axial velocity.
(c) Circumferential cross flow velocity. (d) Mach number.
Fig. 20. The total pressure distribution, axial velocity, circumferential cross flow velocity, Mach number contours at the different cross sectionstations along the F-5E intake (AOA = 4, AOSS = 0).
(a) Total pressure distribution. (b) Axial velocity.
Fig. 21. The total pressure distribution, axial velocity, circumferential cross flow velocity, Mach number contours at the different cross sectionstations along the F-5E intake (AOA = 0, AOSS = 0).
Y.L. Wu et al. / Mathematical and Computer Modelling 48 (2008) 447–467 465
(c) Circumferential cross flow velocity. (d) Mach number.
Fig. 21. (continued)
(a) Total pressure distribution. (b) Axial velocity.
(c) Circumferential cross flow velocity. (d) Mach number.
Fig. 22. The total pressure distribution, axial velocity, circumferential cross flow velocity, Mach number contours at the different cross sectionstations along the F-5E intake (AOA = 0, AOSS = −4).

466 Y.L. Wu et al. / Mathematical and Computer Modelling 48 (2008) 447–467
(a) Total pressure distribution. (b) Axial velocity.
(c) Circumferential cross flow velocity. (d) Mach number.
Fig. 23. The total pressure distribution, axial velocity, circumferential cross flow velocity, Mach number contours at the different cross sectionstations along the F-5E intake (AOA = 0, AOSS = −10).
(a) Total pressure distribution. (b) Axial velocity.
Fig. 24. The total pressure distribution, axial velocity, circumferential cross flow velocity, Mach number contours at the different cross sectionstations along the F-5E intake (AOA = 0, AOSS = −20).

Y.L. Wu et al. / Mathematical and Computer Modelling 48 (2008) 447–467 467
(c) Circumferential cross flow velocity. (d) Mach number.
Fig. 24. (continued)
generation will be. The swirl represents a form of energy loss, as the energy is used for accelerating the flow in theangular direction and does not contribute to the engine thrust. The development of swirl and distortion with the intakeincidence is always accompanied by the drop of the total pressure recovery. In the cases with large negative anglesof AOA and AOSS where the large flow separation occurs, the very strong bulk swirl dominates the swirl flow in theAIP, and poses a major threat of stall or even surge for the compressor.
References
[1] F. Aulehla, Intake swirl-A major disturbance parameter in engine/intake compatibility, in: 13th congress of ICAS/AIAA, August Seattle, 1982pp. 1415-1424 (ICAS-82-4.8.1).
[2] J. Seddon, E.L. Goldsmith, Intake Aerodynamics, 2nd ed., AIAA Education Series, Oxford, UK, 1999.[3] G.C. Yang, The study of S-type intake, Journal of Aeronautics and Astronautics 1 (2000) 1–6 (in Chinese).[4] E.S. Taskinoglu, V. Jovanovic, D.D. Knight, Design optimization for submerged inlets-Part II, in: 21st Applied Aerodynamics Conference,
23–26 June, 2003, Orlando, Florida (AIAA 2003-3926), 2003.[5] F-5E master dimensions report, Northrop corporation Aircraft division.[6] Pro/E, wildfire 2.0 User’s Guide, Parametric Technology Corporation. http://www.ptc.com.[7] FLUENT 6.2 User’s Guide. FLUENT Inc., 2005. http://www.fluent.com.[8] F.R. Menter, Zonal two equation Kappa–Omega turbulence models for aerodynamic flows, (AIAA paper 93-2906), 1993.[9] D.C. Wilcox, Turbulence Modeling for CFD, DCW industries, Inc., La Canada, CA, 1994.
[10] R.D.D. Menzies, K.J. Badcock, G.N. Barakos, B.E. Richards, Validation of the simulation of flow in an S-Duct, in: 20th AppliedAerodynamics Conference, 24–27 June 2002, St. Louis, Missouri (AIAA-2002-2808), 2002.
[11] The fundamentals of aerodynamics, in: Text book of Nanjing University of Aeronautics and Astronautics, Nanjing, P.R. China, 1992 (InChinese).
[12] R.W. Guo, J. Seddon, The swirl in an S-duct inlet of typical air intake proportions, Aeronautical Quarterly 34 (1983) 99–129.