Numerical Simulation of the Influence of Pore Structure on ... · Numerical Simulation of the...
18
Running title: Numerical Simulation of Resistivity in Tight Sandstone Numerical Simulation of the Influence of Pore Structure on Resistivity, Formation Factor and Cementation Index in Tight Sandstone WU Feng 1, 2, 3, * , WEN Zhu 4 , YAO Cong 3 , WANG Xianhu 5 , XI Yanping 3 and CONG Linlin 3 1 State Key Laboratory of Oil and Gas Reservoir Geology and Exploitation, Southwest Petroleum University, Chengdu 610500, Sichuan, China; 2 Shandong Provincial Key Laboratory of Depositional Mineralization & Sedimentary Mineral, Shandong University of Science and Technology, Qingdao 266590, Shandong, China; 3 School of Geoscience and Technology, Southwest Petroleum University, Chengdu 610500, Sichuan, China; 4 No.1 Mudlogging Company, Bohai Drilling Engineering Company, China National Petroleum Corporation, Tianjing 300280, China; 5 Logging research institution of Xinjiang branch, China National Petroleum Corporation, Karamay 834000, Xinjiang, China. Abstract: Tight sandstone, with severe diagenesis and complex pore structure, differs greatly from conventional sandstone in terms of rock electrical parameters. In subsurface rock electrical experiments, various electrical parameters are confounded and can only be analyzed qualitatively. The lack of quantitative analysis for each individual electrical parameter presents a challenge for the evaluation of oil and gas saturation in tight sandstone. Based on the 2D pore-throat model and the features of pore structure in the tight sandstone of the Penglaizhen and Shaximiao Formations in the upper and middle Jurassic of the Western Sichuan Depression, this paper presents 3D micro pore-throat models for three types of tight sandstone. It proposes a finite element-based rock electrical simulation method to analyze the influence of pore structure parameters, such as throat radius and throat tortuosity, on electrical parameters such as resistivity, formation factor, and cementation index quantitatively. The research revealed the following results: (1) Throats of tight sandstone usually have lamellar or curved lamellar shapes that are slender and narrow. The lamellar throat used in the proposed pore-throat model is more consistent with the features of tight sandstone than the tubular throat used in the original model. (2) The throat determines the conductivity of tight sandstone. The throat parallel to the electric potential has the greatest influence on conductivity, and the throat perpendicular to the potential has the least influence. (3) In tight sandstone grades I to III, as the porosity decreases, the formation factor increases and the cementation index decreases. (4) The results of the rock electrical simulation are consistent with the results of the rock electrical experiment, which indicates that the proposed rock electrical simulation method of tight sandstone is effective and accurate. Key words: Western Sichuan Depression, tight sandstone, resistivity, formation factor, cementation index, numerical simulation E-mail: [email protected]; [email protected] 1 Introduction Tight sandstone has undergone intense diagenesis and formed a complex pore structure (Yang et al., 2014; Chuang ER et al., 2015; Li et al., 2017; Wang et al., 2017). It differs greatly from conventional sandstone in terms of rock electrical parameters, usually with apparent non-Archie phenomena (You Lijun et al., 2016; Hu Shengfu et al., 2017). Many scholars have studied regularities in the rock electrical parameters of tight sandstone and have made some advancements in understanding (Hilfan and Zuhar, 2011; Cai et al., 2017). These studies have analyzed the qualitative effects of factors such as microfabric, pore structure, wettability, temperature and pressure on rock electrical parameters; however, since various factors that affect the electrical parameters of subsurface rock samples are easily confounded, it is difficult to make quantitative analyses of each single factor. This characteristic seriously affects logging data-based quantitative evaluations of the oil and gas saturation of tight sandstone. The current general understanding of the rock electrical parameters of tight sandstone are that they are mainly affected by pore structure. Some scholars have tried to use numerical simulation methods to study the influence of pore structure parameters on rock electrical parameters (Ziarani and Aguilera, 2012; Liu Tangyan et al., 2013; This article is protected by copyright. All rights reserved. This article has been accepted for publication and undergone full peer review but has not been through the copyediting, typesetting, pagination and proofreading process, which may lead to differences between this version and the Version of Record. Please cite this article as doi: 10.1111/1755-6724.14306.
Transcript of Numerical Simulation of the Influence of Pore Structure on ... · Numerical Simulation of the...
Running title: Numerical Simulation of Resistivity in Tight Sandstone
Numerical Simulation of the Influence of Pore Structure on Resistivity,
Formation Factor and Cementation Index in Tight Sandstone
WU Feng1, 2, 3, *
, WEN Zhu4, YAO Cong
3, WANG Xianhu
5, XI Yanping
3 and CONG Linlin
3
1 State Key Laboratory of Oil and Gas Reservoir Geology and Exploitation, Southwest Petroleum University, Chengdu
610500, Sichuan, China;
2 Shandong Provincial Key Laboratory of Depositional Mineralization & Sedimentary Mineral, Shandong University of
Science and Technology, Qingdao 266590, Shandong, China;
3 School of Geoscience and Technology, Southwest Petroleum University, Chengdu 610500, Sichuan, China;
4 No.1 Mudlogging Company, Bohai Drilling Engineering Company, China National Petroleum Corporation, Tianjing
300280, China;
5 Logging research institution of Xinjiang branch, China National Petroleum Corporation, Karamay 834000, Xinjiang,
China.
Abstract: Tight sandstone, with severe diagenesis and complex pore structure, differs greatly from conventional sandstone
in terms of rock electrical parameters. In subsurface rock electrical experiments, various electrical parameters are
confounded and can only be analyzed qualitatively. The lack of quantitative analysis for each individual electrical parameter
presents a challenge for the evaluation of oil and gas saturation in tight sandstone. Based on the 2D pore-throat model and
the features of pore structure in the tight sandstone of the Penglaizhen and Shaximiao Formations in the upper and middle
Jurassic of the Western Sichuan Depression, this paper presents 3D micro pore-throat models for three types of tight
sandstone. It proposes a finite element-based rock electrical simulation method to analyze the influence of pore structure
parameters, such as throat radius and throat tortuosity, on electrical parameters such as resistivity, formation factor, and
cementation index quantitatively. The research revealed the following results: (1) Throats of tight sandstone usually have
lamellar or curved lamellar shapes that are slender and narrow. The lamellar throat used in the proposed pore-throat model is
more consistent with the features of tight sandstone than the tubular throat used in the original model. (2) The throat
determines the conductivity of tight sandstone. The throat parallel to the electric potential has the greatest influence on
conductivity, and the throat perpendicular to the potential has the least influence. (3) In tight sandstone grades I to III, as the
porosity decreases, the formation factor increases and the cementation index decreases. (4) The results of the rock electrical
simulation are consistent with the results of the rock electrical experiment, which indicates that the proposed rock electrical
simulation method of tight sandstone is effective and accurate.
Key words: Western Sichuan Depression, tight sandstone, resistivity, formation factor, cementation index, numerical
simulation
E-mail: [email protected]; [email protected]
1 Introduction
Tight sandstone has undergone intense diagenesis and formed a complex pore structure (Yang et al., 2014; Chuang ER et al., 2015; Li et al., 2017; Wang et al., 2017). It differs greatly from conventional sandstone in terms of rock electrical parameters, usually with apparent non-Archie phenomena (You Lijun et al., 2016; Hu Shengfu et al., 2017). Many scholars have studied regularities in the rock electrical parameters of tight sandstone and have made some advancements in understanding (Hilfan and Zuhar, 2011; Cai et al., 2017). These studies have analyzed the qualitative effects of factors such as microfabric, pore structure, wettability, temperature and pressure on rock electrical parameters; however, since various factors that affect the electrical parameters of subsurface rock samples are easily confounded, it is difficult to make quantitative analyses of each single factor. This characteristic seriously affects logging data-based quantitative evaluations of the oil and gas saturation of tight sandstone.
The current general understanding of the rock electrical parameters of tight sandstone are that they are mainly affected by pore structure. Some scholars have tried to use numerical simulation methods to study the influence of pore structure parameters on rock electrical parameters (Ziarani and Aguilera, 2012; Liu Tangyan et al., 2013;
This article is protected by copyright. All rights reserved.
This article has been accepted for publication and undergone full peer review but has not been
through the copyediting, typesetting, pagination and proofreading process, which may lead to
differences between this version and the Version of Record. Please cite this article as doi:
10.1111/1755-6724.14306.
Ghanbarian and Berg, 2017; Yan et al., 2018). The advantage of the numerical simulation method is that pore-throat models with specific parameters for pore structure can be constructed to allow calculation of rock electrical parameters and then perform quantitative analysis. Two things matter most in rock electrical research: selecting the simulation method and building the pore-throat model. Usually, numerical simulation methods used in rock electrical research include the Kirchhoff Electric Current method (Kong Qiangfu et al., 2015), the Lattice Boltzmann method (Yue Wenzheng et al., 2004), the random walk method (Yoshito and Tsukasa, 2012) and the finite element method (Toumelin and Torres-Verdin, 2008; Abousrafa et al., 2009; Liu Xuefeng et al., 2009). Among these, the finite element method, which has a complete theoretical basis for simulating the electrical characteristics of rocks, is the classic method. It can successfully and precisely handle complex boundary problems, which has led to its adoption by increasing numbers of scholars. There are two types of commonly used pore-throat models. One is a model incorporating information on the pore structure of real rock samples, such as 2D models using micro-imaging and 3D models scanned by CT (Zhu Honglin et al., 2018). This method achieves greater generalization of the pore structure but poises difficulties in quantitative analyses of each single factor. The other method is based on a simplified model of the real pore structure, such as the capillary model (Gates and Leitz, 1950; Choo and Burns, 2014; Wu et al., 2016) and the sphere-capillary model (Abousrafa et al., 2009; Liu Tangbiao et al., 2013). This method is more suitable for the quantitative analyses of each single factor, but there is still room for improvement. For example, in the capillary model, pore structure parameters such as the throat radius and the throat tortuosity are taken into consideration, but the pore space and the throat space are not distinguished. The sphere-capillary model divides the rock pores into two parts—the spherical pore and the capillary pore—which characterizes the relationship and connectivity between pores and throats, but the shape of throat is too simple, and the model fails to accurately reflect the complex pore structure of tight sandstone.
This paper proposes a finite element-based numerical simulation method for the rock electrical parameters of tight sandstone in order to make quantitative analyses of the effects of pore structure parameters on resistivity, formation factor and cementation index. The result of this research can provide a theoretical basis for the quantitative evaluation of fluid discrimination and the calculation of oil and gas saturation in tight sandstone.
2 Geological Background
Located in the Western Sichuan Basin, the Western Sichuan Depression is on the northwest edge of the Yangtzi Plate and adjacent to the Longmenshan Anterior Margin Nappe Structure Belt to the west. Evolving from a passive continental margin basin to a confined foreland basin in the Indo-Chinese epoch, then from an analogous foreland basin in the Yanshan epoch to a structurally relict basin in Himalaya epoch, the Western Sichuan Depression has formed 6 secondary tectonic units, including the Anxian-Yazihe-Dayi Fault-fold Belt, the Zitong Depression, the Xiaoquan-Fenggu Structure Belt, the Chengdu Depression, the Zhixinchang-Longbaoliang Structure Belt and the Longmenshan Anterior Margin Nappe Structure Belt (Fig. 1) (Cheng Dongxia et al., 2016). Since the end of late Triassic period, the Western Sichuan Depression has begun to develop into a foreland basin with thick deposits of Triassic-Jurassic-Cretaceous terrigenous clastic strata. A large number of dense gas reservoirs have been discovered in the Xujiahe Formation of the Triassic, and in the Shaximiao and Penglaizhen Formations of the Jurassic (Meng Wanbin, 2011; Liu et al., 2017; Zou Caineng et al., 2018). This paper mainly studied the tight sandstone of the Shaximiao and Penlaizhen Formations of the Jurassic, focusing on the Maijing-Shifang-Xinchang structure.
This article is protected by copyright. All rights reserved.
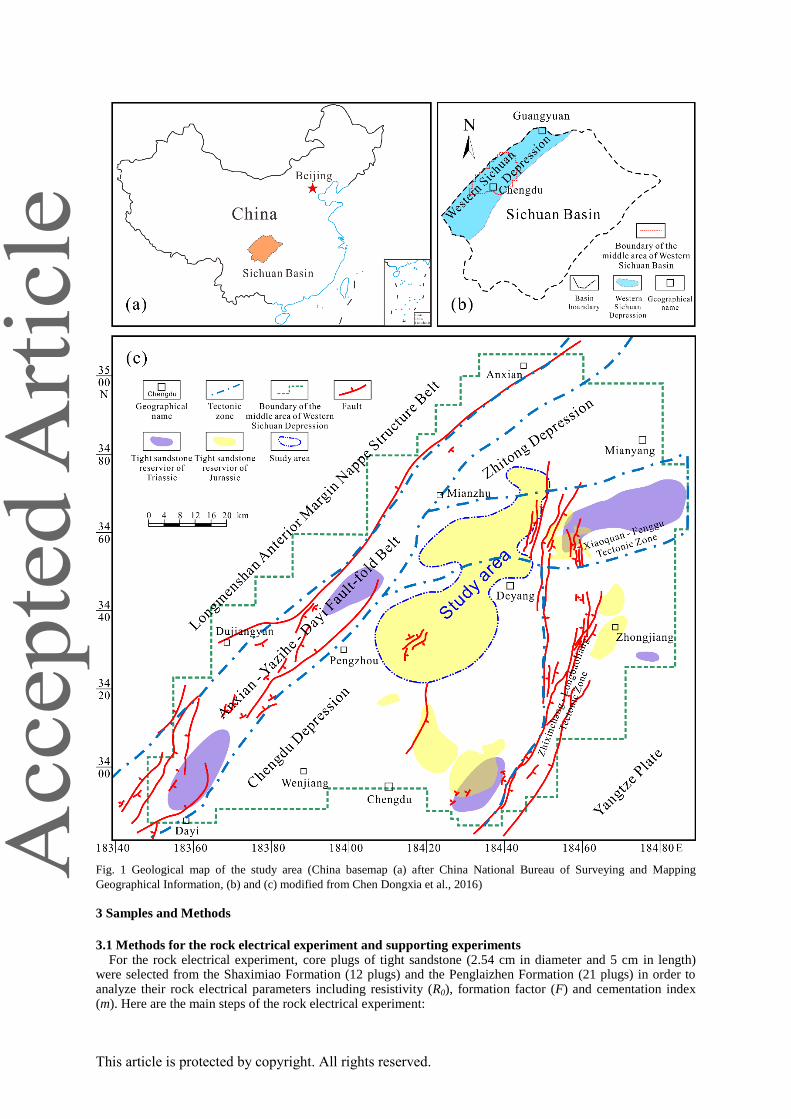
Fig. 1 Geological map of the study area (China basemap (a) after China National Bureau of Surveying and Mapping
Geographical Information, (b) and (c) modified from Chen Dongxia et al., 2016)
3 Samples and Methods
3.1 Methods for the rock electrical experiment and supporting experiments For the rock electrical experiment, core plugs of tight sandstone (2.54 cm in diameter and 5 cm in length)
were selected from the Shaximiao Formation (12 plugs) and the Penglaizhen Formation (21 plugs) in order to analyze their rock electrical parameters including resistivity (R0), formation factor (F) and cementation index (m). Here are the main steps of the rock electrical experiment:
This article is protected by copyright. All rights reserved.
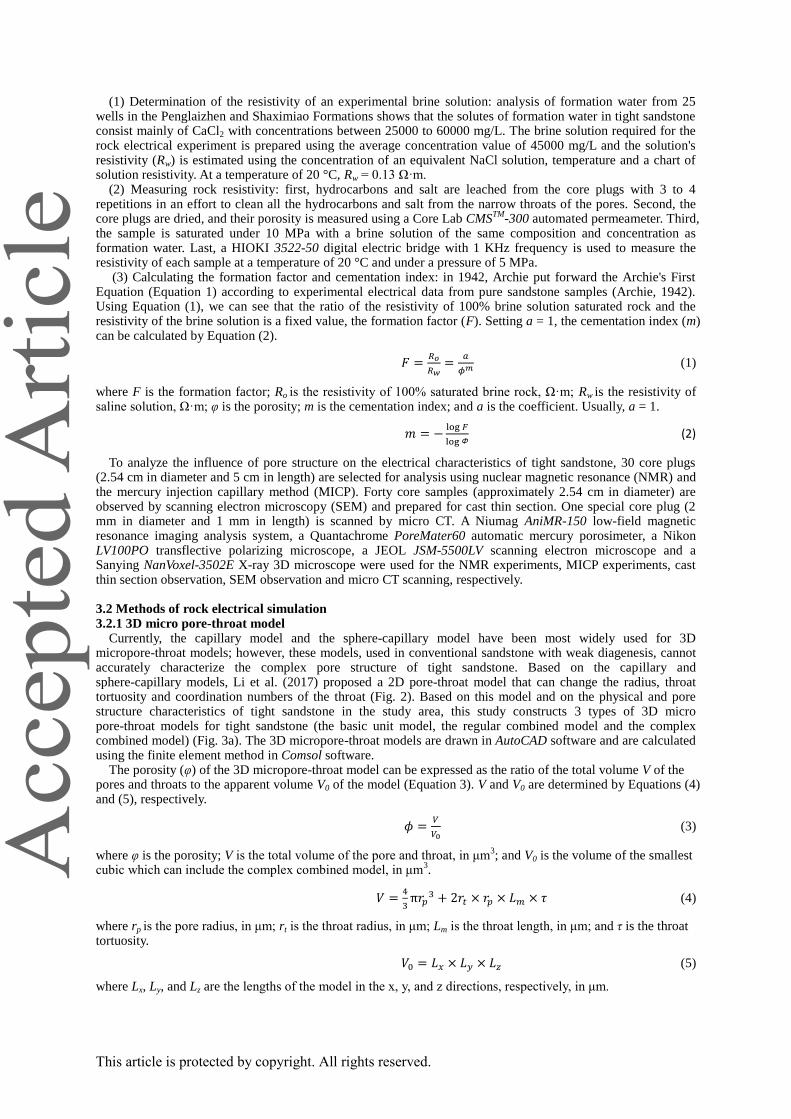
(1) Determination of the resistivity of an experimental brine solution: analysis of formation water from 25 wells in the Penglaizhen and Shaximiao Formations shows that the solutes of formation water in tight sandstone consist mainly of CaCl2 with concentrations between 25000 to 60000 mg/L. The brine solution required for the rock electrical experiment is prepared using the average concentration value of 45000 mg/L and the solution's resistivity (Rw) is estimated using the concentration of an equivalent NaCl solution, temperature and a chart of solution resistivity. At a temperature of 20 °C, Rw = 0.13 Ω·m.
(2) Measuring rock resistivity: first, hydrocarbons and salt are leached from the core plugs with 3 to 4 repetitions in an effort to clean all the hydrocarbons and salt from the narrow throats of the pores. Second, the core plugs are dried, and their porosity is measured using a Core Lab CMS
TM-300 automated permeameter. Third,
the sample is saturated under 10 MPa with a brine solution of the same composition and concentration as formation water. Last, a HIOKI 3522-50 digital electric bridge with 1 KHz frequency is used to measure the resistivity of each sample at a temperature of 20 °C and under a pressure of 5 MPa.
(3) Calculating the formation factor and cementation index: in 1942, Archie put forward the Archie's First Equation (Equation 1) according to experimental electrical data from pure sandstone samples (Archie, 1942). Using Equation (1), we can see that the ratio of the resistivity of 100% brine solution saturated rock and the resistivity of the brine solution is a fixed value, the formation factor (F). Setting a = 1, the cementation index (m) can be calculated by Equation (2).
𝐹 =𝑅𝑜
𝑅𝑤=
𝑎
𝜙𝑚 (1)
where F is the formation factor; Ro is the resistivity of 100% saturated brine rock, Ω·m; Rw is the resistivity of saline solution, Ω·m; φ is the porosity; m is the cementation index; and a is the coefficient. Usually, a = 1.
𝑚 = −log 𝐹
logФ (2)
To analyze the influence of pore structure on the electrical characteristics of tight sandstone, 30 core plugs (2.54 cm in diameter and 5 cm in length) are selected for analysis using nuclear magnetic resonance (NMR) and the mercury injection capillary method (MICP). Forty core samples (approximately 2.54 cm in diameter) are observed by scanning electron microscopy (SEM) and prepared for cast thin section. One special core plug (2 mm in diameter and 1 mm in length) is scanned by micro CT. A Niumag AniMR-150 low-field magnetic resonance imaging analysis system, a Quantachrome PoreMater60 automatic mercury porosimeter, a Nikon LV100PO transflective polarizing microscope, a JEOL JSM-5500LV scanning electron microscope and a Sanying NanVoxel-3502E X-ray 3D microscope were used for the NMR experiments, MICP experiments, cast thin section observation, SEM observation and micro CT scanning, respectively.
3.2 Methods of rock electrical simulation 3.2.1 3D micro pore-throat model
Currently, the capillary model and the sphere-capillary model have been most widely used for 3D micropore-throat models; however, these models, used in conventional sandstone with weak diagenesis, cannot accurately characterize the complex pore structure of tight sandstone. Based on the capillary and sphere-capillary models, Li et al. (2017) proposed a 2D pore-throat model that can change the radius, throat tortuosity and coordination numbers of the throat (Fig. 2). Based on this model and on the physical and pore structure characteristics of tight sandstone in the study area, this study constructs 3 types of 3D micro pore-throat models for tight sandstone (the basic unit model, the regular combined model and the complex combined model) (Fig. 3a). The 3D micropore-throat models are drawn in AutoCAD software and are calculated using the finite element method in Comsol software.
The porosity (φ) of the 3D micropore-throat model can be expressed as the ratio of the total volume V of the pores and throats to the apparent volume V0 of the model (Equation 3). V and V0 are determined by Equations (4) and (5), respectively.
𝜙 =𝑉
𝑉0 (3)
where φ is the porosity; V is the total volume of the pore and throat, in μm3; and V0 is the volume of the smallest
cubic which can include the complex combined model, in μm3.
𝑉 =4
3π𝑟𝑝
3 + 2𝑟𝑡 × 𝑟𝑝 × 𝐿𝑚 × 𝜏 (4)
where rp is the pore radius, in μm; rt is the throat radius, in μm; Lm is the throat length, in μm; and τ is the throat tortuosity.
𝑉0 = 𝐿𝑥 × 𝐿𝑦 × 𝐿𝑧 (5)
where Lx, Ly, and Lz are the lengths of the model in the x, y, and z directions, respectively, in μm.
This article is protected by copyright. All rights reserved.
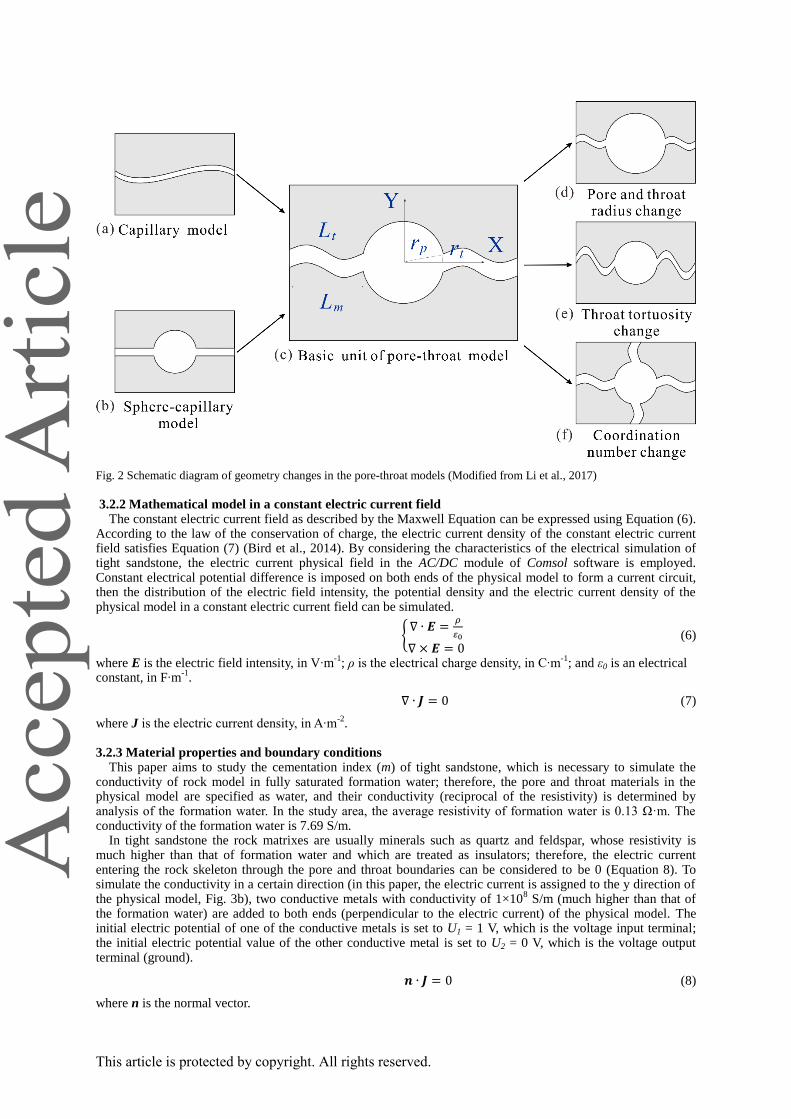
Fig. 2 Schematic diagram of geometry changes in the pore-throat models (Modified from Li et al., 2017)
3.2.2 Mathematical model in a constant electric current field
The constant electric current field as described by the Maxwell Equation can be expressed using Equation (6). According to the law of the conservation of charge, the electric current density of the constant electric current field satisfies Equation (7) (Bird et al., 2014). By considering the characteristics of the electrical simulation of tight sandstone, the electric current physical field in the AC/DC module of Comsol software is employed. Constant electrical potential difference is imposed on both ends of the physical model to form a current circuit, then the distribution of the electric field intensity, the potential density and the electric current density of the physical model in a constant electric current field can be simulated.
{∇ ∙ 𝑬 =
𝜌
𝜀0
∇ × 𝑬 = 0 (6)
where E is the electric field intensity, in V∙m-1
; ρ is the electrical charge density, in C∙m-1
; and ε0 is an electrical constant, in F∙m
-1.
∇ ∙ 𝑱 = 0 (7)
where J is the electric current density, in A∙m-2
. 3.2.3 Material properties and boundary conditions
This paper aims to study the cementation index (m) of tight sandstone, which is necessary to simulate the conductivity of rock model in fully saturated formation water; therefore, the pore and throat materials in the physical model are specified as water, and their conductivity (reciprocal of the resistivity) is determined by analysis of the formation water. In the study area, the average resistivity of formation water is 0.13 Ω·m. The conductivity of the formation water is 7.69 S/m.
In tight sandstone the rock matrixes are usually minerals such as quartz and feldspar, whose resistivity is much higher than that of formation water and which are treated as insulators; therefore, the electric current entering the rock skeleton through the pore and throat boundaries can be considered to be 0 (Equation 8). To simulate the conductivity in a certain direction (in this paper, the electric current is assigned to the y direction of the physical model, Fig. 3b), two conductive metals with conductivity of 1×10
8 S/m (much higher than that of
the formation water) are added to both ends (perpendicular to the electric current) of the physical model. The initial electric potential of one of the conductive metals is set to U1 = 1 V, which is the voltage input terminal; the initial electric potential value of the other conductive metal is set to U2 = 0 V, which is the voltage output terminal (ground).
𝒏 ∙ 𝑱 = 0 (8)
where n is the normal vector.
This article is protected by copyright. All rights reserved.
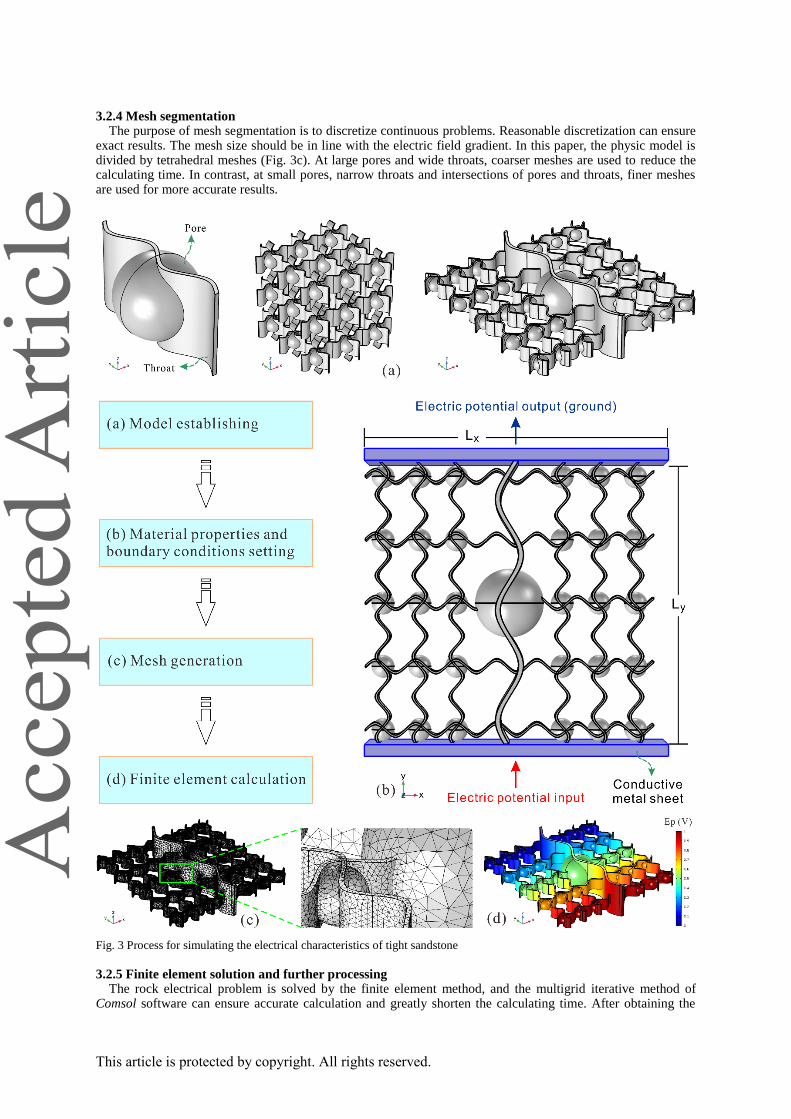
3.2.4 Mesh segmentation
The purpose of mesh segmentation is to discretize continuous problems. Reasonable discretization can ensure exact results. The mesh size should be in line with the electric field gradient. In this paper, the physic model is divided by tetrahedral meshes (Fig. 3c). At large pores and wide throats, coarser meshes are used to reduce the calculating time. In contrast, at small pores, narrow throats and intersections of pores and throats, finer meshes are used for more accurate results.
Fig. 3 Process for simulating the electrical characteristics of tight sandstone 3.2.5 Finite element solution and further processing
The rock electrical problem is solved by the finite element method, and the multigrid iterative method of Comsol software can ensure accurate calculation and greatly shorten the calculating time. After obtaining the
This article is protected by copyright. All rights reserved.
distribution of electric field intensity, potential density and electric current density of the physical model, the resistivity (R0), formation factor (F) and cementation index (m) are further refined by postprocessing.
According to Ohm's Law, the resistivity (R0) of the physical model can be calculated by Equation (9), and then formation factor (F) and cementation index (m) can be calculated by Equations (10) and (11), respectively. In Equation (9), the geometrical factor (kg) of physical models is related to the size and relative position of the electrode. It can be expressed by Equation (10). In this paper, the electric potential is imposed in the y direction (Fig. 3b), so the geometrical factor (kg) can be expressed by Equation (11). According to the law of the conservation of charge, in a constant electric current field all the electric currents passing through the plane perpendicular to the direction of potential are equal, so the electric current (I) in Equation (9) can be estimated by the integral of normal electric current density (Equation 12) at the electric potential input or the electric potential output.
𝑅0 = 𝑘𝑔𝑈1−𝑈2
𝐼 (9)
where U1 and U2 are the electric potential values at input and output, in V ; I is the electric current, in A; and kg is the geometrical factor of the physical model.
𝑘𝑔 =𝑆
𝐿 (10)
where S is the cross-sectional area of the physical model (perpendicular to the direction of electric potential), in μm
2; and L is the length of the model (parallel to the direction of electric potential), in μm.
𝑘𝑔 =𝐿𝑥𝐿𝑧
𝐿𝑦 (11)
𝐼 = ∬ 𝐽𝑛𝑆∙ d𝑆 (12)
where n is the x, y or z direction. In this paper, n is the y direction. 4 Results 4.1 Analysis of factors influencing the electrical characteristics of tight sandstone
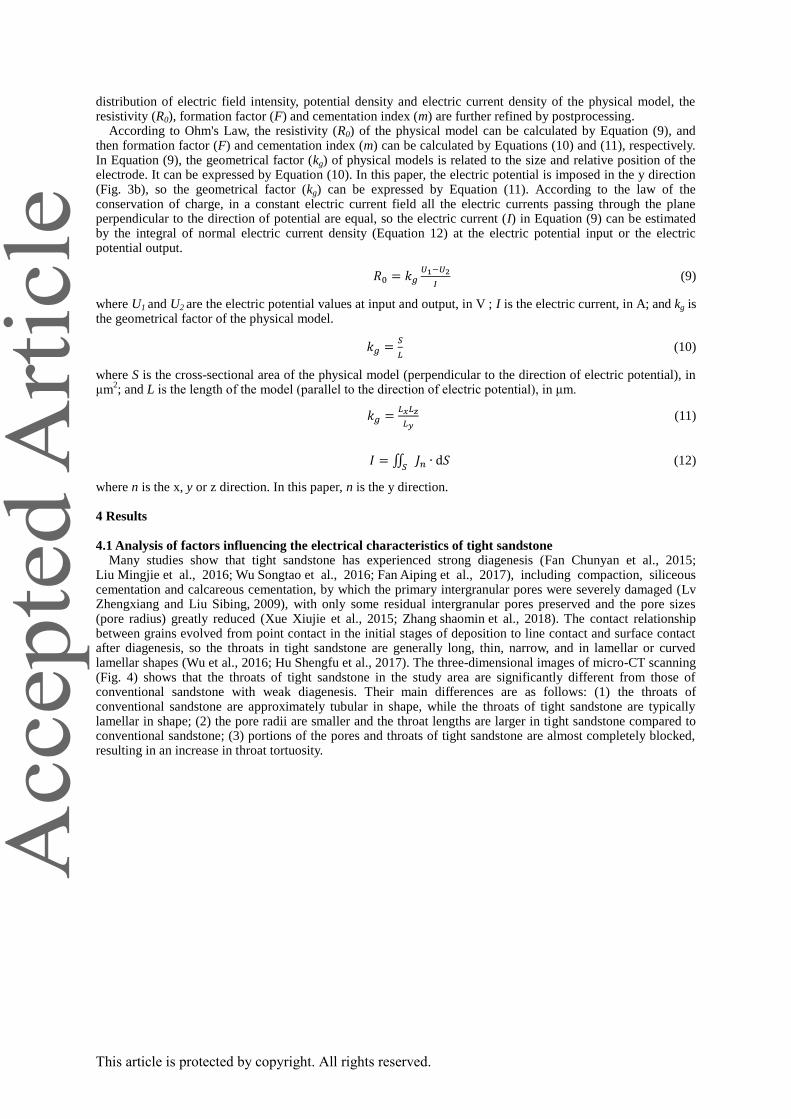
Many studies show that tight sandstone has experienced strong diagenesis (Fan Chunyan et al., 2015; Liu Mingjie et al., 2016; Wu Songtao et al., 2016; Fan Aiping et al., 2017), including compaction, siliceous cementation and calcareous cementation, by which the primary intergranular pores were severely damaged (Lv Zhengxiang and Liu Sibing, 2009), with only some residual intergranular pores preserved and the pore sizes (pore radius) greatly reduced (Xue Xiujie et al., 2015; Zhang shaomin et al., 2018). The contact relationship between grains evolved from point contact in the initial stages of deposition to line contact and surface contact after diagenesis, so the throats in tight sandstone are generally long, thin, narrow, and in lamellar or curved lamellar shapes (Wu et al., 2016; Hu Shengfu et al., 2017). The three-dimensional images of micro-CT scanning (Fig. 4) shows that the throats of tight sandstone in the study area are significantly different from those of conventional sandstone with weak diagenesis. Their main differences are as follows: (1) the throats of conventional sandstone are approximately tubular in shape, while the throats of tight sandstone are typically lamellar in shape; (2) the pore radii are smaller and the throat lengths are larger in tight sandstone compared to conventional sandstone; (3) portions of the pores and throats of tight sandstone are almost completely blocked, resulting in an increase in throat tortuosity.
This article is protected by copyright. All rights reserved.
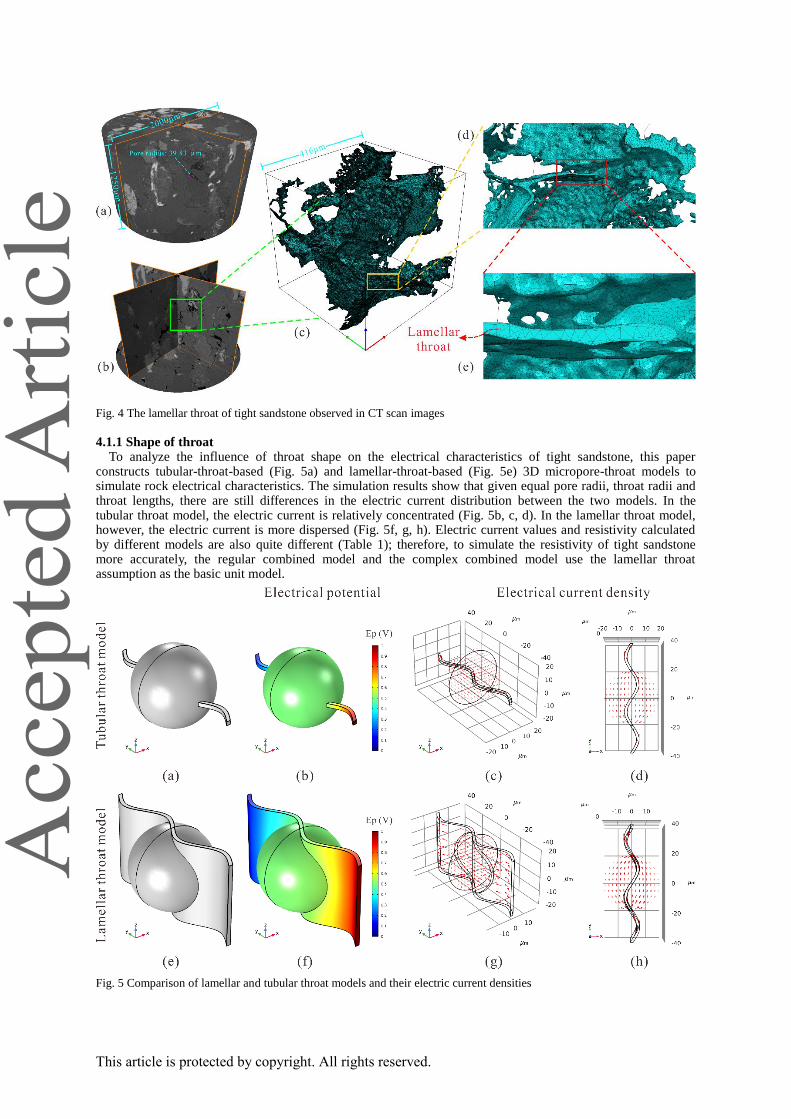
Fig. 4 The lamellar throat of tight sandstone observed in CT scan images 4.1.1 Shape of throat
To analyze the influence of throat shape on the electrical characteristics of tight sandstone, this paper constructs tubular-throat-based (Fig. 5a) and lamellar-throat-based (Fig. 5e) 3D micropore-throat models to simulate rock electrical characteristics. The simulation results show that given equal pore radii, throat radii and throat lengths, there are still differences in the electric current distribution between the two models. In the tubular throat model, the electric current is relatively concentrated (Fig. 5b, c, d). In the lamellar throat model, however, the electric current is more dispersed (Fig. 5f, g, h). Electric current values and resistivity calculated by different models are also quite different (Table 1); therefore, to simulate the resistivity of tight sandstone more accurately, the regular combined model and the complex combined model use the lamellar throat assumption as the basic unit model.
Fig. 5 Comparison of lamellar and tubular throat models and their electric current densities
This article is protected by copyright. All rights reserved.
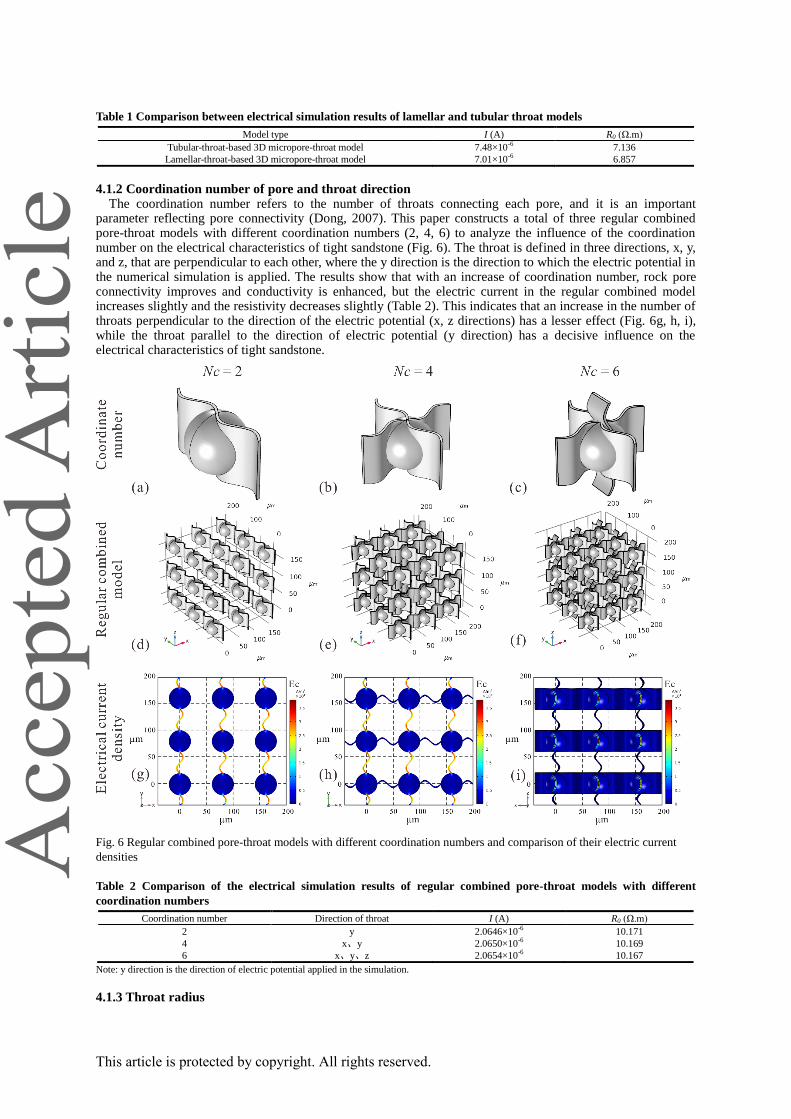
Table 1 Comparison between electrical simulation results of lamellar and tubular throat models
Model type I (A) R0 (Ω.m)
Tubular-throat-based 3D micropore-throat model 7.48×10⁻⁶
7.136
Lamellar-throat-based 3D micropore-throat model 7.01×10⁻⁶
6.857
4.1.2 Coordination number of pore and throat direction
The coordination number refers to the number of throats connecting each pore, and it is an important parameter reflecting pore connectivity (Dong, 2007). This paper constructs a total of three regular combined pore-throat models with different coordination numbers (2, 4, 6) to analyze the influence of the coordination number on the electrical characteristics of tight sandstone (Fig. 6). The throat is defined in three directions, x, y, and z, that are perpendicular to each other, where the y direction is the direction to which the electric potential in the numerical simulation is applied. The results show that with an increase of coordination number, rock pore connectivity improves and conductivity is enhanced, but the electric current in the regular combined model increases slightly and the resistivity decreases slightly (Table 2). This indicates that an increase in the number of throats perpendicular to the direction of the electric potential (x, z directions) has a lesser effect (Fig. 6g, h, i), while the throat parallel to the direction of electric potential (y direction) has a decisive influence on the electrical characteristics of tight sandstone.
Fig. 6 Regular combined pore-throat models with different coordination numbers and comparison of their electric current
densities
Table 2 Comparison of the electrical simulation results of regular combined pore-throat models with different
coordination numbers
Coordination number Direction of throat I (A) R0 (Ω.m)
2 y 2.0646×10⁻⁶
10.171
4 x、y 2.0650×10⁻⁶
10.169
6 x、y、z 2.0654×10⁻⁶
10.167
Note: y direction is the direction of electric potential applied in the simulation.
4.1.3 Throat radius
This article is protected by copyright. All rights reserved.
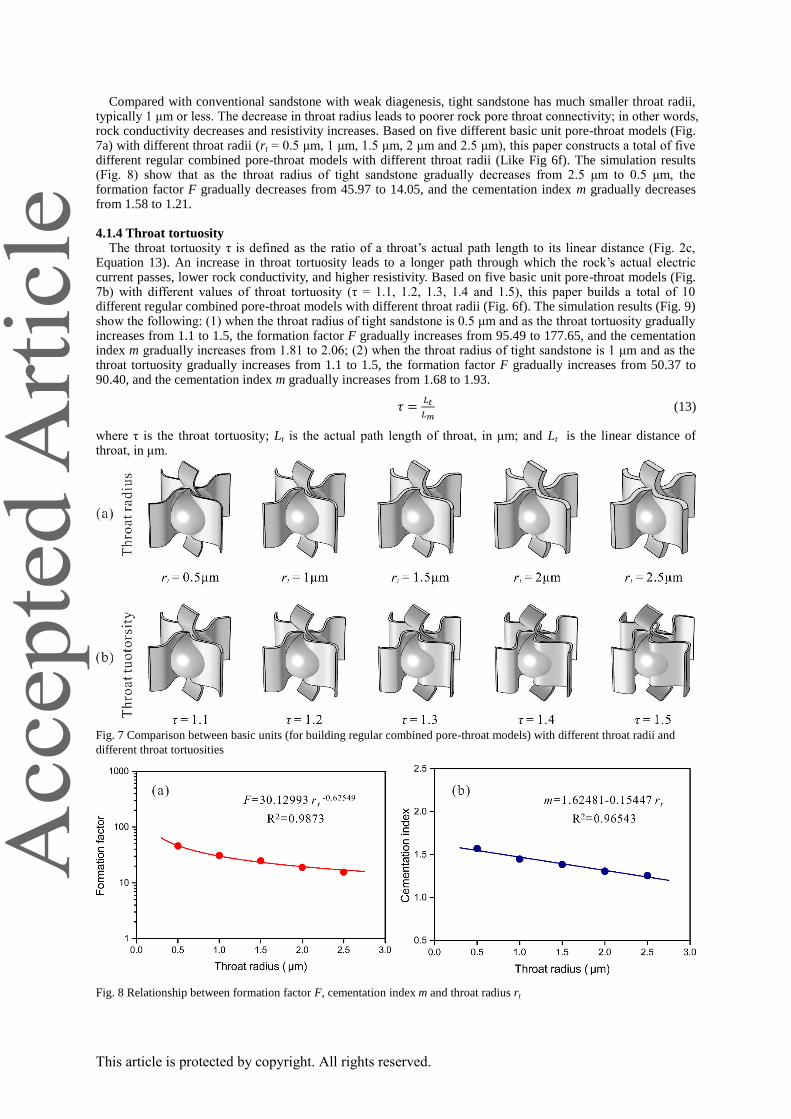
Compared with conventional sandstone with weak diagenesis, tight sandstone has much smaller throat radii, typically 1 μm or less. The decrease in throat radius leads to poorer rock pore throat connectivity; in other words, rock conductivity decreases and resistivity increases. Based on five different basic unit pore-throat models (Fig. 7a) with different throat radii (rt = 0.5 μm, 1 μm, 1.5 μm, 2 μm and 2.5 μm), this paper constructs a total of five different regular combined pore-throat models with different throat radii (Like Fig 6f). The simulation results (Fig. 8) show that as the throat radius of tight sandstone gradually decreases from 2.5 μm to 0.5 μm, the formation factor F gradually decreases from 45.97 to 14.05, and the cementation index m gradually decreases from 1.58 to 1.21.
4.1.4 Throat tortuosity
The throat tortuosity τ is defined as the ratio of a throat’s actual path length to its linear distance (Fig. 2c, Equation 13). An increase in throat tortuosity leads to a longer path through which the rock’s actual electric current passes, lower rock conductivity, and higher resistivity. Based on five basic unit pore-throat models (Fig. 7b) with different values of throat tortuosity (τ = 1.1, 1.2, 1.3, 1.4 and 1.5), this paper builds a total of 10 different regular combined pore-throat models with different throat radii (Fig. 6f). The simulation results (Fig. 9) show the following: (1) when the throat radius of tight sandstone is 0.5 μm and as the throat tortuosity gradually increases from 1.1 to 1.5, the formation factor F gradually increases from 95.49 to 177.65, and the cementation index m gradually increases from 1.81 to 2.06; (2) when the throat radius of tight sandstone is 1 μm and as the throat tortuosity gradually increases from 1.1 to 1.5, the formation factor F gradually increases from 50.37 to 90.40, and the cementation index m gradually increases from 1.68 to 1.93.
𝜏 =𝐿𝑡
𝐿𝑚 (13)
where τ is the throat tortuosity; Lt is the actual path length of throat, in μm; and Lt is the linear distance of throat, in μm.
Fig. 7 Comparison between basic units (for building regular combined pore-throat models) with different throat radii and
different throat tortuosities
Fig. 8 Relationship between formation factor F, cementation index m and throat radius rt
This article is protected by copyright. All rights reserved.
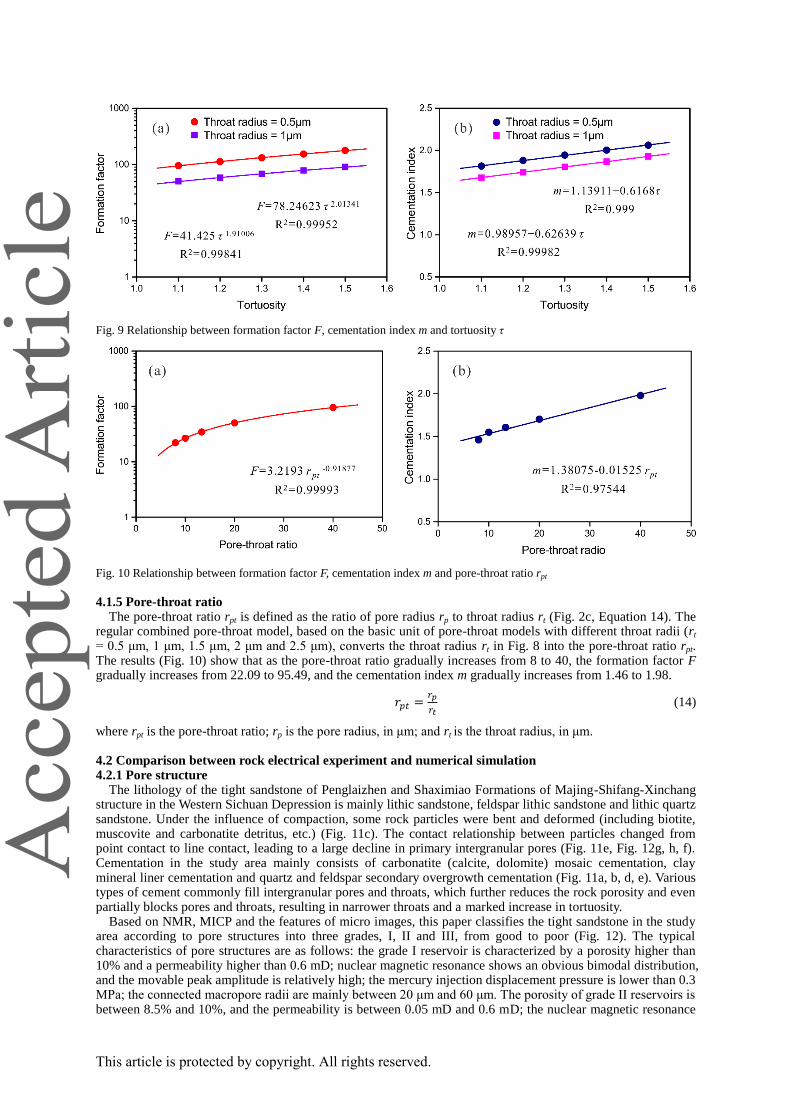
Fig. 9 Relationship between formation factor F, cementation index m and tortuosity τ
Fig. 10 Relationship between formation factor F, cementation index m and pore-throat ratio rpt
4.1.5 Pore-throat ratio
The pore-throat ratio rpt is defined as the ratio of pore radius rp to throat radius rt (Fig. 2c, Equation 14). The regular combined pore-throat model, based on the basic unit of pore-throat models with different throat radii (rt = 0.5 μm, 1 μm, 1.5 μm, 2 μm and 2.5 μm), converts the throat radius rt in Fig. 8 into the pore-throat ratio rpt. The results (Fig. 10) show that as the pore-throat ratio gradually increases from 8 to 40, the formation factor F gradually increases from 22.09 to 95.49, and the cementation index m gradually increases from 1.46 to 1.98.
𝑟𝑝𝑡 =𝑟𝑝
𝑟𝑡 (14)
where rpt is the pore-throat ratio; rp is the pore radius, in μm; and rt is the throat radius, in μm. 4.2 Comparison between rock electrical experiment and numerical simulation 4.2.1 Pore structure
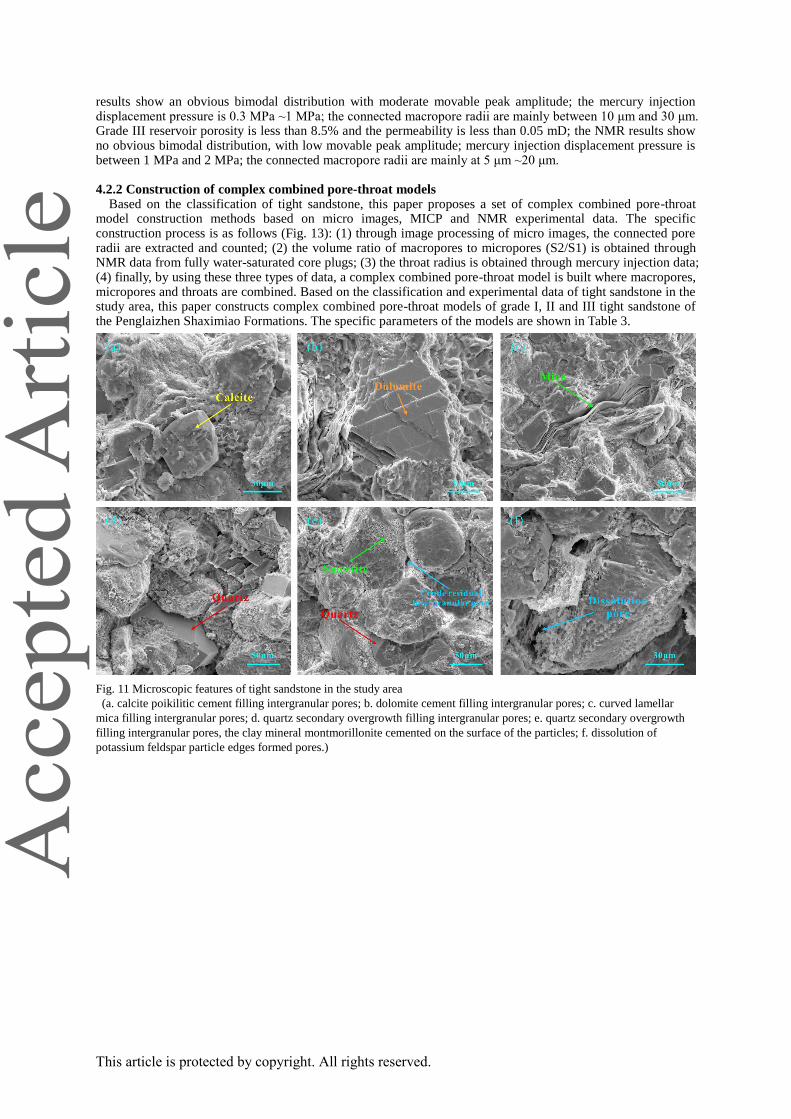
The lithology of the tight sandstone of Penglaizhen and Shaximiao Formations of Majing-Shifang-Xinchang structure in the Western Sichuan Depression is mainly lithic sandstone, feldspar lithic sandstone and lithic quartz sandstone. Under the influence of compaction, some rock particles were bent and deformed (including biotite, muscovite and carbonatite detritus, etc.) (Fig. 11c). The contact relationship between particles changed from point contact to line contact, leading to a large decline in primary intergranular pores (Fig. 11e, Fig. 12g, h, f). Cementation in the study area mainly consists of carbonatite (calcite, dolomite) mosaic cementation, clay mineral liner cementation and quartz and feldspar secondary overgrowth cementation (Fig. 11a, b, d, e). Various types of cement commonly fill intergranular pores and throats, which further reduces the rock porosity and even partially blocks pores and throats, resulting in narrower throats and a marked increase in tortuosity.
Based on NMR, MICP and the features of micro images, this paper classifies the tight sandstone in the study area according to pore structures into three grades, I, II and III, from good to poor (Fig. 12). The typical characteristics of pore structures are as follows: the grade I reservoir is characterized by a porosity higher than 10% and a permeability higher than 0.6 mD; nuclear magnetic resonance shows an obvious bimodal distribution, and the movable peak amplitude is relatively high; the mercury injection displacement pressure is lower than 0.3 MPa; the connected macropore radii are mainly between 20 μm and 60 μm. The porosity of grade II reservoirs is between 8.5% and 10%, and the permeability is between 0.05 mD and 0.6 mD; the nuclear magnetic resonance
This article is protected by copyright. All rights reserved.
results show an obvious bimodal distribution with moderate movable peak amplitude; the mercury injection displacement pressure is 0.3 MPa ~1 MPa; the connected macropore radii are mainly between 10 μm and 30 μm. Grade III reservoir porosity is less than 8.5% and the permeability is less than 0.05 mD; the NMR results show no obvious bimodal distribution, with low movable peak amplitude; mercury injection displacement pressure is between 1 MPa and 2 MPa; the connected macropore radii are mainly at 5 μm ~20 μm.
4.2.2 Construction of complex combined pore-throat models
Based on the classification of tight sandstone, this paper proposes a set of complex combined pore-throat model construction methods based on micro images, MICP and NMR experimental data. The specific construction process is as follows (Fig. 13): (1) through image processing of micro images, the connected pore radii are extracted and counted; (2) the volume ratio of macropores to micropores (S2/S1) is obtained through NMR data from fully water-saturated core plugs; (3) the throat radius is obtained through mercury injection data; (4) finally, by using these three types of data, a complex combined pore-throat model is built where macropores, micropores and throats are combined. Based on the classification and experimental data of tight sandstone in the study area, this paper constructs complex combined pore-throat models of grade I, II and III tight sandstone of the Penglaizhen Shaximiao Formations. The specific parameters of the models are shown in Table 3.
Fig. 11 Microscopic features of tight sandstone in the study area
(a. calcite poikilitic cement filling intergranular pores; b. dolomite cement filling intergranular pores; c. curved lamellar
mica filling intergranular pores; d. quartz secondary overgrowth filling intergranular pores; e. quartz secondary overgrowth
filling intergranular pores, the clay mineral montmorillonite cemented on the surface of the particles; f. dissolution of
potassium feldspar particle edges formed pores.)
This article is protected by copyright. All rights reserved.
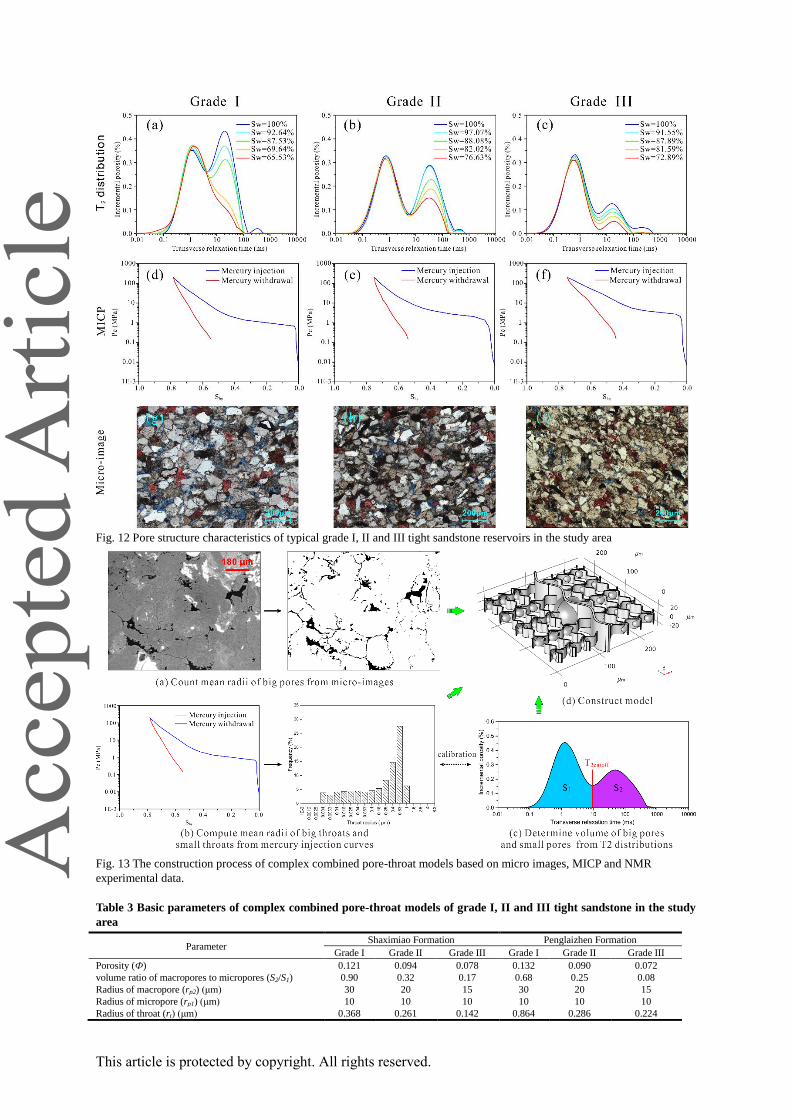
Fig. 12 Pore structure characteristics of typical grade I, II and III tight sandstone reservoirs in the study area
Fig. 13 The construction process of complex combined pore-throat models based on micro images, MICP and NMR
experimental data.
Table 3 Basic parameters of complex combined pore-throat models of grade I, II and III tight sandstone in the study
area
Parameter Shaximiao Formation Penglaizhen Formation
Grade I Grade II Grade III Grade I Grade II Grade III
Porosity (Ф) 0.121 0.094 0.078 0.132 0.090 0.072
volume ratio of macropores to micropores (S2/S1) 0.90 0.32 0.17 0.68 0.25 0.08
Radius of macropore (rp2) (μm) 30 20 15 30 20 15
Radius of micropore (rp1) (μm) 10 10 10 10 10 10
Radius of throat (rt) (μm) 0.368 0.261 0.142 0.864 0.286 0.224
This article is protected by copyright. All rights reserved.
4.2.3 Comparison of rock electrical parameters
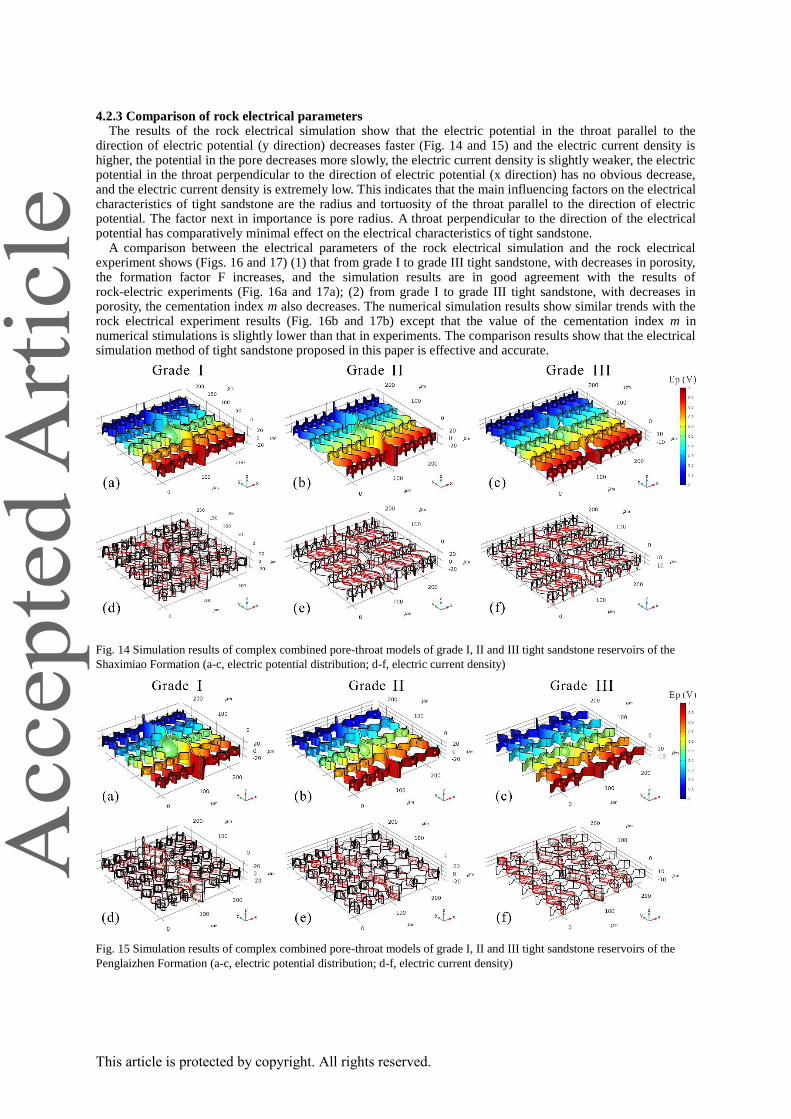
The results of the rock electrical simulation show that the electric potential in the throat parallel to the direction of electric potential (y direction) decreases faster (Fig. 14 and 15) and the electric current density is higher, the potential in the pore decreases more slowly, the electric current density is slightly weaker, the electric potential in the throat perpendicular to the direction of electric potential (x direction) has no obvious decrease, and the electric current density is extremely low. This indicates that the main influencing factors on the electrical characteristics of tight sandstone are the radius and tortuosity of the throat parallel to the direction of electric potential. The factor next in importance is pore radius. A throat perpendicular to the direction of the electrical potential has comparatively minimal effect on the electrical characteristics of tight sandstone.
A comparison between the electrical parameters of the rock electrical simulation and the rock electrical experiment shows (Figs. 16 and 17) (1) that from grade I to grade III tight sandstone, with decreases in porosity, the formation factor F increases, and the simulation results are in good agreement with the results of rock-electric experiments (Fig. 16a and 17a); (2) from grade I to grade III tight sandstone, with decreases in porosity, the cementation index m also decreases. The numerical simulation results show similar trends with the rock electrical experiment results (Fig. 16b and 17b) except that the value of the cementation index m in numerical stimulations is slightly lower than that in experiments. The comparison results show that the electrical simulation method of tight sandstone proposed in this paper is effective and accurate.
Fig. 14 Simulation results of complex combined pore-throat models of grade I, II and III tight sandstone reservoirs of the
Shaximiao Formation (a-c, electric potential distribution; d-f, electric current density)
Fig. 15 Simulation results of complex combined pore-throat models of grade I, II and III tight sandstone reservoirs of the
Penglaizhen Formation (a-c, electric potential distribution; d-f, electric current density)
This article is protected by copyright. All rights reserved.
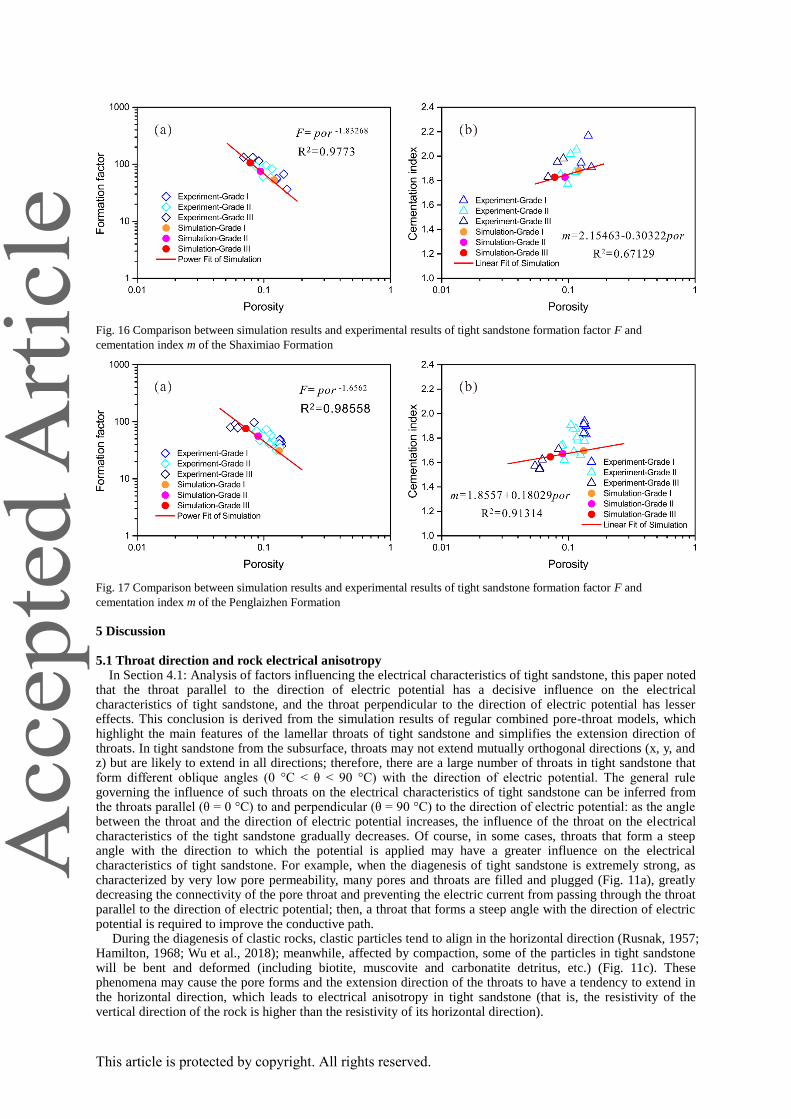
Fig. 16 Comparison between simulation results and experimental results of tight sandstone formation factor F and
cementation index m of the Shaximiao Formation
Fig. 17 Comparison between simulation results and experimental results of tight sandstone formation factor F and
cementation index m of the Penglaizhen Formation
5 Discussion 5.1 Throat direction and rock electrical anisotropy
In Section 4.1: Analysis of factors influencing the electrical characteristics of tight sandstone, this paper noted that the throat parallel to the direction of electric potential has a decisive influence on the electrical characteristics of tight sandstone, and the throat perpendicular to the direction of electric potential has lesser effects. This conclusion is derived from the simulation results of regular combined pore-throat models, which highlight the main features of the lamellar throats of tight sandstone and simplifies the extension direction of throats. In tight sandstone from the subsurface, throats may not extend mutually orthogonal directions (x, y, and z) but are likely to extend in all directions; therefore, there are a large number of throats in tight sandstone that form different oblique angles (0 °C < θ < 90 °C) with the direction of electric potential. The general rule governing the influence of such throats on the electrical characteristics of tight sandstone can be inferred from the throats parallel (θ = 0 °C) to and perpendicular (θ = 90 °C) to the direction of electric potential: as the angle between the throat and the direction of electric potential increases, the influence of the throat on the electrical characteristics of the tight sandstone gradually decreases. Of course, in some cases, throats that form a steep angle with the direction to which the potential is applied may have a greater influence on the electrical characteristics of tight sandstone. For example, when the diagenesis of tight sandstone is extremely strong, as characterized by very low pore permeability, many pores and throats are filled and plugged (Fig. 11a), greatly decreasing the connectivity of the pore throat and preventing the electric current from passing through the throat parallel to the direction of electric potential; then, a throat that forms a steep angle with the direction of electric potential is required to improve the conductive path.
During the diagenesis of clastic rocks, clastic particles tend to align in the horizontal direction (Rusnak, 1957; Hamilton, 1968; Wu et al., 2018); meanwhile, affected by compaction, some of the particles in tight sandstone will be bent and deformed (including biotite, muscovite and carbonatite detritus, etc.) (Fig. 11c). These phenomena may cause the pore forms and the extension direction of the throats to have a tendency to extend in the horizontal direction, which leads to electrical anisotropy in tight sandstone (that is, the resistivity of the vertical direction of the rock is higher than the resistivity of its horizontal direction).
This article is protected by copyright. All rights reserved.
5.2 Research prospects
Although this paper proposes an effective and accurate numerical simulation method for the electrical characteristics of tight sandstone, many aspects of the problem still need further study. In the future, research teams may wish to consider avenues of rock electrical research that (1) analyze the influence of pore types in tight sandstone (residual primary intergranular pores, dissolution pores, microcracks, etc.) and the effect of pore shape on electrical characteristics; (2) analyze the influence on the electrical characteristics of film-like clay minerals on the pore surfaces; (3) manipulate the water saturation in pores and analyze the resulting variation of the resistivity index I and the saturation index n of tight sandstone.
6 Conclusions
(1) This paper proposes a rock electrical simulation method. This method is based on the physical properties and pore structure parameters of tight sandstone, constructs its 3D micro pore-throat model (basic unit model, regular combined model, complex combined model), uses the Maxwell equation of constant electric current field and finite element method to solve the distribution of electric potential and electric current density, and finally calculates the resistivity R0, formation factor F and cementation index m of tight sandstone.
(2) After tight sandstone experiences strong diagenesis, the size and form of its pores and throats are greatly changed. The throats of tight sandstone are generally long, thin and narrow in a lamellar or curved lamellar shape. This paper substitutes a lamellar throat for the tubular throat used in previous models, which is more in line with the throat characteristics of tight sandstone, and analyzes the influence of the throat on electrical characteristics by adjusting the extension direction of the throat, throat radius and throat tortuosity.
(3) Pore throats have a decisive influence on the electrical characteristics of tight sandstone: throats parallel to the direction of electric potential have the greatest influence on the electrical characteristics, and throats perpendicular to the direction of electric potential have the least influence; as the throat radius gradually decreases from 2.5 μm to 0.5 μm, the formation factor F decreases from 45.97 to 14.05 and the cementation index m decreases from 1.58 to 1.21; when the throat radius is 1 μm and as the throat tortuosity increases from 1.1 to 1.5, the formation factor F increases from 50.37 to 90.40 and the cementation index m increases from 1.68 to 1.93.
(4) Tight sandstone in the study area can be divided according to pore structure into three grades, I, II and III, from good to poor. The results of rock electrical simulations and rock electrical experiments show that from grade I to grade III tight sandstone, as the porosity decreases, the formation factor F increases and cementation index m decreases. In general, the results of rock electrical simulations and rock electrical experiments are in good agreement, indicating that the rock electrical simulation method for tight sandstone is accurate and effective.
Acknowledgements
This work is granted by the Open Fund of State Key Laboratory of Oil and Gas Reservoir Geology and
Exploitation (Southwest Petroleum University) (Grant No. PLN201719), the Open Fund of Shandong Provincial Key Laboratory of Depositional Mineralization & Sedimentary Mineral (Shandong University of Science and Technology) (Grant No. DMSM2018050), the Scientific Research Starting Project of SWPU (Grant No. 2017QHZ004) and the Preferential Funded Technological Project for Overseas Talents Returned to Sichuan Province. The supports are gratefully acknowledged. References Abousrafa E.M., Somerville J.M., Hamilton S.A., Olden, P.W.H., Smart, B.D.G., and Ford, J., 2009. Pore geometrical model
for the resistivity of brine saturated rocks. Journal of Petroleum Science and Engineering, 65(3): 113–122. Archie, G.E., 1942. The electrical resistivity log as an aid in determining some reservoir characteristics. Transactions of the
AIME. Society of Petroleum Engineers, 146: 54–62. Bird, M.B., Butler, S.L., Hawkes, C.D., and Kotzer, T., 2014. Numerical modeling of fluid and electrical currents through
geometries based on synchrotron X-ray tomographic images of reservoir rocks using Avizo and Comsol. Computers and Geosciences, 73(C): 6–16.
Cai J., Wei W., Hu X., and David A.W., 2017. Electrical conductivity models in saturated porous media: A review. Earth-Science Reviews, 171: 419–433.
Chen Dongxia, Pang Xiongqi, Yang Keming, Zhu Weiping and Yan Qingxia, 2016. Genetic Mechanism and Formation of Superimposed Continuous Tight Sandstone reservoir in Deep Xujiahe Formation in Western Sichuan Depression. Journal of Jilin University (Earth Science Edition), 46(6): 1611–1623 (in Chinese with English abstract).
Choo H., and Burns S.E., 2014. Review of Archie's equation through theoretical derivation and experimental study on uncoated and hematite coated soils. Journal of Applied Geophysics, 105: 225–234.
Chuang ER, Zhao Jingzhou, Bai Yubin, Wu Weitao, Zhang Jie and Wei Zhikun, 2015. Features of tight sandstone reservoir and origin of tightness: an example from Chang-7 Member, Triassic Yanchang Formation in Chenghao Area, Ordos Basin. Acta Geologica Sinica (English Edition), 89(s1): 25–26.
Dong, H., 2007. Micro-CT imaging and pore network extraction. London: Imperial College London (PhD thesis): 134–136. Fan Aiping, Yang Renchao, Li Jinbu, Zhao Zhongjun, and A.j. Van Loon., 2017. Siliceous cementation of chlorite-coated
grains in the Permian sandstone gas reservoirs, Ordos Basin. Acta Geologica Sinica (English Edition), 91(3): 1147–1148. Fan Chunyan, Song Yan, Jang Zhenxue, Luo Qun, Yao Limiao and Gao Xiongxiong, 2015. Characteristics and formation
This article is protected by copyright. All rights reserved.

mechanisms of tight sandstone reservoirs in the huahai depression, Jiuquan Basin. Acta Geologica Sinica (English Edition), 89(supp.): 27–28.
Gates, J.I., and Leitz, W.J., 1950. Relative permeabilities of California cores by the capillary–pressure method. In: Drilling and Production Practice. American Petroleum Institute, 285–302.
Ghanbarian, B., and Berg, C.F., 2017. Formation factor in Bentheimer and Fontainebleau sandstones: theory compared with pore–scale numerical simulations. Advances in Water Resources, 107: 139–146.
Hamilton, N., Owens, W.H., and Rees, A.I., 1968. Laboratory experiments on the production of grain orientation in shearing sand. The Journal of Geology, 76(4): 465–472.
Hu Shengfu, Zhou Cancan, Li Xia, Li Chaoliu and Zhang Shengqiang. 2017. A tight sandstone trapezoidal pore oil saturation model. Petroleum Exploration and Development, 44(5): 876–886.
Hilfan K., and Zuhar Z.T.H., 2011. Influence of pore geometry, pressure and partial water saturation to electrical properties of reservoir rock: Measurement and model development, Journal of Petroleum Science and Engineering, 78(3–4): 687–704.
Kong Qiangfu, Zhou Cancan, Li Chaoliu and Hu Falong, 2015. Numerical Simulation Method of Digital Core Electrical Property and Its Development Orientations. China Petroleum Exploration, 20(1): 69–77 (in Chinese with English abstract).
Liu Mingjie, Liu Zhen, Wang Peng and Pan Gaofeng, 2016. Diagenesis of the Triassic Yanchang Formation tight sandstone reservoir in the Xifeng - Ansai Area of Ordos Basin and its porosity evolution. Acta Geologica Sinica (English Edition), 90(3): 956–970.
Liu Tangyan, Tang Tianzhi, Du Huanhong, Zhang Haining and Wang Hongtao, 2013. Study of rock conductive mechanism based on pore structure. Chinese Journal of Geophysics. 56(8): 2818–2826 (in Chinese with English abstract).
Liu X., Sun J., and Wang H., 2009. Numerical simulation of rock electrical properties based on digital cores. Applied Geophysics, 6(1): 1–7.
Liu, Y., Hu, W., Cao, J., Wang, X., Tang, Q., Wu, H., and Kang, S., 2017. Diagenetic constraints on the heterogeneity of tight sandstone reservoirs: a case study on the upper Triassic Xujiahe formation in the Sichuan Basin, Southwest China. Marine and Petroleum Geology, 92: 650–669.
Li, W., Zou, C., Wang, H., and Peng, C., 2017. A model for calculating the formation resistivity factor in low and middle porosity sandstone formations considering the effect of pore geometry. Journal of Petroleum Science and Engineering, 152, 193–203.
Li, Y., Chang, X., Yin, W., Sun, T., and Song, T., 2017. Quantitative impact of diagenesis on reservoir quality of the Triassic Chang 6 tight oil sandstones, Zhenjing area, Ordos Basin, China. Marine and Petroleum Geology, 86: 1014–1028.
Lv Zhengxiang and Liu sibing, 2009. Ultra-tight sandstone diagenesis and mechanism for the formation of relatively high-quality reservoir of Xujiahe Group in western Sichuan, Acta petrologica sinica, 25(10): 2373–2383 (in Chinese with English abstract).
Meng Wanbin, Lv Zhengxiang, Liu Jiaduo and Cao Lie, 2011. Genesis of secondary porosity in Middle Jurassic tight sandstone in western Sichuan. Acta Petrologica Sinica, 27(8): 2371–2380 (in Chinese with English abstract).
Yang, R., Fan, A., Van Loon, A. J., Han, Z., and Wang, X., 2014. Depositional and diagenetic controls on sandstone reservoirs with low porosity and low permeability in the Eastern Sulige gas field, China. Acta Geologica Sinica (English Edition), 88(5): 1513–1534.
Yoshito N., and Tsukasa N., 2012. Steady state local diffusive fluxes in porous geo-materials obtained by pore-scale simulations. Transport in Porous Media, 93(3): 657–673.
You Lijun, Wu Xuyao, Kang Yili, Zhang Haitao and Yang Xiaoming, 2016. Non-Archie phenomenon of the tight sandstone’s electrical parameters. Progress in Geophysics, 31(5): 2226–2231 (in Chinese with English abstract).
Yue Wenzheng, Tao Guo and Zhu Keqin, 2004. Simulation of electrical properties of rock saturated with multi-phase fluids using lattice gas automation. Chinese Journal of Geophysics, 47(5): 905–910 (in Chinese with English abstract).
Rusnak, G.A., 1957. The orientation of sand grains under conditions of "unidirectional" fluid flow: 1. Theory and Experiment. The Journal of Geology, 65(4): 384–409.
Toumelin E., and Torres-Verdín C., 2008. Object-oriented approach for the pore-scale simulation of DC electrical conductivity of two-phase saturated porous media. Geophysics, 73(2): 67.
Wang, G., Chang, X., Yin, W., Li, Y., and Song, T., 2017. Impact of diagenesis on reservoir quality and heterogeneity of the Upper Triassic Chang 8 tight oil sandstones in the Zhenjing area, Ordos Basin, China. Marine and Petroleum Geology, 83: 84–96.
Wu, F., Fan, Q., Huang, D., Ma, L., Liang, X., and Sima, L., 2016. Predicting gas–water relative permeability using nuclear magnetic resonance and mercury injection capillary pressure measurements. Journal of Natural Gas Science and Engineering, 32: 35–47.
Wu, F., Hurst, A., and Grippa, A., 2018. Grain and pore microtexture in sandstone sill and depositional sandstone reservoirs: preliminary insights. Petroleum Geoscience, 24(2): 236–243.
Wu Songtao, Zou Caineng, Zhu Rukai, Yao Jingli, Tao Shizhen, Yang Zhi, Zhai Xiufen, Cui Jingwei and Lin Senhu, 2016. Characteristics and origin of tight oil accumulations in the Upper Triassic Yanchang Formation of the Ordos Basin, North-Central China. Acta Geologica Sinica (English Edition), 90(5): 1821–1837.
Xue Xiujie, Cao Yingchang, Wang Jian, Xi Kelai and Zhang Qingqing, 2015. Characteristics of micro pore-throat of tight oil reservoir in Permian Lucaogou Formation, Jimsar Sag. Acta Geologica Sinica (English Edition), 89(supp.): 112–113.
Yan, W., Sun, J., Zhang, J., Yuan, W., Zhang, L., Cui, L., and Dong, H., 2018. Studies of electrical properties of low resistivity sandstones based on digital rock technology. Journal of Geophysics and Engineering, 15: 153–163.
Ziarani, A.S., and Aguilera, R., 2012. Pore–throat radius and tortuosity estimation from formation resistivity data for tight–gas sandstone reservoirs. Journal of Applied Geophysics, 83(6): 65–73.
Zou Caineng, Tao Shizhen, Han Wenxue, Zhao Zhenyu, Ma Weijiao, Li Changwei, Bai Bin and Gao Xiaohui, 2018. Geological and geochemical characteristics and exploration prospect of coal–derived tight sandstone gas in china: case study of the Ordos, Sichuan, and Tarim Basins. Acta Geologica Sinica (English Edition). 90(4): 1609–1626.
Zhang shaomin, Cao Yingchang, Jens Jahren, Zhu Rukai, Mao Zhiguo, Xi Kelai, Kashif Muhammad and Helge Hellevang, 2018. Pore characteristics of the fine–grained tight reservoirs in the Yabulai Basin, Northwestern China. Acta Geologica Sinica (English Edition), 92(3): 1170–1192.
Zhu Honglin, Wang Shoufeng, Yin Guojun, Chen Qiao, Xu Fenglin, Peng Wei, Tan Yanhu and Zhang Kuo, 2018. Study of the numerical simulation of tight sandstone gas molecular diffusion based on digital core technology. Petroleum Science, 15: 68–76.
About the first author
This article is protected by copyright. All rights reserved.

WU Feng, male, born in 1983 in Gong’an Country, Hubei Province; Ph.D., graduated from Southwest Petroleum University;
visiting scholar in department of geology and petroleum geology, university of Aberdeen, UK in 2016-2017; his current
research interests include Principle and geological application of well logging, petrophysics and evaluation of
unconventional reservoir (tight sandstone, fractured and cavernous carbonate reservoir, and shale gas). Email:
[email protected]; [email protected]
About the corresponding author WU Feng, male, born in 1983 in Gong’an Country, Hubei Province; Ph.D., graduated from Southwest Petroleum University;
visiting scholar in department of geology and petroleum geology, university of Aberdeen, UK in 2016-2017; his current
research interests include Principle and geological application of well logging, petrophysics and evaluation of
unconventional reservoir (tight sandstone, fractured and cavernous carbonate reservoir, and shale gas). Email:
[email protected]; [email protected]
This article is protected by copyright. All rights reserved.