Process Design for Closed-die Forging of Bevel Gear by Finite Element Analyses
DOI: http://dx.doi.org/10.1590/1516-1439.273114Materials Research. 2015; 18(1): 92-97 © 2015
*e-mail: [email protected]
Numerical Simulation of Hot Closed Die Forging of a Low Carbon Steel Coupled with Microstructure Evolution
A. L. I. Moraesa*, O. Balancina
aUniversidade Federal de São Carlos – UFSCar, São Carlos, SP, Brasil
Received: February 12, 2014; Revised: June 24, 2014
Hot closed die forging is a regular process applied to manufacture metallic components used in supporting and fixing cable conductors in electric power transmission lines. In this forming process, the final microstructure of the workpiece depends on the control of several processing parameters. In this study, simulation of the industrial forging process of a ball hook component was performed using the finite element software DEFORM-3D following the thermomechanical procedures coupled with microstructure evolution. This simulation allowed the study of the process parameters such as temperature, strain and strain rate and microstructure evolution during hot closed die forging of a low carbon steel. The geometry and grain size evolutions obtained by simulation are compared with those found in the actual process and measured by optical microscopy. The attained data indicated that the simulation is able to describe processing parameters and microstructure evaluation during hot forging of a metallic component.
Keywords: hot forging, process parameters, microstructural evolution, numerical simulation
1. IntroductionCarbon steels represent a large share of the global steel
production and their applications spread across many fields of modern engineering. These applications demand continue dimension reductions of the mechanical components and equipments, requiring improvements in the mechanical properties of these materials. Such needs have led the development of new materials and improvements in the manufacturing processes.
Currently, new products and processes are developed seeking high quality, low cost and short manufacturing time. The design and optimization of forming processes are usually conducted by the experience of the professionals that are involved in manufacturing operations and, as a consequence, tryout is mandatory. To avoid this empirical procedure, the use of numerical simulation have been an important tool for the development and/or improvement of forming processes1,2.
Ball hooks are used in electric power transmission lines to carry out the connection between the insulators and support brackets. During their lifetime these components are subjected to static and dynamic loads induced by cable stretch out and wind action. Usually, they can be produced by forging or casting process. However, there are few publications about simulations of forging process coupled with the microstructure evolution of low-carbon steels and the manufacture of fittings for transmission lines.
The objective of this article was the simulation of the forging process to manufacture ball hooks in order to investigate the variations of temperature, strain, strain rate and the microstructure evolution during the forming. The simulation data obtained for the average grain size are
compared with those attained by optical microscopy from samples of workpieces produced by industrial processing.
2. Material and Methods
2.1. Industrial process
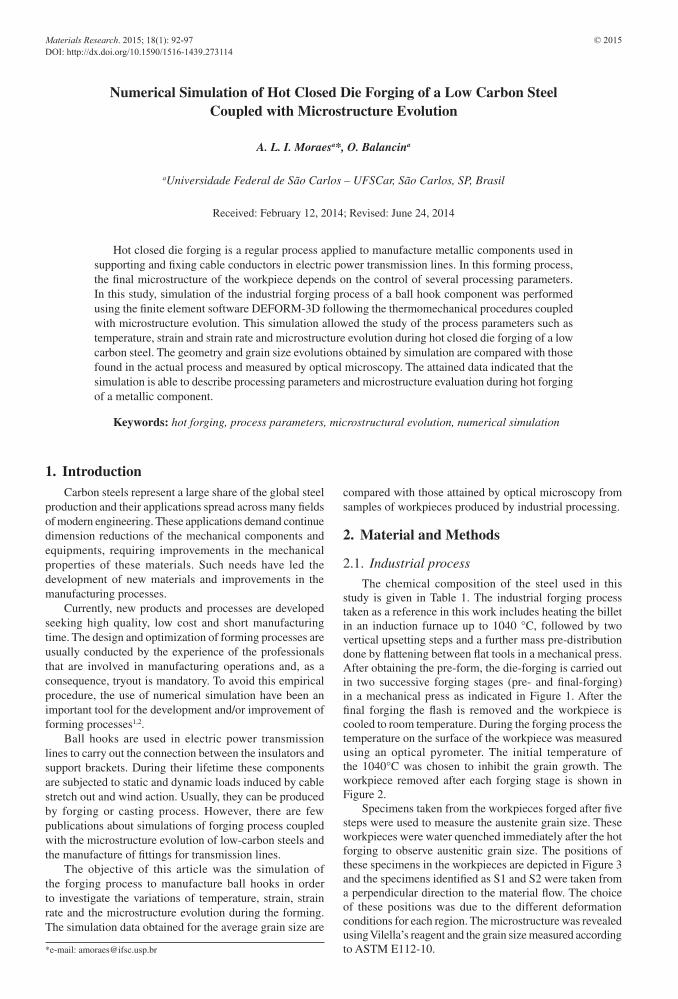
The chemical composition of the steel used in this study is given in Table 1. The industrial forging process taken as a reference in this work includes heating the billet in an induction furnace up to 1040 °C, followed by two vertical upsetting steps and a further mass pre-distribution done by flattening between flat tools in a mechanical press. After obtaining the pre-form, the die-forging is carried out in two successive forging stages (pre- and final-forging) in a mechanical press as indicated in Figure 1. After the final forging the flash is removed and the workpiece is cooled to room temperature. During the forging process the temperature on the surface of the workpiece was measured using an optical pyrometer. The initial temperature of the 1040°C was chosen to inhibit the grain growth. The workpiece removed after each forging stage is shown in Figure 2.
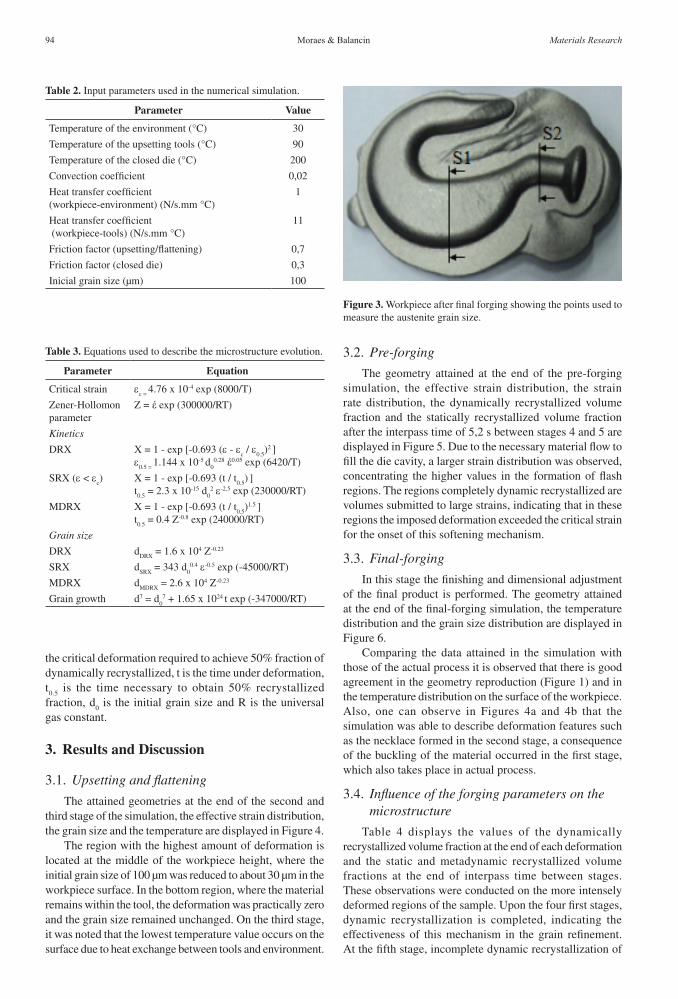
Specimens taken from the workpieces forged after five steps were used to measure the austenite grain size. These workpieces were water quenched immediately after the hot forging to observe austenitic grain size. The positions of these specimens in the workpieces are depicted in Figure 3 and the specimens identified as S1 and S2 were taken from a perpendicular direction to the material flow. The choice of these positions was due to the different deformation conditions for each region. The microstructure was revealed using Vilella’s reagent and the grain size measured according to ASTM E112-10.
Numerical Simulation of Hot Closed Die Forging of a Low Carbon Steel Coupled with Microstructure Evolution2015; 18(1) 93
Table 1. Chemical composition (mass %).
C Mn P S Si
0.19 0.51 0.017 0.01 0.13
Figure 1. Diagram representing the industrial processing.
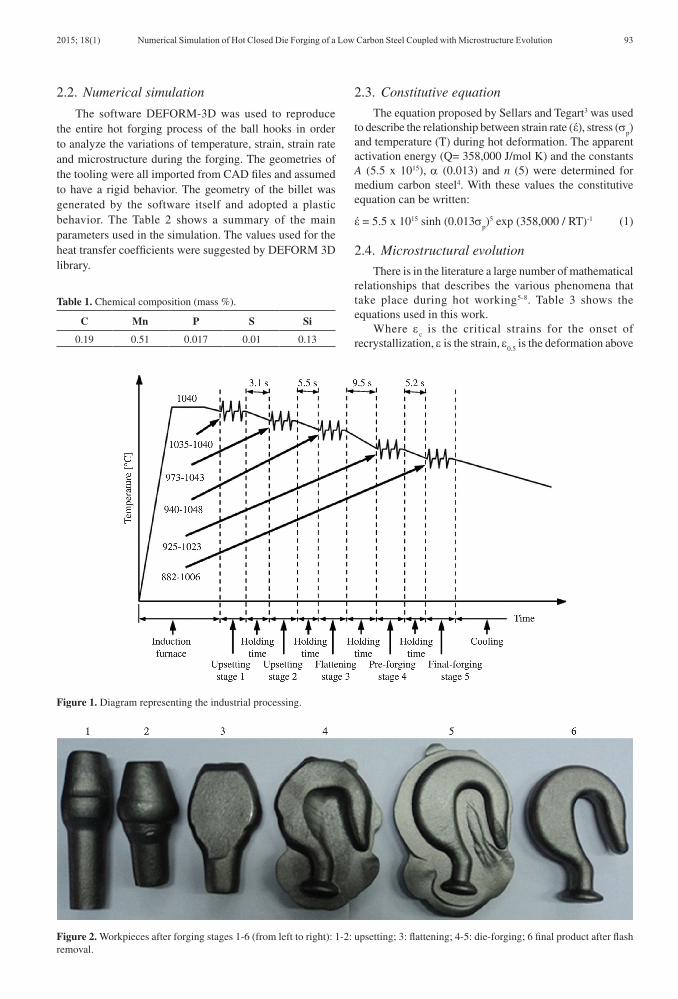
Figure 2. Workpieces after forging stages 1-6 (from left to right): 1-2: upsetting; 3: flattening; 4-5: die-forging; 6 final product after flash removal.
2.2. Numerical simulation
The software DEFORM-3D was used to reproduce the entire hot forging process of the ball hooks in order to analyze the variations of temperature, strain, strain rate and microstructure during the forging. The geometries of the tooling were all imported from CAD files and assumed to have a rigid behavior. The geometry of the billet was generated by the software itself and adopted a plastic behavior. The Table 2 shows a summary of the main parameters used in the simulation. The values used for the heat transfer coefficients were suggested by DEFORM 3D library.
2.3. Constitutive equation
The equation proposed by Sellars and Tegart3 was used to describe the relationship between strain rate (έ), stress (σ
p)
and temperature (T) during hot deformation. The apparent activation energy (Q= 358,000 J/mol K) and the constants A (5.5 x 10¹⁵), α (0.013) and n (5) were determined for medium carbon steel4. With these values the constitutive equation can be written:
έ = 5.5 x 10¹⁵ sinh (0.013σp)5 exp (358,000 / RT)-1 (1)
2.4. Microstructural evolution
There is in the literature a large number of mathematical relationships that describes the various phenomena that take place during hot working5-8. Table 3 shows the equations used in this work.
Where εc is the critical strains for the onset of
recrystallization, ε is the strain, ε0.5
is the deformation above
Moraes & Balancin94 Materials Research
3.2. Pre-forging
The geometry attained at the end of the pre-forging simulation, the effective strain distribution, the strain rate distribution, the dynamically recrystallized volume fraction and the statically recrystallized volume fraction after the interpass time of 5,2 s between stages 4 and 5 are displayed in Figure 5. Due to the necessary material flow to fill the die cavity, a larger strain distribution was observed, concentrating the higher values in the formation of flash regions. The regions completely dynamic recrystallized are volumes submitted to large strains, indicating that in these regions the imposed deformation exceeded the critical strain for the onset of this softening mechanism.
3.3. Final-forging
In this stage the finishing and dimensional adjustment of the final product is performed. The geometry attained at the end of the final-forging simulation, the temperature distribution and the grain size distribution are displayed in Figure 6.
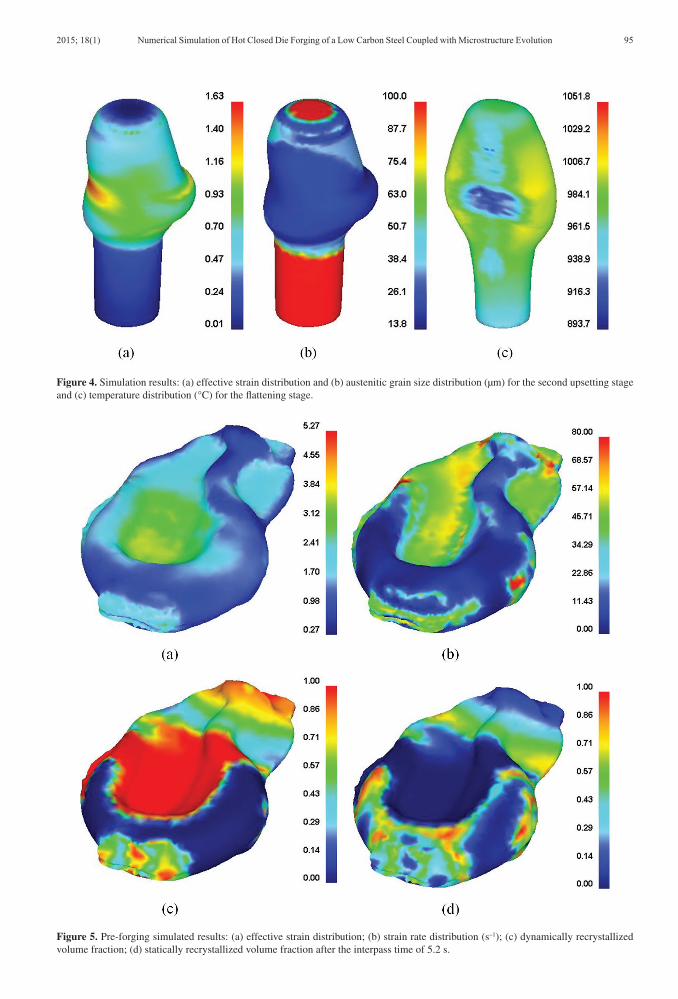
Comparing the data attained in the simulation with those of the actual process it is observed that there is good agreement in the geometry reproduction (Figure 1) and in the temperature distribution on the surface of the workpiece. Also, one can observe in Figures 4a and 4b that the simulation was able to describe deformation features such as the necklace formed in the second stage, a consequence of the buckling of the material occurred in the first stage, which also takes place in actual process.
3.4. Influence of the forging parameters on the microstructure
Table 4 displays the values of the dynamically recrystallized volume fraction at the end of each deformation and the static and metadynamic recrystallized volume fractions at the end of interpass time between stages. These observations were conducted on the more intensely deformed regions of the sample. Upon the four first stages, dynamic recrystallization is completed, indicating the effectiveness of this mechanism in the grain refinement. At the fifth stage, incomplete dynamic recrystallization of
Table 2. Input parameters used in the numerical simulation.
Parameter Value
Temperature of the environment (°C) 30
Temperature of the upsetting tools (°C) 90
Temperature of the closed die (°C) 200
Convection coefficient 0,02
Heat transfer coefficient(workpiece-environment) (N/s.mm °C)
1
Heat transfer coefficient (workpiece-tools) (N/s.mm °C)
11
Friction factor (upsetting/flattening) 0,7
Friction factor (closed die) 0,3
Inicial grain size (µm) 100
Table 3. Equations used to describe the microstructure evolution.
Parameter Equation
Critical strain εc =
4.76 x 10⁻⁴ exp (8000/T)
Zener-Hollomon parameter
Z = έ exp (300000/RT)
Kinetics
DRX X = 1 - exp [-0.693 (ε - εc / ε
0.5)2 ]
ε0.5 =
1.144 x 10⁻⁵ d0
0.28 έ0.05 exp (6420/T)
SRX (ε < εc) X = 1 - exp [-0.693 (t / t
0.5) ]
t0.5
= 2.3 x 10⁻¹⁵ d0
2 ε-2.5 exp (230000/RT)
MDRX X = 1 - exp [-0.693 (t / t0.5
)1.5 ]t0.5
= 0.4 Z-0.8 exp (240000/RT)
Grain size
DRX dDRX
= 1.6 x 10⁴ Z-0.23
SRX dSRX
= 343 d0
0.4 ε-0.5 exp (-45000/RT)
MDRX dMDRX
= 2.6 x 10⁴ Z-0.23
Grain growth d7 = d0
7 + 1.65 x 1024 t exp (-347000/RT)
Figure 3. Workpiece after final forging showing the points used to measure the austenite grain size.
the critical deformation required to achieve 50% fraction of dynamically recrystallized, t is the time under deformation, t
0.5 is the time necessary to obtain 50% recrystallized
fraction, d0 is the initial grain size and R is the universal
gas constant.
3. Results and Discussion
3.1. Upsetting and flattening
The attained geometries at the end of the second and third stage of the simulation, the effective strain distribution, the grain size and the temperature are displayed in Figure 4.
The region with the highest amount of deformation is located at the middle of the workpiece height, where the initial grain size of 100 µm was reduced to about 30 µm in the workpiece surface. In the bottom region, where the material remains within the tool, the deformation was practically zero and the grain size remained unchanged. On the third stage, it was noted that the lowest temperature value occurs on the surface due to heat exchange between tools and environment.
Numerical Simulation of Hot Closed Die Forging of a Low Carbon Steel Coupled with Microstructure Evolution2015; 18(1) 95
Figure 4. Simulation results: (a) effective strain distribution and (b) austenitic grain size distribution (µm) for the second upsetting stage and (c) temperature distribution (°C) for the flattening stage.
Figure 5. Pre-forging simulated results: (a) effective strain distribution; (b) strain rate distribution (s–1); (c) dynamically recrystallized volume fraction; (d) statically recrystallized volume fraction after the interpass time of 5.2 s.

Moraes & Balancin96 Materials Research
the about 60% is observed. This is a consequence of the deformation process which concentrated straining on the flash. The complete static recrystallization that occurred in the workpiece after stages 3 and 4 can be associated with temperature and strain heterogeneities and the holding time of 9.5 s after the stage 3.
Figure 7 displays the maximum effective strain and temperature at the positions S1 and S2 as indicated in Figure 3 for the five forging stages. The applied strain increases as the forging process proceeded and is always larger in position S1, since position S2 was not deformed upon the upsetting stages. During the forming the temperature in the center of both sections is decreased, however it is noted that in the stages 2 and 4 the temperature on the points S1 and S2 increases due to adiabatic heating.
It is observed in Figure 8 that the austenite grains were subjected to a large refinement in stages 1 and 4 for the positions S1 and S2, respectively. After these refinements, it is observed no significant change in the grain size. This fact can be associated with the occurrence of recrystallization at each stage. Upon the preform stage, in the deformed regions
Table 4. Type and recrystallized volume fraction during forging stages.
Mechanism Recrystallized volume fraction
Stage 1 2 3 4 5
DRX 1.0 1.0 1.0 1.0 0.6
MDRX - 0.1 0.1 0.15 -
SRX 0.3 0.8 1.0 1.0 -
Figure 6. Final-forging simulation results: (a) temperature distribution (°C) and (b) austenitic grain size distribution (µm).
Figure 7. Equivalent strain and temperature vs. forging stage number. Figure 8. Austenitic grain size vs. forging stage number.
Numerical Simulation of Hot Closed Die Forging of a Low Carbon Steel Coupled with Microstructure Evolution2015; 18(1) 97
occurred dynamic recrystallization and upon the forging itself prevailed the static recrystallization for the position S1. Corroborating with this interpretation one can see in Figure 8 that the grain size after the first stage is lower than those observed of final stage for position S1.
The grain size obtained for the positions S1 and S2 after five steps are summarized in Table 5. Both positions indicated that the simulated grain size is slightly lower than that found in the actual process measured by optical microscopy. Taking into account the inaccuracies of the experimental determination of the grain size there is a good agreement between simulated and experimental data.
4. Conclusions• Thesimulationreproducedinasatisfactorymanner
the evolution of geometry and temperature for the
actual forging process;
• The simulation indicates that softening in the first
stages of the processing is generated by dynamic
recrystallization and in the final stages by static
recrystallization for the position S1;
• Theagreementbetweenthegrainsizesmeasuredand
simulated is a strong evidence of the adequacy of the
methodology for the study of microstructure evolution
during hot forging process.
References1. Grass H, Krempaszky C, Reip T and Werner E. 3-D simulation
of hot forming and microstructure evolution. Computational Materials Science. 2003; 28(3-4):469-477. http://dx.doi.org/10.1016/j.commatsci.2003.06.003
2. Liu GH, Ren GS and Xu CG. Simulation of 3-D deformation and material flow during roll forging process using system of oval-round groove. Acta Metallurgica Sinica: English Letters. 2007; 20(5):380-384. http://dx.doi.org/10.1016/S1006-7191(07)60053-2
3. Sellars CM and Tegart WJ. La relation entre la résistance et la structure dans la deformation à chaud. Memories Scientifiques de la Revue de la Métallurgie. 1966; 63:731-746.
4. Cutrin RM. Influência das condições de deformação na recristalização dinâmica do aço médio carbono 38MnSiVS5 microligado ao vanádio. [Dissertação]. São Carlos: UFSCar; 2009.
5. Hodgson PD and Gibbs RK. Mathematical model to predict the mechanical properties of hot rolled C-Mn and microalloyed
steels. ISIJ International. 1992; 32(12):1329-1338. http://
dx.doi.org/10.2355/isijinternational.32.1329
6. Hodgson PD, Hazeldon LO, Matthews DL and Gloss RE.
Microstructure evolution of plain carbon steels. In: Korchynsky
M, DeArdo AJ, Repas P and Tither G, editors. Proceedings of
the International Conference Microalloying ’95 Held Under
the Auspices of the Iron and Steel Society. Warrendale: Iron &
Steel Society; 1995. p. 341.
7. Yada H. Prediction of microstructure changes and mechanical
properties in hot strip rolling. In: Ruddle GE and Crawley
AF, editors. Proceedings of the International Symposium on
Accelerated Cooling of Rolled Steel. Elmsford: Pergamon
Press; 1988. p. 105.
8. Maccagno TM, Jonas JJ and Hodgson PD. Spreadsheet
Modelling of Grain Size Evolution during Rod Rolling. ISIJ
International. 1996; 36(6):720-728. http://dx.doi.org/10.2355/
isijinternational.36.720
Table 5. Austenite grain size for the positions S1 and S2 (in µm).
Position Simulatedgrain size
Measuredgrain size
A 45 52
B 20 26