![Numerical Simulation of Multi-phase Flow in Porous Media on … · 2016-10-10 · arXiv:1606.00556v2 [cs.CE] 7 Oct 2016 Numerical Simulation of Multi-phase Flow in Porous Media on](https://static.fdocuments.in/doc/165x107/5f646817f6d93d3fff0a4579/numerical-simulation-of-multi-phase-flow-in-porous-media-on-2016-10-10-arxiv160600556v2.jpg)
Numerical Simulation of Heat Transfer in Porous …pcyyzhao/Papers/2017_MMTB_heat... · Numerical...
8
TOPICAL COLLECTION: PHYSICAL AND NUMERICAL SIMULATIONS OF MATERIALS PROCESSING Numerical Simulation of Heat Transfer in Porous Metals for Cooling Applications EDGAR AVALOS GAUNA and YUYUAN ZHAO Porous metals have low densities and novel physical, mechanical, thermal, electrical, and acoustic properties. Hence, they have attracted a large amount of interest over the last few decades. One of their applications is for thermal management in the electronics industry because of their fluid permeability and thermal conductivity. The heat transfer capability is achieved by the interaction between the internal channels within the porous metal and the coolant flowing through them. This paper studies the fluid flow and heat transfer in open-cell porous metals manufactured by space holder methods by numerical simulation using software ANSYS Fluent. A 3D geometric model of the porous structure was created based on the face-centered-cubic arrangement of spheres linked by cylinders. This model allows for different combinations of pore parameters including a wide range of porosity (50 to 80 pct), pore size (400 to 1000 lm), and metal particle size (10 to 75 lm). In this study, water was used as the coolant and copper was selected as the metal matrix. The flow rate was varied in the Darcian and Forchheimer’s regimes. The permeability, form drag coefficient, and heat transfer coefficient were calculated under a range of conditions. The numerical results showed that permeability increased whereas the form drag coefficient decreased with porosity. Both permeability and form drag coefficient increased with pore size. Increasing flow rate and decreasing porosity led to better heat transfer performance. DOI: 10.1007/s11663-017-0981-1 Ó The Author(s) 2017. This article is an open access publication I. INTRODUCTION POROUS metals, or metallic foams, are metals with pores deliberately integrated in their structure. [1] The pores are of crucial importance because they give new properties to the material. For applications requiring good permeability to fluids, the internal network of the cells in the porous metal must be open. The open-cell porous metals are emerging as an effective material for heat transfer management. [2] In active cooling applications using the open-cell structures, the cooling system is composed of the porous metal medium and the fluid is used as a coolant flowing through the material. In the design of heat exchangers with porous metals, two key properties are important: the heat transfer coefficient and the pressure drop across the sample, [3] which are strongly affected by the pore structure. [4] Porous copper manufactured by the space holder methods, such as the Lost Carbonate Sintering (LCS) process, [5] is a promising type of material for use as heat exchangers. [6] However, there is a very limited amount of data available on the fluid flow and the heat transfer behavior of this type of materials. Measurements of fluid permeability and heat transfer coefficient are difficult and time-consuming. Numerical simulation has gained popularity as a reliable tool to study heat transfer in porous media. For example, Teruel and Rizwan-Uddin [7] numerically cal- culated the interfacial heat transfer coefficient in porous media. Xin et al. [8] numerically investigated the heat and mass transfer behaviors in porous media for multiphase flow. Hwang and Yang [9] simulated the heat transfer and fluid flow characteristics in a metallic porous block subjected to a confined turbulent slot jet. Numerical simulation has shown to be a very useful and consistent tool. Different approaches have been considered in tackling the porous media problem. One methodology is consid- ering the porous media as an arrangement of tube banks in 2D. [10] Another practice is creating a representative 3D cell structure. [11] A different technique is creating a random walled structure acting as the porous matrix. [12] This paper studies the fluid flow and heat transfer in open-cell porous metals by numerical simulation using ANSYS Fluent. A 3D representative elementary volume (REV) has been created to represent the porous EDGAR AVALOS GAUNA and YUYUAN ZHAO are with the School of Engineering, University of Liverpool, Liverpool, L69 3GH, UK. Contact e-mail: [email protected] Manuscript submitted December 2, 2016. Article published online May 4, 2017. METALLURGICAL AND MATERIALS TRANSACTIONS B VOLUME 48B, AUGUST 2017—1925
Transcript of Numerical Simulation of Heat Transfer in Porous …pcyyzhao/Papers/2017_MMTB_heat... · Numerical...
TOPICAL COLLECTION: PHYSICAL AND NUMERICAL SIMULATIONS OF MATERIALS PROCESSING
Numerical Simulation of Heat Transfer in PorousMetals for Cooling Applications
EDGAR AVALOS GAUNA and YUYUAN ZHAO
Porous metals have low densities and novel physical, mechanical, thermal, electrical, andacoustic properties. Hence, they have attracted a large amount of interest over the last fewdecades. One of their applications is for thermal management in the electronics industry becauseof their fluid permeability and thermal conductivity. The heat transfer capability is achieved bythe interaction between the internal channels within the porous metal and the coolant flowingthrough them. This paper studies the fluid flow and heat transfer in open-cell porous metalsmanufactured by space holder methods by numerical simulation using software ANSYS Fluent.A 3D geometric model of the porous structure was created based on the face-centered-cubicarrangement of spheres linked by cylinders. This model allows for different combinations ofpore parameters including a wide range of porosity (50 to 80 pct), pore size (400 to 1000 lm),and metal particle size (10 to 75 lm). In this study, water was used as the coolant and copperwas selected as the metal matrix. The flow rate was varied in the Darcian and Forchheimer’sregimes. The permeability, form drag coefficient, and heat transfer coefficient were calculatedunder a range of conditions. The numerical results showed that permeability increased whereasthe form drag coefficient decreased with porosity. Both permeability and form drag coefficientincreased with pore size. Increasing flow rate and decreasing porosity led to better heat transferperformance.
DOI: 10.1007/s11663-017-0981-1� The Author(s) 2017. This article is an open access publication
I. INTRODUCTION
POROUS metals, or metallic foams, are metals withpores deliberately integrated in their structure.[1] Thepores are of crucial importance because they give newproperties to the material. For applications requiringgood permeability to fluids, the internal network of thecells in the porous metal must be open. The open-cellporous metals are emerging as an effective material forheat transfer management.[2]
In active cooling applications using the open-cellstructures, the cooling system is composed of the porousmetal medium and the fluid is used as a coolant flowingthrough the material. In the design of heat exchangerswith porous metals, two key properties are important:the heat transfer coefficient and the pressure drop acrossthe sample,[3] which are strongly affected by the porestructure.[4]
Porous copper manufactured by the space holdermethods, such as the Lost Carbonate Sintering (LCS)
process,[5] is a promising type of material for use as heatexchangers.[6] However, there is a very limited amountof data available on the fluid flow and the heat transferbehavior of this type of materials. Measurements offluid permeability and heat transfer coefficient aredifficult and time-consuming.Numerical simulation has gained popularity as a
reliable tool to study heat transfer in porous media. Forexample, Teruel and Rizwan-Uddin[7] numerically cal-culated the interfacial heat transfer coefficient in porousmedia. Xin et al.[8] numerically investigated the heat andmass transfer behaviors in porous media for multiphaseflow. Hwang and Yang[9] simulated the heat transfer andfluid flow characteristics in a metallic porous blocksubjected to a confined turbulent slot jet. Numericalsimulation has shown to be a very useful and consistenttool.Different approaches have been considered in tackling
the porous media problem. One methodology is consid-ering the porous media as an arrangement of tube banksin 2D.[10] Another practice is creating a representative3D cell structure.[11] A different technique is creating arandom walled structure acting as the porous matrix.[12]
This paper studies the fluid flow and heat transfer inopen-cell porous metals by numerical simulation usingANSYS Fluent. A 3D representative elementary volume(REV) has been created to represent the porous
EDGAR AVALOS GAUNA and YUYUAN ZHAO are with theSchool of Engineering, University of Liverpool, Liverpool, L69 3GH,UK. Contact e-mail: [email protected]
Manuscript submitted December 2, 2016.Article published online May 4, 2017.
METALLURGICAL AND MATERIALS TRANSACTIONS B VOLUME 48B, AUGUST 2017—1925
structure of LCS porous copper, allowing for differentcombinations of porosity, pore size, and metal particlesize.
II. NUMERICAL SIMULATION
A. Representative Elementary Volume (REV)
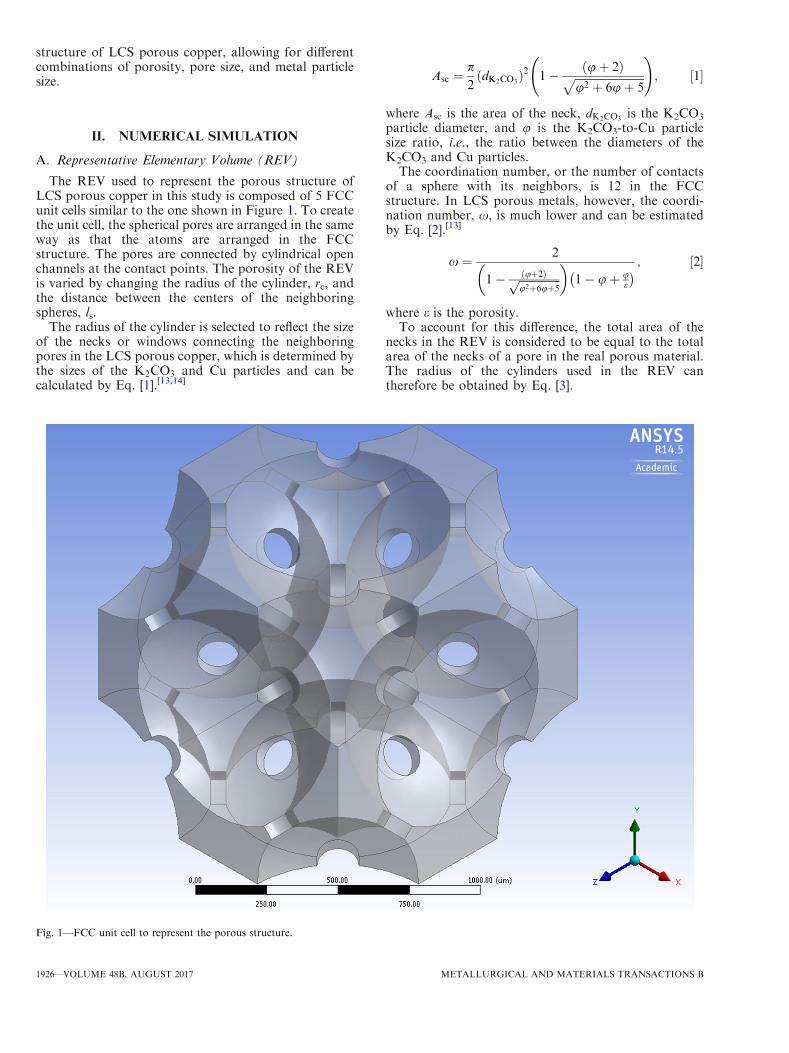
The REV used to represent the porous structure ofLCS porous copper in this study is composed of 5 FCCunit cells similar to the one shown in Figure 1. To createthe unit cell, the spherical pores are arranged in the sameway as that the atoms are arranged in the FCCstructure. The pores are connected by cylindrical openchannels at the contact points. The porosity of the REVis varied by changing the radius of the cylinder, rc, andthe distance between the centers of the neighboringspheres, ls.
The radius of the cylinder is selected to reflect the sizeof the necks or windows connecting the neighboringpores in the LCS porous copper, which is determined bythe sizes of the K2CO3 and Cu particles and can becalculated by Eq. [1].[13,14]
Asc ¼p2
dK2CO3ð Þ2 1� uþ 2ð Þ
ffiffiffiffiffiffiffiffiffiffiffiffiffiffiffiffiffiffiffiffiffiffiffiffiffi
u2 þ 6uþ 5p
!
; ½1�
where Asc is the area of the neck, dK2CO3is the K2CO3
particle diameter, and u is the K2CO3-to-Cu particlesize ratio, i.e., the ratio between the diameters of theK2CO3 and Cu particles.The coordination number, or the number of contacts
of a sphere with its neighbors, is 12 in the FCCstructure. In LCS porous metals, however, the coordi-nation number, x, is much lower and can be estimatedby Eq. [2].[13]
x ¼ 2
1� uþ2ð Þffiffiffiffiffiffiffiffiffiffiffiffiffiffiffi
u2þ6uþ5p
� �
1� uþ ue
� �
; ½2�
where e is the porosity.To account for this difference, the total area of the
necks in the REV is considered to be equal to the totalarea of the necks of a pore in the real porous material.The radius of the cylinders used in the REV cantherefore be obtained by Eq. [3].
Fig. 1—FCC unit cell to represent the porous structure.
1926—VOLUME 48B, AUGUST 2017 METALLURGICAL AND MATERIALS TRANSACTIONS B
rc ¼ffiffiffiffiffiffiffiffiffiffiffiffiffiffi
x � Asc
12p
r
½3�
Given the pore size, dK2CO3, the cylinder radius, rc,
and the porosity, e, the distance between the centers ofthe neighboring spheres, ls, can be determined.
The values of the cylinder radius and the distancebetween the centers of the neighboring spheres for eachcombination of pore size and porosity are presented inTable I. In this study, theCuparticle size is fixed as 50lm.
B. Governing Equations and Boundary Conditions
Incompressible Newtonian flows at pore-scale levelare governed by the Navier–Stokes equations. For thisstudy, the k� e model was used. The continuity,momentum, and energy equation are given by Eqs. [4]through [6].
qrv ¼ 0 ½4�
v � rð Þv ¼ r � �PIþ l rvþ rvð ÞT� �h i
½5�
qCpv � rT ¼ r � krTð Þ; ½6�
where q is the density of the fluid, v is the velocity, Pis pressure, I is the identity matrix, lis the viscosity ofthe fluid, T is the temperature, Cp is the specific heat,and k is the thermal conductivity.
Simulations were carried out using ANSYS FluentCFD with different REVs to account for differentcombinations of pore size and porosity as shown inTable I. The parameters considered for this analysiswere pore size, porosity, and volumetric flow rate.
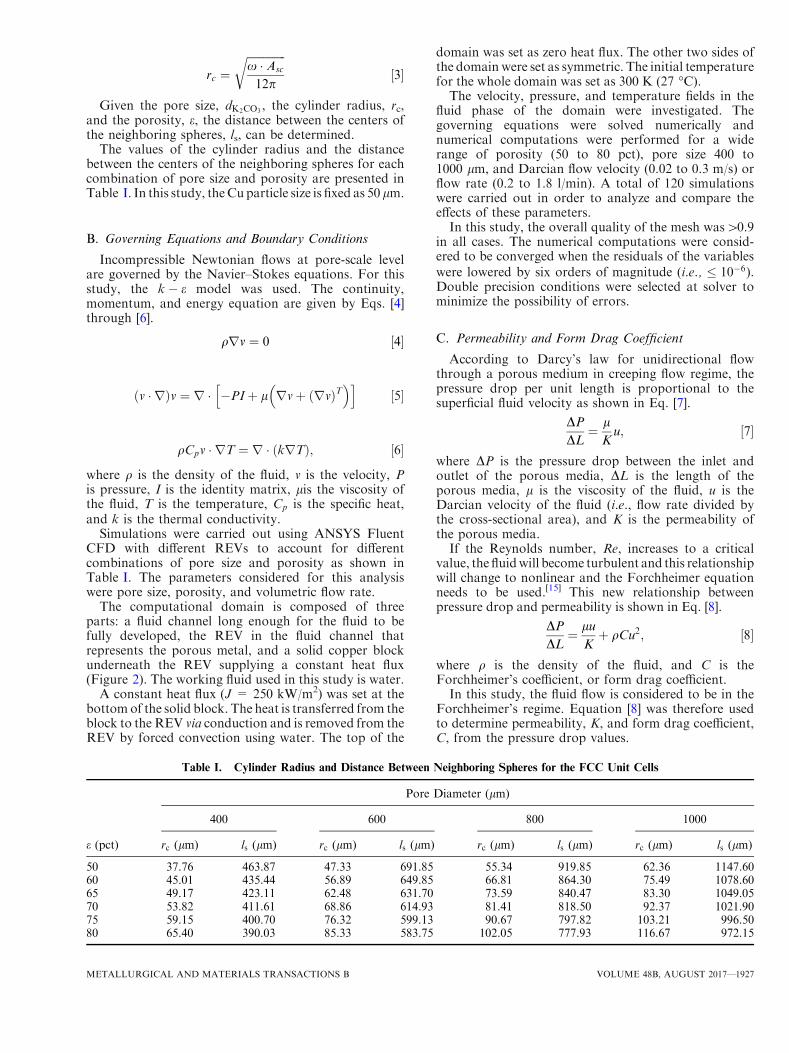
The computational domain is composed of threeparts: a fluid channel long enough for the fluid to befully developed, the REV in the fluid channel thatrepresents the porous metal, and a solid copper blockunderneath the REV supplying a constant heat flux(Figure 2). The working fluid used in this study is water.
A constant heat flux (J = 250 kW/m2) was set at thebottomof the solid block. The heat is transferred from theblock to the REV via conduction and is removed from theREV by forced convection using water. The top of the
domain was set as zero heat flux. The other two sides ofthe domain were set as symmetric. The initial temperaturefor the whole domain was set as 300 K (27 �C).The velocity, pressure, and temperature fields in the
fluid phase of the domain were investigated. Thegoverning equations were solved numerically andnumerical computations were performed for a widerange of porosity (50 to 80 pct), pore size 400 to1000 lm, and Darcian flow velocity (0.02 to 0.3 m/s) orflow rate (0.2 to 1.8 l/min). A total of 120 simulationswere carried out in order to analyze and compare theeffects of these parameters.In this study, the overall quality of the mesh was>0.9
in all cases. The numerical computations were consid-ered to be converged when the residuals of the variableswere lowered by six orders of magnitude (i.e., � 10�6).Double precision conditions were selected at solver tominimize the possibility of errors.
C. Permeability and Form Drag Coefficient
According to Darcy’s law for unidirectional flowthrough a porous medium in creeping flow regime, thepressure drop per unit length is proportional to thesuperficial fluid velocity as shown in Eq. [7].
DPDL
¼ lKu; ½7�
where DP is the pressure drop between the inlet andoutlet of the porous media, DL is the length of theporous media, l is the viscosity of the fluid, u is theDarcian velocity of the fluid (i.e., flow rate divided bythe cross-sectional area), and K is the permeability ofthe porous media.If the Reynolds number, Re, increases to a critical
value, the fluidwill become turbulent and this relationshipwill change to nonlinear and the Forchheimer equationneeds to be used.[15] This new relationship betweenpressure drop and permeability is shown in Eq. [8].
DPDL
¼ luK
þ qCu2; ½8�
where q is the density of the fluid, and C is theForchheimer’s coefficient, or form drag coefficient.In this study, the fluid flow is considered to be in the
Forchheimer’s regime. Equation [8] was therefore usedto determine permeability, K, and form drag coefficient,C, from the pressure drop values.
Table I. Cylinder Radius and Distance Between Neighboring Spheres for the FCC Unit Cells
Pore Diameter (lm)
400 600 800 1000
e (pct) rc (lm) ls (lm) rc (lm) ls (lm) rc (lm) ls (lm) rc (lm) ls (lm)
50 37.76 463.87 47.33 691.85 55.34 919.85 62.36 1147.6060 45.01 435.44 56.89 649.85 66.81 864.30 75.49 1078.6065 49.17 423.11 62.48 631.70 73.59 840.47 83.30 1049.0570 53.82 411.61 68.86 614.93 81.41 818.50 92.37 1021.9075 59.15 400.70 76.32 599.13 90.67 797.82 103.21 996.5080 65.40 390.03 85.33 583.75 102.05 777.93 116.67 972.15
METALLURGICAL AND MATERIALS TRANSACTIONS B VOLUME 48B, AUGUST 2017—1927
D. Heat Transfer Coefficient
The heat flux and heat transfer coefficient in the LCSporous copper is related by Newton’s cooling law givenin Eq. [9].
J ¼ h Tb � Tinð Þ; ½9�
where J is the input heat flux, h is the heat transfercoefficient, Tb is the temperature at the contact pointbetween the heat source and the LCS porous copper,and Tin is the temperature of the water at the inlet. Inthis study, Eq. [9] was used to determine the heattransfer coefficient, h, from the temperature of the heatblock.
III. RESULTS AND DISCUSSION
A. Pressure Drop
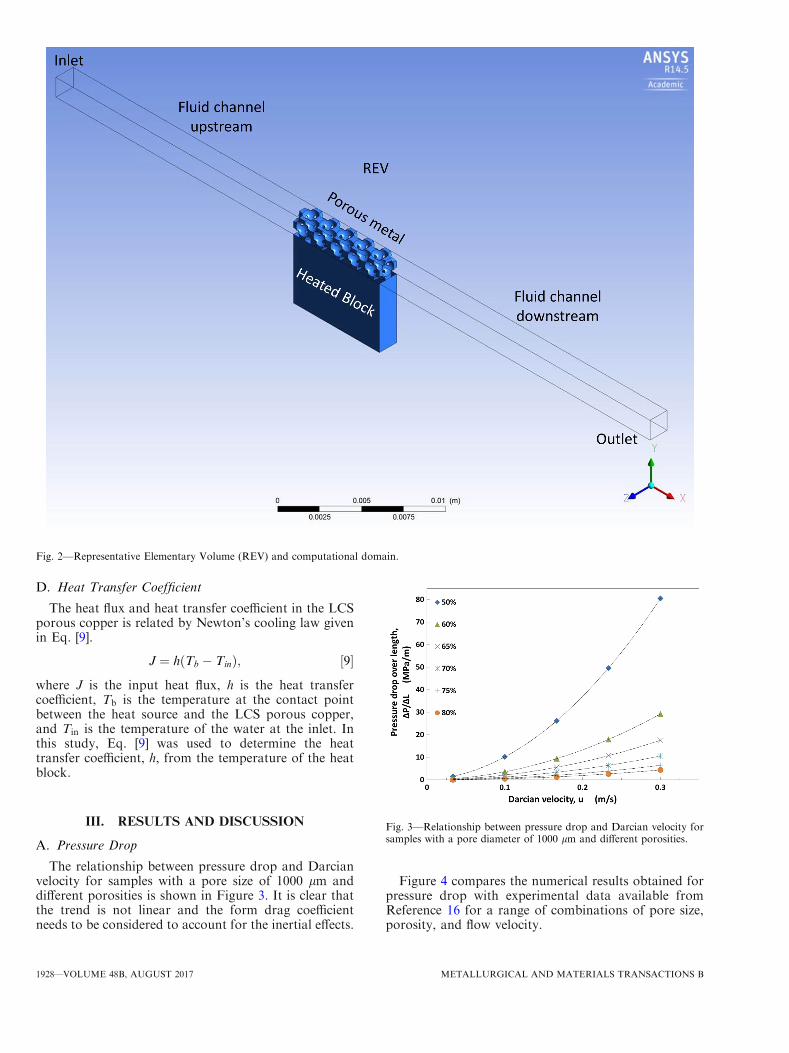
The relationship between pressure drop and Darcianvelocity for samples with a pore size of 1000 lm anddifferent porosities is shown in Figure 3. It is clear thatthe trend is not linear and the form drag coefficientneeds to be considered to account for the inertial effects.
Figure 4 compares the numerical results obtained forpressure drop with experimental data available fromReference 16 for a range of combinations of pore size,porosity, and flow velocity.
Fig. 2—Representative Elementary Volume (REV) and computational domain.
Fig. 3—Relationship between pressure drop and Darcian velocity forsamples with a pore diameter of 1000 lm and different porosities.
1928—VOLUME 48B, AUGUST 2017 METALLURGICAL AND MATERIALS TRANSACTIONS B
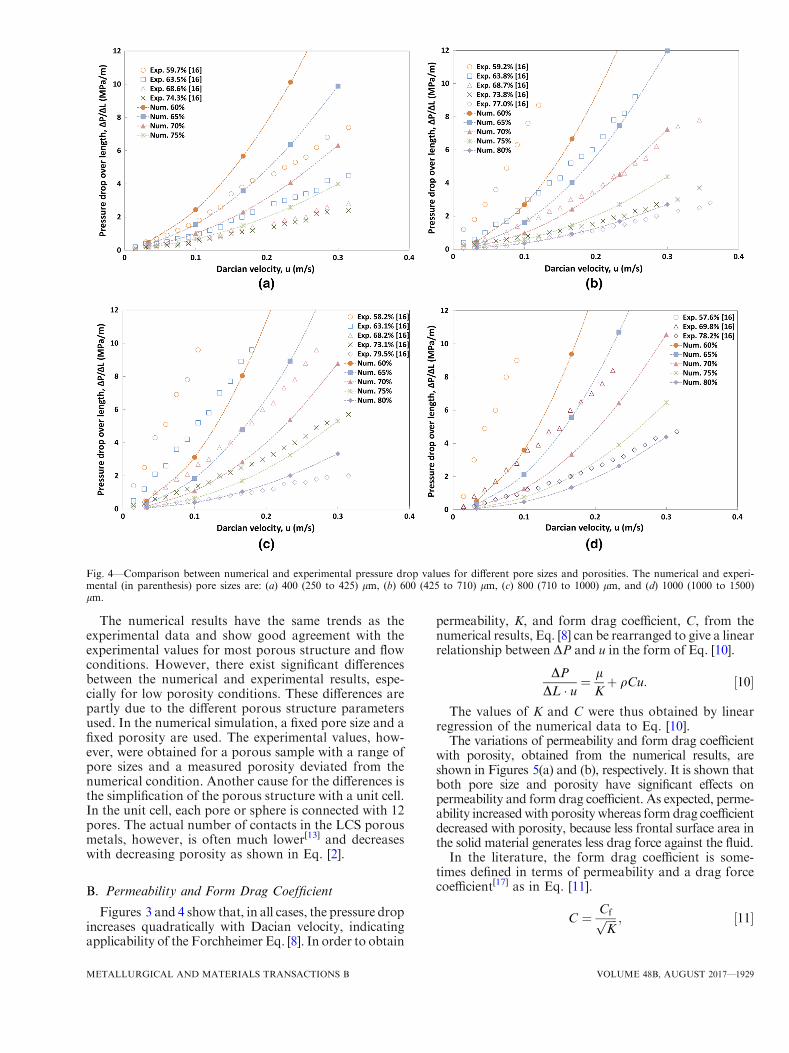
The numerical results have the same trends as theexperimental data and show good agreement with theexperimental values for most porous structure and flowconditions. However, there exist significant differencesbetween the numerical and experimental results, espe-cially for low porosity conditions. These differences arepartly due to the different porous structure parametersused. In the numerical simulation, a fixed pore size and afixed porosity are used. The experimental values, how-ever, were obtained for a porous sample with a range ofpore sizes and a measured porosity deviated from thenumerical condition. Another cause for the differences isthe simplification of the porous structure with a unit cell.In the unit cell, each pore or sphere is connected with 12pores. The actual number of contacts in the LCS porousmetals, however, is often much lower[13] and decreaseswith decreasing porosity as shown in Eq. [2].
B. Permeability and Form Drag Coefficient
Figures 3 and 4 show that, in all cases, the pressure dropincreases quadratically with Dacian velocity, indicatingapplicability of the Forchheimer Eq. [8]. In order to obtain
permeability, K, and form drag coefficient, C, from thenumerical results, Eq. [8] can be rearranged to give a linearrelationship between DP and u in the form of Eq. [10].
DPDL � u ¼ l
Kþ qCu: ½10�
The values of K and C were thus obtained by linearregression of the numerical data to Eq. [10].The variations of permeability and form drag coefficient
with porosity, obtained from the numerical results, areshown in Figures 5(a) and (b), respectively. It is shown thatboth pore size and porosity have significant effects onpermeability and form drag coefficient. As expected, perme-ability increasedwith porosity whereas form drag coefficientdecreased with porosity, because less frontal surface area inthe solid material generates less drag force against the fluid.In the literature, the form drag coefficient is some-
times defined in terms of permeability and a drag forcecoefficient[17] as in Eq. [11].
C ¼ Cfffiffiffiffi
Kp ; ½11�
Fig. 4—Comparison between numerical and experimental pressure drop values for different pore sizes and porosities. The numerical and experi-mental (in parenthesis) pore sizes are: (a) 400 (250 to 425) lm, (b) 600 (425 to 710) lm, (c) 800 (710 to 1000) lm, and (d) 1000 (1000 to 1500)lm.
METALLURGICAL AND MATERIALS TRANSACTIONS B VOLUME 48B, AUGUST 2017—1929
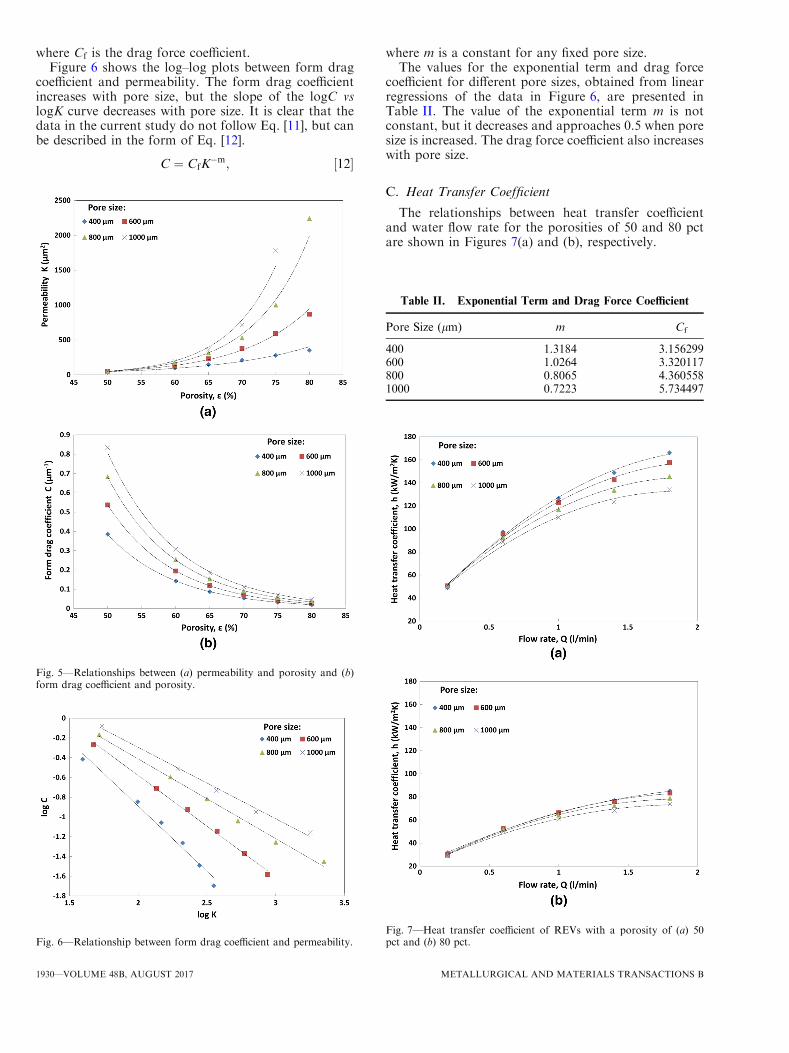
where Cf is the drag force coefficient.Figure 6 shows the log–log plots between form drag
coefficient and permeability. The form drag coefficientincreases with pore size, but the slope of the logC vslogK curve decreases with pore size. It is clear that thedata in the current study do not follow Eq. [11], but canbe described in the form of Eq. [12].
C ¼ CfK�m; ½12�
where m is a constant for any fixed pore size.The values for the exponential term and drag force
coefficient for different pore sizes, obtained from linearregressions of the data in Figure 6, are presented inTable II. The value of the exponential term m is notconstant, but it decreases and approaches 0.5 when poresize is increased. The drag force coefficient also increaseswith pore size.
C. Heat Transfer Coefficient
The relationships between heat transfer coefficientand water flow rate for the porosities of 50 and 80 pctare shown in Figures 7(a) and (b), respectively.
Fig. 5—Relationships between (a) permeability and porosity and (b)form drag coefficient and porosity.
Fig. 6—Relationship between form drag coefficient and permeability.
Table II. Exponential Term and Drag Force Coefficient
Pore Size (lm) m Cf
400 1.3184 3.156299600 1.0264 3.320117800 0.8065 4.3605581000 0.7223 5.734497
Fig. 7—Heat transfer coefficient of REVs with a porosity of (a) 50pct and (b) 80 pct.
1930—VOLUME 48B, AUGUST 2017 METALLURGICAL AND MATERIALS TRANSACTIONS B
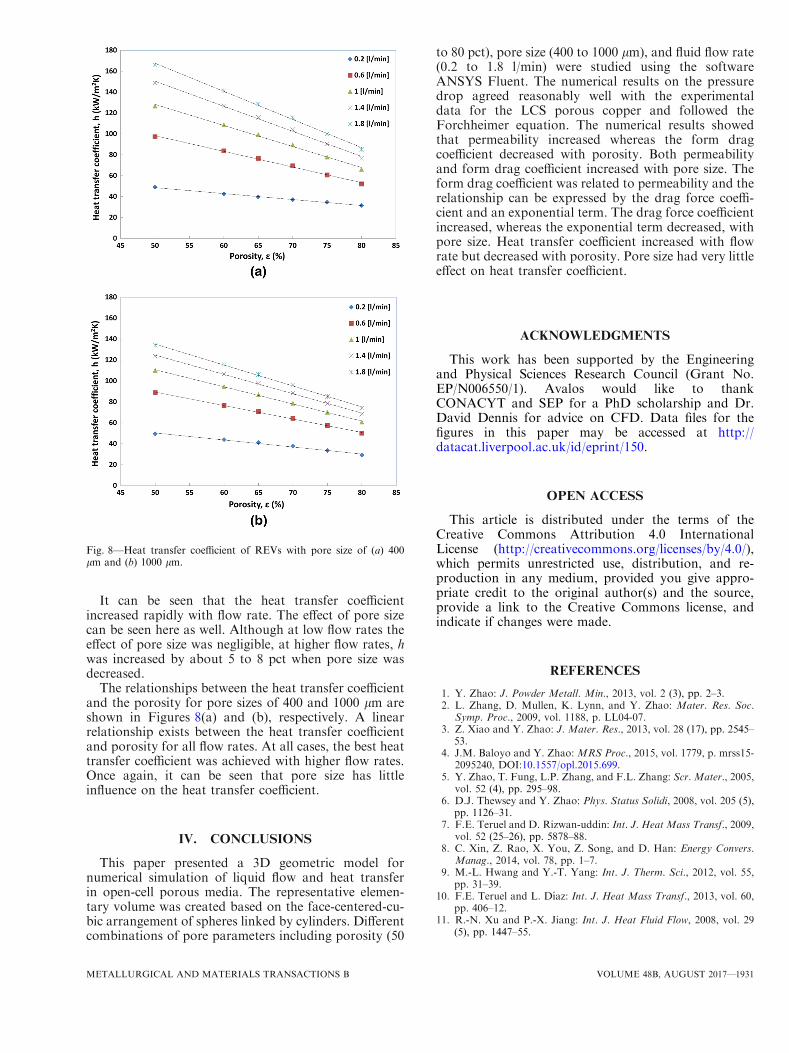
It can be seen that the heat transfer coefficientincreased rapidly with flow rate. The effect of pore sizecan be seen here as well. Although at low flow rates theeffect of pore size was negligible, at higher flow rates, hwas increased by about 5 to 8 pct when pore size wasdecreased.
The relationships between the heat transfer coefficientand the porosity for pore sizes of 400 and 1000 lm areshown in Figures 8(a) and (b), respectively. A linearrelationship exists between the heat transfer coefficientand porosity for all flow rates. At all cases, the best heattransfer coefficient was achieved with higher flow rates.Once again, it can be seen that pore size has littleinfluence on the heat transfer coefficient.
IV. CONCLUSIONS
This paper presented a 3D geometric model fornumerical simulation of liquid flow and heat transferin open-cell porous media. The representative elemen-tary volume was created based on the face-centered-cu-bic arrangement of spheres linked by cylinders. Differentcombinations of pore parameters including porosity (50
to 80 pct), pore size (400 to 1000 lm), and fluid flow rate(0.2 to 1.8 l/min) were studied using the softwareANSYS Fluent. The numerical results on the pressuredrop agreed reasonably well with the experimentaldata for the LCS porous copper and followed theForchheimer equation. The numerical results showedthat permeability increased whereas the form dragcoefficient decreased with porosity. Both permeabilityand form drag coefficient increased with pore size. Theform drag coefficient was related to permeability and therelationship can be expressed by the drag force coeffi-cient and an exponential term. The drag force coefficientincreased, whereas the exponential term decreased, withpore size. Heat transfer coefficient increased with flowrate but decreased with porosity. Pore size had very littleeffect on heat transfer coefficient.
ACKNOWLEDGMENTS
This work has been supported by the Engineeringand Physical Sciences Research Council (Grant No.EP/N006550/1). Avalos would like to thankCONACYT and SEP for a PhD scholarship and Dr.David Dennis for advice on CFD. Data files for thefigures in this paper may be accessed at http://datacat.liverpool.ac.uk/id/eprint/150.
OPEN ACCESS
This article is distributed under the terms of theCreative Commons Attribution 4.0 InternationalLicense (http://creativecommons.org/licenses/by/4.0/),which permits unrestricted use, distribution, and re-production in any medium, provided you give appro-priate credit to the original author(s) and the source,provide a link to the Creative Commons license, andindicate if changes were made.
REFERENCES
1. Y. Zhao: J. Powder Metall. Min., 2013, vol. 2 (3), pp. 2–3.2. L. Zhang, D. Mullen, K. Lynn, and Y. Zhao: Mater. Res. Soc.
Symp. Proc., 2009, vol. 1188, p. LL04-07.3. Z. Xiao and Y. Zhao: J. Mater. Res., 2013, vol. 28 (17), pp. 2545–
53.4. J.M. Baloyo and Y. Zhao: MRS Proc., 2015, vol. 1779, p. mrss15-
2095240, DOI:10.1557/opl.2015.699.5. Y. Zhao, T. Fung, L.P. Zhang, and F.L. Zhang: Scr. Mater., 2005,
vol. 52 (4), pp. 295–98.6. D.J. Thewsey and Y. Zhao: Phys. Status Solidi, 2008, vol. 205 (5),
pp. 1126–31.7. F.E. Teruel and D. Rizwan-uddin: Int. J. Heat Mass Transf., 2009,
vol. 52 (25–26), pp. 5878–88.8. C. Xin, Z. Rao, X. You, Z. Song, and D. Han: Energy Convers.
Manag., 2014, vol. 78, pp. 1–7.9. M.-L. Hwang and Y.-T. Yang: Int. J. Therm. Sci., 2012, vol. 55,
pp. 31–39.10. F.E. Teruel and L. Dıaz: Int. J. Heat Mass Transf., 2013, vol. 60,
pp. 406–12.11. R.-N. Xu and P.-X. Jiang: Int. J. Heat Fluid Flow, 2008, vol. 29
(5), pp. 1447–55.
Fig. 8—Heat transfer coefficient of REVs with pore size of (a) 400lm and (b) 1000 lm.
METALLURGICAL AND MATERIALS TRANSACTIONS B VOLUME 48B, AUGUST 2017—1931

12. T. P. de Carvalho, H. P. Morvan, D. Hargreaves, H. Oun, and A.Kennedy: Proceedings of ASME Turbo Expo 2015: TurbineTechnical Conference and Exposition GT2015, 2015, pp. 1–11.
13. Y. Zhao: J. Porous Mater., 2003, vol. 10 (2), pp. 105–11.14. K.K. Diao, Z. Xiao, and Y. Zhao: Mater. Chem. Phys., 2015,
vol. 162, pp. 571–79.
15. J. Despois and A. Mortensen: Acta Mater., 2005, vol. 53 (5),pp. 1381–88.
16. J. M. Baloyo, PhD thesis, University of Liverpool, June2016.
17. N. Dukhan, O. Bagci, and M. Ozdemir: Exp. Therm. Fluid Sci.,2014, vol. 57, pp. 425–33.
1932—VOLUME 48B, AUGUST 2017 METALLURGICAL AND MATERIALS TRANSACTIONS B