NUMERICAL RELATION AND 3D MODELLING OF HUMAN...
74
NUMERICAL RELATION AND 3D MODELLING OF HUMAN HEAD BALANCE FACTORS VAHID GOODARZY DISSERTATION SUBMITTED IN FULFILMENT OF THE REQUIREMENTS FOR THE DEGREE OF MASTER OF PHILOSOPHY INSTITUTE OF GRADUATE STUDIES UNIVERSITY OF MALAYA KUALA LUMPUR 2016
Transcript of NUMERICAL RELATION AND 3D MODELLING OF HUMAN...

NUMERICAL RELATION AND 3D MODELLING OF
HUMAN HEAD BALANCE FACTORS
VAHID GOODARZY
DISSERTATION SUBMITTED IN FULFILMENT OF
THE REQUIREMENTS FOR THE DEGREE OF
MASTER OF PHILOSOPHY
INSTITUTE OF GRADUATE STUDIES
UNIVERSITY OF MALAYA
KUALA LUMPUR
2016

ORIGINAL LITERARY WORK DECLARATION FORM

i
Abstract
The visual, vestibular, and proprioceptive systems make up the physiological balance
sensory system which is essential in maintaining balance and stability of a human body.
In biomechanical analysis, forces around the centre of gravity affect movement and
stability. The head centre of gravity (CG) which crosses three main planes (sagittal,
frontal and transverse) is an important area related with balance. Previous researches have
associated the head sensory systems with balance, however mathematical relations
between these balance factors and CG have not been established. The main aim of the
study was to establish mathematical relation using distances and angles between the head
sensory systems (visual and vestibular) and CG, and used these values to design a novel
3D model of a human head. The secondary aim of the study was to introduce photography
(PH) as a new technique to locate the head sensory system’s anatomical landmarks and
validate this using computer aided tomography (CT).
Three methods were employed; (i) CT - to locate the CG and exact anatomical location
of visual and vestibular systems, (ii) PH - to locate the surface anatomical landmarks of
head sensory systems, and (iii) anthropometric devices to calculate the head volume.
In order to calculate the mathematical relationships between the head sensory systems,
the balance factor line (BFL: the line connecting visual and vestibular systems) was
illustrated. The average distance between the visual and vestibular lines (DVV) on both
sides; for CT and PH are 8.16 ± 0.35 cm, and 8.11 ± 0.58 cm respectively, while the angle
between the BFL and the Frankfort plane (AVVF) on both sides; for CT and PH are 11.80
± 0.25o, and 11.65 ± 0.45o respectively. The comparison for angle of AVVF between left
and right sides has r value of 0.98, while P < 0.001. These values showed that there was
no significant difference between CT and photos. The intraclass correlation coefficient
between two ratters which shows the reliability of the methods was 0.970 for the CT
images and 0.960 for PH. Based on the 3D modelling, an imagery plane which connects

ii
the left and right head balance factors was drawn. The head CG was represented as a
hollow sphere in this model, and the connection between the CG and the imaginary plane
formed pyramidal structure.
CT scan imaging is hazardous and expensive and also the equipment is not easy to access,
thus, this new method is hypothesised as a viable alternative compared to previous
approaches that yield outcomes similar to those of the CT images. The proposed
imaginary plane connecting the human balance factors is not parallel with the existing
planes.
Applying this new 3D model of the human head, the mathematical relationships between
the head CG and the imaginary plane could be used in biomechanical analysis of human
balance and stability.

iii
Abstrak
Daya penglihatan / visual, bahagian dalam telinga atau vestibular, dan sistem pergerakan
badan atau sistem proprioceptive memainkan peranan penting dalam membentuk
keseimbangan sistem fisiologi deria di samping mengekalkan keseimbangan dan
kestabilan badan manusia. Dalam analisis biomekanik, tekanan kuasa di sekitar pusat
graviti mempengaruhi pergerakan dan kestabilan tubuh badan. Pusat graviti (CG) yang
melintasi tiga satah utama (sagittal, frontal dan melintang) merupakan kawasan penting
yang berkaitan dengan keseimbangan tubuh. Kajian sebelum ini telah dikaitkan dengan
keseimbangan sistem deria kepala namun kedudukan matematik di antara faktor
keseimbangan dan CG belum wujud lagi. Matlamat utama kajian ini adalah untuk
membina kedudukan matematik dengan menggunakan jarak dan sudut di antara sistem
deria kepala (visual dan vestibular) dan CG, malah nilai tersebut digunakan untuk
mereka-bentuk model 3D kepala manusia. Tujuan kedua kajian ini adalah untuk
memperkenalkan fotografi (PH) sebagai satu teknik baru bagi mengesan lokasi anatomi
sistem deria kepala malah memperakui kajian ini menerusi tomografi berkomputer (CT).
Tiga kaedah telah digunakan iaitu; (i) CT - untuk mengesan CG dan lokasi tepat anatomi
sistem visual dan vestibular, (ii) PH - untuk mengesan lokasi anatomi sistem deria pada
permukaan kepala, dan (iii) menggunakan peranti antropometri untuk mengira kandungan
isi padu kepala.
Dalam usaha mengira kedudukan matematik di antara sistem deria kepala, garis faktor
keseimbangan (BFL: garis yang menyambungkan sistem penglihtan / visual dan
vestibular) telah ditunjukkan. Purata jarak antara baris / garis visual dan vestibular (DVV)
di kedua-dua belah menunjukkan CT dan PH adalah pada paras 8.16 ± 0.35 cm, dan 8.11
± 0.58 cm, manakala sudut di antara BFL dan satah Frankfort (AVVF) di kedua-dua
bahagian; masing-masing menunjukkan CT dan PH pada paras 11.80 ± 0.25o dan 11.65
iv
± 0.45o. Perbandingan sudut AVVF antara sisi kiri dan kanan pula menunjukkan nilai r
pada aras 0.98, manakala P <0.001. Nilai-nilai ini menunjukkan bahawa tidak terdapat
perbezaan yang ketara di antara CT dan fotografi. Hubungan daya pekali intrakelas di
antara dua penilai menunjukkan kebolehpercayaan pada kaedah kajian adalah pada paras
0,970 bagi imej CT dan 0,960 untuk PH. Berdasarkan model 3D, sebuah satah bayangan
yang menghubungkan faktor keseimbangan kepala kiri dan kanan telah dibina. Dalam
model ini, kepala CG diwakili sebagai sfera berlubang, dan satu struktur piramid
terbentuk hasil hubungan antara CG dengan satah bayangan tersebut.
Pengimejan imbasan CT bukan sahaja berbahaya dan mahal malah peralatannya juga
tidak mudah diperoleh, jadi boleh dihipotesiskan bahawa kaedah baru ini sebagai satu
alternatif yang berdaya maju berbanding dengan pendekatan sebelum ini yang
menghasilkan keputusan yang sama dengan imej CT. Satah bayangan yang dicadangkan
itu mengesahkan bahawa faktor keseimbangan manusia langsung tidak selari dengan
satah sedia ada. Melalui penggunaan model 3D baru kepala manusia ini, kedudukan
matematik antara kepala CG dengan satah bayangan boleh digunapakai dalam analisis
biomekanik keseimbangan manusia dan kestabilan.

v
Acknowledgments
First and foremost I want to thank my advisor Dr. Ashril Yusof and Prof. Azuan Abu
Osman, It has been an honor to be his master student. Who strongly support me to do
good experimental research in biomechanics. I appreciate all those contributions of time,
ideas, and funding to make my master experience productive and stimulating.
I would like to take this opportunity to express my grateful to Prof. Khyrol Azmi for
allowing me to be in PPUM biomedical imaging department and use the CT scan images
of patients and other staff there who were kind to me.
I gratefully acknowledged the funding sources that made my master work possible. I was
funded by the HIR for my first 2 years and was honored to be a HIR candidate. My time
at UM was made enjoyable in large part due to the many friends and groups that became
a part of my life.
The members of the postgraduate group of sport center faculty have contributed
immensely to my personal and professional time at University Malaya. The group has
been a source of friendships as well as good advice and collaboration.
Lastly, I would like to thank my family for all their love and encouragement. For my
parents who raised me with a love of science and supported me in all my pursuits. For the
presence of my brother Farhad which strongly encourage me to continue this research.
And most of all for my loving, supportive, encouraging, and patient wife Sara whose
faithful support during the final stages of this master is so appreciated. Thank you.

vi
TABLE OF CONTENTS
Abstract ------------------------------------------------------------------------------------------i
Abstrak ------------------------------------------------------------------------------------------iii
Acknowledgements ----------------------------------------------------------------------------iv
List of figures ----------------------------------------------------------------------------------ix
List of tables -----------------------------------------------------------------------------------x
List of symbols and abbreviations ----------------------------------------------------------x
CHAPTER 1 INTRODUCTION
1.1 INTRODUCTION ................................................................................................. 2
1.1.1 BALANCE CONTROL SENSORY SYSTEMS ........................................................... 2
1.1.2 ANATOMICAL LANDMARKS OF THE HEAD BALANCE SYSTEM ........................... 5
1.1.3 THE HEAD CENTRE OF GRAVITY (CG) AND PLANES .......................................... 6
1.1.4 MODELLING OF THE HEAD ............................................................................... 8
1.2 PROBLEM STATEMENT .................................................................................... 9
1.3 OBJECTIVES OF STUDY .................................................................................. 10
1.4 SIGNIFICANCE OF STUDY ............................................................................. 10
2.1 HUMAN BALANCE SENSORY SYSTEM ....................................................... 12
2.2 BIOMECHANICS OF HUMAN BALANCE ..................................................... 14
2.3 HUMAN HEAD PLANES AND CENTRE OF GRAVITY (CG) ...................... 15
2.4 ANATOMICAL LANDMARKS ........................................................................ 17

vii
2.5 3D AND MATHEMATICAL MODELLING OF HUMAN HEAD ................... 20
3.1 APPROACH AND SELECTION OF RESEARCH METHODOLOGY
(RESEARCH DESIGN) ................................................................................................. 23
3.2 SUBJECTS ........................................................................................................... 23
3.3 ETHICAL CONCERN AND HOSPITAL POLICY ........................................... 24
3.4 FLOW CHART .................................................................................................... 24
3.5 COMPUTER TOMOGRAPHY ........................................................................... 26
3.5.1 DETERMINING ANATOMICAL LANDMARKS ..................................................... 27
3.6 PHOTOGRAPHY ................................................................................................ 27
3.6.1 DETERMINING ANATOMICAL LANDMARKS ..................................................... 29
3.7 ANTHROPOMETRIC MEASURES................................................................... 29
3.8 COMPUTER MODELLING OF HUMAN HEAD ............................................. 30
3.9 MATHEMATICAL RELATIONSHIP ................................................................ 31
3.10 STATISTICAL ANALYSIS ............................................................................ 31
4.1 DEMOGRAPHICS DATA .................................................................................. 33
4.2 DISTANCE AND ANGLE FROM CT IMAGES ............................................... 34
TABLE 4.2.1 PARAMETERS OBTAINED FROM CT SCAN IMAGES. .................. 34
4.3 DISTANCE AND ANGLE FROM PHOTOGRAPHY ....................................... 35
TABLE 4.3.1 PARAMETERS OBTAINED FROM PHOTOGRAPHY (PH) IMAGES.
......................................................................................................................................... 35
4.4 DISTANCE AND ANGLE USING ANTHROPOMETRIC DEVICES ............. 36

viii
TABLE 4.4.1 PARAMETERS OBTAINED USING ANTHROPOMETRIC DEVICES.
......................................................................................................................................... 36
4.5 STATISTICAL ANALYSIS ................................................................................ 36
4.5.1 CORRELATIONS .................................................................................................... 36
4.5.2 ANALISIS OF VARIANCE (ANOVA) ..................................................................... 37
4.5.3 INTRACLASS CORRELATION (ICC) BETWEEN RATTERS ........................................ 37
4.6 IMAGINARY PLANE ........................................................................................ 38
4.7 3D MODELLING ................................................................................................ 40
5.1 INTRODUCTION .................................................................................................... 43
5.2 ANATOMICAL LANDMARKS AND THE PROPOSED PLANE. ....................... 43
5.3 3D MODELLING OF HUMAN HEAD ................................................................... 46
5.4 MATHEMATICAL MODEL BETWEEN HUMAN HEAD FACTORS ................ 48
5.5 LIMITATION OF STUDY ....................................................................................... 50
5.6 FUTURE STUDY ..................................................................................................... 50
5.6 PRACTICAL APPLICATION ................................................................................. 51
5.7 CONCLUSION ......................................................................................................... 51
ix
List of figures
CHAPTER 1 INTRODUCTION
Figure 1.1.1 1 Visual system and cerebellum cortex ........................................................ 3
Figure 1.1.1 2 Vestibular system and cerebellum cortex .................................................. 5
Figure 1.1.2. Human head anatomical landmarks ............................................................. 6
Figure 1.1.3.1 Head and neck centre of gravity ................................................................ 7
Figure 1.1.3.2 Human head planes .................................................................................... 8
Figure 1.1.4 Human head 3D modelling using SolidWorks 2014 .................................... 9
CHAPTER 2 LITERATURE REVIEW
Figure 2 1 Human body balance mechanism .................................................................. 14
CHAPTER 3 METODOLOGY OF RESEARCH
Figure 3.4 Flowchart showing the research process ....................................................... 25
Figure 3.5 The left and right side of CT images ............................................................. 27
Figure 3.6 The camera and seat position ......................................................................... 28
Figure 3.7 The head volume calculation (V = 4/3 πabc.) ............................................... 30
CHAPTER 4 RESULTS
Figure 4.6 1 Sagittal view of planes ................................................................................ 38
Figure 4.6 2 Top view of planes...................................................................................... 39
Figure 4.6 3 Front view of planes ................................................................................... 39
Figure 4.6 4 Schematic view of imaginary plane of human head balance factors .......... 40
Figure 4.7.1 Lateral view of 3-D model .......................................................................... 41
Figure 4.7.2 Left and top view of 3D model ................................................................... 42
Figure 4.7.3 Close-up view of CG and visual-vestibular pyramid ................................. 42
x
CHAPTER 5 DISCUSSION
Figure 5.3 1 Polygonal model of human head ................................................................ 48
Figure 5.3 2 Curve model of human head ....................................................................... 49
Figure 5.4.1 Imaginary plane.. ........................................................................................ 50
List of tables
Table 4.1 1 Demographic of subject’s characteristics .................................................... 33
Table 4.2.1 Parameters obtained from CT scan images. ................................................. 34
Table 4.3.1 Parameters obtained from photography (PH) images .................................. 35
Table 4.4.1 Parameters obtained using anthropometric devices ..................................... 36
Table 4.5.1 Pearson correlation (r value) between CT and PH images .......................... 37
CT = Computer aided tomography
PH = Photography
BFL = The line connecting visual and vestibular systems
DVV = Distance between the visual and vestibular lines
AVVF = Angle between the visual-vestibular lines and the Frankfort plane
TBD = Distance from top to bottom of eye
THVID = Distance between the top head (forehead) to the eye
THVED = Distance between the top head (forehead) to the ear
BHVED = Distance between the head bottom and the ear

xi

1
CHAPTER 1
INTRODUCTION

2
1.1 Introduction
The main purpose this chapter is to provide relevant information within the scope
of this research such as definition of parameters to ease readers into the following
chapters. This chapter introduces the parameters and systems which are exploited in this
research such as the explanation of human balance control, head centre of gravity,
anatomical landmarks, human head planes and 3D modelling of the head.
1.1.1 Balance control sensory systems
Human balance and stability are affected by the physiological balance system,
nervous system, and reaction time. In order to sustain human balance and ensure that the
brain receives appropriate information, several mechanisms are employed namely the
three physiological sensory systems which are: visual, vestibular and proprioceptors and
nervous systems. Previous studies emphasise the human head as the main control centre
of balance. The visual, vestibular, and proprioceptive systems comprise the sensory
system of physiological balance in humans, which is essential to the maintenance of
balance and stability (Horak et al., 1990; Day et al., 1997; Carpenter et al., 2001; T.
Mergner et al., 2009; Naito et al., 2012). The visual and vestibular systems are located in
the head, and the proprioceptors are situated at the sole, ankle, and knee joints.
Head sensory system serves an important function in human balance and stability
(Beier et al., 1979; Winter, 1995). When the human head changes position or the body
loses stability, the sensory system sends information to the cerebellum and brain, where
the signals are analysed; subsequently, appropriate orders are sent to muscles and joints
to restore stability (Mort et al., 2003; Mathie et al., 2004; Chiu, 2005).
The vision influences balance by reacting to motion as a relative image shifts onto
the retina (Paulus et al., 1984), whereby it triggers the muscle activation required for
postural corrections to take place. The efficiency of vision in postural control depends on

3
visual acuity (Paulus et al., 1984), visual contrast (Leibowitz et al., 1979), object
distances (Paulus et al., 1984) and room illumination. For instance, visual acuity, contrast
sensitivity and depth perception play significant roles in the ways in which humans
themselves can see objects with clarity. Environmental factors, such as room lighting
affect the individuals in seeing their surroundings. Furthermore, previous literature has
indicated that humans demonstrate diminished ability to control posture in low-light
conditions (Owsley & Sloane, 1987; Lord & Menz, 2000). It is believed that many
internal factors, such as age and gender as well as many external factors like environment
affect the human balance system.
Figure 1.1.1.1 Visual system and cerebellum cortex (Wiley, 2009).
The vestibular organs known as balance organs of the inner ear, serve this
complex motor function at a largely subconscious level but their role does not stop with
balance. The value of the vestibular sensory system to brain functions such as perception
4
of self and non-self-motion, spatial orientation, navigation, voluntary movement,
coulometer control and autonomic control comes from their unique and complete
description of head motion and orientation in three dimensions (Peterka, 2002; Zhang et
al., 2011; Naito et al., 2012).
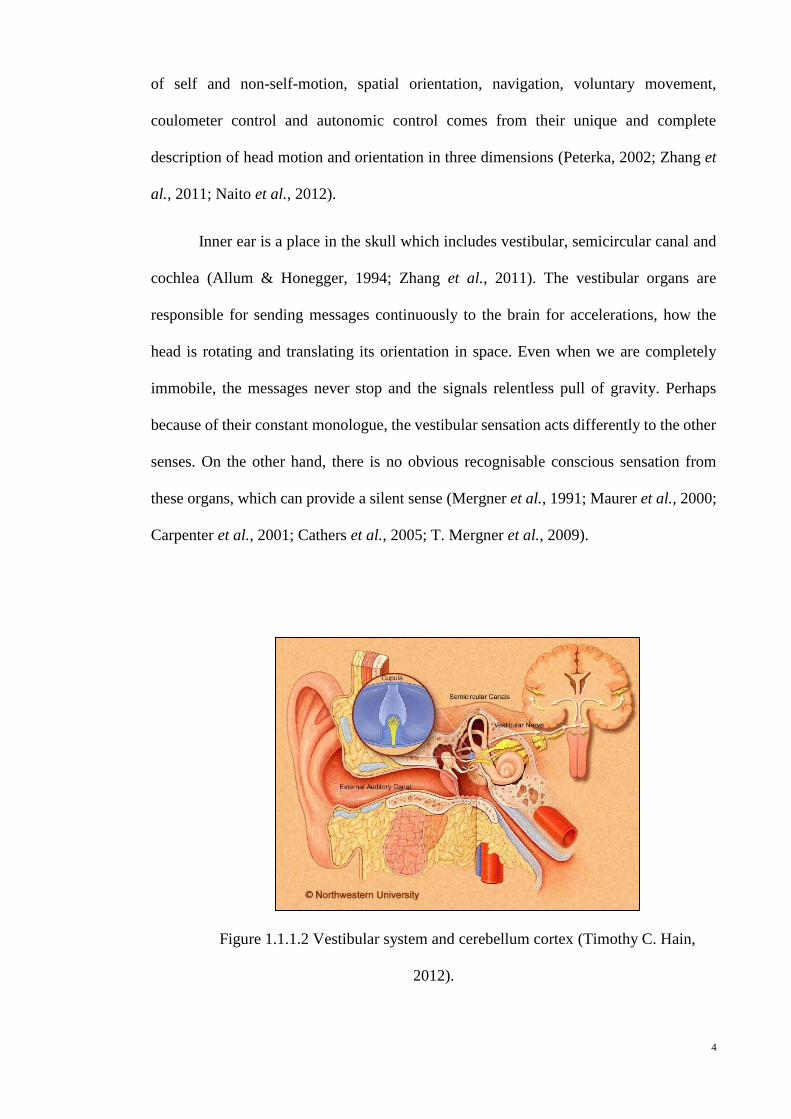
Inner ear is a place in the skull which includes vestibular, semicircular canal and
cochlea (Allum & Honegger, 1994; Zhang et al., 2011). The vestibular organs are
responsible for sending messages continuously to the brain for accelerations, how the
head is rotating and translating its orientation in space. Even when we are completely
immobile, the messages never stop and the signals relentless pull of gravity. Perhaps
because of their constant monologue, the vestibular sensation acts differently to the other
senses. On the other hand, there is no obvious recognisable conscious sensation from
these organs, which can provide a silent sense (Mergner et al., 1991; Maurer et al., 2000;
Carpenter et al., 2001; Cathers et al., 2005; T. Mergner et al., 2009).
Figure 1.1.1.2 Vestibular system and cerebellum cortex (Timothy C. Hain,
2012).

5
1.1.2 Anatomical landmarks of the head balance system
Anatomists use specific terms to indicate areas of the body, such as the cephalon
or cephalic region that refers to the head. This region is further differentiated into more
specific areas, including the cranium (skull), facies (face), frons (forehead), oculus (eye
area), auris (ear), bucca (cheek), nausus (nose), oris (mouth), and mentis (chin) (Clauser
et al., 1969; Beier et al., 1979; Dumoulin et al., 2000; Chiu, 2005). These points are
known as standard landmarks on the surface of the human body, and some of them are
the external counterparts of internal anatomical points (Beier et al., 1979; Ringelstein et
al., 1990; Hughes, 2007; Subburaj et al., 2009).
Figure 1.1.2 Human head anatomical landmarks.
Several methods have been used to identify anatomical landmarks, including X-
ray and magnetic resonance imaging (MRI). The images taken by computed tomography
(CT) have been also subsequently used to locate precisely the anatomical landmarks on
the surface of the human body, and this technique has been proven to be reliable (Bernick
et al., 2001; Karch, 2004; Mikaeloff et al., 2004; Haruna et al., 2010). CT provides a 3D
view of the anatomical landmarks. Even minor parts/organs of the body can be precisely
viewed so that researchers can observe the organs in various layers and levels (Ringelstein
et al., 1990; Chiu, 2005; Hughes, 2007; Haruna et al., 2010).

6
1.1.3 The head centre of gravity (CG) and planes
The head also contains an area called the head centre of gravity (CG), which is a
significant point for biomechanical analysis (McConnell et al., 1995; Willinger et al.,
1999; Funk et al., 2009; Yoganandan et al., 2009). Dempster (1955) reported that the CG
is located along a point in the phenoid sinus averaging 4mm beyond the anterior-inferior
margin of the sella; on the surface its projections lay over the temporal fossa on or near
the nasion-inion line at a point about 32 % back from the nasion; it was equally distant
above the zygomatic arch and behind the malar fronto-sphenoid process. Winter and his
team (1995) demonstrated that CG landmarks are anatomically located above the right
and left infraorbital notches and at the superior edge of the right and left external auditory
meatus on the skin. These landmarks originate from the centre of the markers of the right
and left external auditory meatus. The +Z axis extends from the origin in a cephalad
direction to the plane formed by the +X axis and the line between the auditory meatus
markers at right angles. The +Y axis extends from the origin toward the left ear to the X–
Z plane at right angles. This plane is known as the mid sagittal plane. The anatomical
location of the head and neck CG is “8 mm anterior to the basion on the inferior surface
of the base of Occiput or within the bone 24 ± 5 mm from the crest of the dorsum sella;
on the surface of the head a point 10 mm anterior to the supratragic notch above the head
of the mandible is directly lateral.” Clauser and his team (Clauser et al., 1969) reported
that the mean distances of the head CG are 46.4% below the vertex and 40.0% from the
occiput.

7
Figure 1.1.3.1. Head and neck centre of gravity (Sazer, 1995).
Three main planes cross the human head, namely, the Frankfort (transverse),
sagittal (sagittal), and coronal (frontal) planes (Clauser et al., 1969; Keshner & Peterson,
1995). The Frankfort plane passes through the inferior margin of the left orbit (the left
orbitale) and the upper margin of each ear canal or the external auditory meatus (the
porion). It is almost parallel to the ground. The sagittal plane is a vertical plane that
extends from the ventral (front) to the dorsal aspect (rear) and divides the head into right
and left halves. The coronal plane is a vertical plane that divides the head into ventral
(belly) and dorsal (back) sections (Clauser et al., 1969; Ringelstein et al., 1990; Koo &
Kim, 1995; Volinsky et al., 1997; Dougherty et al., 2003).

8
Figure 1.1.3.2 Human head planes.
.
1.1.4 Modelling of the head
The collection and application of anthropometric data within digital human
modelling systems raises many questions. Often the data will have been collected for
direct use in a particular design application and may not meet the more generic needs of
human modelling systems. There is a consequent need for some transformation to for
example convert the external body dimensions normally collected in anthropometric
surveys into the internal joint-to-joint dimensions that form the basis of most models.
Perhaps, the most significant problem arises from the use of a ‘percentile’
approach that is in conflict with the multivariate nature of anthropometric data. Fifth
and ninety-fifth percentile models are commonly used in the belief that this will
‘accommodate’ an appropriate proportion of the user population. This, however,

9
assumes that good correlation exists between body measures whereas it has long been
understood that correlation between some body measures can be extremely weak.
Figure 1.1.4. Human head 3D modelling using SolidWorks 2014.
.
1.2 Problem statement
Based on existing literatures, it is shown that prior researches have attended
separately to understand the visual and vestibular mechanisms which affect human
balance, hence, the position of CG and head sensory systems have been anatomically
located. The important reason of CG being a center of the head is a strategic point in
studying dynamic and static balance, and in physics; it is an essential point for studying
static and dynamic movement. Although prior researches have studied the effect of head
sensory system and CG on human balance and movement but unfortunately, they have
not shown the mathematical relation between them. Furthermore, it’s important to
visualize these relations using a 3D model in order to draw the imaginary plane of
visual and vestibular system.

10
1.3 Objectives of study
Concerning to find the mathematical relationship of the head CG and sensory
system on human balancing system, several objectives in this study were being listed.
The objectives of this study are listed as follows;
1- To investigate the anatomical landmarks of head sensory system which can
marked on the surface of head skin
2- To design an imaginary page in human head, which contains eyes and inner ears
for retaining the relation between these points and head centre of gravity
3- To simulate a 3D modelling of head and the imaginary.
4- To determine the mathematical relation and formula of the CG and head sensory
system
1.4 Significance of study
To date, there is no mathematical relation has been reported among head CG and
balance sensory systems of visual and vestibular. Therefore, an investigation of this
research seems essential in contributing to the gap of knowledge in the literature. The
newly formulated equation can be useful for biomechanical study of human balance
involving visual and vestibular systems. Together with a 3D modelling of human head
will provide new approach for further studies on human balance and positioning of head
and body.

11
CHAPTER 2
LITERATURE REVIEW

12
2.1 Human balance sensory system
The study on human balance dates back to 1452 – 1519 when Da Vinci established
human balance relations using mathematical methods. The Fibonacci number is φ≡ (a +
b) / b = a / b = 1.618 that has been known as Golden ratio (Dunlap & Dunlap, 1997). This
number is useful in many fields of science, particularly those related to human physical
design. The painting of human body by Da Vinci has inspired many scientists who are
interested to realise human body type, human stability, and human balance mechanism.
According to Da Vinci, balance is a product of the postural task and the
environment in which it is performed (Brent, 1989; Koo & Kim, 1995; Winter, 1995).
The characteristics of the task and the environmental context may alter the biomechanical
response strategies to maintain balance, and the central information processing
requirements and quantities. In biomechanics, balance is an ability to maintain the centre
of gravity of a body within the base of support with minimal postural sway. Balancing
requires concurrent processing of inputs from multiple senses, while the motor system
simultaneously controls muscle actions. The senses must detect changes of body position
with respect to the base, regardless of body or base movements.
Several studies have demonstrated that human standing posture is affected by
perturbations to balance sensory systems (Dichgans & Brandt, 1978; Manchester et al.,
1989; Posner & Petersen, 1989; Horak et al., 1990; Pozzo et al., 1990; Winter, 1991; Day
et al., 1997; Lacour et al., 1997; Carpenter et al., 2001; Creath et al., 2002) suggesting
that feedback control, based on perceived body motion, contributes to postural stability.
There is redundancy across these sensory systems and the organisation of these feedback
control mechanisms is not fully known. Also, there is some question as to whether
feedback alone is sufficient for human postural control (Taga, 1995; Allum & Honegger,
1998; Indovina et al., 2005; T. Mergner et al., 2009), although later studies have shown
that a postural control strategy based solely on sensory feedback can account for

13
experimental findings involving a variety of proprioceptive and visual perturbations to
postural control (Pozzo et al., 1990; Day et al., 1997; Fitzpatrick & Day, 2004; Naito et
al., 2012).
The control of balance requires the integration of information from multiple
sensory and motor systems by the central nervous system (CNS). The eyes (visual system)
provide input regarding the body's orientation within the environment and about motion
within the environment. Balance receptors in the inner ear (the vestibular system) provide
information to the CNS about head and body movements. The position and motion
sensors of the muscles and joints, and the touch receptors of the extremities
(proprioceptive system) send signals regarding bodily position, particularly in relation to
the support surface. The CNS integrates all this data, determines the body's spatial
orientation, and sends appropriate neural messages to the motor system to activate
movements that will maintain equilibrium.
Looking at what has been studied; most researchers focus on functional aspects
by explaining and clarifying the balance factors individually and not in combination,
which lead to various proposed isolated mechanisms of these factors. In order to establish
relationships among the balance factors, scientists need a form of test that includes these
factors and measures the influences of each factor on the others as well as tests for
measuring the influences of these factors on human balance, so they designed many tests,
which cover all these issues.

14
Figure 2.1. Human body balance mechanism, the role of sensory system and involving
parts.
2.2 Biomechanics of human balance
Many of the earlier studies concerning body and limb measurements ignored
biomechanics, but based on more recent knowledge, body characteristics affect postural
stability. A major impetus for anthropometric measurements has come from the needs for
technological development (Berg, 1989; Pozzo et al., 1990; Winter, 1995). The most
basic body dimensions are the distances between joints (Tinetti et al., 1988; Magnusson
et al., 1990; Allum et al., 1995; Winter, 1995), and an average set of distances expressed
as proportions of body height gives a good approximation of a body model.
Anthropometric factors should be considered in biomechanical modelling of the body
(Tinetti et al., 1988; Magnusson et al., 1990; Allum et al., 1995; Winter, 1995), in
planning a measurement and in assessing the results of measurements. Data based on
some new balance measurement systems can be normalised and related according to body
height (Kinney et al., 1996; Coast, 1997; B. L. Day et al., 1997).

15
The biomechanical model can be used in, for example, segmental analysis
(Benvenuti et al., 1999; Kavounoudias et al., 1999), but the information of body
characteristics may also directly affect the measurement values. In the inverted pendulum
model (Nashner, 1985; L. I. Wolfson et al., 1986), a longer lever arm, e.g. longer height,
would cause a greater amplitude of movement than a shorter height. Besides, the support
surface size (foot size) is related to height (male – female). Body characteristics should,
therefore, also be considered in measurement settings, e.g. as far as marker placement in
measurements with motion analysis is concerned. The differences in body characteristics
have been assumed to influence the boundaries of individual postural stability, and this
variability may affect the selection of motor strategies to maintain postural balance
control (Nashner, 1985; Magnusson et al., 1990).
The different body heights of men and women have been assumed to contribute
to the poorer postural stability of men compared to women (Taga, 1995; Kinney et al.,
1996; Pai & Patton, 1997), and it is possible that the balance differences between men
and women are mainly due to their different anthropometrics. Typically, the postural
control of both genders has been assessed with platforms (Era et al., 1996), but there are
also motion analysis results showing differences in movement strategies between men
and women (Johansson & Vallbo, 1980; Lund & Broberg, 1983; Mackel, 1985; Nashner,
1985).
2.3 Human head planes and centre of gravity (CG)
Anatomy is often described in planes, referring to two-dimensional sections of
the body. A section is a two-dimensional surface of a three-dimensional structure that
16
has been cut. A plane is an imaginary two-dimensional surface that passes through the
body. Three planes are commonly referred to in anatomy and medicine:
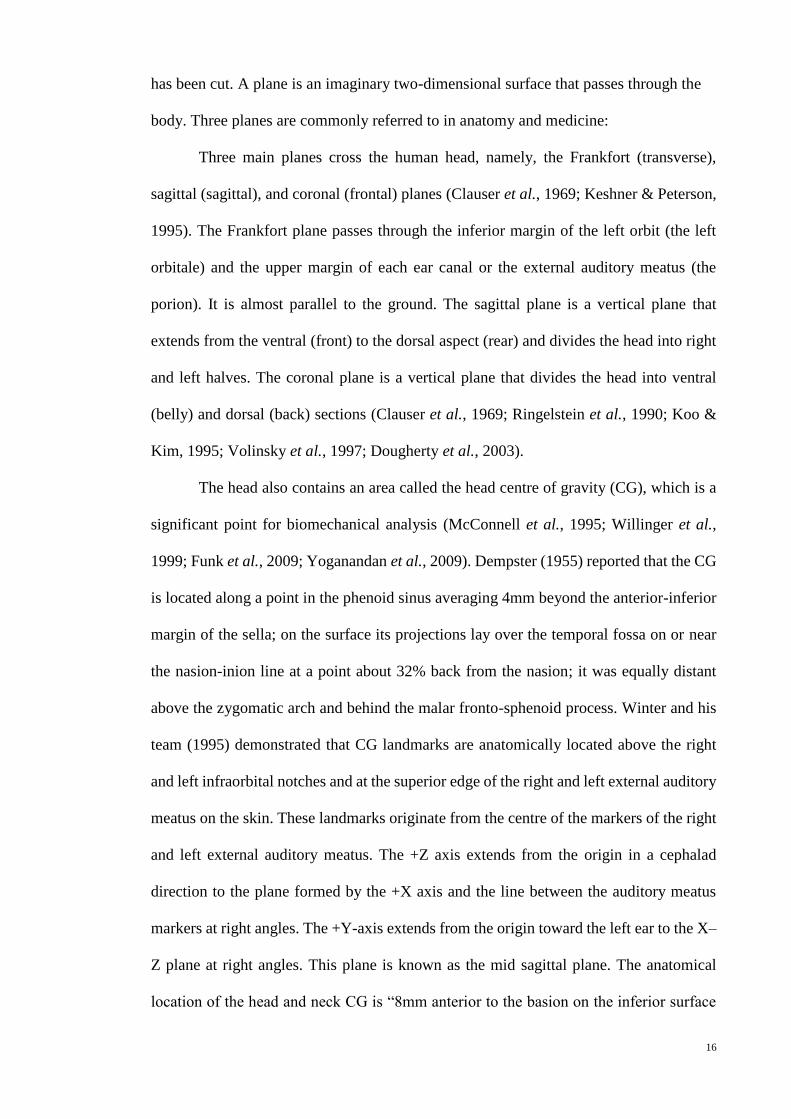
Three main planes cross the human head, namely, the Frankfort (transverse),
sagittal (sagittal), and coronal (frontal) planes (Clauser et al., 1969; Keshner & Peterson,
1995). The Frankfort plane passes through the inferior margin of the left orbit (the left
orbitale) and the upper margin of each ear canal or the external auditory meatus (the
porion). It is almost parallel to the ground. The sagittal plane is a vertical plane that
extends from the ventral (front) to the dorsal aspect (rear) and divides the head into right
and left halves. The coronal plane is a vertical plane that divides the head into ventral
(belly) and dorsal (back) sections (Clauser et al., 1969; Ringelstein et al., 1990; Koo &
Kim, 1995; Volinsky et al., 1997; Dougherty et al., 2003).
The head also contains an area called the head centre of gravity (CG), which is a
significant point for biomechanical analysis (McConnell et al., 1995; Willinger et al.,
1999; Funk et al., 2009; Yoganandan et al., 2009). Dempster (1955) reported that the CG
is located along a point in the phenoid sinus averaging 4mm beyond the anterior-inferior
margin of the sella; on the surface its projections lay over the temporal fossa on or near
the nasion-inion line at a point about 32% back from the nasion; it was equally distant
above the zygomatic arch and behind the malar fronto-sphenoid process. Winter and his
team (1995) demonstrated that CG landmarks are anatomically located above the right
and left infraorbital notches and at the superior edge of the right and left external auditory
meatus on the skin. These landmarks originate from the centre of the markers of the right
and left external auditory meatus. The +Z axis extends from the origin in a cephalad
direction to the plane formed by the +X axis and the line between the auditory meatus
markers at right angles. The +Y-axis extends from the origin toward the left ear to the X–
Z plane at right angles. This plane is known as the mid sagittal plane. The anatomical
location of the head and neck CG is “8mm anterior to the basion on the inferior surface

17
of the base of Occiput or within the bone 24 ± 5 mm from the crest of the dorsum sella;
on the surface of the head a point 10 mm anterior to the supratragic notch above the head
of the mandible is directly lateral.” Clauser and his team (Clauser et al., 1969) reported
that the mean distances of the head CG are 46.4% below the vertex and 40.0% from the
occiput. Human balance and stability are affected by the physiological balance system,
nervous system, and reaction time. Previous studies emphasise the human head as the
main control centre of balance. The visual, vestibular, and proprioceptive systems
comprise the sensory system of physiological balance in humans, which is essential to the
maintenance of balance and stability.
2.4 Anatomical landmarks
When describing the position of anatomical structures, landmarks may be used to
describe location. These landmarks may include structures, such as the umbilicus or
sternum, or anatomical lines, such as the mid clavicular line from the centre of the
clavicle. The cephalon or cephalic region refers to the head. This area is further
differentiated into the cranium (skull), facies (face), frons (forehead), oculus (eye area),
auris (ear), bucca (cheek), nausus (nose), oris (mouth), and mentis (chin). The neck area
is called the cervicis or cervical region.
To further increase precision, anatomists standardise the way in which they view
the body. Just as maps are normally oriented with north at the top, the standard body
“map”. It does not matter how the body being described is oriented, the terms are used as
if it is in anatomical position. For example, a scar in the “anterior (front) carpal (wrist)
region” would be present on the palm side of the wrist. The term “anterior” would be used
even if the hand were palm down on a table.
18
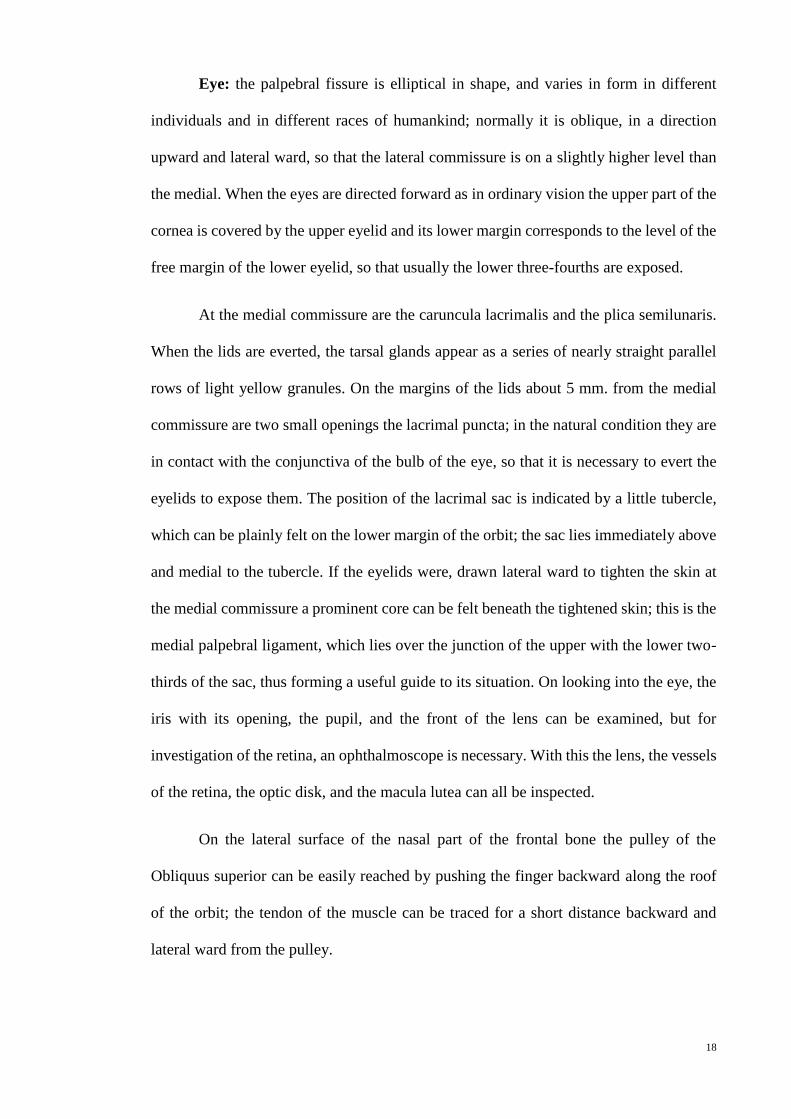
Eye: the palpebral fissure is elliptical in shape, and varies in form in different
individuals and in different races of humankind; normally it is oblique, in a direction
upward and lateral ward, so that the lateral commissure is on a slightly higher level than
the medial. When the eyes are directed forward as in ordinary vision the upper part of the
cornea is covered by the upper eyelid and its lower margin corresponds to the level of the
free margin of the lower eyelid, so that usually the lower three-fourths are exposed.
At the medial commissure are the caruncula lacrimalis and the plica semilunaris.
When the lids are everted, the tarsal glands appear as a series of nearly straight parallel
rows of light yellow granules. On the margins of the lids about 5 mm. from the medial
commissure are two small openings the lacrimal puncta; in the natural condition they are
in contact with the conjunctiva of the bulb of the eye, so that it is necessary to evert the
eyelids to expose them. The position of the lacrimal sac is indicated by a little tubercle,
which can be plainly felt on the lower margin of the orbit; the sac lies immediately above
and medial to the tubercle. If the eyelids were, drawn lateral ward to tighten the skin at
the medial commissure a prominent core can be felt beneath the tightened skin; this is the
medial palpebral ligament, which lies over the junction of the upper with the lower two-
thirds of the sac, thus forming a useful guide to its situation. On looking into the eye, the
iris with its opening, the pupil, and the front of the lens can be examined, but for
investigation of the retina, an ophthalmoscope is necessary. With this the lens, the vessels
of the retina, the optic disk, and the macula lutea can all be inspected.
On the lateral surface of the nasal part of the frontal bone the pulley of the
Obliquus superior can be easily reached by pushing the finger backward along the roof
of the orbit; the tendon of the muscle can be traced for a short distance backward and
lateral ward from the pulley.
19
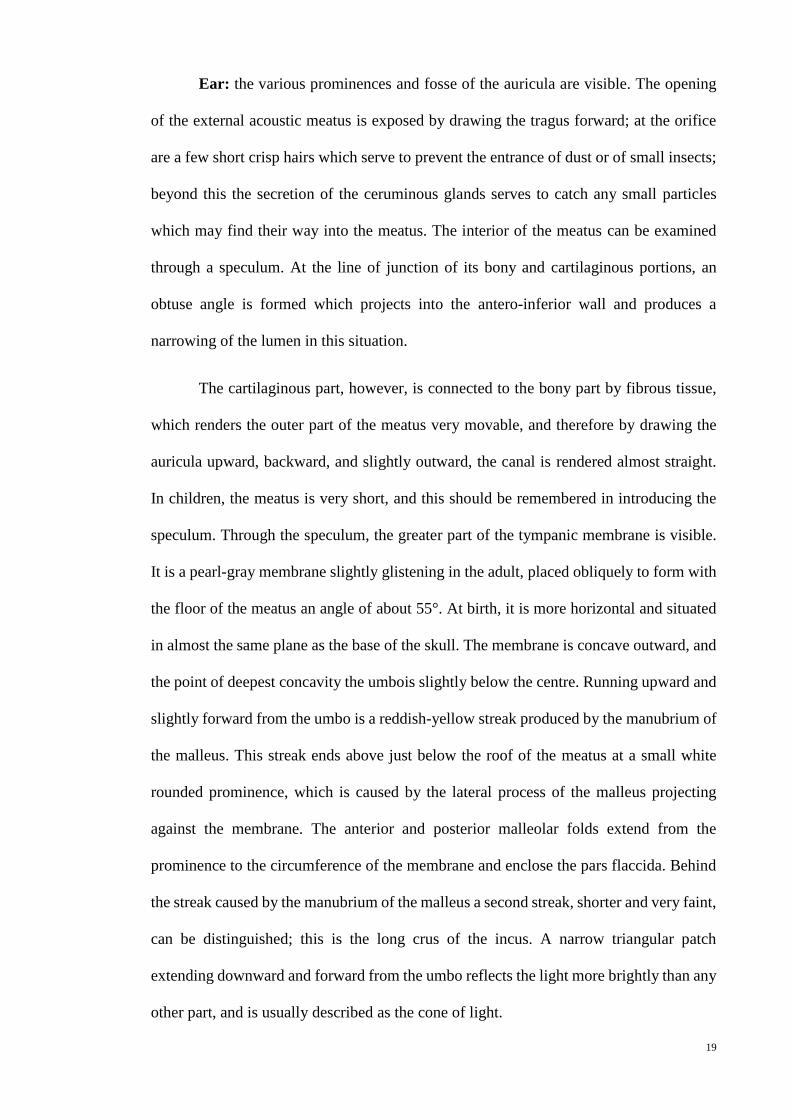
Ear: the various prominences and fosse of the auricula are visible. The opening
of the external acoustic meatus is exposed by drawing the tragus forward; at the orifice
are a few short crisp hairs which serve to prevent the entrance of dust or of small insects;
beyond this the secretion of the ceruminous glands serves to catch any small particles
which may find their way into the meatus. The interior of the meatus can be examined
through a speculum. At the line of junction of its bony and cartilaginous portions, an
obtuse angle is formed which projects into the antero-inferior wall and produces a
narrowing of the lumen in this situation.
The cartilaginous part, however, is connected to the bony part by fibrous tissue,
which renders the outer part of the meatus very movable, and therefore by drawing the
auricula upward, backward, and slightly outward, the canal is rendered almost straight.
In children, the meatus is very short, and this should be remembered in introducing the
speculum. Through the speculum, the greater part of the tympanic membrane is visible.
It is a pearl-gray membrane slightly glistening in the adult, placed obliquely to form with
the floor of the meatus an angle of about 55°. At birth, it is more horizontal and situated
in almost the same plane as the base of the skull. The membrane is concave outward, and
the point of deepest concavity the umbois slightly below the centre. Running upward and
slightly forward from the umbo is a reddish-yellow streak produced by the manubrium of
the malleus. This streak ends above just below the roof of the meatus at a small white
rounded prominence, which is caused by the lateral process of the malleus projecting
against the membrane. The anterior and posterior malleolar folds extend from the
prominence to the circumference of the membrane and enclose the pars flaccida. Behind
the streak caused by the manubrium of the malleus a second streak, shorter and very faint,
can be distinguished; this is the long crus of the incus. A narrow triangular patch
extending downward and forward from the umbo reflects the light more brightly than any
other part, and is usually described as the cone of light.

20
2.5 3D and mathematical modelling of human head
Computational face spaces derived from different kinds of face representations
(2D pixel-based images (Kaleps et al., 1984; Kim et al., 1998; Yoganandan et al., 2009)
3D surfaces from laser scans (Cromwell et al., 2001; Yoganandan et al., 2006) may make
different predictions about the similarity/confusability of faces. More formally, the
distance between two faces in a face space based on 2D pixel-based images may be very
different than the distance between faces in a three-dimensionally based face space.
Before proceeding, it is worth illustrating briefly that computationally derived
face spaces can differ both quantitatively and qualitatively in the predictions, they make
about perceptual variations in facial appearance. For example, recent work illustrates that
the application of an automatic caricature algorithm to faces represented by their 3D
structure alters the age of a face; more than its distinctiveness (Chiu, 2005; Yoganandan
et al., 2009). In that study, faces were represented as vectors in a PCA-based face space
derived from a low level encoding of the 3D head structure.
A generic caricature applied to a computationally derived face space based on a
3D representation of faces produced a very salient change in the age of faces. Applied to
a 2D configural representation of faces, a similar trajectory in the face space produced
more salient changes in the distinctiveness of faces. Thus, when implementing simple
algorithms for manipulating the appearance of faces, the nature of the features underlying
the face space has important perceptual consequences.
The relationship between human image perception and artificial image
manipulations is a central problem for many image-processing applications. An
understanding of this will allow us to change images selectively along even relatively
abstract specific perceptual dimensions. For the problem of image search in databases,

21
the mapping of human image descriptions onto formal image representations can increase
the efficiency of the search.
A computationally defined face space based on a representation of how the faces
differ in their 3D shape and 2D texture from the average face. The primary manipulation
consisted of altering the length of the face vectors in a selected subspace of the general
face space. This manipulation is opposite to that carried out normally in automated
caricature generators. Faces increased in attractiveness and decreased in apparent age
with shape or texture normalisation. Additionally, it showed that although the
normalisation procedure simultaneously affects both the age and attractiveness of the
faces, the perception of these two facial attributes was not synonymous.

22
CHAPTER 3
METODOLOGY OF RESEARCH

23
3.1 Approach and selection of research methodology (research design)
In this explorative research a new approach of using digital optical photography
(PH) to measure the distance and angle between human head surface landmarks instead
of using Computer Tomography (CT) or Magnetic Resonance Imaging (MRI) images was
presented. Hence, the mathematical relation among head balance sensors and computer
3D modelling of these sensory systems and heads CG were derived. By using this method
the new imaginary plane of human head balance factors was also presented.
This research was conducted as a prospective cross-sectional study with
convenience sampling. The CT images uses as a reference images to find out the
anatomical location of visual and vestibular system of human head. The PH images from
patients were used to select these anatomical landmarks on the surface which is used to
design the 3D modelling of human head. In addition to PH images measurement
processes, the anthropometric devices were used to measure the angle and distance among
the landmarks.
3.2 Subjects
The subjects for this study were patients who had been referred for brain CT by
an imaging specialist at the University of Malaya Medical Centre from January to April
2013. Male adults (ages 19 to 25) were selected to participate in this study. All
participants provided their informed consents for the CT scan to comply with the hospital
policy and regulations. The exclusion criteria were deformity in head, disorders of the
visual and vestibular systems, and brain tumour. A total of 72 young male and female
individuals were screened for this study, 12 of whom were excluded because of low-
resolution CT images (n = 60).

24
3.3 Ethical concern and hospital policy
Since the study involves CT images while the subjects were patients who had been
referred for brain CT by an imaging specialist, a medical ethics approval was acquired by
researchers at the University of Malaya Medical Centre as mandatory standard hospital
policy. All patient fill the volunteer form which include the informed consent for the
scanning.
3.4 Flow chart
For doing this research the new method were designed which divided to some
steps for collecting the data. This flow chart was shown the research method and data
collection parts.

25
Figure 3.4. Flowchart showing the research process.

26
3.5 Computer Tomography
The CT images were captured using the CT Siemens (Germany) with the least-
quality base of 0.75 and H41s. The images were then transferred to the Syngo
workstation, which allowed the researcher to mark points on the images, measured the
distance between the points, and determined the angle between the points. The software
generates layer-by-layer 2D images from 3D views. Three views of the CT images (i.e.,
top, left, and right) were used to locate the exact points of the visual and vestibular
systems.
Syngo workstation is a special CT images software which it was calibrated. It
means by zooming in or out the distance, angle and other measurement parameter were
never changed and the measurement is being as a real measurement parameter. By using
this software the researcher can be able to select or mark the exact point which he need.
From each side (left and right) the inner ear and midpoint of visual were marked. Hence
this marking were used as a reference point of anatomical landmarks for photography and
anthropometric devices.
After marking the collected CT images for the vestibular and midpoint regions of
each eye. Next, the distance between the selected points was measured to compare with
the photograph of the referred landmarks. The line between the visual and vestibular
systems was drawn which is known as balance factor line (BFL). Moreover, the angle
between the line of visual–vestibular markers, known as the line of balance and Frankfort
planes (AVVF), were logged for both of the left and right sides (Figure 3.5).

27
Figure 3.5. The left and right side of CT images.
3.5.1 Determining anatomical landmarks
The inner ear area was selected instead of the vestibular because the vestibular is
too small, and the area cannot be distinguished on CT images. To select the inner ear area
in the top view, the CT image layers was rotated to view both sides (left and right) in one
layer. Hence, enlarging the images was necessary to achieve the most accurate point of
the inner ear area. For selecting this area in left and right side, zooming in the images 70
% it seems necessary. Selection of midpoint for each side were done by using the ability
of Syngo workstation software which were allowed the researcher find the exact selection
of top view on each side.(synchronisation selecting points)
To find the midpoint of the eye, lines were drawn from the top to the bottom of
the eye. The software allow researcher to find the midpoint of the drawing line which
were used to mark the eyes midpoints.
The inner ear and visual marks were used as a reference landmarks of human head
balance factors which then will use to mark these sensory system on the surface for taking
the photography and doing the measurement by anthropometric devices.
3.6 Photography
Photographs (PH) of the patients were taken using a digital Nikon 10 MP camera.
The camera was placed 100 cm in front of the centre of a rotatable chair on a professional
camera stand(L. Wolfson et al., 1990). The bubble balance level of the camera stand was

28
set at zero position Figure 3.6. The captured photos were studied using CorelDRAW X6
to determine the distance and angle between the eyes and vestibular landmarks. Based on
finding the exact point of the visual and vestibular system on CT images, the coloured
markers were attached to the head surface to highlight anatomical landmarks.
Figure 3.6. The camera and seat position.
The front, left, and right views of the patients were taken while they were sitting
on a revolving chair. The photos were taken without optical or digital zooming, with the
camera set on auto mode and auto capture (the timer was set on two seconds). The height
of the camera was set based on the height of the patients. Although the camera height
changed, the centre of the camera was ensured to coincide with the centre of the chair.
Thus, the distance between the camera and the chair remained at 100 cm. The centre of
the camera guidelines conformed to the midlines of the eyes.
For selecting the centre of markers, the photos were then zoomed by 75% in
CorelDRAW X6 software. The distance between these two landmarks was also measured
(in centimetres), and a line was drawn between these points. Subsequently, the Frankfort
plane was drawn for each side to measure the angle between the visual–vestibular
landmarks and this plane (in degrees).

29
3.6.1 Determining anatomical landmarks
The photos were transferred to CorelDRAW X6. The following landmarks were
marked with the marker prior to the analysis: the caruncula lachrymal (eye corner) and a
point 1 mm in front of the anterior notch above the tragus (vestibular point) (Figure
1.1.2.1).
These landmarks on the surface were placed on the point which is shown in Figure
1.1.2.1 based on the finding of CT images that were used as a reference for selecting the
landmarks. By using the CorelDRAW X6 the centre of each surface marker were marked
in the software again to allow the researcher for measuring the distance and angle between
these points.
3.7 Anthropometric measures
Apart from CT and photographic measurements, anthropometric devices, namely,
a goniometer (ATB, Malaysia) and measuring tape (FISCO, Taiwan) were also used. The
direct measurements (surface marking) of the distance and angles from identified
landmarks which were used for photographic analysis were recorded.
A measuring tape and a goniometer were used to determine the distance and the
angle between the landmarks, respectively. The horizontal circumferences of the middle
of the head and neck and the vertical circumference of the surface distance between the
right and left tragion passing over the top of the head and the tip of the chin were obtained
by using the measuring tape. These values were used to calculate the volume of the head
as shown in (Figure 3.7). The head volume was calculated using V = 4/3 πabc.

30
Figure 3.7. The head volume calculation (V = 4/3 πabc).
3.8 Computer modelling of human head
In this study, combination of two techniques (polygonal modelling and curve
modelling) was applied for drawing the 3D modelling. Polygonal modelling, points in 3D
space, called vertices, were connected by line segments to form a polygonal mesh. The
vast majority of 3D models today are built as textured polygonal models, because they
are flexible and because computers can render them so quickly. Curve modelling, surfaces
are defined by curves, which are influenced by weighted control points. The curve follows
(but does not necessarily interpolate) the points. Increasing the weight for a point will
pull the curve closer to that point. Curve types include non-uniform rational B-spline
(NURBS), splines, patches and geometric primitives. The average of collecting data were
used to design a 3D model of the human head using SolidWorks version 2014, then the
average values of the head surface parameters from the photographic method were
computed to remodel the head structure. Finally the volume of the head was corrected
using the anthropometric data. The visual–vestibular landmarks of the sensory system

31
were identified on the model, and the imaginary plane that connects these landmarks was
illustrated. The head CG was depicted as a hollow sphere in this model and the connecting
lines between CG (middle of the hollow sphere) and the imaginary plane were drawn
resulting in a pyramidal structure (Figure 4.7.3).
3.9 Mathematical relationship
Based on finding with CT images, photography and anthropometric devices the
distances are equal between the visual and the vestibular systems on the left and right
sides; thus, an isosceles trapezoid is generated by connecting the points.
By using the geometric relation of isosceles trapezoid the angles and distance
between these points can be calculated which this calculation were led to bring the
mathematical formulas. These mathematical relation were calculated based on the
formulas of isosceles trapezoid. Hence by using the COG place and these sensory system
place the mathematical relation among them were calculated by using Math lab Software.
3.10 Statistical analysis
For data analysis, the Graph Pad Prism version 6 was used. One-way ANOVA
and Bonferroni test for match pairs of the CT images, photos, and anthropometric tools
were performed with P < 0.05. The Pearson product-moment correlation coefficient was
used with 95% confidence interval. The intraclass correlation coefficient (ICC) reliability
was determined to compare the data collected by two different researchers. Furthermore,
limitation of agreement (LOA) was calculated using the Bland-Altman test on SPSS
version 24.

32
CHAPTER 4
RESULTS

33
4.1 Demographics data
The subjects of this research were young adult male and female (age = 22 ± 3
years old), with average height (165 ± 6.25 cm) and weight (65 ± 9.36 kg). These were
patients who had been referred by specialist for CT scans. For comparison between
gender, equal number of subjects from each gender was selected (n = 60; male = 30 and
female = 30). Table 4.1 shows means and standard deviations (M ± SD) of subject’s
demographic data. From the data, no significant difference was found between genders,
thus it was assumed that all subjects have similar characteristics. All subjects were
between 19 to 25 years old.
Table 4.1.1 Demographic of subject’s characteristics for each gender presents in mean
and standard deviation.
Male Female
(n = 30) (n = 30)
Age (year) 22 ± 3 22 ± 3
Height (cm) 170 ± 7.45 160 ± 5.05
Weight (kg) 70 ± 10.42 60 ± 8.32

34
4.2 Distance and angle from CT images
After analysing the CT images using the Syngo software by placing the markers
on selected points on the images, the distances and angles measured between the selected
points are presented in Table 4.2.1.
Table 4.2.1 Parameters obtained from CT scan images.
Male Female
Right Left Right Left
DVV1 (cm) 8.16 ± 0.35 8.16 ± 0.35 8.16 ± 0.37 8.16 ± 0.37
AVVF2 (o) 11.80 ± 0.25 11.80 ± 0.25 11.80 ± 0.24 11.80 ± 0.24
TBD3 (cm) 3.25 ± 0.18 3.25 ± 0.18 3.25 ± 0.16 3.25 ± 0.16
THVID4 (cm) 7.87 ± 0.26 7.87 ± 0.26 7.56 ± 0.23 7.56 ± 0.23
THVED5 (cm) 12.68 ± 0.32 12.68 ± 0.32 12.57 ± 0.29 12.57 ± 0.29
BHVED6 (cm) 14.62 ± 0.65 14.62 ± 0.65 14.58 ± 0.54 14.58 ± 0.54
1 DVV = Distance between the visual and vestibular lines 2 AVVF = Angle between the visual-vestibular lines and the Frankfort plane 3 TBD = Distance from top to bottom of eye 4 THVID = Distance between the top head (forehead) to the eye 5 THVED = Distance between the top head (forehead) to the ear 6 BHVED = Distance between the head bottom and the ear

35
4.3 Distance and angle from photography
The PH images were taken from front, left and right views of each patient with
the markers placed on the surface of head landmarks. By transferring the PH images to
CorelDraw, measurements of the distance and angles are tabulated in Table 4.3.1.
Table 4.3.1 Parameters obtained from photography (PH) images.
Male Female
Right Left Right Left
DVV1 (cm) 8.11 ± 0.58 8.11 ± 0.58 8.11 ± 0.55 8.11 ± 0.55
AVVF2 (o) 11.65 ± 0.45 11.65 ± 0.45 11.65 ± 0.42 11.65 ± 0.42
TBD3 (cm) 3.20 ± 0.20 3.20 ± 0.20 3.20 ± 0.16 3.20 ± 0.16
THVID4 (cm) 8.13 ± 0.36 8.13 ± 0.36 8.10 ± 0.37 8.10 ± 0.37
THVED5 (cm) 13.40 ± 0.24 13.40 ± 0.24 13.30 ± 0.29 13.30 ± 0.29
BHVED6 (cm) 15.32 ± 0.42 15.32 ± 0.42 15.22 ± 0.44 15.22 ± 0.44
1 DVV = Distance between the visual and vestibular lines 2 AVVF = Angle between the visual-vestibular lines and the Frankfort plane 3 TBD = Distance from top to bottom of eye 4 THVID = Distance between the top head (forehead) to the eye 5 THVED = Distance between the top head (forehead) to the ear 6 BHVED = Distance between the head bottom and the ear

36
4.4 Distance and angle using anthropometric devices
The anthropometric devices were used to measure the distances and angles of
surface markers of head landmarks. The results are presented in Table 4.4.
Table 4.4.1 Parameters obtained using anthropometric devices.
Male Female
Right Left Right Left
DVV1 (cm) 8.08 ± 0.41 8.08 ± 0.41 8.08 ± 0.45 8.08 ± 0.45
AVVF2 (o) 11.6 ± 0.48 11.6 ± 0.48 11.6 ± 0.43 11.6 ± 0.43
TBD3 (cm) 3.21 ± 0.19 3.21 ± 0.19 3.21 ± 0.13 3.21 ± 0.13
THVID4 (cm) 8.10 ± 0.36 8.10 ± 0.36 8.08 ± 0.37 8.08 ± 0.37
THVED5 (cm) 13.36 ± 0.24 13.36 ± 0.24 13.16 ± 0.29 13.16 ± 0.29
BHVED6 (cm) 15.29 ± 0.42 15.29 ± 0.42 15.09 ± 0.39 15.09 ± 0.39
1 DVV = Distance between the visual and vestibular lines 2 AVVF = Angle between the visual-vestibular lines and the Frankfort plane 3 TBD = Distance from top to bottom of eye 4 THVID = Distance between the top head (forehead) to the eye 5 THVED = Distance between the top head (forehead) to the ear 6 BHVED = Distance between the head bottom and the ear
4.5 Statistical analysis
4.5.1 Correlations
The Pearson correlation was applied between CT and PH for measures: distance
between the visual and vestibular lines, angle between the visual-vestibular lines and the
Frankfort plane and distance from top to bottom of eye which are shown in Table 4.5.1.
The Confidence interval set 95% and two tailed P value is (DVV = 0.001359,
AVVF = 0.004371 and TBD = 0.003449) which is present no significant different.

37
Table 4.5.1 Pearson correlation (r value) between CT and PH images.
DVV1 AVVF2 TBD3 THVID4 THVED5 BHVED6
DVV1 0.995 - - - - -
AVVF2 - 0.998 - - - -
TBD3 - - 0.997 - - -
THVID4 - - - 0.879 - -
THVED5 - - - - 0.884 -
BHVED6 - - - - - 0.867
1 DVV = Distance between the visual and vestibular lines 2 AVVF = Angle between the visual-vestibular lines and the Frankfort plane 3 TBD = Distance from top to bottom of eye 4 THVID = Distance between the top head (forehead) to the eye 5 THVED = Distance between the top head (forehead) to the ear 6 BHVED = Distance between the head bottom and the ear
4.5.2 Analisis of variance (ANOVA)
Two way ANOVA was applied determine the interaction between gender (male
and female) and methods used (CT, PH and anthropometric device). Results show that
there was no effect of gender (F = 0.884 and t = 0.7587 and p = 0.567), and the data was
collapse and one-way repeated measured was then used to analyse the data.
One way ANOVA was applied for comparing the differences in distances and
angle in based on the three methods. Table 4.5.1 presents the values of angle
measurements with different devices on male/female for both side.
4.5.3 Intraclass correlation (ICC) between ratters
To determine the reliability of the measurements, the ICC between ratters was
calculated. The ICC the result was 0.965 with the F-test 56.303, df1 = 29, df2 = 29.
PH
CT

38
4.6 Imaginary plane
The imaginary plane of the human head balance system was constructed using
information obtained from the visual and vestibular anatomical landmarks. From the
sagittal view, this plane crossed the Transverse plane with an average angle of 11.65 ±
0.25°. The repeatability of measurements between the two ratters using the ICC was 0.96
and 0.97 for the photos and anthropometric devices respectively. Figures 4.6.1, 4.6.2, and
4.6.3 show the different view of imaginary page of balance factors and transverse plane.
Figure 4.6.1. Sagittal view of Planes (Plane 9 = transverse, trapezoid = imaginary plane).

39
Figure 4.6.2. Top view of Planes (Plane 9 = transverse, trapezoid = imaginary plane).
Figure 4.6.3. Front view of planes (Plane 9 = transverse, trapezoid = imaginary plane).
Based on the findings of this study which proved that the distances between the
anatomical landmarks of visual and vestibular for both sides (left/right) were similar,
therefore an isosceles trapezoid was proposed as shown in Figure 4.6.4. In the discussion
section equations will be derived based on the proposed mathematical relation.
Eyes
Vestibular
α α

40
Figure 4.6.4. Schematic view of imaginary plane of human head balance factors.
4.7 3D modelling
This study proposed a new 3-D model of the human head that recognises the head
CG through the visual and vestibular landmarks. This research utilised three methods in
the process; CT scan, photography, and anthropometry which findings were then
integrated into SolidWorks software for 3D modelling as close as possible to the real
head. Figures 4.7.1 and 4.7.2 show the general view of the 3D model which the CG, visual
and vestibular landmarks were highlighted. Figure 4.7.3 shows the pyramid which the top
was CG and base the imaginary plane of connecting the visual-vestibular landmarks. To
calculate the parametric mathematical relation among CG, visual and vestibular points
the connecting, height and midlines were drawn for each side of the pyramid.
Figure 4.7.1. Lateral view of 3-D model.

41
Figure 4.7.2. Left and top view of 3D model.
Figure 4.7.3. Close-up view of CG and visual-vestibular pyramid.

42
CHAPTER 5
DISCUSSIONS

43
5.1 Introduction
This chapter discusses the mathematical relationships (distances and angles)
between visual and vestibular head balance sensory systems. Briefly, three methods were
employed to locate the visual–vestibular landmarks namely the CT images, digital
photography and anthropometric devices. The study also aimed to prove that an ordinary
digital photography is a reliable tool in locating the anatomical landmarks as compared
to a sophisticated CT images. The mathematical relationships were then used to establish
a new plane connecting the visual and vestibular landmarks. The new visual-vestibular
plane was then explained in relation to the Frankfort plane (transverse plane) and CG.
Finally this study introduced a new 3D model of the human head illustrating the
relationship between the proposed plane and CG.
5.2 Anatomical landmarks and the proposed plane.
Based on Tables 4.2.1, 4.3.1 and 4.4.1, the major finding of this study showed the
distance between; the visual and vestibular (both left and right) was 8.11 ± 0.58 cm, while,
the angle between the visual-vestibular line and the Frankfort plane was 11.65 ± 0.45o.
The outcomes of the three methods employed were similar to each other (p > 0.05), which
suggests ordinary digital photography and anthropometric devices are compatible to CT
images.
The landmarks of the human head and their connections, including the bitragion-
coronal, bitragion-minimum frontal, bitragion-subnasale, and bitragion-menton, have
been previously studied. The reference point for all the measurements was the tragion
(auris) (Hamalainen & Sarvas, 1989; Grosbras et al., 1999; Yoganandan et al., 2006). In
this study, the frons (forehead), oculus (eye area), auris (ear), and mentis (chin) were
designated as anatomical landmarks, which cover a wider area of the head (Walker et al.,
44
1973; T. Pozzo et al., 1991; Collignon et al., 1995; Keshner & Peterson, 1995; McConnell
et al., 1995; Cromwell et al., 2001; Yoganandan et al., 2009).
This study applied a new approach using the head anatomical landmarks to cover
some of the weaknesses of previous methods. MRI and CT are hazardous for the human
health; for example, exposure to ionising radiation can increase the risk of cancer, and
high doses can cause serious damage, including radiation burns. Moreover, these methods
are costly for the patients. Collecting data through CT scan is not easy because it
necessitates bio-imaging knowledge (Broadbent, 1931; George & Fabian, 1991;
Willinger et al., 1999; Karch, 2004; Mikaeloff et al., 2004; Funk et al., 2009; Haruna et
al., 2010). Analysing CT images requires special equipment and software where the 3D
images are transferred to 2D layers and manipulated to obtain the best view to locate the
landmarks. These procedures are time consuming and complicated. The new method used
in this study can reduce the time and cost, making the study of human head landmarks
easier and safer. Currently, with the advent of modern devices and software, researchers
not only measure the distance between these points but also the angle. Hence, this study
introduced a new approach to measure the distance and angle on photos taken using an
ordinary digital camera. One main reason for using these anatomical landmarks is that
these points can be easily located on the human head surface (Wang et al., 1996; Grosbras
et al., 1999; Klose & Sollmann, 2000; Kähler et al., 2002; Karch, 2004; Mikaeloff et al.,
2004; Chiu, 2005; Funk et al., 2009; Yoganandan et al., 2009). Meanwhile, some of the
points used in previous research were modified and improved. In the future, the
researchers may use the average angle between the visual–vestibular landmarks and the
Frankfort plane as anatomical landmarks to represent the sensory systems. The CT images
were used as reference to validate the new method. A comparison of the collected data
by two researchers showed that the new method is strongly reliable.

45
Research on planes associated with head and neck dates back to the 1950s when
the sagittal, coronal, and Frankfort planes were first introduced (Broadbent, 1931;
Hamalainen & Sarvas, 1989; McConnell et al., 1995; Chancey et al., 2007; Yoganandan
et al., 2009). Although prior research were find the junction of this three plane were
placed of the CG which most researches used CG for biomechanical analysis of head
movements and they have shown that the geometric location of the head CG is close
proximity to the visual and vestibular systems, but they did not describe the mathematical
relation between CG and these sensory system. Hence, the head sensory balance plane
was not described. (Winter, 1995; Wang et al., 1996; Dumoulin et al., 2000; Klose &
Sollmann, 2000; Kähler et al., 2002). In this study, the oculus (eye area) and auris (ear)
were the anatomical landmarks from both left and right of the head that connect and form
the new proposed plane (Winter, 1995; Grosbras et al., 1999; Willinger et al., 1999).
The photograph and direct measurement methods introduced in the current study
can reduce the time and cost. Studying human head sensory system landmarks is easier
and safer with the new methods compared to the abovementioned methods. The CT
images were used as a reference to validate the new methods. Comparison of the collected
data by the two researchers indicated the strong reliability of the method. Interestingly,
comparison of the CT images, photographs, and anthropometric tools showed no
statistical difference which is shown in Table 4.5.1. Hence, it is clear that using plane
photography and anthropometric tools produce reliable results (ICC was 0.970 for the
photos and 0.960 for the anthropometry tools, the LOA was 0.302 for the photo and 0.294
for anthropometry tools).
With modern devices and software, researchers can measure the distance and
angle between the anatomical points. Hence, the new methods introduced in this study
can be used to measure the distance, angle, and planes from the obtained photos using a
standard digital camera and software. These anatomical landmarks were used because

46
they can be easily located on the surface of the human head. Some of these points have
been used in previous studies but were modified and improved in this study (Broadbent,
1931; Chiu, 2005; Funk et al., 2009; Haruna et al., 2010).
5.3 3D modelling of human head
Previous studies showed that the head CG is related to the visual and vestibular
systems. Nonetheless, none of these works addressed the sensory balance plane of the
human head, to the author’s knowledge (Volinsky et al., 1997; Dumoulin et al., 2000;
Chiu, 2005; Broekhuis et al., 2009).
By using the anatomical landmarks and average of data measurement, the
polygonal model of head were drawn which the curve model help to point the CG and
create skins as much as possible to real average of measurement. Figure 5.4.1 shows the
polygonal of this model and Figure 5.4.2 shows the curve model.

47
Figure 5.3.1. Polygonal model of human head.

48
Figure 5.3.2. Curve model of human head.
The 3D modelling of the actual human head or body may be useful for future
research. This model can help researcher to better understanding of human balance
factor position and may led to farther study about the relation of geometric position of
sensory system and human balance mechanism.
5.4 Mathematical model between human head factors
This 3D model of the head was designed preciously based on the results obtained
from the mathematical relations among the sensory systems of the head which is shown
in Figures 4.7.3. Figure 5.4.1 illustrates the geometric locations of the visual–vestibular
and the CG. The resultant shape is pyramidal; the base is an imaginary plane of the
sensory system of the head, and the apex is the CG.
49
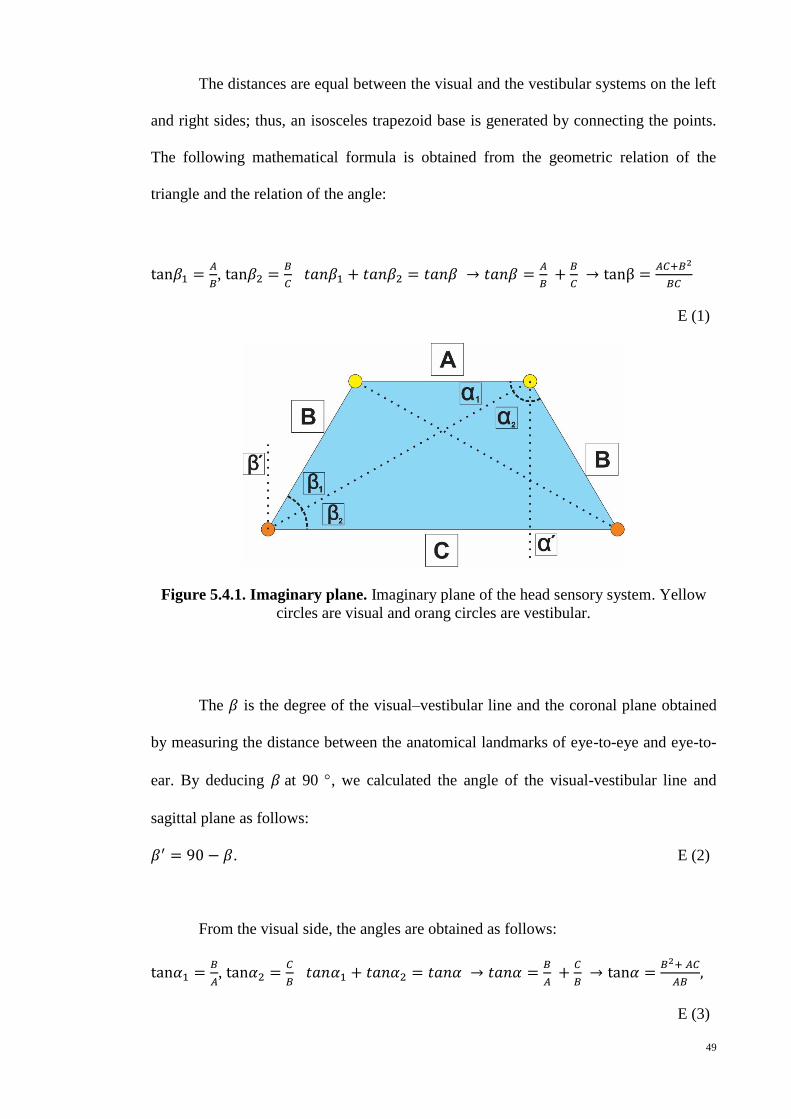
The distances are equal between the visual and the vestibular systems on the left
and right sides; thus, an isosceles trapezoid base is generated by connecting the points.
The following mathematical formula is obtained from the geometric relation of the
triangle and the relation of the angle:
tan𝛽1 =𝐴
𝐵, tan𝛽2 =
𝐵
𝐶 𝑡𝑎𝑛𝛽1 + 𝑡𝑎𝑛𝛽2 = 𝑡𝑎𝑛𝛽 → 𝑡𝑎𝑛𝛽 =
𝐴
𝐵 +
𝐵
𝐶 → tanβ =
𝐴𝐶+𝐵2
𝐵𝐶
E (1)
Figure 5.4.1. Imaginary plane. Imaginary plane of the head sensory system. Yellow
circles are visual and orang circles are vestibular.
The 𝛽 is the degree of the visual–vestibular line and the coronal plane obtained
by measuring the distance between the anatomical landmarks of eye-to-eye and eye-to-
ear. By deducing 𝛽 at 90 , we calculated the angle of the visual-vestibular line and
sagittal plane as follows:
𝛽′ = 90 − 𝛽. E (2)
From the visual side, the angles are obtained as follows:
tan𝛼1 =𝐵
𝐴, tan𝛼2 =
𝐶
𝐵 𝑡𝑎𝑛𝛼1 + 𝑡𝑎𝑛𝛼2 = 𝑡𝑎𝑛𝛼 → 𝑡𝑎𝑛𝛼 =
𝐵
𝐴 +
𝐶
𝐵 → tan𝛼 =
𝐵2+ 𝐴𝐶
𝐴𝐵,
E (3)

50
The 𝛼 is the degree of the visual-vestibular line and the coronal plane. Hence, by
deriving 𝛽 at 90 , we compute the angle of the visual–vestibular line and sagittal plane:
𝛼′ = 90 − 𝛼. E (4)
We calculate the angle between the visual–vestibular line and the coronal, sagittal,
and Frankfort planes according to the distance between the anatomical landmarks of the
visual and vestibular systems. The angle of the visual or vestibular point from each main
plane can be calculated by measuring the distance of visual-vestibular, eye to eye and ear
to ear points.
5.5 Limitation of study
Since this study employed participants among young adult population,
generalising the findings may not be appropriate. Independent studies using population
with different age groups are then warranted.
Sample size of this study was not large due to the number of patients agreeable to
participate in this research. Getting patients who need to do whole brain CT scan was not
easy, in addition they had to be free of any illness of visual-vestibular system as well as
deformity of head.
5.6 Future study
In future studies, the researchers may use the imaginary plane based on the
visual- vestibular landmarks as a human head balance plane which in studies related
with biomechanical analysis of human movement and stability. Hence it could be apply
for athletics for improving the balance and stability, which may led to find out better
technical performance while they doing the act. For example in badminton game, which

51
is need focus on shuttle, the head movement have essential role. This new method can
help on greater analysis of movement and figure out more detail of mistake technical.
5.6 Practical application
Current study proposed a new method (photography) for studying the anatomical
landmarks of head sensory systems to cover the weaknesses of other methods that are
expensive, hazardous and not user friendly. This method not is not only cheaper but also
it is a green way to do research on human body.
5.7 Conclusion
A new method was introduced to identify the head balance plane with the intent
to find out the mathematical relations between the human head balance factors and
estimate the algorithm of human balance. Although the prior research used several
methods for finding the human balance factors, for the first time an imaginary plane of
human head balance is introduced. The new photographic method and anthropometry
tools can be easier, cheaper and safer for human. The finding of this study support
strongly the distance and angle between eye and ear in both gender are equal. Hence there
is no difference among races as well. The following mathematical formula is obtained
from the geometric relation of the triangle and the relation of the angle:
tan𝛽1 =𝐴
𝐵, tan𝛽2 =
𝐵
𝐶 𝑡𝑎𝑛𝛽1 + 𝑡𝑎𝑛𝛽2 = 𝑡𝑎𝑛𝛽 → 𝑡𝑎𝑛𝛽 =
𝐴
𝐵 +
𝐵
𝐶 → tanβ =
𝐴𝐶+𝐵2
𝐵𝐶 .

52
REFERENCES

53
Allum, J., & Honegger, F. (1994). Linking biomechanical models of human postural
control to the diagnosis of sensorimotor pathophysiology. Paper presented at the
Vestibular and neural fronts (12lh International Symposium on Posture and Gait).
Elsevier, Amsterdam.
Allum, J., & Honegger, F. (1998). Interactions between vestibular and proprioceptive
inputs triggering and modulating human balance-correcting responses differ
across muscles. Experimental Brain Research, 121(4), 478-494.
Allum, J., Honegger, F., & Acuna, H. (1995). Differential control of leg and trunk muscle
activity by vestibulo-spinal and proprioceptive signals during human balance
corrections. Acta oto-laryngologica, 115(2), 124-129.
Beier, G., Schuck, M., Schuller, E., & Spann, W. (1979). Determination of Physical Data
of the Head. I. Center of Gravity and Moments of Inertia of Human Heads: DTIC
Document.
Benvenuti, F., Mecacci, R., Gineprari, I., Bandinelli, S., Benvenuti, E., Ferrucci, L., . . .
Stanhope, S. J. (1999). Kinematic characteristics of standing disequilibrium:
Reliability and validity of a posturographic protocol. Archives of Physical
Medicine and Rehabilitation, 80(3), 278-287.
Berg, K. (1989). Measuring balance in the elderly: preliminary development of an
instrument. Physiotherapy Canada, 41(6), 304-311.
Bernick, C., Kuller, L., Dulberg, C., Longstreth Jr, W., Manolio, T., Beauchamp, N., &
Price, T. (2001). Silent MRI infarcts and the risk of future stroke The
cardiovascular health study. Neurology, 57(7), 1222-1229.
Brent, R. L. (1989). The effect of embryonic and fetal exposure to x-ray, microwaves,
and ultrasound: counseling the pregnant and nonpregnant patient about these
risks. Semin Oncol, 16(5), 347-368.
Broadbent, B. H. (1931). A new x-ray technique and its application to orthodontia. The
Angle Orthodontist, 1(2), 45-66.
Broekhuis, S. R., Fütterer, J. J., Barentsz, J. O., Vierhout, M. E., & Kluivers, K. B. (2009).
A systematic review of clinical studies on dynamic magnetic resonance imaging
of pelvic organ prolapse: the use of reference lines and anatomical landmarks.
International Urogynecology Journal, 20(6), 721-729.
Carpenter, M., Allum, J., & Honegger, F. (2001). Vestibular influences on human postural
control in combinations of pitch and roll planes reveal differences in
spatiotemporal processing. Experimental Brain Research, 140(1), 95-111.
Cathers, I., Day, B. L., & Fitzpatrick, R. C. (2005). Otolith and canal reflexes in human
standing. The Journal of physiology, 563(1), 229-234.
Chancey, V. C., Ottaviano, D., Myers, B. S., & Nightingale, R. W. (2007). A kinematic
and anthropometric study of the upper cervical spine and the occipital condyles.
Journal of biomechanics, 40(9), 1953-1959.

54
Chiu, C. (2005). Simulation of positional center of gravity for different human motions.
Journal of Medical and Biological Engineering, 25(3), 123.
Clauser, C. E., McConville, J. T., & Young, J. W. (1969). Weight, volume, and center of
mass of segments of the human body: DTIC Document.
Coast, J. R. (1997). Handbook of Physiology. Section 12. Exercise: Regulation and
Integration of Multiple Systems. Medicine & Science in Sports &
Exercise, 29(3), 424,425.
Collignon, A., Maes, F., Delaere, D., Vandermeulen, D., Suetens, P., & Marchal, G.
(1995). Automated multi-modality image registration based on information
theory. Paper presented at the Information processing in medical imaging.
Creath, R., Kiemel, T., Horak, F., & Jeka, J. J. (2002). Limited control strategies with the
loss of vestibular function. Experimental Brain Research, 145(3), 323-333.
Cromwell, R. L., Aadland-Monahan, T. K., Nelson, A. T., Stern-Sylvestre, S. M., &
Seder, B. (2001). Sagittal plane analysis of head, neck, and trunk kinematics and
electromyographic activity during locomotion. Journal of Orthopaedic & Sports
Physical Therapy, 31(5), 255-262.
Day, Cauquil, A. S., Bartolomei, L., Pastor, M., & Lyon, I. (1997). Human body-segment
tilts induced by galvanic stimulation: a vestibularly driven balance protection
mechanism. The Journal of physiology, 500(Pt 3), 661-672.
Day, B. L., Séverac Cauquil, A., Bartolomei, L., Pastor, M. A., & Lyon, I. N. (1997).
Human body-segment tilts induced by galvanic stimulation: a vestibularly driven
balance protection mechanism. The Journal of physiology, 500(3), 661-672.
Dichgans, J., & Brandt, T. (1978). Visual-vestibular interaction: Effects on self-motion
perception and postural control Perception (pp. 755-804): Springer.
Dougherty, R. F., Koch, V. M., Brewer, A. A., Fischer, B., Modersitzki, J., & Wandell,
B. A. (2003). Visual field representations and locations of visual areas V1/2/3 in
human visual cortex. Journal of Vision, 3(10), 1.
Dumoulin, S. O., Bittar, R. G., Kabani, N. J., Baker, C. L., Le Goualher, G., Pike, G. B.,
& Evans, A. C. (2000). A new anatomical landmark for reliable identification of
human area V5/MT: a quantitative analysis of sulcal patterning. Cerebral Cortex,
10(5), 454-463.
Dunlap, R. A., & Dunlap, R. (1997). The golden ratio and Fibonacci numbers: World
Scientific.
Era, P., Schroll, M., Ytting, H., Gause-Nilsson, I., Heikkinen, E., & Steen, B. (1996).
Postural Balance and Its Sensory-Motor Correlates in 75-Year-Old Men and
Women: A Cross-National Comparative Study. The Journals of Gerontology
Series A: Biological Sciences and Medical Sciences, 51A(2), M53-M63.
Fitzpatrick, R. C., & Day, B. L. (2004). Probing the human vestibular system with
galvanic stimulation. Journal of Applied Physiology, 96(6), 2301-2316.
55
Funk, J. R., Cormier, J. M., Bain, C. E., Guzman, H., & Bonugli, E. (2009). Validation
and application of a methodology to calculate head accelerations and neck loading
in soccer ball impacts. Society of Automotive Engineers. Paper, 01-0251.
George, I., & Fabian, A. (1991). X-ray reflection from cold matter in active galactic nuclei
and X-ray binaries. Monthly Notices of the Royal Astronomical Society, 249, 352-
367.
Grosbras, M.-H., Lobel, E., Van de Moortele, P.-F., LeBihan, D., & Berthoz, A. (1999).
An anatomical landmark for the supplementary eye fields in human revealed with
functional magnetic resonance imaging. Cerebral Cortex, 9(7), 705-711.
Hamalainen, M. S., & Sarvas, J. (1989). Realistic conductivity geometry model of the
human head for interpretation of neuromagnetic data. Biomedical Engineering,
IEEE Transactions on, 36(2), 165-171.
Haruna, A., Muro, S., Nakano, Y., Ohara, T., Hoshino, Y., Ogawa, E., . . . Chin, K. (2010).
CT scan findings of emphysema predict mortality in COPD. CHEST Journal,
138(3), 635-640.
Horak, F., Nashner, L., & Diener, H. (1990). Postural strategies associated with
somatosensory and vestibular loss. Experimental Brain Research, 82(1), 167-177.
Hughes, M. O. (2007). A Pictorial Anatomy of the Human Eye/Anophthalmic Socket: A
Review for Ocularists. eye, 4(5), 6.
Indovina, I., Maffei, V., Bosco, G., Zago, M., Macaluso, E., & Lacquaniti, F. (2005).
Representation of visual gravitational motion in the human vestibular cortex.
Science, 308(5720), 416-419.
Johansson, R. S., & Vallbo, Å. B. (1980). Spatial properties of the population of
mechanoreceptive units in the glabrous skin of the human hand. Brain Research,
184(2), 353-366.
Kähler, K., Haber, J., Yamauchi, H., & Seidel, H.-P. (2002). Head shop: generating
animated head models with anatomical structure. Paper presented at the
Proceedings of the 2002 ACM SIGGRAPH/Eurographics symposium on
Computer animation.
Kaleps, I., Clauser, C. E., Young, J. W., Chandler, R. F., Zehner, G. F., & McConville, J.
T. (1984). Investigation into the mass distribution properties of the human body
and its segments. Ergonomics, 27(12), 1225-1237.
Karch, A. M. (2004). Don’t get burnt by the MRI: transdermal patches can be a hazard to
patients. AJN The American Journal of Nursing, 104(8), 31.
Kavounoudias, A., Gilhodes, J.-C., Roll, R., x000E, gine, & Roll, J.-P. (1999). From
balance regulation to body orientation: two goals for muscle proprioceptive
information processing? Experimental Brain Research, 124(1), 80-88.
Keshner, E., & Peterson, B. (1995). Mechanisms controlling human head stabilization. I.
Head-neck dynamics during random rotations in the horizontal plane. Journal of
neurophysiology, 73(6), 2293-2301.
56
Kim, Y.-M., Ahn, J. H., Kang, H. S., & Kim, H. J. (1998). Estimation of the extent of
osteonecrosis of the femoral head using MRI. The Journal of Bone and Joint
Surgery, 80(6), 954-958.
Kinney, L. T. L., Bain, C., & Moses, S. (1996). A Comparison of Static and Dynamic
COG Excursion in Older Men Versus Women. Neurology Report, 20(2), 85-87.
Klose, A., & Sollmann, W.-P. (2000). Anatomical variations of landmarks for
implantation at the cochlear nucleus. Journal of Laryngology & Otology,
114(S27), 8-10.
Koo, K., & Kim, R. (1995). Quantifying the extent of osteonecrosis of the femoral head.
A new method using MRI. Journal of Bone & Joint Surgery, British Volume,
77(6), 875-880.
Lacour, M., Barthelemy, J., Borel, L., Magnan, J., Xerri, C., Chays, A., & Ouaknine, M.
(1997). Sensory strategies in human postural control before and after unilateral
vestibular neurotomy. Experimental Brain Research, 115(2), 300-310.
Leibowitz, H., Rodemer, C. S., & Dichgans, J. (1979). The independence of dynamic
spatial orientation from luminance and refractive error. Attention, Perception, &
Psychophysics, 25(2), 75-79.
Lord, S. R., & Menz, H. B. (2000). Visual contributions to postural stability in older
adults. Gerontology, 46(6), 306-310.
Lund, S., & Broberg, C. (1983). Effects of different head positions on postural sway in
man induced by a reproducible vestibular error signal. Acta Physiologica
Scandinavica, 117(2), 307-309.
Mackel, R. (1985). Motor control mechanisms in health and disease, (vol 39, Advances
in Neurology), edited by John E. Desmedt, New York, Raven Press, 1983, 1, 200
pp, illustrated. Annals of Neurology, 17(2), 214-214.
Magnusson, M., Enbom, H., Johansson, R., & Pyykkö, I. (1990). Significance of Pressor
Input from the Human Feet in Anterior-Posterior Postural Control: The Effect of
Hypothermia on Vibration-Induced Body-sway. Acta oto-laryngologica, 110(3-
4), 182-188.
Manchester, D., Woollacott, M., Zederbauer-Hylton, N., & Marin, O. (1989). Visual,
vestibular and somatosensory contributions to balance control in the older adult.
Journal of Gerontology, 44(4), M118-M127.
Mathie, M. J., Coster, A. C., Lovell, N. H., & Celler, B. G. (2004). Accelerometry:
providing an integrated, practical method for long-term, ambulatory monitoring
of human movement. Physiological measurement, 25(2), R1.
Maurer, C., Mergner, T., Bolha, B., & Hlavacka, F. (2000). Vestibular, visual, and
somatosensory contributions to human control of upright stance. Neuroscience
Letters, 281(2), 99-102.

57
McConnell, W. E., Howard, R. P., Van Poppel, J., Krause, R., Guzman, H. M., Bomar, J.
B., . . . Hatsell, C. P. (1995). Human head and neck kinematics after low velocity
rear-end impacts-understanding “whiplash”: SAE Technical Paper.
Mergner, Siebold, C., Schweigart, G., & Becker, W. (1991). Human perception of
horizontal trunk and head rotation in space during vestibular and neck stimulation.
Experimental Brain Research, 85(2), 389-404.
Mergner, T., Schweigart, G., & Fennell, L. (2009). Vestibular humanoid postural control.
Journal of Physiology-Elsevier, 103(3), 178.
Mikaeloff, Y., Adamsbaum, C., Husson, B., Vallée, L., Ponsot, G., Confavreux, C., . . .
Suissa, S. (2004). MRI prognostic factors for relapse after acute CNS
inflammatory demyelination in childhood. Brain, 127(9), 1942-1947
.
Mort, D. J., Malhotra, P., Mannan, S. K., Rorden, C., Pambakian, A., Kennard, C., &
Husain, M. (2003). The anatomy of visual neglect. Brain, 126(9), 1986-1997.
Naito, S., Kim, Y., & Obinata, G. (2012). Analysis of the Body Control System Related
to Mental Workload. Int J Adv Robotic Sy, 9(262).
Nashner, L. M. (1985). Strategies for Organization of Human Posture 7th International
Symposium of the International Society of Posturography, Houston, Texas,
November/December 1983 (pp. 1-8): S. Karger AG.
Owsley, C., & Sloane, M. E. (1987). Contrast sensitivity, acuity, and the perception
of'real-world'targets. British Journal of Ophthalmology, 71(10), 791-796
.
Pai, Y.-C., & Patton, J. (1997). Center of mass velocity-position predictions for balance
control. Journal of biomechanics, 30(4), 347-354.
Paulus, W., Straube, A., & Brandt, T. (1984). Visual stabilization of posture physiological
stimulus characteristics and clinical aspects. Brain, 107(4), 1143-1163.
Peterka, R. (2002). Sensorimotor integration in human postural control. Journal of
Neurophysiology, 88(3), 1097-1118.
Posner, M. I., & Petersen, S. E. (1989). The attention system of the human brain: DTIC
Document.
Pozzo, Berthoz, A., & Lefort, L. (1990). Head stabilization during various locomotor
tasks in humans. Experimental Brain Research, 82(1), 97-106.
Pozzo, T., Berthoz, A., Lefort, L., & Vitte, E. (1991). Head stabilization during various
locomotor tasks in humans. Experimental Brain Research, 85(1), 208-217.
Ringelstein, E., Kahlscheuer, B., Niggemeyer, E., & Otis, S. (1990). Transcranial Doppler
sonography: anatomical landmarks and normal velocity values. Ultrasound in
medicine & biology, 16(8), 745-761.
Sazer, V. (1995). New directions in cello playing: how to make cello playing easier and
play without pain: Ofnote.

58
Subburaj, K., Ravi, B., & Agarwal, M. (2009). Automated identification of anatomical
landmarks on 3D bone models reconstructed from CT scan images. Computerized
Medical Imaging and Graphics, 33(5), 359-368.
Taga, G. (1995). A model of the neuro-musculo-skeletal system for human locomotion.
Biological cybernetics, 73(2), 97-111.
Timothy C. Hain, M. (2012). Vestibular Neuritis and Labyrinthitis. Retrieved from
http://american-hearing.org/disorders/vestibular-neuritis-and-labyrinthitis/
Tinetti, M. E., Speechley, M., & Ginter, S. F. (1988). Risk Factors for Falls among Elderly
Persons Living in the Community. New England Journal of Medicine, 319(26),
1701-1707.
Volinsky, C. T., Madigan, D., Raftery, A. E., & Kronmal, R. A. (1997). Bayesian model
averaging in proportional hazard models: assessing the risk of a stroke. Journal of
the Royal Statistical Society: Series C (Applied Statistics), 46(4), 433-448.
Walker, L. B., Harris, E. H., & Pontius, U. R. (1973). Mass, volume, center of mass, and
mass moment of inertia of head and head and neck of human body: SAE Technical
Paper.
Wang, M. Y., Maurer Jr, C. R., Fitzpatrick, J. M., & Maciunas, R. J. (1996). An automatic
technique for finding and localizing externally attached markers in CT and MR
volume images of the head. Biomedical Engineering, IEEE Transactions on,
43(6), 627-637.
Wiley. (2009). Wiley Human Visual System. Retrieved from
https://commons.wikimedia.org/wiki/File:Wiley_Human_Visual_System.gif
Willinger, R., Kang, H.-S., & Diaw, B. (1999). Three-dimensional human head finite-
element model validation against two experimental impacts. Annals of Biomedical
Engineering, 27(3), 403-410.
Winter, D. A. (1991). Biomechanics and motor control of human gait: normal, elderly
and pathological.
Winter, D. A. (1995). Human balance and posture control during standing and walking.
Gait & posture, 3(4), 193-214.
Wolfson, L., Whipple, R., Amerman, P., & Tobin, J. N. (1990). Gait assessment in the
elderly: a gait abnormality rating scale and its relation to falls. Journal of
Gerontology, 45(1), M12-M19.
Wolfson, L. I., Whipple, R., Amerman, P., & Kleinberg, A. (1986). Stressing the Postural
Response. Journal of the American Geriatrics Society, 34(12), 845-850.
Yoganandan, N., Pintar, F. A., Zhang, J., & Baisden, J. L. (2009). Physical properties of
the human head: Mass, center of gravity and moment of inertia. Journal of
biomechanics, 42(9), 1177-1192.

59
Yoganandan, N., Zhang, J., Pintar, F. A., & King Liu, Y. (2006). Lightweight low-profile
nine-accelerometer package to obtain head angular accelerations in short-duration
impacts. Journal of biomechanics, 39(7), 1347-1354.
Zhang, J., Li, B., Yu, L., He, Y.-C., Li, H.-Z., Zhu, J.-N., & Wang, J.-J. (2011). A role
for orexin in central vestibular motor control. Neuron, 69(4), 793-804.

60
Appendix

61
Appendix A: Consent Form
Consent Form for Publication
I, the undersigned, give my consent for my photograph and/or case history to be
published. I have seen and read the material to be published. I have discussed this
consent form with __________________, who is an author of this paper, and I
understand the following:
This research is freely available on the web. Hence, anyone anywhere in the world can
read material published in it. Readers include not only doctors, but also journalists and
other members of the public.
My name will not be published, and as far as possible all identifying features will be
removed. However, it is not possible to ensure complete anonymity, and someone may
be able to recognize me.
2) material published in this research can be redistributed freely and used for any legal
purpose, including translation into other languages and commercial uses. I also
understand that signing this consent form does not remove my rights to privacy.
Name _________________________________
Date _________________
Signed _________________________________
Author _________________________________
Date _________________
Signed _________________________________