
Numerical modelling of an optical belt sorter using a DEM ...
13
Numerical modelling of an optical belt sorter using a DEM–CFD approach coupled with particle tracking and comparison with experiments C. Pieper a , ⁎, F. Pfaff b , G. Maier c , H. Kruggel-Emden d , S. Wirtz a , B. Noack b , R. Gruna c , V. Scherer a , U.D. Hanebeck b , T. Längle c , J. Beyerer c a Ruhr-University of Bochum, Universitaetsstrasse 150, 44780 Bochum, Germany b Karlsruhe Institute of Technology, Adenauerring 2, 76131 Karlsruhe, Germany c Fraunhofer Institute of Optronics, System Technologies and Image Exploitation, Fraunhoferstrasse 1, 76131 Karlsruhe, Germany d Technical University of Berlin, Ernst-Reuter-Platz 1, 10523 Berlin, Germany abstract article info Article history: Received 20 March 2018 Accepted 4 September 2018 Available online 07 September 2018 State-of-the-art optical sorting systems suffer from delays between the particle detection and separation stage, during which the material movement is not accounted for. Commonly line scan cameras, using simple assump- tions to predict the future particle movement, are employed. In this study, a novel prediction approach is presented, where an area scan camera records the particle movement over multiple time steps and a tracking al- gorithm is used to reconstruct the corresponding paths to determine the time and position at which the material reaches the separation stage. In order to assess the benefit of such a model at different operating parameters, an automated optical belt sorter is numerically modelled and coupled with the tracking procedure. The Discrete Element Method (DEM) is used to describe the particle–particle as well as particle–wall interactions, while the air nozzles required for deflecting undesired material fractions are described with Computational Fluid Dynamics (CFD). The accuracy of the employed numerical approach is ensured by comparing the separation results of a predefined sorting task with experimental investigations. The quality of the aforementioned prediction models is compared when utilizing different belt lengths, nozzle activation durations, particle types, sampling frequen- cies and detection windows. Results show that the numerical model of the optical belt sorter is able to accurately describe the sorting system and is suitable for detailed investigation of various operational parameters. The pro- posed tracking prediction model was found to be superior to the common line scan camera method in all inves- tigated scenarios. Its advantage is especially profound when difficult sorting conditions, e.g. short conveyor belt lengths or uncooperative moving bulk solids, apply. © 2018 Elsevier B.V. All rights reserved. Keywords: Discrete Element Method Computational Fluid Dynamics Optical sorting Non-spherical particles Multiple object tracking 1. Introduction With continuously growing material streams, the handling and pro- cessing of bulk solids is becoming increasingly important. The efficient separation of materials can be achieved by various procedures, depend- ing on the properties of the respective bulk solid. When utilizing optical sorting, optical features like color, texture or even shape and size are de- termined and used for particle separation [1–3]. Optical sorters are be- coming increasingly important for the processing of mineral raw materials [4–7] as well as in the fields of food technology [1,8–10] and recycling [11–15]. In most industrial applications, the sorting aim is to separate low-quality materials from high-quality materials, resulting in an accept or reject task. Corresponding systems usually include com- ponents for transportation, a sensor for the detection of the particle properties and a data processing unit where this information is evalu- ated in real-time and subsequently used to control a separation mecha- nism [16]. Although optical sorting systems are commonly used in various fields of application, detailed scientific studies are fairly scarce. Most re- search is focused on the technical or economical assessment of optical sorters for specific sorting tasks like the separation during lithium pro- cessing [5], metal recycling [12], magnesite processing [4], sorting of quartz pebbles [2], ceramic materials [6] or other mineral resources [7], grain processing [3,8], the sorting of household waste [17], process- ing in the fishing industry [10,18], construction rubble recycling [19] and plastic recycling [15,20]. Other studies concentrate on individual sorter components, especially on the sensor technology employed for the optical detection [21–23], advise procedural modifications [13] or aim towards identifying new optical features [9]. A review paper was published, which mostly regards optical sorting as part of other sorting processes and also gives concrete examples where they can be utilized to their full advantage [11]. Powder Technology 340 (2018) 181–193 ⁎ Corresponding author. E-mail address: [email protected] (C. Pieper). https://doi.org/10.1016/j.powtec.2018.09.003 0032-5910/© 2018 Elsevier B.V. All rights reserved. Contents lists available at ScienceDirect Powder Technology journal homepage: www.elsevier.com/locate/powtec
Transcript of Numerical modelling of an optical belt sorter using a DEM ...
Powder Technology 340 (2018) 181–193
Contents lists available at ScienceDirect
Powder Technology
j ourna l homepage: www.e lsev ie r .com/ locate /powtec
Numerical modelling of an optical belt sorter using a DEM–CFD approachcoupled with particle tracking and comparison with experiments
C. Pieper a ,⁎, F. Pfaff b , G. Maier c , H. Kruggel-Emden d , S. Wirtz a , B. Noack b , R. Gruna c , V. Scherer a ,U.D. Hanebeck b , T. Längle c , J. Beyerer c
a Ruhr-University of Bochum, Universitaetsstrasse 150, 44780 Bochum, Germanyb Karlsruhe Institute of Technology, Adenauerring 2, 76131 Karlsruhe, Germanyc Fraunhofer Institute of Optronics, System Technologies and Image Exploitation, Fraunhoferstrasse 1, 76131 Karlsruhe, Germanyd Technical University of Berlin, Ernst-Reuter-Platz 1, 10523 Berlin, Germany
⁎ Corresponding author.E-mail address: [email protected] (C. Pieper).
https://doi.org/10.1016/j.powtec.2018.09.0030032-5910/© 2018 Elsevier B.V. All rights reserved.
a b s t r a c t
a r t i c l e i n f oArticle history:Received 20 March 2018Accepted 4 September 2018Available online 07 September 2018
State-of-the-art optical sorting systems suffer from delays between the particle detection and separation stage,during which the material movement is not accounted for. Commonly line scan cameras, using simple assump-tions to predict the future particle movement, are employed. In this study, a novel prediction approach ispresented, where an area scan camera records the particlemovement overmultiple time steps and a tracking al-gorithm is used to reconstruct the corresponding paths to determine the time and position at which thematerialreaches the separation stage. In order to assess the benefit of such a model at different operating parameters, anautomated optical belt sorter is numerically modelled and coupled with the tracking procedure. The DiscreteElement Method (DEM) is used to describe the particle–particle as well as particle–wall interactions, while theair nozzles required for deflecting undesiredmaterial fractions are describedwith Computational FluidDynamics(CFD). The accuracy of the employed numerical approach is ensured by comparing the separation results of apredefined sorting task with experimental investigations. The quality of the aforementioned prediction modelsis compared when utilizing different belt lengths, nozzle activation durations, particle types, sampling frequen-cies and detectionwindows. Results show that the numerical model of the optical belt sorter is able to accuratelydescribe the sorting system and is suitable for detailed investigation of various operational parameters. The pro-posed tracking prediction model was found to be superior to the common line scan camera method in all inves-tigated scenarios. Its advantage is especially profound when difficult sorting conditions, e.g. short conveyor beltlengths or uncooperative moving bulk solids, apply.
© 2018 Elsevier B.V. All rights reserved.
Keywords:Discrete Element MethodComputational Fluid DynamicsOptical sortingNon-spherical particlesMultiple object tracking
1. Introduction
With continuously growingmaterial streams, the handling and pro-cessing of bulk solids is becoming increasingly important. The efficientseparation of materials can be achieved by various procedures, depend-ing on the properties of the respective bulk solid.When utilizing opticalsorting, optical features like color, texture or even shape and size are de-termined and used for particle separation [1–3]. Optical sorters are be-coming increasingly important for the processing of mineral rawmaterials [4–7] as well as in the fields of food technology [1,8–10] andrecycling [11–15]. In most industrial applications, the sorting aim is toseparate low-quality materials from high-quality materials, resultingin an accept or reject task. Corresponding systems usually include com-ponents for transportation, a sensor for the detection of the particle
properties and a data processing unit where this information is evalu-ated in real-time and subsequently used to control a separation mecha-nism [16].
Although optical sorting systems are commonly used in variousfields of application, detailed scientific studies are fairly scarce. Most re-search is focused on the technical or economical assessment of opticalsorters for specific sorting tasks like the separation during lithium pro-cessing [5], metal recycling [12], magnesite processing [4], sorting ofquartz pebbles [2], ceramic materials [6] or other mineral resources[7], grain processing [3,8], the sorting of household waste [17], process-ing in the fishing industry [10,18], construction rubble recycling [19]and plastic recycling [15,20]. Other studies concentrate on individualsorter components, especially on the sensor technology employed forthe optical detection [21–23], advise procedural modifications [13] oraim towards identifying new optical features [9]. A review paper waspublished, which mostly regards optical sorting as part of other sortingprocesses and also gives concrete examples where they can be utilizedto their full advantage [11].
Figsca
182 C. Pieper et al. / Powder Technology 340 (2018) 181–193
Research focusing on the connection between system parameters,throughput and resulting sorting quality is equally rare and the fewexisting studies investigate the correlation between the occupancyrate, throughput, size of individual particles and the sorting quality[24,25]. There is also hardly any focus on detailed processes within thesorter, like the ejection of particles with jets of compressed air [26]. Fur-thermore, the potential of available simulation procedures like the Dis-crete Element Method (DEM) coupled with Computational FluidDynamics (CFD), which allows themodelling of particle–particle, parti-cle–wall as well as particle–fluid interactions within the system, ishardly utilized [27]. The DEM–CFD has already been successfullyemployed to model other material separators like screens [28–31] andcyclones [32–34].
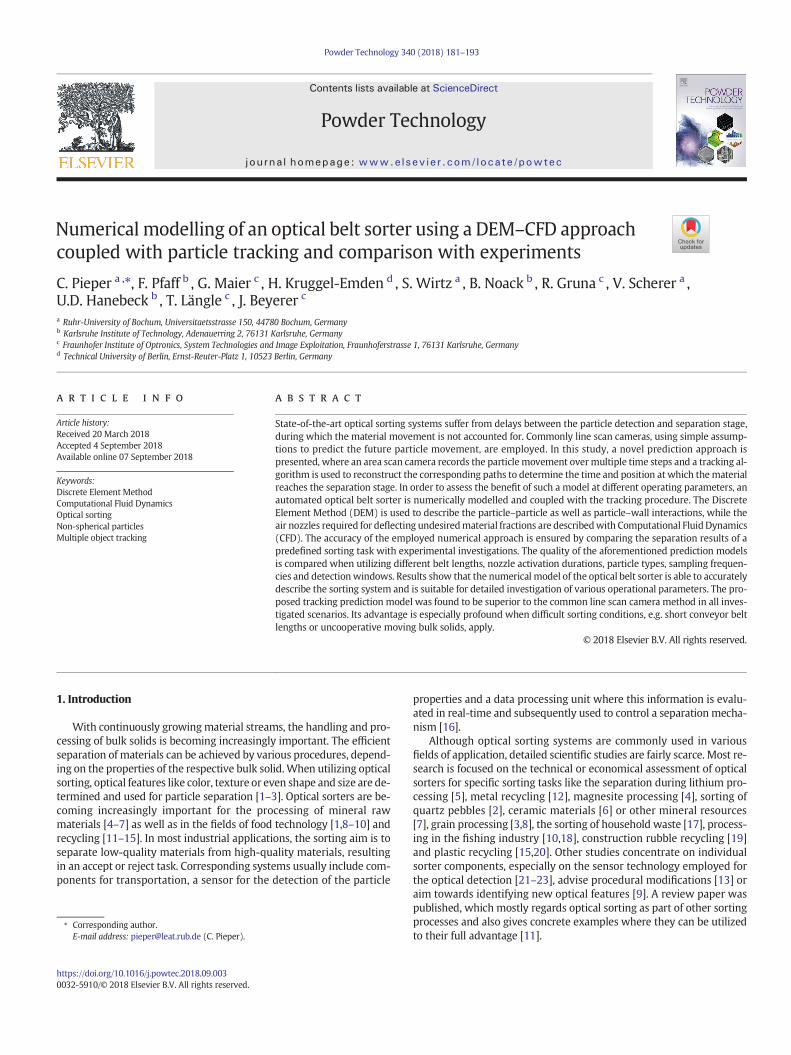
In this study, an automated optical belt sorter is investigated, seeFig.1 a. State-of-the-art optical belt sorters used in industrial applica-tions commonly employ line scan cameras to localize and classify indi-vidual particles in the material stream. The particle typepredetermined for separation is then deflected with bursts of com-pressed air emitted by nozzles aligned orthogonally to the transport di-rection of the conveyor belt. As can be seen inFig.1, a delay existsbetween the perception and separation of the material, which is re-quired for the data processing. Consequently, there is no informationon particle movement between these two stages. The prediction ofwhen and where the particles reach the nozzle bar of the sorter is cur-rently based on the assumption that all particles move in belt directionwith an identical velocity. This simplification is sufficient for many bulksolids, however,materials that feature amore complexmotion behaviorand do not easily adapt to the speed andmovement direction of the belt,pose a significant challenge. While the orthogonal movement of the so-called uncooperative bulk solids can be reduced by modifying thesorting system, e.g. employing longer conveyor belts or reducing mate-rial throughput, these changes often result in additional costs or induceother undesirable implications.
In order to improve the prediction of the material's movement afterthedetection stage and to avoid large scale sortermodifications,wepro-pose the useof an area scan camerawith appropriate algorithms [35,36].The line scan camera is replaced with an area scan camera, which is po-sitioned at the end of the conveyor belt, as shown in Fig.1 b. This setup
.1. Illustration of on optical belt sorter, which can be equippedwith a conventional linen camera a)or an area scan camera b).
e-n-a-b-l-est-heo-b-s-e-r-v-a-ti-o-nofi-n-d-i-v-i-d-u-al
particles over multiple time steps and the obtained information on ma-terial movement can be used for a more accurate prediction of the timeandplace the particles pass the separation stage. This concept is referredto as predictive tracking within this study. We have already validatedthe theoretical concept and functionality of the described approachusing pre-recorded real image data [37] and presented concepts tomaintain real-time capability [38]. In previous research, we have alsoshown that theDEM is able to accurately describe the impact of differentoperating parameters on particle movement within the optical sorterand presented the theoretical advantages of employing an area scancamera in conjunction with particle tracking [39].
In this study, the DEM is coupled with CFD to describe an entire op-tical sorter, including theparticle–fluid interactionwithin the separationstage of the system. Themodel of the sorter is based on an existingmod-ular sorting system, that consists of all of the features of an industrial-sized sorter, with the advantage of being easy to modify and operate.The geometry of the system's nozzle bar is meshed with ANSYS ICEMand CFD simulations of individual nozzles are performed. To ensure cor-rect calculation, the fluid field velocity is compared with conducted ex-periments. Non-spherical particles, namely peppercorns, maize grainsand coffee beans, are modelled with a multi-sphere method. Spheresof different sizes are merged to form a cluster to approximate complexparticle shapes [40]. In order to ensure a good representation of thema-terial and to determine the optimal particle interaction parameters re-quired for the DEM simulations, e.g. Coulomb/rolling friction and thecoefficient of normal restitution, static and dynamic simulations of par-ticle collectives are performedand comparedwith correspondingexper-iments [41]. Theoverall qualityof the sortermodel is testedbydefiningaspecific sorting task andcomparing the sorting results obtained fromthesimulation with those of similar experiments.
Themain aim of this study is not only to accurately model an opticalsorting system, but also to test the presented tracking approach. For thisreason, the tracking algorithm, which is realized as a MATLAB script, iscoupled to the DEM–CFD simulation. The positions of all particles lo-cated in a predefined area on the conveyor belt, which resembles thespace assessed by the area scan camera, are transferred from theDEM–CFD simulation to the tracking script at a predefined rate, whichresembles the frame rate of the area scan camera in the experiment.The tracking script subsequently calculates the futuremotion of the par-ticles after leaving the detection area, and information on the number ofnozzles activated at specific times is transferred back to the simulation.By defining a sorting task and evaluating the subsequent sorting results,the employed tracking procedure is compared to utilizing a conven-tional line scan camera approach and an ideal constant velocity predic-tion, where the velocity of the particles at the end of the detection zoneis directly taken from the DEM–CFD simulations. With this approach,the benefits of employing an area scan camera with particle trackingare investigated under different operating conditions. On the DEM–CFD side, the conveyor belt length, particle type and activation durationof the air nozzles are altered. The impact of utilizing different detectionarea dimensions and data sampling frequencies is investigated on thetracking side.
2. Numerical method
2.1. DEM–CFD approach
The Discrete Element Method (DEM) is used to model the particle–particle and particle–wall interactionswithin the optical sorting system.All calculations are performed with an in-houseDEM-code. Newton'sand Euler's equations of motion are used to calculate the translationaland rotational motion of every particle given by
mid2 x!i
dt2¼ F
!c
i þ F!g
i þ F!pf
i ð1Þ

183C. Pieper et al. / Powder Technology 340 (2018) 181–193
Iid W�!
i
dtþ W�!
i � Ii W�!
i
� �¼ Λ−1
i M!
i ð2Þ
with particle massmi, particle acceleration d2 x!i=dt2, contact force F!c
i ,
gravitational force F!g
i and particle–fluid force F!pf
i . The second equation
gives the angular acceleration d W�!
i=dt, angular velocity W�!
i, external
moment M!
i resulting out of contact or particle–fluid forces, the inertia
tensor Ii along the principal axis and the rotation matrix converting avector from the inertial into the body fixed frame Λi−1 .
The non-spherical particles utilized in this study aremodelledwith amulti-sphere approach, where spheres of different sizes are merged toform a particle cluster to approximate the investigated complex particleshapes. The contact force laws are equal to those used for spherical par-ticles [42] and are separated into a normal and tangential component.Alinear spring dampermodel is employed to obtain the normal compo-nent of the contact force
F!n ¼ knδ n!þ γn v!n
rel; ð3Þ
where kn is the spring stiffness, δ the virtual overlap, n!a normal vector,
γn a damping coefficientand v!nrel the normal velocity in the contact
point. The coefficient of normal restitution between particles eppn , parti-cles and walls epwn and the employed time step determine the springstiffnesskn and the damping coefficientγn . The tangential forces are cal-culated by using a linear spring limited by the Coulomb condition
F!t ¼ min kt ξ
!t����
����; μC F!n��� ���� �
t! ð4Þ
Here kt is the stiffness of a linear spring, μC is the friction coefficient,
ξ!t
is the relative tangential displacement and t!
is the tangential unitvector.
A rolling friction model devised by Zhou etal. [43], which considersthe moments resulting from the rolling friction between particles aswell as particles andwalls, is included in the external moment resulting
out of contact forces M!
i described in Eq.(2)
M!r
i ¼ −μr F!n��� ��� W
�!i
W�!
i
��� ��� ð5Þ
where μr is the coefficient of rolling friction, F!n
the normal component
of the contact force and W�!
i the angular velocity.The compressed air nozzles used for the separation of the material
stream are modelled with Computational Fluid Dynamics (CFD), wherethe Navier–Stokes equations are solved based on Finite Volume Method(FVM). For this purpose, both the fluid field and the enclosed nozzle areapproximated with a detailed and locally refined hexagonal cell mesh.The equation of continuity and the equation of momentum are solved
∂ρ f
∂tþ ∇ ρ f u
!f
� �¼ 0 ð6Þ
∂ ρ f u!
f
� �∂t
þ ∇ ρ f u!
f u!
f
� �¼ −∇pþ ∇ τð Þ þ ρ f g
! ð7Þ
where u!f is thefluid velocity,ρf thefluiddensity,p thepressure andτ thefluid viscous stress tensor. The stress tensor τ can be written as
τ ¼ μe ∇ u!f
� �þ ∇ u!f
� �−1�
ð8Þ
Here, μe is the effective viscosity determined from a k-ε model,which is commonly used to describe turbulent gas flows from nozzles[44–46].
In order to save computational time and due to the short activationdurations of the nozzles, a one-way coupling is performed betweenthe DEM and CFD to model the particle-fluid interaction in the sortingsystem. This means that the fluid field impacts the particle motion,but not vice versa. The fluid velocity is averaged in every CFD cell andthe resulting fluid velocity field is transferred to the DEM upon initiali-zation of the simulation. The influence of the fluid on the particles isconsidered in the DEM by the particle–fluid force described in Eq.(1),which equals the sum of all individual particle–fluid forces. A popularmodel devised by Di Felice [47] is employed, which is also suitable forcomplex shaped particles and is written as
F!pf
i ¼ F!d
i þ F!∇p
i ¼ 12ρ f u!f− u!p�� ��CDA⊥ε
1−χf u!f− u!p
� �ð9Þ
where F!d
i is the drag force, F!∇p
i the pressure gradient force, u!p the par-ticle velocity, CD the drag coefficient, A⊥the cross-sectional area perpen-dicular to the flow, εf the local fluid porosity (representing the cellvolume displaced by the particle) and χ a correction factor. χ is a func-tion of the particle Reynolds-number
Re ¼ ε fρ f dp u!f− u!p�� ��=μ f ð10Þ
and is calculated as
χ ¼ 3:7−0:65 exp −1:5− log Reð Þð Þ2
2
!ð11Þ
Here, dp is the particle diameter and μf the fluid viscosity. The dragcoefficient is derived from a correlation proposed by Hölzer andSommerfeld [48] and is written as
CD ¼ 8Re
1ffiffiffiffiffiffiffiϕ⊥
p þ 16Re
1ffiffiffiffiϕ
p þ 3ffiffiffiffiffiffiffiRe
p 1
ϕ3=4 þ 0:42� 100:4 − log ϕð Þð Þ0:2 1ϕ⊥
ð12Þ
where ϕ⊥ is defined as the ratio between the cross-sectional area of avolume equivalent sphere and the projected cross-sectional area ofthe considered particle perpendicular to the flow. ϕ is the sphericity,namely the ratio between the surface area of a volume equivalentsphere and the surface area of the particle considered.
2.2. Tracking algorithm
By the use of an area scan camera, we can observe the particles, alsodenoted as targets, atmultiple points in time and generate an individualprediction for each particle's futuremotion. In contrast to line scan cam-era systems, in which the prediction is based on the assumption that allparticles move in belt direction and with equal velocities, this approachcan deliver much more accurate information on when and where thematerial reaches the separation stage of the sorter.
In real-world applications, an image processing routine is first usedto extract the centroids of the individual particles onwhich the trackingprocedure is conducted. However, as we perform tracking on simulateddata in this study, we can omit the image processing component and di-rectly consider the challenge of tracking particles based on positiondata.
The tracking procedure allows the reconstruction of the trajectory ofthe particles based on position measurements at regular time intervals.The particles are only tracked on the two-dimensional plane of the con-veyor belt. In order to predict the particle's future position and velocity,a constant velocity model [49] is employed. In order to track the parti-cles in the observed system, a Kalman filter [50], which consists oftwo parts, is utilized. The first part is the prediction step, in which the

Fig.2. Connection between DEM–CFD and tracking procedure.
184 C. Pieper et al. / Powder Technology 340 (2018) 181–193
motion model is used to make a prediction of the particle position andvelocity in the next time step. The second part, referred to as updatestep, is used to refine this prediction. In order to use such a filter, linearmodels for the measurements and the motion of the particles are re-quired. These models are introduced in the following.
The state of a single target, in our case consisting of the position andvelocity of the individual particle, can be described with the vector-val-ued state x k, which is given as
x k ¼ xk; _xk; yk; _yk½ �Т ð13Þ
Here xk andyk are the position components, _xk and _yk the velocitycomponents, and Т denotes the transpose sign. The state of the particleat the next time step is calculated as
x kþ1 ¼ Akx k þ Bkw k ð14Þ
where w k describes the noise term, which is a stocastically modelleddeviation between the actual system behavior and our model thereof,Ak describes how the system changes from one time step k to k + 1and Bk describes how the noise term effects the state. We assume ourmodel to be time-invariant, i.e.,Ak = A and Bk = B, which are, for ourconstant velocity model.
A ¼1 Δt 0 00 1 0 00 0 1 Δt0 0 0 1
2664
3775and B ¼
Δtð Þ2=2 0Δt 00 Δtð Þ2=20 Δt
2664
3775 ð15Þ
Here,Δt describes the timebetween two consecutive time steps, e.g.,k and k+1.
In order to improve the calculated predictions, the particle positionsare refined using the next set of particle positions obtained from theDEM in the update step of the filter. When considering a real-world sce-nario, the measured particle positions suffer from uncertainties due toerrors and small deviations within the image processing routine. Al-though this is not the case with the data received from the DEM, an un-certainty variable v k , which is based on data obtained fromcorresponding experiments, is used for the calculations. As a detaileddescription of the update step of the Kalman filter would exceed thescope of this study, we refer the reader to [50,51].
Since in real-world applications only information on the particle po-sition is obtained with the help of an area scan camera and no informa-tion on particle association between the recorded frames exists,correspondingly only the particle positions calculated with the DEMsimulations are considered and no particle IDs are exchanged. Hence,we face the challenge to track multiple targets without labels, which isaddressed in the field of multitarget tracking (MTT). The methodemployed in this study can be interpreted as a global nearest neighborapproach [52,53]. The global nearest neighbor chooses one assignmentof measurements to tracks in each time step that minimizes the sumof the uncertainty-aware (Mahalanobis) distances over all track–mea-surement pairs. Describing the problem to find the most probable as-signment using distances has multiple advantages. First, its visualinterpretation is more intuitive. Second, the problem of minimizingthe sum of costs can be interpreted as a linear assignment problem.For these, fast solvers such as the LAPJV [54] or auction algorithms[55] exist. In previouswork [38,56], we have considered ways to ensurethe real-time performance of our approach for real-world scenarios.
2.3. Coupling of DEM–CFD with tracking
The coupling between the DEM–CFD simulation and the particletracking calculation, performed with a MATLAB script, is achievedthrough the automated exchange of information with text files. The in-formation exchanged between the two programs is shown in Fig.2.
Before the simulation is started, an area is defined at the end of theconveyor belt which represents the zone seen by the area scan camera.During the simulation, the position and color of every particle in the de-fined area is written to a text file. This is done at a predefined samplingfrequency, similar to that of the frame rate of the camera employed inreal-world scenarios. Once the writing process is completed, the file isunlocked and the tracking program can access the information. Usingsets of measurements at multiple time steps, tracks are generated,which are then used to predict the particles' future motion after leavingthe detection area. It is important to note that, like in reality, there is noinformation exchanged that directly links a particle between two datasets, e.g. a particle ID. The association is purely performed within thetracking procedure.
When a particle exits the detection area, the calculated particle ve-locity and direction of movement is used to calculate the position andpoint in time in which the particle reaches the nozzle bar. The corre-sponding nozzle ID and time of activation are then written to a textfile, which can then be accessed by the DEM–CFD simulation and usedfor the nozzle control.
3. Numerical and experimental setup
3.1. Optical belt sorter
The optical belt sorter investigated in this study is a modular versionof a full sized industrial sorter, including all of the main hardware andsoftware components. The experimental setup of the sorter is shownin Fig.3 a and can be equippedwith an area or line scan camera. The sys-tem is run in batch operation and the bulk solids are initially placed in aparticle container located on top of the vibrating feeder. Upon the startof the experiment or simulation, the container is lifted and the particlesare channeled towards a slide by a vibrating feeder, which runs at a fre-quency of 50 Hz, at an angle of 25° and an amplitude of 0.315 mm,which can also be regulated. The bulk solids then reach the conveyorbelt, which has an adjustable length of 0.3 m to 0.6 m and a width of0.18 m. It runs at a constant velocity of 1.1 ms−1 . At the separationstage of the sorter, a nozzle bar consisting of 16 individual valves andoperating at a gauge pressure of 1.2 bar, is installed. Here, the particlesare separated into two different compartments of the separation con-tainer. The numerical model of the sorter, shown in Fig.3 b, is an exactreplication of the described sorting system.
3.2. Particle approximation
Three different bulk solids are investigated in this study, namelypeppercorns, maize grains and coffee beans. They were selected duetheir easy accessibility, importance in the optical sorting industry anddifference in size, shape and density. Peppercorns are employed forthe base case of this study and are therefore also used in the conductedexperiments, due to their irregularmovement on the conveyor belt. Thismakes the sorting task especially difficult and allows a detailed analysis

Fig.3. Experimental a)and numerical b)setup of the optical belt sorter.
185C. Pieper et al. / Powder Technology 340 (2018) 181–193
of the advantages of utilizing an area scan camera in combination withparticle tracking.
The first step inmodelling these bulk solids within the DEM is to de-termine a size, volume and density distribution for each of the particletypes. In order to approximate the particle shape, shadow projectionsof the different materials are created, and five particle shape types aregenerated for each of the bulk solids. This is done with a MATLAB scriptby filling the depicted particle outline with 8 to 10 spheres, dependingon the complexity of the shape. The process can be seen in Fig.4, exem-plary for peppercorns. To ensure a correct representation of the packingstructure and local solid fraction distribution within a particle packingand therefore the overall approximation quality, a volume-based sizedistribution with five different particle sizes is considered.
In addition to the particle shape and size, important DEM parame-ters describing the particle–particle and particle–wall interactionshave to be defined. These include the coefficients of normal restitution,Coulomb friction and rolling friction and are initially determined exper-imentally by assembling the results from a sufficient number of singleparticle events according to procedures described by Höhner etal. [57]and Sudbrock etal. [58]. For particle–wall contacts, the steel used forthe vibrating feeder and slide of the sorter as well as the material ofthe conveyor belt were considered.
As the determination of precise and reliable interaction parametersbased on individual particle impacts is almost impossible due to thehigh fluctuations of the results obtained from actual systems, the ob-tained values are merely used as a starting point for further optimiza-tion. As described in [41], further tests were conducted and comparedwith corresponding simulations. In order to analyze the parameters ina static scenario, a defined amount of each particle type is filled into astationary cylinder, which was previously placed on a surface made of
Fig.4. Peppercorn approximation for the DEM.
steel or conveyor belt material, depending on the investigate particle–wall pairing. In order to prevent any particles falling off the test rig, asecond, wider ring is placed around the cylinder. When the materialhas settled, the cylinder is lifted upwards with a defined velocity andthe particles form a pile on the respective surfacematerial. The resultingangle of repose is averaged for both sides of the pile and compared be-tween simulation and experiment, see Fig.5.
In a second step, a dynamic scenario is investigated, where one thirdof the volume of a rotary drum, outlinedwith steel or conveyor belt ma-terial, depending on the particle–wall pairing, is filled with one of thematerials. The drum is then rotated with a constant velocity and theresulting angle of repose is again compared between experiment andsimulation, see Fig.6.
After comparing the angles of repose between experiment and sim-ulation for both the static and dynamic scenario, the initial DEM interac-tion parameters are automatically adjusted and another simulation forboth cases is performed. The resulting angles are compared again andthe process is repeated until the employed parameters result inmatching angles of repose for both the static and dynamic scenario.The final particle parameters for all three particle types are presentedin Table 1. It was found that defining the rolling friction coefficientequal for all contact forms of the respective bulk solid resulted in agood fit between experiment and simulation.
The DEM simulations are performed with a time step of 1 · 10−5 swhile a maximum particle overlap of 0.5% is ensured. The spring stiff-ness kn and kt as well as the damping coefficient γn are calculatedfrom the chosen time step and the coefficient of restitution.
3.3. Nozzle bar
To simulate the fluid flow within the air nozzle and in the flow fieldestablished at the nozzle outlet, a hexagonalmesh of the air nozzle inte-rior and the adjacent airspace is created. A CADmodel of the nozzle baremployed in the modular optical belt sorter, see Fig.7 a, is used to gen-erate the basic nozzle geometry, as shown in Fig.7 b. Only one of the six-teen nozzles is considered. The nozzle has one inlet and splits up intofour nozzle outlets to cover the entire width of the conveyor belt.
A pressure inlet is defined at the nozzle inlets and a pressure outletat the far-field boundary of the flow domain, see Fig.7 c. A gauge pres-sure of 1.2 bar is applied at the pressure inlet and the adjacent room isfilled with quiescent air. To maintain feasible calculation times and tosimplify the coupling between the DEM–CFD, a stationary flow field isassumed, while the fluid considered incompressible. Investigationsshowed that the steady state flow profiles obtainedmatchwell with re-sults from transient calculations. Performing the simulation withacompressible fluid also produced very similar results. A standard k-εturbulence model is employed. The air has a density of ρf = 1.225 kg/m2 , viscosity of μf = 1.7894 ·10−5 kg/(m·s) and a temperature ofTf= 293.15 K.

Fig.5. Angle of repose compared between experiment (left) and simulation (right) for a)peppercorns, b)maize grains and c)coffee beans, static scenario.
Fig.6. Angle of repose compared between experiment (left) and simulation (right) for a)peppercorns, b)maize grains and c)coffee beans, dynamic scenario.
186 C. Pieper et al. / Powder Technology 340 (2018) 181–193
Once the CFD calculation has converged, the resulting fluid data isprepared for utilization within the DEM. As the resolution of the meshis very finewith 1.86 million cells andwould result in very long simula-tion durations when used in the DEM, the fluid properties are averagedto larger cells. In addition, the flow field is trimmed to fit the air jet con-tours, which also reduces the number of fluid cells and therefore speedsup the calculation. The new fluid cells have a dimension of 2 × 2 × 2mm3 and cover a total volume of 20 × 50 × 150mm3 . Tomodel the en-tire nozzle bar, the fluid cell zone determined for a single nozzle is du-plicated sixteen times to form one large mesh, now consisting of159,375 cells. When a particle enters the zone where the fluid cellsare coupled with the DEM, the fluid properties of every fluid cell thatlies within the particle boundary are averaged and used to computethe particle–fluid force as described in Section2.1.
In order to validate the CFD simulation conducted, the calculatedfluid velocity field is compared with experimental measurements ofthe flow field in front of an individual nozzle of the nozzle bar. Themea-surements are performedwith a pitot tube, which ismounted on a tablethat can be automatically moved in all three main coordinate directionsin small increments. A slice on the x− yplane, located 20 mmin front ofan individual nozzle is considered, see Fig.8. This is the distance atwhichthe particle–fluid interaction at the separation stage of the sorter takesplace. The results of the experimental measurements are shown inFig.8 a and those of the corresponding simulation in Fig.8 b. The ob-tained data shows that there is good agreement between experimentand simulation with respect to both the area of influence of the air jetsand the velocity magnitude.
3.4. Prediction models
In this study, three different prediction models, defined as themethod to predict the particles' future motion after leaving the detec-tion phase of the sorter, are employed and compared. In all threecases, the final prediction is made when the particles reach the end ofthe conveyor belt. This is defined as the detection stage for the linescan camera and ideal constant velocity (CV) predictionmodel. The sep-aration stage of the sorter is located 0.075m behind the belt end.

Table1Particle properties of peppercorns, maize grains and coffee beans required for the DEM simulations.
Shape Peppercorns Maize grains Coffee beans
Average mass [g] 0.0272 0.2624 0.0915Average density [kg/m2 ] 551.47 1212.12 1041.67Restitution coefficient PP [−] 0.627 0.705 0.63Restitution coefficient PW sorter [−] 0.721 0.349 0.492Restitution coefficient PW belt[−] 0.701 0.349 0.492Friction coefficient PP [−] 0.4 0.2 0.3Friction coefficient PW sorter [−] 0.326 0.352 0.337Friction coefficient PW belt [−] 0.336 0.377 0.357Rolling friction coefficient PP [m] 0.00008 0.00004 0.00004Rolling friction coefficient PW sorter [m] 0.00008 0.00004 0.00004Rolling friction coefficient PW belt [m] 0.00008 0.00004 0.00004
187C. Pieper et al. / Powder Technology 340 (2018) 181–193
The most common and basic principle, which is also used in moststate-of-the-art industrial sorters, is referred to as the line scan cameramodel, see Fig.9 a. Here it is assumed that the particles only move inbelt direction and have no cross movements. The predicted particle ve-locity at the end of the detection stage vpr is assumed to be equal for allparticles and is determined by averaging the velocity of every particle at
Fig.7. Air nozzlemesh b)derived from a CADmodel of the sorting system nozzle bar a)andresulting fluid field c).
the end of the detection stage vpr , in a preliminary simulation. Theseboundary conditions are directly considered within the DEM and nocouplingwith the tracking algorithm is performed for these simulations.
The second procedure is referred to as the tracking model, see Fig.9b. Thismethod is based on the utilization of an area scan camera for par-ticle detection, where particle positions and velocities are assessed overmultiple points in time (vt1, vt2,…vtn), and the tracking algorithm, basedon a CV model, for the prediction of the particles' future motion. In thesimulation, the DEM–CFD is coupled with the MATLAB tracking scriptas described in section 2.3.
In the third method employed, the particle velocity and direction ofmovement at the end of the detection phase is directly taken from theDEM calculations, as shown in Fig.9 c. In the course of this study this
Fig.8. Comparison of fluid velocity fields for experiment a)and simulation b)20 mm infront of an individual nozzle.

Fig.10. Exiting particle mass of peppercorns for different operating amplitudes comparedbetween experiment and simulation.
Fig.9. Visualization of the employed prediction models, a)line scan camera, b)tracking, c)ideal CV prediction.
188 C. Pieper et al. / Powder Technology 340 (2018) 181–193
method is referred to as the ideal constant velocity prediction model(ideal CV). By default, this is the most accurate information on the par-ticle movement and themodel is used to benchmark the two other pre-diction procedures.
3.5. Operational procedure
In order to compare the resulting sortingquality for the three predic-tion models, a base case is defined and five operational parameters arealtered one at a time in different simulation series. On the DEM–CFDside, these parameters include the conveyor belt length, nozzle activa-tion duration and the particle type. On the tracking side, the dimensionof the area inwhich the particle positions are transferred to the trackingalgorithm and the frequency of these exchanges are investigated. Anoverview of the parameters varied is presented in Table 2. Thehighlighted values represent the base case of the study.
At the start of each simulation, 50 g of peppercorns are placed in acontainer positioned on the vibrating feeder, which is operated at anamplitude of 0.278 mm. When maize grains and coffee beans areemployed, 200 g are used due to the higher density and size of the par-ticles compared to the peppercorns. The assembled bulk solids alwaysconsist of 80% blue particles and 20% red particles, the latter set to beseparated from thematerial stream. This ratio was chosen as a compro-mise between typical real-world applications and a sufficiently difficultsorting task. The initial particle packing within the container is gener-ated randomly at the beginning of each simulation, resulting in an arbi-trary mixture of red and blue particles. Before the container is liftedupwards, thereby releasing the particles onto the vibrating feeder, theparticles settle under gravity and form a loose packing. After the bulksolids have moved through the sorter, the resulting separation qualityis assessed and compared. All simulations are conducted three times,each time with a different, randomly generated particle packing.
4. Results and discussion
4.1. Initial validation
In order to ensure that the particle approximation and the particleparameters determined are sufficiently accurate to model the particle
Table2Investigated operational parameters with the base case of the study highlighted in green.
Conveyor belt length [m]
Nozzle ac�va�on dura�on [s] Par�cle type [-] Tracking window
length [m]Detec�on frequency
[Hz]0.45 0.0025 Maize grains 0.05 1000.30 0.005 Peppercorns 0.1 2000.6 0.01 Coffee beans 0.15 300
behaviorwithin the optical sorter, themass flow of peppercorns ismea-sured both experimentally and numerically. Peppercorns were chosenexemplary, as they are the bulk solids used in the base case of thestudy. As themass flow rate is highly dependent on the vibrating feederamplitude, a high-speed camera is used to analyze the amplitude, angleand frequency of the induced vibration in detail. Results show that thefrequency and vibration-angle are constant with values of 50 Hz and25° respectively. The amplitude can be regulated with a transformerand three amplitudes of a1 = 0.402 mm, a2 = 0.278 and a3 = 0.236were measured and then used for the comparison.
Tomeasure the exiting particlemass flow in the experimental setup,a scale with a collecting container is positioned at the end of the con-veyor belt. Both the air nozzles as well as the separation container areremoved during the procedure. At the start of the experiment, thesame initialization procedure used for the separation investigation de-scribed in Section3.5 is employed. 100 g of peppercorns are used andthe measurement is repeated three times for each investigated ampli-tude setting. The results are shown in Fig.10.
The figure shows that there is good agreement between the DEMsimulations and the conducted experiments. Slight offsets can be seenat the end of the process, especially for small amplitudes. Here, the pep-percorns in the simulation exit the system at a faster pace. Further in-vestigation showed that this is likely due to small irregularities anddents on the surface of the vibrating feeder of the experimental setup.These imperfections cause particle movement to slow down, especiallywhen the peppercorns no longer move in bulk.
In a next step, the actual sorting result is compared between an ex-perimental and numerical setup. The experiment is carried out first, ac-cording to the procedure described in Section3.5. In the experimentalinvestigation, a line scan camera is located at the end of the belt. Thecolor of passing particles is detected and depending on the y-locationof the peppercorn, a specific nozzle is activated. The delay between par-ticle detection and nozzle activation is calculated by assuming that theparticle is moving with belt velocity. Particle movement orthogonal tothe belt is neglected. In the simulation, the line scan camera model isused. It is important to keep in mind that the goal of the conducted ex-periment is not to achieve a perfect separation quality, but to ensurethat defined system parameters are used that can be transferred tothenumerical setup. The systemwas deliberately run under difficult op-erating conditions andwith a high particle feed rate in order to properlytest the numerical accuracy. The experiment is conducted three times.
After the sorting process is complete, the peppercorns are extractedfrom the separation container and the separation quality is assessed byweighing the different particle fractions. This is of course not necessaryfor the simulation where the sorting result is directly written to a textfile.
The findings of the conducted experimental and numerical sortingprocess and its comparison are presented in Fig.11. The error bars repre-sent the standard deviation of the three conducted experiments. The re-sults show that there is generally good agreement between the

Fig.13. Spatial deviation from the actual particle position at the separation stage for the a)ideal CV prediction, b)tracking and c)line scan camera model. The line in the middleindicates the median, the box represents 50% of the data and the whiskers the upperand lower 25% of the data.
Fig.11. Comparison of particle separation results between experiment and simulation fora)ejected/not ejected colored particles and b)ejected/not ejected uncolored particles.
189C. Pieper et al. / Powder Technology 340 (2018) 181–193
experiment and simulation. Fig.11 a shows the percentage of the col-ored peppercorns ejected and not ejected from the material stream.The amount of particles ejected is only slightly higher for the simulation,which is most likely due to the fact that a small amount of particles isnot correctly identified by the line scan camera. This is of course notthe case in the simulation. The separation results of the uncolored par-ticles can be seen in Fig.11 b. Only a small amount of by-catch is pro-duced and the simulation differs from the results obtained from theexperiment only by a very small margin.
Fig.12. Temporal deviation from the actual particle position at the separation stage for thea)ideal CV prediction, b)tracking and c)line scan camera model. The line in the middleindicates the median, the box represents 50% of the data and the whiskers the upperand lower 25% of the data.
4.2. Prediction accuracy of the models employed
The base case of the study is utilized as the basis for the accuracyanalysis and in a first step, a simulation without particle separation isconducted. The exact time and place of when and where each particlereaches the separation unit is stored and used as a ground truth forthe comparison of the prediction models. The predictions made forevery particle are then compared with the established ground truthand average deviations are determined for each of the three methods.The results are presented as box plots and outliers with a deviation ofmore than 1.5 times the interquartile range are omitted.
The temporal deviation of the employed models is presented inFig.12. The results show that the prediction error of the time in whichthe particles reach the separation unit is smallest for the ideal CV predic-tion, Fig.12 a, utilizing the velocity andmovement direction at the endofconveyor belt directly from the DEM, with deviations ranging from−0.01 ms to 0.013 ms. This is followed by the tracking model, Fig.12b, already with significantly larger errors in the range of −1.4 ms to1.4 ms. The line scan camera method, Fig.12 c, shows the largest devia-tion, namely−8 ms to 8 ms. The fact that the median of the data sets isslightly higher than zero, is attributed to the fact that the particles startto slow down after leaving the conveyor belt. This is not considered bythe prediction models, but constitutes a first optimization feature.
The spatial deviation of the investigated predictionmodels is shownin Fig.13. The trendobserved in the evaluation of the temporal deviationcan also be found here, namely that the ideal CV prediction, Fig.13 a,shows the smallest error, followed by the tracking model, Fig.13 b,and the line scan camera model Fig.13 c.
The comparison of the prediction accuracy of the models employedalready shows that the tracking procedure delivers promising results,and is able to determine the future particle position much more
Fig.14. Percentage of correctly ejected particles for different conveyor belt length.

Fig.17. Percentage of falsely ejected particles for different nozzle activation durations.Fig.15. Percentage of falsely ejected particles for different conveyor belt lengths.
190 C. Pieper et al. / Powder Technology 340 (2018) 181–193
precisely than the conventional assumptions used when operating aline scan camera system. However, these findings are still of a theoreti-cal nature, and the influence on the actual sorting quality of the systemremains to be investigated. This is done in the following sections.
4.3. Influence of conveyor belt length
Three different belt lengths are considered, namely 0.3 m, 0.45 mand 0.6 m. The percentages of correctly ejected particles are presentedin Fig.14. With increasing belt length, the number of correctly ejectedparticles rises for all three prediction models. A longer belt reducesthe cross movement of the material and also leads to a more consistentparticle velocity distribution. This greatly reduces the difficulty of theseparation task. The findings show that employing the tracking modelresults in a higher percentage of correctly ejected particles comparedwith the line scan camera model in all three investigated cases. This ad-vantage is especially pronounced at the shorter belt lengths, where theparticles have not fully obtained the belts velocity and direction ofmovement.
The percentage of falsely co-ejected particles, also referred to as by-catch, is shown in Fig.15. In contrast to the results of the correctlyejected particles, no distinct trend is visible and the error bars are com-parably high. In order to assess themeaning of these results, it is impor-tant to consider that altering the belt length of the sorter directly affectsother system parameters. As the particle velocity at the end of the belt ishighly dependent on the length of the belt, the nozzle bar and the sep-aration container have to be readjusted for each simulation. In addition,the velocity of individual particles at the end of the belt deviates muchmore from themean particle velocity at shorter belt lengths. This entailsthat the separation container has to be placed further away from themean particle trajectory, whichmakes it harder to eject the desiredma-terial but also causes a reduction of by-catch. A detailed investigation of
Fig.16. Percentage of correctly ejected particles for different nozzle activation durations.
the connection between correctly and falsely ejected particles is, how-ever, not part of this study.
4.4. Influence of nozzle activation duration
Nozzle activation durations of 0.0025 s, 0.005 s and 0.01 s are con-sidered. The percentage of the correctly ejected particles is presentedin Fig.16. As expected, the figure shows that the amount of correctlyejected particles increases with longer activation durations for allthree investigated prediction models. Employing the tracking modelleads to superior separation results compared to the line scan cameramodel in all three cases. Here, it is interesting to note that the differencebetween the twomodels remains almost equalwith about 17%, at all in-vestigated activation durations. This shows that the overall advantage ofutilizing an area scan camera combined with particle tracking is espe-cially useful when employing low nozzle activation durations.
The percentages of falsely ejected particles for the different nozzleactivation durations are presented in Fig.17. Increasing the activationduration naturally also leads to an increase in falsely co-ejected parti-cles. This trend is consistent for all predictionmodels. Again, no correla-tion can be found between the observed by-catch and employedprediction model.
4.5. Influence of particle type
Peppercorns, maize grains and coffee beans are employed as differ-ent particle types. The percentage of correctly ejected particles is pre-sented in Fig.18. The results show that the share of correctly ejectedmaterial is significantly higher for maize grains and coffee beans com-pared with the peppercorns. This can be explained by twomain factors,namely the particle movement on the conveyor belt and the particlesize. While the peppercorns have a nearly spherical shape, which
Fig.18. Percentage of correctly ejected particles for different particle type.

Fig.19. Percentage of falsely ejected particles for different particle type.
191C. Pieper et al. / Powder Technology 340 (2018) 181–193
induces a profound proper motion on the conveyor belt, the maizegrains and coffee beans have an almost flat surface area, causing themto adapt to the belt velocity and direction of movement much faster.In addition, the increased particle size offers a larger surface area forthe air jet to hit the material. However, even at these high ejectionrates, the tracking model still outperforms the line scan camera by amargin of 2–4% for both the maize grains and coffee beans.
The percentage of falsely ejected particles is presented in Fig.19. Theresults show that the by-catch of the coffee beans is considerable highercompared with the other two particles types. Considering that the per-centage of correctly ejected particles is almost equal for maize grainsand coffee beans, this difference seems unusual. However, to accountfor the 200 g of employed material, about 763 maize grains and 2186coffee beans are required. This leads to a significantly higher belt loadand closer particle proximity in the coffee bean simulations, which is di-rectly related to the increase of by-catch.
4.6. Influence of tracking parameters
The effect of altering different tracking parameters, namely the de-tection frequency and length of the detection window (see section2.3), on the separation quality is investigated in the final simulationseries.
Three detection frequencies, 100 Hz, 200 Hz and 300 Hz are consid-ered. The percentage of the correctly ejected particles is shown in Fig.20a. The results obtained indicate that a higher sampling frequency gener-ally improves the ejection accuracy. However, the additional benefitfrom utilizing a 300 Hz camera over the 200 Hz model available forthe table sort setup is not very significant. This shows that there is notnecessarily the need for an expensive high speed camera and that theamount of data required for a precise tracking prediction ismanageable.
Fig.20. Correctly a)and falsely b)ejected part
The percentage of falsely ejected particles, see Fig.20 b, supports theseconclusions.
The results of altering the length of the detectionwindowemployed,namely 5 cm, 10 cm and 15 cm, are presented in Fig.21. The percentageof correctly ejected particles, see Fig.21 a, and falsely ejected particles,see Fig.21 b, shows that there is only a slight improvement whenemploying a larger detection area. This also underlines the assumptionthat already a small amount of particle data is sufficient for a significantprediction improvement, as shown in the previous sections of thisstudy.
5. Conclusions
A numerical model of an automated optical belt sorter based on acoupled DEM–CFD approach was described and the impact ofemploying different operating parameters and prediction models onthe sorting qualitywas assessed. Three bulk solids, namely peppercorns,maize grains and coffee beans were modelled with a multi-sphere par-ticle approximation and the particle interaction parameters requiredwere determined in comprehensive experimental and numerical inves-tigations. The utilized nozzle bar was described with a FVM approachand the resulting fluid velocity field was compared with measurementsof corresponding experiments. To benchmark the novel predictionmethod, designated as predictive tracking, the DEM–CFD was coupledwith a MATLAB script running the tracking algorithm. The followingconclusions can be drawn from this study:
• The methods employed to model complex-shaped bulk solids and todefine the required DEM parameters shows good results when com-paring the particle mass flow through the sorter between experimentand simulation.
• The approximation of the nozzle bar with a FVM approach seems suit-able to model the separation stage of the optical sorter and showsgood agreement with corresponding experiments. The one-way cou-pling of the DEMwith CFD constitutes an important step inmodellingthe entire optical belt sorter.
• A comparison of separation results between the numerical and exper-imental sorting system reveals promising results and underlines thatthe numerical setup described and modelled in this study is suitableto investigate sorter performance under different operational condi-tions.
• Coupling the DEM–CFD with the devised tracking prediction modeloutperforms the state-of-the-art line scan cameramethod in all inves-tigated parameter variations. The additional benefits of the new pre-diction procedure are especially profound when the sorting task isdifficult. This is the case when a short belt length, a short nozzle acti-vation duration and bulk solids with distinct proper motion on theconveyor belt, in this study the peppercorns, are employed.
icles for different detection frequencies.

Fig.21. Correctly a)and falsely b)ejected particles for different detection windows.
192 C. Pieper et al. / Powder Technology 340 (2018) 181–193
• Correct evaluation of the percentage of falsely co-ejected particles andtheir connection to the predictionmodels used turned out to be ratherdifficult, as altering one system parameter often indirectly influencesother sorter parameters. It can generally be concluded that in orderto understand the complex interaction between falsely ejected parti-cles and various system parameters, an additional, detailed studyneeds to be conducted.
In summary it can be said that thenewly introducedmethod of accu-rately predicting the future particle position by the use of an area scancamera coupledwith particle tracking, seems to be a very promising de-velopment in the field of optical sorting. The simulations conducted inthis study emphasize the advantages of the technology in comparisonto state-of-the-art line scan camera systems. However, it is importantto note that the benefit of employing this technology will most likelybe limited to specific and difficult sorting scenarios.
In a next step, the described prediction approach will be tested onthe presented table sort system and similar investigations to thisstudy will be conducted. If successful, the method will be applied tofull size optical sorting systems.
Acknowledgements
The IGF project 18798 N of the research association Forschungs-GesellschaftVerfahrens-Technik e.V. (GVT) was supported via the AiFin a program to promote the Industrial Community Research andDevel-opment (IGF) by the Federal Ministry for Economic Affairs and Energyon the basis of a resolution of the German Bundestag.
References
[1] M. Graves, B. Batchelor (Eds.), Machine vision for the inspection of natural products,Springer-Verlag, London, 2003https://doi.org/10.1007/b97526.
[2] D.M. Dehler, Optische Sortierung von Quarzkieseln zur Senkung des Eisengehaltes,Aufbereitungstechnik 47 (2006) 6–8.
[3] S.R. Delwiche, T.C. Pearson, D.L. Brabec, High-speed optical sorting of soft wheat forreduction of deoxynivalenol, Plant Dis. 89 (2005) 1214–1219, https://doi.org/10.1094/PD-89-1214.
[4] K. Bilir, H. Akdas, Evaluation of magnesite wastes using optical sorting machine,Proc. XIII. Int. Miner. Process. Symp 2012, pp. 1017–1023.
[5] F. Brandt, R. Haus, New concepts for lithium minerals processing, Miner. Eng. 23(2010) 659–661, https://doi.org/10.1016/j.mineng.2010.03.021.
[6] M. Dehler, Optical sorting of ceramic rawmaterial, Tile Brick Int. 19 (2003) 248–251.[7] M. Dehler, Wedel, Optische Sortierung von mineralischen Rohstoffen, Schüttgut 10
(2004) 212–216.[8] F.E. Dowell, T.N. Boratynski, R.E. Ykema, A.K. Dowdy, R.T. Staten, Use of optical
sorting to detect wheat kernels infected with tilletia indica, Plant Dis. 86 (2011)500–502.
[9] R.P. Haff, T.C. Pearson, E. Maghirang, A multispectral sorting device for isolating sin-gle wheat kernels with high protein content, J. Food Meas. Charact. 7 (2013)149–157, https://doi.org/10.1007/s11694-013-9150-7.
[10] L.A. Paluchowski, E. Misimi, L. Grimsmo, L.L. Randeberg, Towards automated sortingof Atlantic cod (Gadus morhua) roe, milt, and liver - Spectral characterization andclassification using visible and near-infrared hyperspectral imaging, Food Control62 (2016) 337–345, https://doi.org/10.1016/j.foodcont.2015.11.004.
[11] S.P. Gundupalli, S. Hait, A. Thakur, A review on automated sorting of source-sepa-rated municipal solid waste for recycling, Waste Manag. 60 (2017) 56–74, https://doi.org/10.1016/j.wasman.2016.09.015.
[12] M. Bigum, L. Brogaard, T.H. Christensen, Metal recovery from high-grade WEEE: alife cycle assessment, J. Hazard. Mater. 207–208 (2012) 8–14, https://doi.org/10.1016/j.jhazmat.2011.10.001.
[13] S. Brunner, P. Fomin, C. Kargel, Automated sorting of polymer flakes: fluorescencelabeling and development of a measurement system prototype, Waste Manag. 38(2015) 49–60, https://doi.org/10.1016/j.wasman.2014.12.006.
[14] N. Dias, I. Garrinhas, A. Maximo, N. Belo, P. Roque, M.T. Carvalho, Recovery of glassfrom the inert fraction refused by MBT plants in a pilot plant, Waste Manag. 46(2015) 201–211, https://doi.org/10.1016/j.wasman.2015.07.052.
[15] E. Scavino, D.A.Wahab, A. Hussain, H. Basri, M.M.Mustafa, Application of automatedimage analysis to the identification and extraction of recyclable plastic bottles, J.Zhejiang Univ. A 10 (2009) 794–799, https://doi.org/10.1631/jzus.A0820788.
[16] J.D. Salter, N.P.G. Wyatt, Sorting in the minerals industry: past, present and future,Miner. Eng. 4 (1991) 779–796, https://doi.org/10.1016/0892-6875(91)90065-4.
[17] G. Ligus, Municipal waste management model with the use of optical sorting ele-ments, Chem. Aust. 66 (2012) 1229–1234.
[18] J.R. Mathiassen, E. Misimi, M. Bondø, E. Veliyulin, S.O. Østvik, Trends in application ofimaging technologies to inspection of fish and fish products, Trends Food Sci.Technol. 22 (2011) 257–275, https://doi.org/10.1016/j.tifs.2011.03.006.
[19] A. Müller, Bauschutt ohne Gips, Steinbruch Und Sandgrube 11 (2012) 40–45.[20] J. Nakatani, K. Konno, Y. Moriguchi, Variability-based optimal design for robust plas-
tic recycling systems, Resour. Conserv. Recycl. 116 (2017) 53–60, https://doi.org/10.1016/j.resconrec.2016.09.020.
[21] D.M. Scott, A two-colournear-infrared sensor for sorting recycled plastic waste,Meas. Sci. Technol. 6 (1995) 156–159, https://doi.org/10.1088/0957-0233/6/2/004.
[22] D.M. Scott, R.L. Waterland, Identification of plastic waste using spectroscopy andneural networks, Polym. Eng. Sci. 35 (1995)https://doi.org/10.1002/pen.760351208.
[23] M.A. Zulkifley, M.M. Mustafa, A. Hussain, A. Mustapha, S. Ramli, Robust identifica-tion of polyethylene terephthalate (PET) plastics through bayesian decision, PLoSONE 9 (2014) 1–20, https://doi.org/10.1371/journal.pone.0114518.
[24] R.D. Pascoe, O.B. Udoudo, H.J. Glass, Efficiency of automated sorter performancebased on particle proximity information, Miner. Eng. 23 (2010) 806–812, https://doi.org/10.1016/j.mineng.2010.05.021.
[25] R.D. Pascoe, R. Fitzpatrick, J.R. Garratt, Prediction of automated sorter performanceutilising a Monte Carlo simulation of feed characteristics, Miner. Eng. 72 (2015)101–107, https://doi.org/10.1016/j.mineng.2014.12.026.
[26] R.S. Fitzpatrick, H.J. Glass, R.D. Pascoe, CFD–DEM modelling of particle ejection by asensor-based automated sorter, Miner. Eng. 79 (2015) 176–184, https://doi.org/10.1016/j.mineng.2015.06.009.
[27] H.P. Zhu, Z.Y. Zhou, R.Y. Yang, a.B. Yu, Discrete particle simulation of particulate sys-tems: theoretical developments, Chem. Eng. Sci. 62 (2007) 3378–3396, https://doi.org/10.1016/j.ces.2006.12.089.
[28] P.W. Cleary, M.D. Sinnott, R.D. Morrison, Separation performance of double deck ba-nana screens - part 1: flow and separation for different accelerations, Miner. Eng. 22(2009) 1218–1229, https://doi.org/10.1016/j.mineng.2009.07.002.
[29] K.J. Dong, A.B. Yu, I. Brake, DEM simulation of particle flow on a multi-deck bananascreen, Miner. Eng. 22 (2009) 910–920, https://doi.org/10.1016/j.mineng.2009.03.021.
[30] J. Xiao, X. Tong, Characteristics and efficiency of a new vibrating screenwith a swingtrace, Particuology 11 (2013) 601–606, https://doi.org/10.1016/j.partic.2012.07.014.
[31] Z. Li, X. Tong, A study of particles penetration in sieving process on a linear vibrationscreen, Int. J. Coal Sci. Technol. 2 (2015) 299–305, https://doi.org/10.1007/s40789-015-0089-7.
[32] K.W. Chu, B. Wang, D.L. Xu, Y.X. Chen, A.B. Yu, CFD-DEM simulation of the gas-solidflow in a cyclone separator, Chem. Eng. Sci. 66 (2011) 834–847, https://doi.org/10.1016/j.ces.2010.11.026.

193C. Pieper et al. / Powder Technology 340 (2018) 181–193
[33] K.W. Chu, B.Wang, A.B. Yu, A. Vince, G.D. Barnett, P.J. Barnett, CFD-DEM study of theeffect of particle density distribution on the multiphase flow and performance ofdense medium cyclone, Miner. Eng. 22 (2009) 893–909, https://doi.org/10.1016/j.mineng.2009.04.008.
[34] K.W. Chu, B. Wang, A.B. Yu, A. Vince, CFD-DEM modelling of multiphase flow indense medium cyclones, Powder Technol. 193 (2009) 235–247, https://doi.org/10.1016/j.powtec.2009.03.015.
[35] F. Pfaff, M. Baum, B. Noack, U.D. Hanebeck, R. Gruna, T. Langle, J. Beyerer, TrackSort:Predictive tracking for sorting uncooperative bulk materials, IEEE Int. Conf.Multisens. Fusion Integr. Intell. Syst. (2015) 7–12, https://doi.org/10.1109/MFI.2015.7295737 Octob (2015).
[36] F. Pfaff, C. Pieper, G. Maier, B. Noack, H. Kruggel-Emden, R. Gruna, U.D. Hanebeck, S.Wirtz, V. Scherer, T. Längle, Improving Optical Sorting of Bulk Materials Using So-phisticated Motion Models, 2015https://doi.org/10.1515/teme-2015-0108.
[37] F. Pfaff, C. Pieper, G. Maier, B. Noack, H. Kruggel-Emden, R. Gruna, U.D. Hanebeck, S.Wirtz, V. Scherer, T. Langle, J. Beyerer, Simulation-based evaluation of predictivetracking for sorting bulk materials, in: IEEE Int, Conf. Multisens. Fusion Integr. Intell.Syst. (2017)https://doi.org/10.1109/MFI.2016.7849539.
[38] G. Maier, F. Pfaff, C. Pieper, R. Gruna, B. Noack, H. Kruggel-Emden, T. Langle, U.D.Hanebeck, S. Wirtz, V. Scherer, J. Beyerer, Fast multitarget tracking via strategyswitching for sensor-based sorting, in: IEEE Int, Conf. Multisens. Fusion Integr. Intell.Syst. (2017)https://doi.org/10.1109/MFI.2016.7849538.
[39] C. Pieper, G. Maier, F. Pfaff, H. Kruggel-Emden, S. Wirtz, R. Gruna, B. Noack, V.Scherer, T. Längle, J. Beyerer, U.D. Hanebeck, Numerical modeling of an automatedoptical belt sorter using the Discrete Element Method, Powder Technol. 301(2016)https://doi.org/10.1016/j.powtec.2016.07.018.
[40] H. Kruggel-Emden, S. Rickelt, S. Wirtz, V. Scherer, A study on the validity of themulti-sphere Discrete Element Method, Powder Technol. 188 (2008) 153–165,https://doi.org/10.1016/j.powtec.2008.04.037.
[41] F. Elskamp, H. Kruggel-Emden, M. Hennig, U. Teipel, A strategy to determine DEMparameters for spherical and non-spherical particles, Granul. Matter 19 (2017)https://doi.org/10.1007/s10035-017-0710-0.
[42] D. Höhner, S. Wirtz, H. Kruggel-Emden, V. Scherer, Comparison of the multi-sphereand polyhedral approach to simulate non-spherical particles within the discrete el-ement method: Influence on temporal force evolution for multiple contacts, PowderTechnol. 208 (2011) 643–656, https://doi.org/10.1016/j.powtec.2011.01.003.
[43] Y.C. Zhou, B.D. Wright, R.Y. Yang, B.H. Xu, A.B. Yu, Rolling friction in the dynamicsimulation of sandpile formation, Phys. A Stat. Mech. Its Appl. 269 (1999)536–553, https://doi.org/10.1016/S0378-4371(99)00183-1.
[44] K. Xue, K. Li, W. Chen, D. Chong, J. Yan, Numerical investigation on the performanceof different primary nozzle structures in the supersonic ejector, Energy Procedia 105(2017) 4997–5004, https://doi.org/10.1016/j.egypro.2017.03.1000.
[45] A.R. Gnana Sagaya Raj, J.M. Mallikarjuna, V. Ganesan, Energy efficient piston config-uration for effective air motion - a CFD study, Appl. Energy 102 (2013) 347–354,https://doi.org/10.1016/j.apenergy.2012.07.022.
[46] H. Chu, R. Zhang, Y. Qi, Z. Kan, Simulation and experimental test of waterless wash-ing nozzles for fresh apricot, Biosyst. Eng. 159 (2017) 97–108, https://doi.org/10.1016/j.biosystemseng.2017.05.001.
[47] R. Di Felice, The voidage function for fluid-particle interaction systems, Int. J. Multi-phase Flow 20 (1994) 153–159, https://doi.org/10.1016/0301-9322(94)90011-6.
[48] A. Hölzer, M. Sommerfeld, New simple correlation formula for the drag coefficient ofnon-spherical particles, Powder Technol. 184 (2008) 361–365, https://doi.org/10.1016/j.powtec.2007.08.021.
[49] X.R. Li, V.P. Jilkov, Survey of maneuvering targettracking. Part I: dynamic models,IEEE Trans. Aerosp. Electron. Syst. 39 (2003) 1333–1364, https://doi.org/10.1109/TAES.2003.1261132.
[50] R.E. Kalman, A new approach to linear filtering and prediction problems, J. Basic Eng.82 (1960) 35, https://doi.org/10.1115/1.3662552.
[51] S.M. Kay, Fundamentals of statistical signal processing: estimation theory, Prentice-Hall Signal Process. Ser. (1993) 595, https://doi.org/10.2307/1269750.
[52] R.P.S. Mahler, Statistical Multisource-Multitarget Information Fusion, 2007https://doi.org/10.1017/CBO9781107415324.004.
[53] S. Blackmann, Robert Popoli, Design and Analysis of Modern Tracking Systems,Artech House, 1999.
[54] R. Jonker, A. Volgenant, A shortest augmenting path algorithm for dense and sparselinear assignment problems, Computing 38 (1987) 325–340, https://doi.org/10.1007/BF02278710.
[55] D.P. Bertsekas, Auction Algorithm. Encycl. Optim. (2009) 128–132.[56] G. Maier, F. Pfaff, M. Wagner, C. Pieper, R. Gruna, B. Noack, H. Kruggel-Emden, T.
Längle, U.D. Hanebeck, S. Wirtz, V. Scherer, J. Beyerer, Real-timemultitarget trackingfor sensor-based sorting: a new implementation of the auction algorithm forgraphics processing units, J. Real-Time Image Process. (2017)https://doi.org/10.1007/s11554-017-0735-y.
[57] D. Höhner, S. Wirtz, V. Scherer, Experimental and numerical investigation on the in-fluence of particle shape and shape approximation on hopper discharge using thediscrete element method, Powder Technol. 235 (2013) 614–627, https://doi.org/10.1016/j.powtec.2012.11.004.
[58] F. Sudbrock, E. Simsek, S. Rickelt, S. Wirtz, V. Scherer, Discrete element analysis ofexperiments on mixing and stoking of monodisperse spheres on a grate, PowderTechnol. 208 (2011) 111–120, https://doi.org/10.1016/j.powtec.2010.12.008.