
Numerical modelling and scientific visualisation ... · PDF fileNumerical modelling and...
19
Deep Mining 2014 – M Hudyma and Y Potvin (eds) © 2014 Australian Centre for Geomechanics, Perth, ISBN 978-0-9870937-9-0 Deep Mining 2014, Sudbury, Canada 377 Numerical modelling and scientific visualisation – integration of geomechanics into modern mine designs L Cotesta Itasca Consulting Canada Inc., Canada CP O'Connor Itasca Consulting Canada Inc., Canada RK Brummer Itasca Consulting Canada Inc., Canada AR Punkkinen Vale Canada Ltd., Canada Abstract As mines progress to depths for which the induced stress levels exceed the intact strength of the host rock, significant challenges related to rock mass instability must be met. However, given complexity and the scale of orebodies in deep mines, it is increasingly more challenging to predict/pinpoint where and when stress levels will become problematic. Prediction of where and when large scale instabilities will occur continues to be the ‘holy grail’ of rock mechanics in deep mining. There is no perfect solution; however, there have been a number of technological advancements that greatly helped to develop our understanding of rock mass behaviour and the risks pertaining to deep hard rock mines. It is recognised that at the mine scale, geology and material properties are not fully known, however, using past experience and sound engineering judgment, it is possible to use innovative tools and methodologies to arrive at a reasonable approximation of how a rock mass will behave at depth. The main goal of this paper is to provide an overview of how some of these tools and methodologies have evolved and are actively being applied to the planning of deep mines. Vale Canada Ltd.'s Creighton Mine will be used as a case study to demonstrate how these new techniques have contributed to a better understanding, and hence a better mine planning approach for hard rock mines at depth. 1 Introduction Many existing Canadian deep mines have untapped resource which are open at depth, and as a result, the feasibility of many deep extension-type mining projects have been evaluated in recent years. For such studies, it is fortunate that many of these mines have collected tremendous amounts of ground control experience, and typically, there exists some level of instrumentation data that was at some point needed to measure the rock mass’ response to mining. Many types of instrumentation data might exist for any given mine, however, for deep and high stress mining, modern microseismic monitoring systems are ideal tools that provide real-time insight as to how rock masses respond to mining on a mine-wide scale. During the operational phases of a deep mine, microseismic systems are used daily as frontline hazard identification tools, allowing ground control engineers to make important decisions related to re-entry into seismically active areas or to track active structural features in the mine, etc. When looking at historical microseismic/seismic data over the life of a mine or mining zone, this information can be very useful for understanding the mine's global rock mass response to mining. Provided the quality of the data is good, it is possible to use this data to validate numerical stress models that would typically show good agreement with experience gained at the mine. Looking at historically calibrated numerical models using advanced visualisation techniques provides a deeper understanding of rock mass behaviours that are not always obvious when using this data on a day-to-day basis. For deep mines that are open at depth, using these techniques and methodologies make it possible to increase confidence levels for key mine design decisions that need to be made at the study phase(s) of deep mining projects. The main goal of this paper is to provide an overview of how advanced numerical modelling and scientific visualisation tools and https://papers.acg.uwa.edu.au/p/1410_25_Cotesta/
Transcript of Numerical modelling and scientific visualisation ... · PDF fileNumerical modelling and...

Deep Mining 2014 – M Hudyma and Y Potvin (eds) © 2014 Australian Centre for Geomechanics, Perth, ISBN 978-0-9870937-9-0
Deep Mining 2014, Sudbury, Canada 377
Numerical modelling and scientific visualisation – integration of geomechanics into modern mine designs
L Cotesta Itasca Consulting Canada Inc., Canada
CP O'Connor Itasca Consulting Canada Inc., Canada
RK Brummer Itasca Consulting Canada Inc., Canada
AR Punkkinen Vale Canada Ltd., Canada
Abstract
As mines progress to depths for which the induced stress levels exceed the intact strength of the host rock, significant challenges related to rock mass instability must be met. However, given complexity and the scale of orebodies in deep mines, it is increasingly more challenging to predict/pinpoint where and when stress levels will become problematic. Prediction of where and when large scale instabilities will occur continues to be the ‘holy grail’ of rock mechanics in deep mining. There is no perfect solution; however, there have been a number of technological advancements that greatly helped to develop our understanding of rock mass behaviour and the risks pertaining to deep hard rock mines.
It is recognised that at the mine scale, geology and material properties are not fully known, however, using past experience and sound engineering judgment, it is possible to use innovative tools and methodologies to arrive at a reasonable approximation of how a rock mass will behave at depth. The main goal of this paper is to provide an overview of how some of these tools and methodologies have evolved and are actively being applied to the planning of deep mines. Vale Canada Ltd.'s Creighton Mine will be used as a case study to demonstrate how these new techniques have contributed to a better understanding, and hence a better mine planning approach for hard rock mines at depth.
1 Introduction
Many existing Canadian deep mines have untapped resource which are open at depth, and as a result, the feasibility of many deep extension-type mining projects have been evaluated in recent years. For such studies, it is fortunate that many of these mines have collected tremendous amounts of ground control experience, and typically, there exists some level of instrumentation data that was at some point needed to measure the rock mass’ response to mining. Many types of instrumentation data might exist for any given mine, however, for deep and high stress mining, modern microseismic monitoring systems are ideal tools that provide real-time insight as to how rock masses respond to mining on a mine-wide scale.
During the operational phases of a deep mine, microseismic systems are used daily as frontline hazard identification tools, allowing ground control engineers to make important decisions related to re-entry into seismically active areas or to track active structural features in the mine, etc. When looking at historical microseismic/seismic data over the life of a mine or mining zone, this information can be very useful for understanding the mine's global rock mass response to mining. Provided the quality of the data is good, it is possible to use this data to validate numerical stress models that would typically show good agreement with experience gained at the mine. Looking at historically calibrated numerical models using advanced visualisation techniques provides a deeper understanding of rock mass behaviours that are not always obvious when using this data on a day-to-day basis. For deep mines that are open at depth, using these techniques and methodologies make it possible to increase confidence levels for key mine design decisions that need to be made at the study phase(s) of deep mining projects. The main goal of this paper is to provide an overview of how advanced numerical modelling and scientific visualisation tools and
https://papers.acg.uwa.edu.au/p/1410_25_Cotesta/

Numerical modelling and scientific visualisation – integration of geomechanics into L Cotesta et al. modern mine designs
378 Deep Mining 2014, Sudbury, Canada
methodologies have evolved and are actively being applied to the mine design process, and consequently are proving to be an invaluable tool for the planning of deep mines.
2 Computer intergraded geomechanical mine modelling approach
Historically, a significant challenge in geomechanics for deep hard rock mining has been the inability to effectively combine data from various sources, e.g. mine infrastructure and development, stope geometry and sequence, 3D geological models, microseismic data and numerical modelling simulations, etc. within a single unified platform in order to enhance our ability to understand our mines and make better decisions. This challenge was not unique to mining, it also existed for many other disciplines related to the geoscience fields and several research initiatives were launched in the early 2000s to address this. As a result, tools and methodologies have been developed and tested by some of the early adopters of the technology (Kaiser et al. 2002; Henning et al. 2003; Vorauer & Cotesta 2005; Maybee et al. 2007).
Recent advances in hardware and software are becoming more main stream and are allowing a broader range of users to meet deep mining challenges. A process called Computer Integrated Geomechanical Mine Modelling Approach (CIGMMA – pronounced ‘sigma’) enables engineers to first understand, and then build complex models making use of valuable multi-disciplinary 3D data. The process also assists modellers to better validate and interpret numerical simulation results through the use of data integration techniques, resulting in a calibrated model which can be used to help answer important mine design questions. Further to this, CIGMMA serves as a vehicle to facilitate communication of complex stress/seismicity results to mine managers, mine planners, production staff, geologists, and the entire mine design team. Itasca has successfully applied CIGMMA to a number of large scale deep mining projects, and it is being applied at several Itasca offices. The software package GocadTM is the tool of choice and is used as the primary data integration and visualisation platform for CIGMMA. The flexibility, abundance of features, data integration/analysis and geo-modelling capabilities of GocadTM make it the ideal tool for CIGMMA.
Until recently, it can be argued that geomechanics work has been done in relative isolation of the mine design teams. CIGMMA has been a major development in the field of mine design in that geomechanics can be readily integrated into the mine design process. This is a crucial element in the advancement of the state-of-the-art for mine design projects. The CIGMMA process, as applied to deeper phases of the Creighton Mine, will be described within this paper in order to highlight the benefits.
3 Vale's Creighton Mine
Creighton Mine is located within the city of Greater Sudbury, Ontario, Canada, approximately 7 km north of the town of Lively, Ontario. Creighton is one of the oldest operating mines in the Sudbury Basin, the first ore being produced from an open pit in 1901. The No.9 shaft, extending from surface to the 7000 L (2,130 m, 7,000 ft below surface), is the only shaft or winze in operation today. The mine currently extends down to the 8070 L and is ramping down to 8200 L. The known resource extends to 3,050 m (10,000 ft) and is open at depth.
3.1 Geology
The hanging wall rock in the area under consideration generally consist of units common to the Sudbury Igneous Complex (SIC), however, a generalisation for the purposes of this work was that the units were typically noritic in nature and were simply classified as norites. The footwall rock generally consists of granites with some minor Gabbroic inclusions, but for the purposes of this work were generalised to granites.
While the geology of the host rocks at Creighton is fairly straightforward, there lies significant complexity in the spatial distribution of the ore. This is mainly due to the significant amount of post-ore shearing that has taken place, which has resulted in the creation of several individual orebodies. Wireframes that encompass the ore mineralisation as were integrated into the CIGMMA model are shown in Figure 1 and the system of faults and shears in the corresponding area may be seen in Figure 2.

Numerical modelling
Deep Mining 2014, Sudbury, Canada 379
Figure 1 Isometric view showing the orebodies of interest for the calibration modelling
Figure 2 (a) 3D isometric view looking northeast showing interpreted shears that are encountered in the calibration area; (b) geological level plan for the 7530 L illustrating the major structures typically encountered in the deeper levels
3.2 Mining method, timeframe and battery limits
Over 100 years of mining extraction has occurred at Creighton Mine and several mining methods have been employed. Although it is possible to replicate the entire history of Creighton in a numerical model, it was not necessary within the context of this study. The battery limits for this work were set to cover a specific region of the mine, 6200 L through to 8200 L. For the model calibration region, a primarily pillarless, top-down modified slot-slash (SS) method was used with random uppers (URM) blocks. The mining timeframe used for calibration ranged from 2002 to the second quarter of 2008 (Figure 3).

Numerical modelling and scientific visualisation – integration of geomechanics into L Cotesta et al. modern mine designs
380 Deep Mining 2014, Sudbury, Canada
Figure 3 Calibration model battery limits showing development and simplified historical mining prior to and including 2002 (light grey) up to Q2 2008 (black)
3.3 Microseismic system and data
A full-waveform, hyperion microseismic system (Engineering Seismology Group (ESG)) was used to monitor seismic activity at the mine between 3310 L and 8070 L (1,010 and 2,460 m depths). Today, the system has been replaced by newer ESG Paladin seismic monitoring hardware. The deep mine is currently being serviced by 37 uniaxial sensors and 11 triaxial sensors (Figure 4(a)). The upper levels are being monitored with 16 uniaxial sensors and one triaxial sensor. There is also a strong motion system consisting of four Paladin sensors. The system has excellent coverage of the footwall with some limited coverage of the hanging wall. As a result, the majority of the events are located in the footwall in the granites, although most low-frequency events are well located in the hanging wall norites, with some loss in the high-frequency spectrum. The microseismic data for years 2002 through to second quarter of 2008 were incorporated into the CIGMMA model.
Once the data was incorporated into the GocadTM platform, the complex dataset was queried with relative ease and it became possible to identify spatial relationships or assess any of the seismic parameters that are computed by the microseismic system. One important element related to using microseismic data to calibrate numerical models was to be able to assess the quality of the dataset. For mining-induced seismicity, accurate location is the most important seismic source parameter (Brummer 1999). Spatial plotting of high precision seismic data frequently identifies the location of seismogenic rock mass failure near geological structures, or in proximity to mine blasts, mine stopes and mine pillars (Leslie & Vezina 2001; Hudyma et al. 1995). Therefore, if good data exists, it is the author's experience that the most convincing result for a calibration is achieved by comparing the stress outputs to event location. This is not to say that the other parameters, e.g. local magnitude scale, seismic moment, apparent stress, moment magnitudes, etc, are not important for calibration, however, if it is not possible to achieve accurate event location, it is simply not possible to calibrate a model.
One simple example of evaluating a microseismic dataset is to query the system’s ‘error’ parameter for each event. For the ESG systems, this is typically based on a least squares regression on the difference between the observed and calculated arrival times, i.e. the station residuals. For Creighton, the error

Numerical modelling
Deep Mining 2014, Sudbury, Canada 381
number is reported in feet. The distribution and the summary statistics for the error parameter directly queried from the model data can be seen below in Figure 5.
The mean error for this set of data is 8 m (27 ft) and 90% of the data has an error of less than 14 m (45 ft). Figure 4(b) shows all of the microseismic events coloured by the error parameter. Also shown is the SIC contact as a visual delineation of the hanging wall (HW) and footwall (FW) events. It is clear from the figure that the error is lower in the footwall (average error ~7.3m, ~24 ft) compared to the hanging wall (average error 17.37 m, 57 ft).
(a) (b)
Figure 4 (a) isometric view of Creighton Mine showing all microseimic events since 2002 (small dots) in relation to the sensor array (larger diamonds); (b) microseismic events (2002–2008 Q1) in the HW and FW coloured by the computed location ‘error’ (ft)
Figure 5 Histogram and summary statistics for the error (ft) parameter as computed by the ESG systems
Numerical modelling and scientific visualisation – integration of geomechanics into L Cotesta et al. modern mine designs
382 Deep Mining 2014, Sudbury, Canada
4 Numerical modelling approach
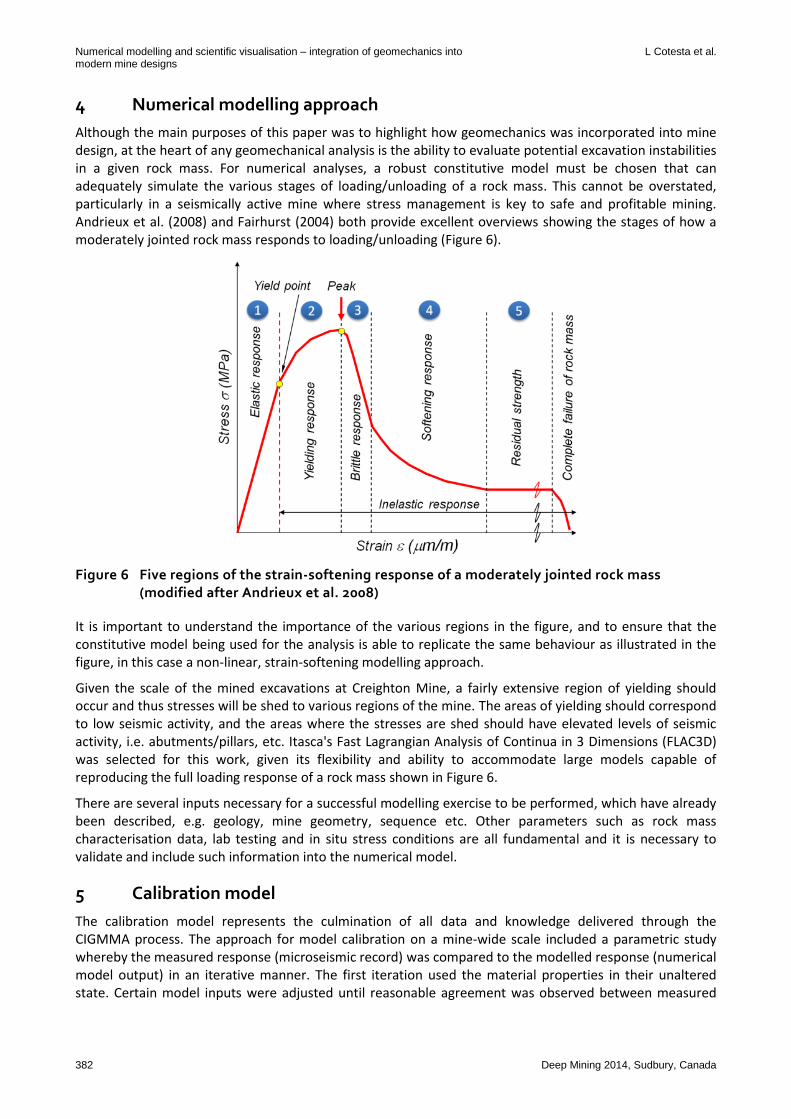
Although the main purposes of this paper was to highlight how geomechanics was incorporated into mine design, at the heart of any geomechanical analysis is the ability to evaluate potential excavation instabilities in a given rock mass. For numerical analyses, a robust constitutive model must be chosen that can adequately simulate the various stages of loading/unloading of a rock mass. This cannot be overstated, particularly in a seismically active mine where stress management is key to safe and profitable mining. Andrieux et al. (2008) and Fairhurst (2004) both provide excellent overviews showing the stages of how a moderately jointed rock mass responds to loading/unloading (Figure 6).
Figure 6 Five regions of the strain-softening response of a moderately jointed rock mass (modified after Andrieux et al. 2008)
It is important to understand the importance of the various regions in the figure, and to ensure that the constitutive model being used for the analysis is able to replicate the same behaviour as illustrated in the figure, in this case a non-linear, strain-softening modelling approach.
Given the scale of the mined excavations at Creighton Mine, a fairly extensive region of yielding should occur and thus stresses will be shed to various regions of the mine. The areas of yielding should correspond to low seismic activity, and the areas where the stresses are shed should have elevated levels of seismic activity, i.e. abutments/pillars, etc. Itasca's Fast Lagrangian Analysis of Continua in 3 Dimensions (FLAC3D) was selected for this work, given its flexibility and ability to accommodate large models capable of reproducing the full loading response of a rock mass shown in Figure 6.
There are several inputs necessary for a successful modelling exercise to be performed, which have already been described, e.g. geology, mine geometry, sequence etc. Other parameters such as rock mass characterisation data, lab testing and in situ stress conditions are all fundamental and it is necessary to validate and include such information into the numerical model.
5 Calibration model
The calibration model represents the culmination of all data and knowledge delivered through the CIGMMA process. The approach for model calibration on a mine-wide scale included a parametric study whereby the measured response (microseismic record) was compared to the modelled response (numerical model output) in an iterative manner. The first iteration used the material properties in their unaltered state. Certain model inputs were adjusted until reasonable agreement was observed between measured

Numerical modelling
Deep Mining 2014, Sudbury, Canada 383
and modelled responses. Initially, the calibration was qualitative in that coincidence between the measured/modelled responses was visually confirmed.
There are basically two types of seismic source mechanisms that are of interest for Creighton, and hard rock mining in general (Gibowicz & Kijko 1994). The first type includes events that are directly linked to stress redistribution caused by mining. These events are typically associated with volumetric fracturing and/or brittle failure of the rock mass. The second category of events is those which manifest themselves as shearing or failure of structural contacts, i.e. fault-slip events. The events that were of main concern for the calibration of the rock mass response in this study were those in the first category that are a direct result of the rock mass failure due to mining.
Perhaps one of the more important elements to consider for calibration is the region in the mine that has gone through the full stress cycle, yielded and has reached residual strength (Figure 6). In fact, this region is often overlooked and not given due consideration when it is one of the keys to creating a successful calibration model. From a microseismicity point of view, these areas have become seismically quiet or aseismic and do not typically generate significant events. From a modelling point of view, particularly at this scale, once the proper extent of yielding is achieved (in time and space), the stresses are properly shed to areas that should coincide with the actively seismic or seismogenic regions. Figure 7(a) shows the typical elements that are used during the calibration process, in this case, the modelled deviatoric stresses (colour
contours which represent the maximum principal stress – minimum principal stress = 1-3), the yield zones (crosses), mined voids (grey boxes), and the microseismic data (coloured diamonds). The corresponding aseismic and seismogenic zones are shown in Figure 7(b) as hatched patterns.
(a) (b)
Figure 7 (a) cross-section 4520E through Creighton Mine from a depth of 1,902 m (6,240 ft) down to 2,487 m (8,160 ft) showing modelled stresses (contours), the modelled yield (crosses), voids (grey boxes), and the microseismic data (spheres); (b) corresponding aseismic (dotted hatch pattern) and seismogenic (striped hatch pattern) zones
Examination of Figure 7 reveals two key observations:
1. The importance of being able to model the yielded zone so that stresses are properly shed to surrounding rock mass.
2. The importance of having good quality microseismic data, i.e. reliable event locations.
The absence of either one of these elements would render a calibration effort unsuccessful.

Numerical modelling and scientific visualisation – integration of geomechanics into L Cotesta et al. modern mine designs
384 Deep Mining 2014, Sudbury, Canada
After the quality of the data has been assessed, the next step in the calibration was to qualitatively compare the occurrence of microseismicity against the computed stress levels. The deviatoric stress is often used as a proxy for identifying elevated stress conditions in this type of calibration exercise. A number of studies and experiments, e.g. Brummer and Kaiser (1995), Martin (1994), Castro et al. (1996) and Diederichs (1999), have been done to demonstrate the deviatoric stress levels at which damage of the brittle rock mass will occur. A number of these studies aimed to establish the point at which the onset of damage (damage initiation) occurs. Past studies were based on several different validation methods: field observations as reported by rock mechanics practitioners in active mines (Brummer & Kaiser 1995), field observations from rock mass deformation monitoring (Castro et al. 1996), visible damage from borehole fracture surveys (Diederichs 1999) and acoustic emissions (Martin 1994). All of these studies suggest that the damage initiation of the rock mass occurs at a principal stress difference (deviator) between 1/3 to 1/2
of the unconfined compressive strength (UCS) or 1 – 3 = 0.3 to 0.5 UCS. For simplicity, the UCS of the granites or norites at Creighton may be estimated to be 200 +/- 20 MPa.
A key feature of the CIGMMA process allows the mine design teams to interrogate and compare both the modelled (stress model) and measured (microseismicity) responses in both space and time. It is possible to visualise the deviatoric stresses on orthogonal planes anywhere throughout the calibration model limits. These planes can be dynamically moved in real-time so that the stress modelling results can be compared to the microseismic data at any location within the calibration volume. The calibration is best evaluated in areas where the largest population of events are observed to occur, which for Creighton is predominantly in the footwall and centred along the orebody's centre of gravity from top to bottom wrapping beneath the active mining front, below previously backfilled stopes.
The dynamic response due to blasting is not directly captured in the model, and seismic data related to blasting is filtered from the calibration dataset, however, the seismic response to production blasting, in particular the final sill or ‘crown blast’, in seismically averse areas, is internally documented and well understood by Vale rock mechanics staff at the mine site. Referred to as the “migration of microseismic activity” (pers. comm., A Punkkinen, May 1st 2014), seismicity first concentrates at the region nearest the freshly blasted stope cavity, after which stresses continue to re-adjust and get re-distributed to upper levels in the mine over time. This effect is more pronounced when a large magnitude seismic event is generated in the seismogenic region (zone of migration) following blasting. A similar density of events would be expected in the hanging wall, particularly when mining hanging wall stopes, although the practical limits of microseimic monitoring in the hanging wall results in a reduction of high-frequency events and reduced source location accuracy.
Figure 7 shows an example of one of the cross-sections that was used for the calibration phase. Section 4520E has a concentrated amount of microseismicity that is observed within the ‘high stress’ corridor, and it was ideally located to observe the behaviour of the creation of an inter-orebody pillar between the 461 OB and the 400 OB on the 7810 L. Understanding the mining response of this region has important implications for mine design at deeper elevations at Creighton.
During the model calibration phase of the Creighton study, several model runs were needed and every one was qualitatively compared against the microseismic data. The parsed microseismic events were compared to corresponding deviatoric stress levels and yielded zones. Ideally, the aim is to match the aseismic region to the yielded regions and to have the seismogenic regions straddle the limit of yielded material and coincide with high deviatoric stress levels. Post peak material properties were adjusted until a reasonable fit between measured and modelled responses was achieved. In total, 11 individual modelling runs were required to converge to the final calibrated model for this particular study.
5.1 Stress shedding, microseismic migration and pillar loading
The key to a successful calibration is ensuring that the yielded region is properly simulated. This is further highlighted in Figure 8 where (a) shows a snapshot of the mine (section 4520E) in 2002 and (b) shows the same location but at the end of Q2 2008. The yielded region has been delineated by a dashed line in 2002

Numerical modelling
Deep Mining 2014, Sudbury, Canada 385
and overlaid on the 2008 data to illustrate the migration of the yielded zone and how the microseismicity (for the most part) no longer occurs in the newly formed yielded region.
Figure 8 shows the creation of a pillar between the 461 OB and the 400 OB (due to orebody geometry). This pillar had not yielded at this stage and as a result is seismically active. The model shows that a portion of the pillar is yielding, and is near peak conditions and is still capable of storing large amounts of strain energy due to the confinement in the pillar. The experience gained while mining these areas is highly relevant as mining progresses deeper, given that larger pillars will be created at depth and accompanied by more extensive mining than is currently shown. It should be noted that, at this stage in the sequence, only a few stopes had been mined from the 461 OB.
(a) (b)
Figure 8 Section 4520E where (a) is 2002 data; and (b) is 2008 data. Both plots show deviatoric stress contours, yielded region (crosses) and microseismicity (white spheres). The yield limit from 2002 is shown as a dashed line and is overlayed onto the 2008 figure
The effect of incrementally mining this pillar has been further studied through the addition of some updates to the existing model done in 2010 and 2013 to reflect more recent mining. A few snapshots showing updated mining, microseismicity and stress modelling results are shown below in Figure 9. By comparing the seismicity occurring between the orebodies over time, it can be seen that the inter-orebody pillar is gradually yielding, but still carries some abutment stress. The microseismic data nicely corroborated the modelling results. These types of observations should be continually revisited to ensure the model is still calibrated.

Numerical modelling and scientific visualisation – integration of geomechanics into L Cotesta et al. modern mine designs
386 Deep Mining 2014, Sudbury, Canada
Figure 9 Section 4500E showing mining (wireframe), corresponding microseismicity, and updated calibration modelling results (deviatoric stress contours) by quarter from 2008 Q3 to 2009 Q2
5.2 Choosing the right constitutive model
The ability of the model to allow the rock mass to yield and properly shed stresses was key to the model calibration for Creighton. There are scenarios where elastic models are useful, but it is important to recognise when and how to use such models. The straight forward nature of elastic modelling is the main attraction, particularly since there is more effort required for a strain softening model. Although the effort for elastic modelling is much lower on the front end, the interpretation of outputs/results can be very ambiguous may easily be misinterpreted. To better illustrate this, consider the images shown below in Figure 10. Both models are identical in terms of geology, geometry and sequence, however, the image on the right side shows the output of an elastic model and the image on the left side shows the inelastic model.
The manifestation of highly stressed ground in areas that have been aseismic reveals that the elastic model did not properly represent the mine-wide scale behaviour at Creighton. Whereas the inelastic model is capable of simulating regions in the mine which have yielded, and stresses are then shedded to areas that correspond well to the microseismic response. The main reason for the difference is that the elastic model is not cannot explicitly simulate the yielded regions in the footwall and hanging wall. This highlights the importance of the constitutive model being able to model the yielded region, which is of particular importance at this scale of analysis.

Numerical modelling
Deep Mining 2014, Sudbury, Canada 387
(a) (b)
Figure 10 Cross-section comparison of a strain-softening model (a) versus an elastic model (b) along with the corresponding seismic response for 2007 Q2
5.3 Large seismic events
A separate database of large events detected by the strong ground motion (SGM) system was provided by mine staff. Figure 11 shows a similar trend in that large events in the footwall correspond spatially with the high deviatoric stress levels, particularly the events in the footwall where location error is lower. The contours shown in the figure represent the maximum modelled deviatoric stress between 2002 and 2009 Q2. There is generally good agreement with the modelled stress levels, however, the very large events are typically associated with more complex source mechanisms, i.e. shear rupture, fault-slip etc., and are not fully explainable by direct correlations with the mining-induced stress. The more likely reason for this agreement is that the large events are, for the most part, triggered by mining-induced stress redistributions that are also coincident with large structural features. While it was possible to make some qualitative assessments regarding fault-slip related events that were in close proximity to mining, the primary focus was to ensure that the model was able to reproduce the rock mass’ response to mining. Some work has been done on evaluating slip potential on these large structures (at the mine) using the excess shear stress methodology (ESS) (Ryder 1988), however, work is ongoing in this area.
The hanging wall is historically where the largest events have occurred at the mine, however, they are not generally as accurately located as the events in the footwall. Migration of hanging wall seismic activity has been observed as far as 300 m (1,000 ft) away and over a period of weeks following a large event. Again, the nature and causes of these hanging wall events can be debated, e.g. hanging wall relaxation, structures, dynamic triggering, however, it is beyond the scope of this paper.
The microseismic events, those which represent volumetric fracturing of the rock mass and typically occur shortly after blasting, are most important when calibrating the rock masses response to mining. All of the development and active mining areas are located in the footwall. Fortunately, most footwall events plot

Numerical modelling and scientific visualisation – integration of geomechanics into L Cotesta et al. modern mine designs
388 Deep Mining 2014, Sudbury, Canada
within a window of time whereby access to critical areas is pro-actively restricted following each production blast at depth, part of Creighton Mine’s blast re-entry protocol. Hanging wall events are an issue when the events are sufficiently large to cause concerns due to seismic shaking or in rare cases from subsequent redistribution of seismicity to the footwall.
Figure 11 Strong ground motion seismic events (2002 to 2009 Q2) coloured and sized by local magnitude (calibrated to Nuttli) plotted against the maximum recorded deviatoric stress during the same time period
6 Relevance to mine design
From the calibrated numerical model, criteria were developed, based on the seismic record and past experience at the mine, that was used for the purpose of evaluating mid to long-term mine designs for Creighton described below.
6.1 Stress hazard limits
Through the use of the CIGMMA process, the calibrated model produced a relatively accurate representation of where and when the rock mass yields and consequently it replicates where the stresses will then be shed. It is reasonable to assume that the model should also predict areas where high stresses will develop. These areas are treated as areas of high stress hazard potential. As a result, some preliminary stress hazard categories for the deep mine were developed based on the deviatoric stress in relation to the

Numerical modelling
Deep Mining 2014, Sudbury, Canada 389
intact rock strength. Figure 12 shows the stress hazard map (section 4530E) and corresponding categories derived from this work to represent the different stress conditions that may be encountered for deep mining at Creighton. These stress hazard maps have been created on a level by level basis and will with overall forecasting for future mine planning, i.e. ground support, sequence, excavation placement etc. The calibration model and hazard limits must be continuously updated in order to account for newly observed rock mass behaviours and to make necessary refinements as new information/behaviours are observed.
Figure 12 Stress hazard map for section 4520E of the calibration model
Creighton Mine adopted the use of seismic hazard maps as described in Kaiser et al. (2005). It was interesting to be able to compare the historical seismic hazard maps with the stress hazard maps developed through this completely independent process.
Mine staff has processed historical microseismic data and were able to reconcile high hazard areas to be representative of areas where seismic-related rock mass difficulties were experienced at the mine. This methodology was also effective in terms of alerting operators and ground control engineers of areas that are potentially hazardous and/or that may require additional rehabilitation of ground support. While the current seismic hazard maps developed at the mine provide excellent feedback in terms of past behaviours and short-term planning, their use for extensive mid to long-term planning is limited since they rely on the

Numerical modelling and scientific visualisation – integration of geomechanics into L Cotesta et al. modern mine designs
390 Deep Mining 2014, Sudbury, Canada
measured response and cannot be used to forecast future behaviour. For such cases, an appropriate numerical modelling analogue is used to predict where these areas of high hazard might arise.
It was hypothesised that the stress hazard maps (generated from the calibrated numerical model) would be able to identify similar trends as those of the seismic hazard maps (generated for data collected at the site). The seismic hazard maps for a few of the deep levels of the mine were provided by A Punkkinen via email on 7 December 2009 for comparison to the stress hazard maps derived from the calibration exercise. In order to compare the two hazard maps, the stress hazard (generated from the numerical model) was projected onto the drifts in the GocadTM model. Figure 13 shows a comparison of Creighton’s seismic hazard maps (left images) versus the stress hazard maps (right images) for the 7400 L and 7680 L respectively.
Figure 13 Creighton Mine seismic hazard maps (left) versus stress hazard maps (right) for the 7400 L (top) and 7680 L (bottom) Note: refer to CD accompanying this proceedings for full colour figure
The figures demonstrate that both approaches are comparable, particularly in identifying the moderate to high hazard areas, i.e. yellow/orange in the seismic hazard versus red/magenta for the stress hazard. There are, however, important differences between the approaches. On the stress hazard map, local effects due to the drift development excavations or structures (faults, contact, etc.) are not captured by the model, but the seismic system records such events and their effects are captured in the mine's seismic hazard map. Conversely, areas with poor sensor coverage are not likely to register on the mine's seismic hazard map but are well represented in the stress hazard maps. The basis for some of the criteria used to derive the seismic hazard maps were not necessarily captured with the stress hazard approach. Regardless of the potential differences, overall the numerically derived stress hazard maps compared favourably with the seismic

Numerical modelling
Deep Mining 2014, Sudbury, Canada 391
hazard maps, which further confirmed that the calibration model produced a result which was comparable to the observed conditions at the mine.
The stress hazard map approach provides the opportunity to project behaviour into the future, and thus investigate the key differences in rock mass responses between future mining alternatives. With a well calibrated model, simulation of high/low hazard/stress conditions may be anticipated, and forecast where stress-driven geomechanical problems may arise. Further to this, being able to make good use of the mine's independently derived seismic hazard maps as a reality check provides confidence in the ability to forecast areas of concern and directly enables an extension of the hazard map logic that would be used for mid to long-term planning purposes.
6.2 Forecasting stress for long-range planning
Using the CIGMMA process for Creighton Mine, it has been shown that it is possible to relate/track historical microseismicity over time, to numerically derived stress levels. As a result, stress hazard limits have been established based on historical information and experience, making it possible to use them in a predictive manner to assist with overall long-term mine planning for deeper levels, i.e. support, sequence, excavation placement etc. These limits formed the basis for stress hazard maps that were developed to assist with planning, locating and supporting deep infrastructure, one example of this is shown in Figure 14. The stress hazard map in the top right image of Figure 14 is showing the maximum stress levels that have been experienced over the life-of-mine. This provides direct feedback in mine planning for identification of the regions of development that could be at risk if left in their current locations. In cases where it is not possible to move an excavation, adequate ground support must be installed along with load and displacement monitoring as needed.
Figure 14 (top) stress hazard ‘painted’ on development designs; (bottom) stress hazard map for the 7810 L
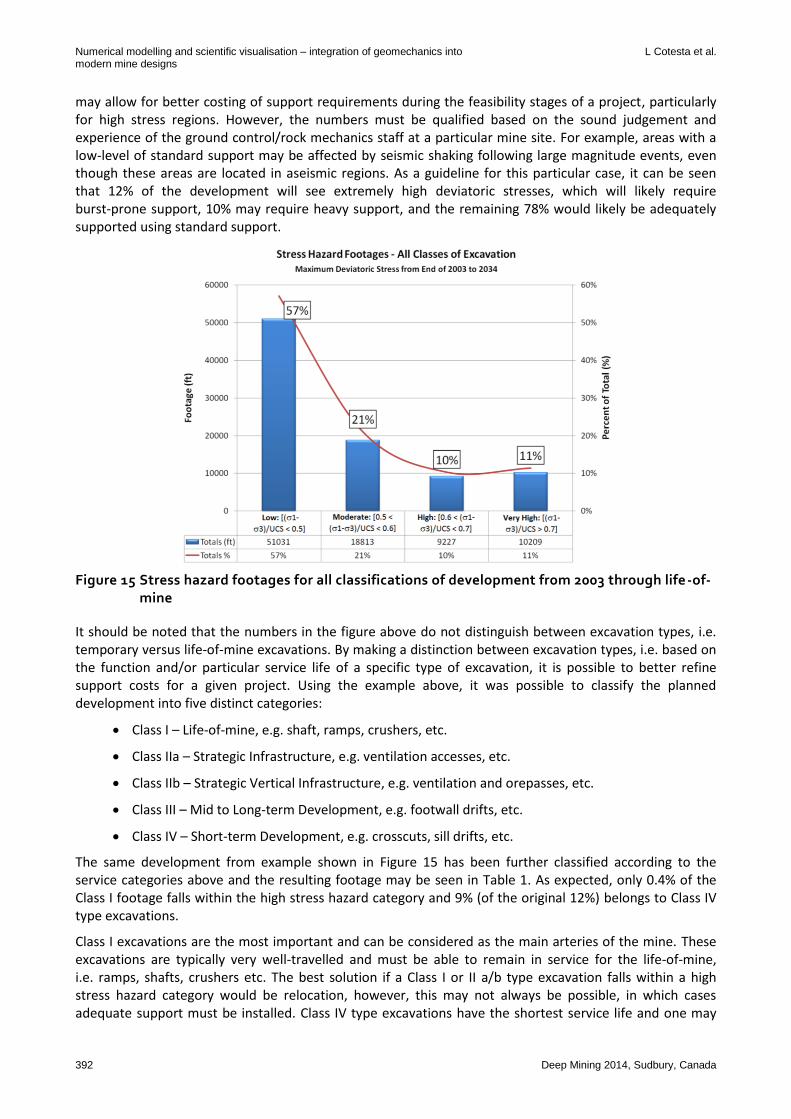
Relating the stress hazard limits to previous experience in the mine also makes it possible to identify quantities of development that may require additional levels of support. The GocadTM software platform allowed for the computation of such quantities with customised scripts. For illustrative purposes, Figure 15 shows a summary of development footage that fall within a certain deviatoric stress range. Such numbers
Numerical modelling and scientific visualisation – integration of geomechanics into L Cotesta et al. modern mine designs
392 Deep Mining 2014, Sudbury, Canada
may allow for better costing of support requirements during the feasibility stages of a project, particularly for high stress regions. However, the numbers must be qualified based on the sound judgement and experience of the ground control/rock mechanics staff at a particular mine site. For example, areas with a low-level of standard support may be affected by seismic shaking following large magnitude events, even though these areas are located in aseismic regions. As a guideline for this particular case, it can be seen that 12% of the development will see extremely high deviatoric stresses, which will likely require burst-prone support, 10% may require heavy support, and the remaining 78% would likely be adequately supported using standard support.
Figure 15 Stress hazard footages for all classifications of development from 2003 through life -of-mine
It should be noted that the numbers in the figure above do not distinguish between excavation types, i.e. temporary versus life-of-mine excavations. By making a distinction between excavation types, i.e. based on the function and/or particular service life of a specific type of excavation, it is possible to better refine support costs for a given project. Using the example above, it was possible to classify the planned development into five distinct categories:
Class I – Life-of-mine, e.g. shaft, ramps, crushers, etc.
Class IIa – Strategic Infrastructure, e.g. ventilation accesses, etc.
Class IIb – Strategic Vertical Infrastructure, e.g. ventilation and orepasses, etc.
Class III – Mid to Long-term Development, e.g. footwall drifts, etc.
Class IV – Short-term Development, e.g. crosscuts, sill drifts, etc.
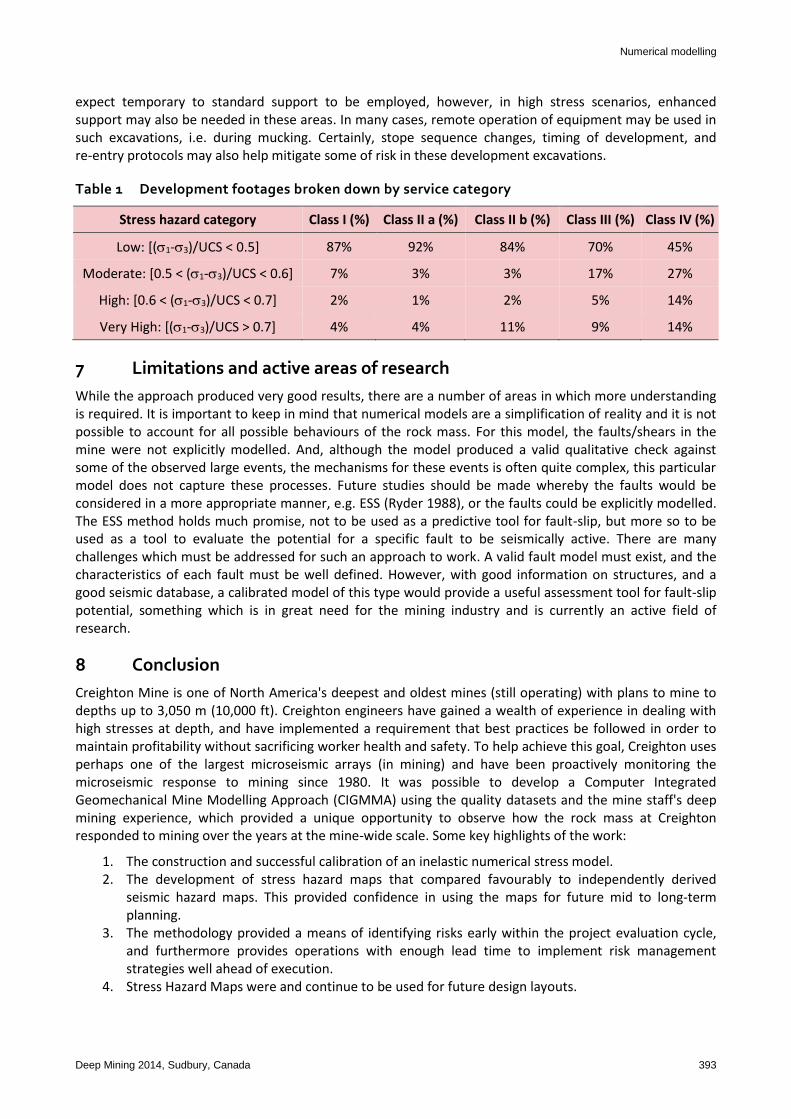
The same development from example shown in Figure 15 has been further classified according to the service categories above and the resulting footage may be seen in Table 1. As expected, only 0.4% of the Class I footage falls within the high stress hazard category and 9% (of the original 12%) belongs to Class IV type excavations.
Class I excavations are the most important and can be considered as the main arteries of the mine. These excavations are typically very well-travelled and must be able to remain in service for the life-of-mine, i.e. ramps, shafts, crushers etc. The best solution if a Class I or II a/b type excavation falls within a high stress hazard category would be relocation, however, this may not always be possible, in which cases adequate support must be installed. Class IV type excavations have the shortest service life and one may
Numerical modelling
Deep Mining 2014, Sudbury, Canada 393
expect temporary to standard support to be employed, however, in high stress scenarios, enhanced support may also be needed in these areas. In many cases, remote operation of equipment may be used in such excavations, i.e. during mucking. Certainly, stope sequence changes, timing of development, and re-entry protocols may also help mitigate some of risk in these development excavations.
Table 1 Development footages broken down by service category
Stress hazard category Class I (%) Class II a (%) Class II b (%) Class III (%) Class IV (%)
Low: [(1-3)/UCS < 0.5] 87% 92% 84% 70% 45%
Moderate: [0.5 < (1-3)/UCS < 0.6] 7% 3% 3% 17% 27%
High: [0.6 < (1-3)/UCS < 0.7] 2% 1% 2% 5% 14%
Very High: [(1-3)/UCS > 0.7] 4% 4% 11% 9% 14%
7 Limitations and active areas of research
While the approach produced very good results, there are a number of areas in which more understanding is required. It is important to keep in mind that numerical models are a simplification of reality and it is not possible to account for all possible behaviours of the rock mass. For this model, the faults/shears in the mine were not explicitly modelled. And, although the model produced a valid qualitative check against some of the observed large events, the mechanisms for these events is often quite complex, this particular model does not capture these processes. Future studies should be made whereby the faults would be considered in a more appropriate manner, e.g. ESS (Ryder 1988), or the faults could be explicitly modelled. The ESS method holds much promise, not to be used as a predictive tool for fault-slip, but more so to be used as a tool to evaluate the potential for a specific fault to be seismically active. There are many challenges which must be addressed for such an approach to work. A valid fault model must exist, and the characteristics of each fault must be well defined. However, with good information on structures, and a good seismic database, a calibrated model of this type would provide a useful assessment tool for fault-slip potential, something which is in great need for the mining industry and is currently an active field of research.
8 Conclusion
Creighton Mine is one of North America's deepest and oldest mines (still operating) with plans to mine to depths up to 3,050 m (10,000 ft). Creighton engineers have gained a wealth of experience in dealing with high stresses at depth, and have implemented a requirement that best practices be followed in order to maintain profitability without sacrificing worker health and safety. To help achieve this goal, Creighton uses perhaps one of the largest microseismic arrays (in mining) and have been proactively monitoring the microseismic response to mining since 1980. It was possible to develop a Computer Integrated Geomechanical Mine Modelling Approach (CIGMMA) using the quality datasets and the mine staff's deep mining experience, which provided a unique opportunity to observe how the rock mass at Creighton responded to mining over the years at the mine-wide scale. Some key highlights of the work:
1. The construction and successful calibration of an inelastic numerical stress model. 2. The development of stress hazard maps that compared favourably to independently derived
seismic hazard maps. This provided confidence in using the maps for future mid to long-term planning.
3. The methodology provided a means of identifying risks early within the project evaluation cycle, and furthermore provides operations with enough lead time to implement risk management strategies well ahead of execution.
4. Stress Hazard Maps were and continue to be used for future design layouts.
Numerical modelling and scientific visualisation – integration of geomechanics into L Cotesta et al. modern mine designs
394 Deep Mining 2014, Sudbury, Canada
5. The approach enabled design teams to better forecast costs associated with ground support for different types of excavations, adding better precision to the overall project evaluation.
While the idea is not new, better understanding and appreciation of geomechanics issues at depth, combined with software and hardware advances, have made it possible to fully integrate geomechanics knowledge into the mine design process. More specifically for Creighton, it was demonstrated how valuable these techniques have been for the planning of the deeper mine, and has contributed to a much better understanding of how the rock mass responds, at the mine-scale, to mining at depth. The CIGMMA methodology as applied at Creighton brought together a team of multi-disciplinary experts and allowed them to develop and review a very complex and challenging mine design for a deep resource representing a significant potential resource for the future of the mine. In the authors opinions, this is something that has not been fully realised until recent years, and Creighton represented one of the most comprehensive case studies of its kind.
Acknowledgements
Gratitude is extended to Vale Canada Ltd. for permission to use and publish this data. Thanks to Marty Hudyma for providing a critical review of this paper, and the work in general that was part of the requirements for a Masters of Engineering project. A special thank you to Denis Thibodeau and Yves Leveille for seeing the value in pursuing this work as a Masters of Engineering project. Much appreciation goes out to Mike Yao and Samantha Espley, who were directly involved in this study, but also reviewed this paper prior to submission. Thanks to Patrick Andrieux for many discussions related to rock mechanics and model calibration. Last but certainly not least, thanks to the many staff members of both Creighton Mine and the Mine Projects and Development Group who have contributed to this work in some way: Peter Adams, Brian Buss, Andre Comeau, Warren Flannery, Peter George, Darren Hodder, Andre Lauzon, Farid Malek, Narayan Mamidi, Miro Mytny, Rob Palkovits, Mike Paventi, Danielle Pelletier, John Townend, Tony VanWiechen and Justin Whitmore.
References
Andrieux, PP, Hudyma, MR, O’Connor, CP, Li, H, Cotesta, L, & Brummer, RK 2008, ‘Calibration of large-scale three-dimensional non-linear numerical models of underground mines using microseismicity data’, Proceedings of the First International FLAC/DEM Symposium, Itasca Consulting Group, Inc., Minneapolis, on CD-ROM.
Brummer, RK 1999, ‘Simple truths about rockbursts’, Proceedings of the 2nd South African Rock Engineering Symposium: SARES99, TO Hagan (ed.), South African National Institute of Rock Engineering, pp. 6-11.
Brummer, RK, & Kaiser, PK 1995, Identification of Rock Instability: Current Practice Survey, report submitted to Atomic Energy Canada Ltd., Geomechanics Research Centre, Sudbury.
Castro, L, McCreath, D & Oliver, D 1996, ‘Rock mass damage initiation around the Sudbury Neutrino Observatory Cavern’, Proceedings of the 2nd North American Rock Mechanics Symposium, vol. 2., A.A. Balkema, Rotterdam, pp. 1589-1595.
Diederichs, MS 1999, ‘Instability of hard rock masses: the role of tensile damage and relaxation’, PhD thesis, University of Waterloo, Waterloo.
Fairhurst, C 2004, ‘Nuclear waste disposal and rock mechanics: contributions of the Underground Research Laboratory (URL), Pinawa, Manitoba, Canada’, International Journal of Rock Mechanics & Mining Sciences, vol. 41, no. 8, pp. 1221-1227.
Gibowicz, SJ & Kijko, A 1994, ‘An Introduction to Mining Seismology’, 1st edn, Academic Press, San Diego. Henning, JG, Cotesta, L & Kaiser, PK 2003, ‘Geomechanics design of underground excavations utilizing virtual reality’, in R Singhal,
K Fyta & C Chiwetelu (eds), Proceedings of the Fourth International Conference on Computer Applications in the Minerals Industries, University of Calgary, Calgary, on CD-ROM.
Hudyma, MR, Milne, D & Grant, DR 1995, Geomechanics of Sill Pillar Mining in Rockburst-Prone Conditions, Final report: Sill Pillar Monitoring Using Conventional Methods, Mining Research Directorate, Ontario.
Kaiser, PK, Henning, J, Cotesta, L & Dasys, A 2002, ‘Innovation in mine planning and design utilizing collaborative immersive virtual reality (CIVR)’, Proceedings of the 104th CIM-AGM, Canadian Institute of Mining, Metallurgy and Petroleum, Westmount.
Leslie, I & Vezina, I 2001, ‘Seismic data analysis in underground mining operations using ESG’s Hyperion Systems’, Proceedings of the 16th Quebec Mining Association Ground Control Colloquium.
Martin, CD 1994, ‘The strength of massive Lac du Bonnet granite around underground openings’, PhD thesis, University of Manitoba, Winnipeg.
Maybee, G, Sampson-Forsythe, A, Cotesta, L, & O'Connor, C 2007, ‘Geomechanical challenges at Xstrata Nickel's Thayer Lindsley Mine’, in Y Potvin, J Hadjigeorgiou & D Stacey (eds), Challenges Deep and High Stress Mining, Australian Centre for Geomechanics, Perth, pp. 233-239.

Numerical modelling
Deep Mining 2014, Sudbury, Canada 395
Ryder, JA 1988 ‘Excess shear stress assessment of geologically hazardous situations’, Journal of the South African Institute of Mining and Metallurgy, vol. 88, pp. 27-39.
Vorauer, A & Cotesta, L 2005, ‘Scientific visualization for enhanced interpretation and communication of heoscientific information’, Proceedings of the Canadian Nuclear Society, Waste Management, Decommissioning and Environmental Restoration for Canada’s Nuclear Activities: Current Practices and Future Needs, Canadian Nuclear Society, Toronto.


