NUMERICAL INVESTIGATION OF LIQUEFACTION MITIGATION USING...
12
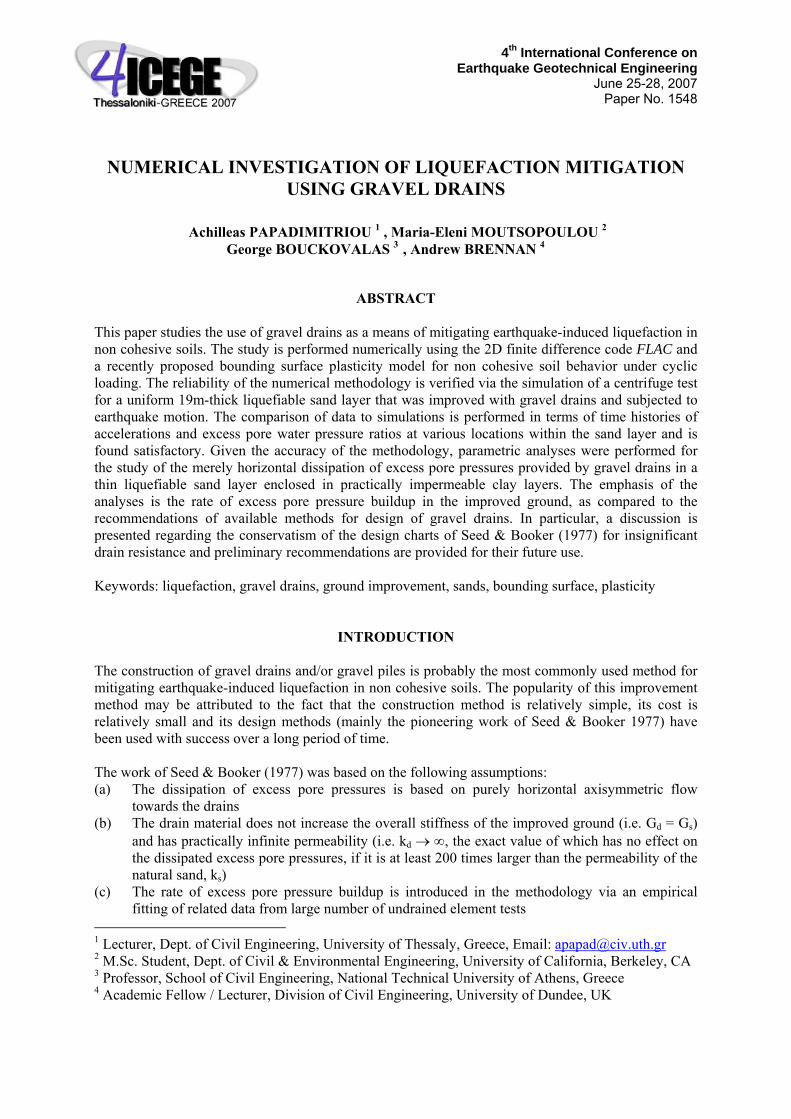
4 th International Conference on Earthquake Geotechnical Engineering June 25-28, 2007 Paper No. 1548 NUMERICAL INVESTIGATION OF LIQUEFACTION MITIGATION USING GRAVEL DRAINS Achilleas PAPADIMITRIOU 1 , Maria-Eleni MOUTSOPOULOU 2 George BOUCKOVALAS 3 , Andrew BRENNAN 4 ABSTRACT This paper studies the use of gravel drains as a means of mitigating earthquake-induced liquefaction in non cohesive soils. The study is performed numerically using the 2D finite difference code FLAC and a recently proposed bounding surface plasticity model for non cohesive soil behavior under cyclic loading. The reliability of the numerical methodology is verified via the simulation of a centrifuge test for a uniform 19m-thick liquefiable sand layer that was improved with gravel drains and subjected to earthquake motion. The comparison of data to simulations is performed in terms of time histories of accelerations and excess pore water pressure ratios at various locations within the sand layer and is found satisfactory. Given the accuracy of the methodology, parametric analyses were performed for the study of the merely horizontal dissipation of excess pore pressures provided by gravel drains in a thin liquefiable sand layer enclosed in practically impermeable clay layers. The emphasis of the analyses is the rate of excess pore pressure buildup in the improved ground, as compared to the recommendations of available methods for design of gravel drains. In particular, a discussion is presented regarding the conservatism of the design charts of Seed & Booker (1977) for insignificant drain resistance and preliminary recommendations are provided for their future use. Keywords: liquefaction, gravel drains, ground improvement, sands, bounding surface, plasticity INTRODUCTION The construction of gravel drains and/or gravel piles is probably the most commonly used method for mitigating earthquake-induced liquefaction in non cohesive soils. The popularity of this improvement method may be attributed to the fact that the construction method is relatively simple, its cost is relatively small and its design methods (mainly the pioneering work of Seed & Booker 1977) have been used with success over a long period of time. The work of Seed & Booker (1977) was based on the following assumptions: (a) The dissipation of excess pore pressures is based on purely horizontal axisymmetric flow towards the drains (b) The drain material does not increase the overall stiffness of the improved ground (i.e. G d = G s ) and has practically infinite permeability (i.e. k d → ∞, the exact value of which has no effect on the dissipated excess pore pressures, if it is at least 200 times larger than the permeability of the natural sand, k s ) (c) The rate of excess pore pressure buildup is introduced in the methodology via an empirical fitting of related data from large number of undrained element tests 1 Lecturer, Dept. of Civil Engineering, University of Thessaly, Greece, Email: [email protected] 2 M.Sc. Student, Dept. of Civil & Environmental Engineering, University of California, Berkeley, CA 3 Professor, School of Civil Engineering, National Technical University of Athens, Greece 4 Academic Fellow / Lecturer, Division of Civil Engineering, University of Dundee, UK
Transcript of NUMERICAL INVESTIGATION OF LIQUEFACTION MITIGATION USING...
4th International Conference on Earthquake Geotechnical Engineering
June 25-28, 2007 Paper No. 1548
NUMERICAL INVESTIGATION OF LIQUEFACTION MITIGATION USING GRAVEL DRAINS
Achilleas PAPADIMITRIOU 1 , Maria-Eleni MOUTSOPOULOU 2 George BOUCKOVALAS 3 , Andrew BRENNAN 4
ABSTRACT This paper studies the use of gravel drains as a means of mitigating earthquake-induced liquefaction in non cohesive soils. The study is performed numerically using the 2D finite difference code FLAC and a recently proposed bounding surface plasticity model for non cohesive soil behavior under cyclic loading. The reliability of the numerical methodology is verified via the simulation of a centrifuge test for a uniform 19m-thick liquefiable sand layer that was improved with gravel drains and subjected to earthquake motion. The comparison of data to simulations is performed in terms of time histories of accelerations and excess pore water pressure ratios at various locations within the sand layer and is found satisfactory. Given the accuracy of the methodology, parametric analyses were performed for the study of the merely horizontal dissipation of excess pore pressures provided by gravel drains in a thin liquefiable sand layer enclosed in practically impermeable clay layers. The emphasis of the analyses is the rate of excess pore pressure buildup in the improved ground, as compared to the recommendations of available methods for design of gravel drains. In particular, a discussion is presented regarding the conservatism of the design charts of Seed & Booker (1977) for insignificant drain resistance and preliminary recommendations are provided for their future use. Keywords: liquefaction, gravel drains, ground improvement, sands, bounding surface, plasticity
INTRODUCTION The construction of gravel drains and/or gravel piles is probably the most commonly used method for mitigating earthquake-induced liquefaction in non cohesive soils. The popularity of this improvement method may be attributed to the fact that the construction method is relatively simple, its cost is relatively small and its design methods (mainly the pioneering work of Seed & Booker 1977) have been used with success over a long period of time. The work of Seed & Booker (1977) was based on the following assumptions: (a) The dissipation of excess pore pressures is based on purely horizontal axisymmetric flow
towards the drains (b) The drain material does not increase the overall stiffness of the improved ground (i.e. Gd = Gs)
and has practically infinite permeability (i.e. kd → ∞, the exact value of which has no effect on the dissipated excess pore pressures, if it is at least 200 times larger than the permeability of the natural sand, ks)
(c) The rate of excess pore pressure buildup is introduced in the methodology via an empirical fitting of related data from large number of undrained element tests
1 Lecturer, Dept. of Civil Engineering, University of Thessaly, Greece, Email: [email protected] 2 M.Sc. Student, Dept. of Civil & Environmental Engineering, University of California, Berkeley, CA 3 Professor, School of Civil Engineering, National Technical University of Athens, Greece 4 Academic Fellow / Lecturer, Division of Civil Engineering, University of Dundee, UK

Since its proposal the Seed and Booker method has been studied by various scientists aiming at the amelioration of its predictions. Of these newer method variants, the one that has attracted the most attention is the work of Onoue (1988), who retained assumption (c), but used the drain permeability kd as a design parameter that creates the so-called drain resistance L. This has the effect of reducing the dissipating capability of drains if the kd value is not significantly larger than that of the natural soil ks. Furthermore, Onoue (1988) studied the problem of combined horizontal (towards the drains) and vertical upward dissipation of excess pore pressures through the sand layer to the ground surface that will occur if the layer in question is thick and not covered by a low-permeability layer (e.g. a clay cap). In parallel, Matsubara et al (1988) and Iai and Koizumi (1986) proposed similar method variants, with relatively small differences on the dissipating capacity of the drains, as a function of the drain resistance L factor. More recently Han & Ye (2001) proposed the use of modified consolidation coefficients cv΄ and cr΄ for the vertical and the horizontal dissipation of excess pore pressures, as a function of the relative compressibility of the drain mv,d and the natural soil mv,s materials, in connection to the acceleration of consolidation of clays. Based on the above, it may be concluded that the design methods of gravel drains have attracted a lot of attention over the last 30 years. In particular, the relative importance of assumptions (a) and (b) has been thoroughly studied over the years, but these methodologies cannot be considered other than method variants of the work of Seed & Booker (1977), since assumption (c) has remained the underlying foundation of most of these works. Furthermore, in practice, the original design charts of Seed & Booker (1977) are still being widely used in practice, since they are considered conservative. This conception is based on the fact that the method ignores the excess pore pressure dissipation due to the vertical upward flow through the sand layer, and also ignores the reduced rate of excess pore pressure build up due to the increased stiffness of the soil in the vicinity of the drains, especially if the construction method of the drains is vibratory (e.g. vibroflotation). Nevertheless, the negative influence of the drain resistance L may prove dangerous in the field, if the improved layer is rather thick (Onoue 1988), or if mixing of the drain material with the natural soil occurs due to a vibratory construction method (Boulanger et al. 1998), even if the selection of the drain material complies with filter criteria. It is well understood that gravel drains have a composite beneficial operation in a sand layer during an earthquake. As such, it has been proven difficult to produce a design methodology that takes into account all aspects of the gravel drain operation. This paper presents the results of employing numerical analysis in the study of gravel drains, which decouples the various effects of their composite operation. For this purpose, a recently proposed bounding surface plasticity model for non cohesive soil behavior under cyclic loading is being used (Andrianopoulos et al. 2006) that has been implemented as a User-Defined-Model (UDM) routine in the 2D finite difference code FLAC (Itasca Inc 1998). The reliability of the numerical methodology is verified via the simulation of a centrifuge test for a uniform 19m-thick liquefiable sand layer that was improved with gravel drains (Brennan and Madabhushi 2006). Following this calibration, this numerical methodology is used for performing parametric analyses that attempt to simulate the assumptions of Seed & Booker (1977) and comment on their design recommendations.
NUMERICAL METHODOLOGY The new constitutive model belongs to the family of bounding surface models with a vanished elastic region and incorporates the framework of Critical State Theory. It is based on a recently proposed model (Papadimitriou et al., 2001; Papadimitriou & Bouckovalas, 2002), which has been developed to simulate the cyclic behavior of non-cohesive soils (sands and silts), under small, medium and large cyclic shear strain amplitude using a single (sand-specific) set of constants, irrespective of the initial stress and density conditions. The adoption of a vanished elastic region differentiates the new model from the original of Papadimitriou & Bouckovalas (2002). This leads to a number of other modifications, such as: (i) the introduction of a new mapping rule and (ii) modification of the existing interpolation rule. However, the basic constitutive equations were preserved. Hence, for a conceptual

understanding of the constitutive model, the reader may refer to the publications for the original model. This new model was incorporated in the code FLAC using its UDM capability. Integration of the constitutive equations is performed with a modified (two-step) Euler scheme. In order to control the global integration error in the computation of stresses, the sub-stepping technique with automatic error control by Sloan et al. (2001) was adopted. Details on the implementation can be found in Andrianopoulos (2006) and Andrianopoulos et al. (2006). The capabilities of the new model have been verified via extensive comparison with laboratory element test results on Nevada sand at relative densities of Dr = 40 & 60% and initial effective stresses between 40 and 160 kPa (Arulmoli et al, 1992). In particular, the laboratory data originate from resonant column tests as well as direct simple shear and triaxial tests. It has been shown that accurate simulations with a single (sand-specific) set of constants has been achieved and many basic aspects of cyclic soil behavior, such as the generation of excess pore pressures towards liquefaction, permanent deformations, shear-induced dilation, softening and the effects of evolving fabric anisotropy are well simulated (Andrianopoulos, 2006).
VALIDATION OF NUMERICAL METHODOLOGY The use of the new numerical methodology for liquefaction-related boundary value problems has been validated on the basis of results from the well-known VELACS experimental project (Arulmoli et al, 1992). In particular, results from Model tests No. 1 and 2 have been used that simulate the one-dimensional (1D) response of a liquefiable soil layer under level and mildly sloping ground surface, respectively (Andrianopoulos et al. 2007). Furthermore, model test No. 12 has been used, which simulates the response of shallow foundations on liquefiable soils (Andrianopoulos et al. 2006). Nevertheless, before using this new methodology for studying the liquefaction mitigation capabilities of gravel drains, it was considered necessary to validate its performance for a pertinent centrifuge experiment. For this purpose, the model test AJB-8a (Brennan and Madabhushi, 2006) was used.
6.3m
9m
14m
19m
16.8m
6675
6266
6788
6670
6669
2976
6679
6783
6673
6803
6794
6793
2259
6685
6797
6677
8076
9889
8895
8915
8932
9882
1926
16.8m
Figure 1. Test arrangement of model test AJB-8a (Brennan and Madabhushi, 2006);
Accelerometers are denoted by quadrilaterals, pore pressure transducers by dots

The test arrangement and the instrumentation for model test AJB-8a is shown in Figure 1. In prototype scale, the experiment refers to an 18.5m deep uniform sand layer and the group of gravel drains reaches down to the bottom of the layer. The group consists of 17 drains of diameter d = 1.2m in a triangular grid of a center to center distance s = 3.0m. The natural sand material was Silica sand (fraction E) at a relative density Dr ≅ 37% (e = 0.864). The drain material consisted of Silica sand (fraction B) that is characterized by particle sizes 5 times larger, on average. The available material properties for both fractions of Silica sand are presented in Table 1. The centrifuge model was built inside a laminar box, which was tested at 50g centrifugal acceleration on the Cambridge 10m diameter beam centrifuge. To match dynamic and seepage timescales, 50cSt viscosity silicone oil was used as pore fluid. The base strong motion lasted 25sec and had a peak acceleration of 0.163g and a predominant frequency of 0.82Hz (see Figure 2). The response of the improved and natural ground was monitored with the use of six (6) accelerometers and sixteen (16) pore pressure transducers.
0 1 2 3 4 5structural period T(s)
0
2
4
6
spec
tral a
ccel
erat
ion
(m/s
2 )
0 10 20 30time (s)
-2
-1
0
1
2
acce
lera
tion
(m/s
2 )
Recorded MotionFiltered Motion
Figure 2. Recorded and filtered base motion during model test AJB-8a
Table 1. Material Properties of Silica sand (Fractions B & E, Brennan 2004) and Toyoura sand
Property Silica sand –
fraction B (drain material)
Silica sand – fraction E
(natural sand) Toyoura sand
D10 (mm) - 0.095 - D50 (mm) - 0.140 0.15 D90 (mm) - 0.150 -
emin - 0.613 0.597 emax - 1.014 0.977
Dr(%) 70.5 37.4% 37.4% e 0.592 0.864 0.835
k (m/s) 7x10⁻³ 10-4 - φcr (o) - 32 31.2
Based on Table 1, the available material properties for both fractions of Silica sand are not sufficient for the calibration of a sophisticated constitutive model, as the one to be used here. Hence, the constants of the constitutive model to be used in the simulation of the response of Silica sand fraction E were borrowed from a pertinent calibration for Toyoura sand. This selection is justified by Table 1, which shows that the grain size distribution characteristics and the friction angle of Silica sand fraction E resemble those of Toyoura sand. As an example of the calibration, Figure 3 presents the model prediction of a liquefaction resistance curve for relative density Dr = 40% and its comparison to

respective data from the literature. The drain material was simulated with the use of a Ramberg-Osgood type non-linear perfectly-hysteretic model, which has also been implemented as a UDM routine in FLAC (Andrianopoulos 2006). The reason for this selection is that the drain material has a non-linear behavior under strong seismic shaking, but does not develop excess pore pressures, thus enabling the dissipation of those developed in the neighboring natural sand. Compared to the natural sand, the adopted calibration for the drain material led to 50% larger initial elastic moduli, and this difference increases during shaking due to the reduction of the effective stresses in the natural sand.
1 10 100number of cycles NL
0
0.1
0.2
0.3Nevada (Dr = 40%)DeAlba et al (1976)Hosono & Yoshimine (2004)MODEL
CS
R =
τc /
σ΄ vo
Figure 3. Comparison of liquefaction resistance curve from model simulation for Dr = 37.4% (e = 0.864) with related curves from the literature
The grid used for the numerical analysis is presented in Figure 4 and is 33.6m wide and 19m high. It consists of 589 elements (‘zones’ in FLAC terminology) and is denser in the area of the improvement. The five rows of cylindrical drains of diameter d = 1.2m are simulated in the grid by five equivalent diaphragm walls of thickness d΄ = 0.6m, that have the same section modulus with the actual rows of cylindrical drains. This equivalence provides for the same seismic ground response between the actual 3D geometry of improved ground and its simulation with 2D plane strain analysis (Papadimitriou et al. 2006). The horizontal acceleration time-history was applied at the bottom of the mesh, after filtering out the high frequency components of the recorded motion (see Figure 2). The lateral boundaries were tied to one-another in order to ensure the same horizontal and vertical displacements of the two boundaries, as imposed by the laminar box device in the centrifuge test. The vertical acceleration during the experiments was minimal and was not taken into account during the numerical simulation. The permeability of the natural sand ks and the drain material kd were given the values measured in the laboratory (see Table 1), since the pore fluid used was silicon oil that had a viscosity 50cSt to represent water in the prototype scale.
Figure 4. Mesh used in the simulation of model test AJB-8a

0 10 20 30t(s)
00.40.81.2
r u PPT 6788
0 10 20 30t(s)
00.40.81.2
r u
DataSIMULATION
PPT 6266
0 10 20 30t(s)
00.40.81.2
r u
PPT 2976
0 10 20 30t(s)
00.40.81.2
r u
PPT 6679
9m
14m
19m
16.8m
6266
6788 2976
6679
0 10 20 30t(s)
00.40.81.2
r u PPT 6685
0 10 20 30t(s)
00.40.81.2
r u
PPT 6673
6673
6685
Figure 5. Comparison of data to simulations for the time history of the excess pore pressure ratio ru = ∆u/σ΄vo developed at various depths and locations of the AJB-8a model test
0 10 20 30t(s)
-2-1012
a(m
/s2 ) ACC 8932
0 10 20 30t(s)
-2-1012
a(m
/s2 ) ACC 9889
0 10 20 30t(s)
-2-1012
a(m
/s2 ) ACC 8076
0 10 20 30t(s)
-2-1012
a(m
/s2 ) ACC 8915
0 10 20 30t(s)
-2-1012
a(m
/s2 )
DataSIMULATION
0 10 20 30t(s)
-2-1012
a(m
/s2 )
ACC 9882
ACC 8895
9m
14m
19m
16.8m
8076
9889
8895 8915
8932
9882
Figure 6. Comparison of data to simulations for the time history of ground accelerations occurring at various depths and locations of the AJB-8a model test

Figure 5 compares the time histories of the excess pore pressure ratio ru = ∆u/σ΄vo from the centrifuge test recordings to their numerically simulated counterparts. This is shown at various depths (-5m, -10m, -19m) in the sand layer, both inside and outside the improved zone. Both recordings and simulations show initial liquefaction (ru = 1.0) in the upper 10m, whereas in deeper locations significant excess pore pressures develop, but not initial liquefaction (PPT 6673). The improvement does not prevent initial liquefaction, it only delays its appearance (at t=7s in PPT2976, versus t=4s in PPT 6788) and enables faster dissipation of excess pore pressures after the end of shaking (not shown in Figure 5). Overall the model simulations are satisfactory, with the possible exception of the somewhat smaller ru values at large depths, and especially within the improved zone. Figure 6 compares the time histories of ground acceleration from the centrifuge test recordings to their numerically simulated counterparts. As above, this is shown at various depths (-5m, -10m, -19m) in the sand layer, both inside and outside the improved zone. The agreement is satisfactory. It is especially noteworthy that both the recordings and the simulations depict a liquefaction-induced deamplification of the acceleration at the ground surface, especially outside the improved zone. In general, the accelerations are more intense within the improved zone, at all depths, and this has been reproduced by the simulation. However, the differences in the intensity of acceleration within and outside the improved zone are not significant, because the group of drains proved unable to prevent initial liquefaction, as depicted by the time histories of ru in Figure 5.
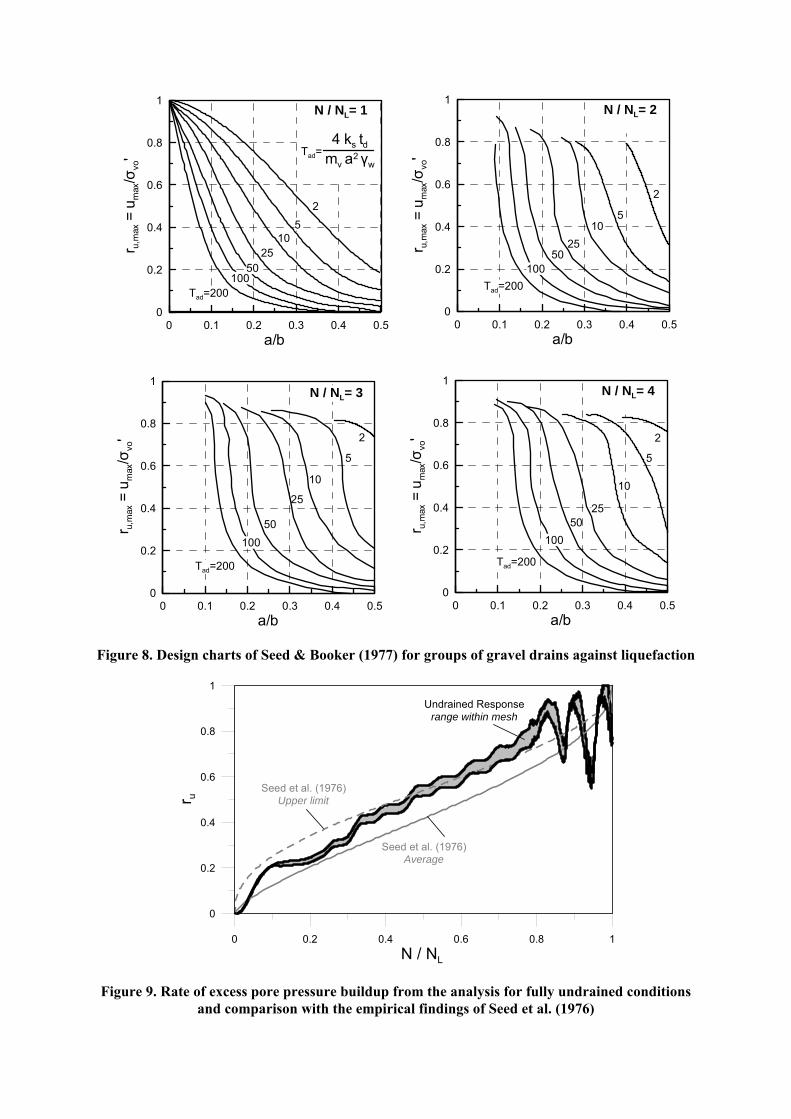
PURELY HORIZONTAL DISSIPATION OF EXCESS PORE PRESSURES Having established the reliability of the new methodology, it is now possible to use it for the study of the composite beneficial operation of gravel drains in a sand layer during an earthquake. In this effort, the first step is to study the most commonly used design methodology, that of Seed & Booker (1977). For this purpose, the basic assumption of the purely horizontal dissipation of excess pore pressures is simulated with the use of the finite difference grids shown in Figure 7. In particular, a 1m thick sand layer is set to be encased between 1m thick clay layers that have permeability 1000 smaller than the sand (this permeability difference prevents any vertical flow through the clay within the time frame of a seismic shaking). Such an encased sand layer would develop excess pore pressures under practically undrained conditions during an earthquake (Figure 7a), and if improved with gravel drains, the dissipation of excess pore pressures would be purely horizontal towards the drains (Figure 7b), and vertical through the drains towards the free surface. If the intensity and the duration of the seismic motion are sufficient, the encased sand layer could reach liquefaction (ru = 1) after NL loading cycles. According to Seed & Booker (1977), after an improvement with gravel drains of diameter 2a at an inter-drain spacing 2b, the same, horizontally drained, sand layer would reach a maximum value of ru = ru,max < 1. As shown in the design charts of Figure 8, this value of ru,max is set to be a function of: − the improvement ratio, a/b, − the number N of loading cycles of the same intensity, with N = NL, 2NL, 3NL and 4NL, and − the dimensionless time factor Tad that introduces the effects of the permeability of the sand ks, its
compressibility mv and the duration of the seismic shaking td The improved ground is simulated by using the same mesh as that for the natural ground, but by implementing different material properties for elements of the drain material (as shown in Figures 7a and 7b). The response of the natural sand is simulated using the new constitutive model with the material constants used for Silica sand fraction E above. The response of the drain material is simulated using the Ramberg-Osgood type model with material constants used for Silica sand fraction B above. The clay layers constitute an impermeable boundary and should not affect the response of the sand in any other manner. Therefore, they are assumed to be a stiff elastic material (with G = 300MPa).

CLAY SANDGRAVEL DRAIN
1m1m1m
65 kPa
1m1m1m
65 kPa1m
1m
Figure 7. Mesh discretization and boundary conditions for the analyses reproducing the Seed & Booker (1977) assumptions
In terms of permeability, the sand is assumed to have a ks = 10-4m/s (as that of Silica sand fraction E), the clay kc = 10-7m/s (ks/kc = 1000), whereas the drain material was assigned a reference value of kd = 2x10⁻²m/s (kd/ks = 200). The grid was chosen to be low-rise (3m high versus 31m wide) in order to eliminate amplification of the horizontal motion and potential rocking (i.e. generation of vertical vibration for a purely horizontal base motion). The lateral boundaries were tied to one-another in order to ensure the same horizontal and vertical displacements of the two boundaries, as imposed by a laminar box device in a centrifuge test. This type of lateral boundary conditions have proven successful in simulating the actual vibration of natural deposits and this is why they were chosen for these analyses. To ensure a numerically stable response of the very surficial sand layer (1 – 2m deep) during shaking, an additional surcharge of 65kPa was applied at the ground surface in order to increase the initial effective stresses. Finally, to ensure continuous saturation of the soil deposit during shaking, the ground water table was set to be 1m higher than the ground surface. The seismic motion was applied at the base of the mesh and it was assumed to be a harmonic sinusoidal motion with a peak acceleration of 4m/s2 at a period T=0.3s. The sinusoidal motion was chosen to follow the methodology of Seed & Booker (1977) (following Seed et al., 1976), in which the rate of excess pore pressure buildup is based on element laboratory tests, which apply successive cycles with a constant cyclic stress ratio CSR under undrained conditions. As such, the analysis for fully undrained conditions (with the mesh of Figure 7a) provided a practically uniform response throughout the sand layer, whose time history of excess pore pressure generation is presented in Figure 9. Observe in this figure that time in Figure 9 is presented in terms of N/NL, i.e. in terms of the number of harmonic cycles to reach liquefaction (hence ru = 1 occurs at N/NL = 1). This presentation of results shows that the constitutive model simulations for fully undrained conditions are in accordance with the empirical findings of Seed et al (1976). In the sequel, the analysis with the mesh of Figure 7b was performed. The thickness d΄ of the equivalent gravel drain diaphragm walls in Figure 7b is equal to 0.33m and they are at a center-to-center distance of 2.7m. This 2D improvement geometry corresponds to a 3D group of gravel drains of diameter d = 0.8m set at a spacing s = 2.7m, according to Papadimitriou et al. (2006). Hence, the improvement geometry of Figure 7b corresponds roughly to an improvement ratio a/b = 0.3. In addition, two extra analyses were performed for less and more dense grids of gravel drains, i.e. with a/b = 0.2 and 0.5, respectively.
0 0.1 0.2 0.3 0.4 0.5a/b
0
0.2
0.4
0.6
0.8
1
r u,m
ax =
um
ax/σ
νο'
25
1025
50100
Tad=200
N / NL= 1
0 0.1 0.2 0.3 0.4 0.5a/b
0
0.2
0.4
0.6
0.8
1
r u,m
ax =
um
ax/σ
νο' 2
5
10
25
50100
Tad=200
0 0.1 0.2 0.3 0.4 0.5a/b
0
0.2
0.4
0.6
0.8
1
r u,m
ax =
um
ax/σ
νο'
2
510
2550
100Tad=200
0 0.1 0.2 0.3 0.4 0.5a/b
0
0.2
0.4
0.6
0.8
1
r u,m
ax =
um
ax/σ
νο' 2
5
10
2550
100
Tad=200
N / NL= 2
N / NL= 4N / NL= 3
Tad= 4 ks td
mv a2 γw
Figure 8. Design charts of Seed & Booker (1977) for groups of gravel drains against liquefaction
0 0.2 0.4 0.6 0.8 1N / NL
0
0.2
0.4
0.6
0.8
1
r u
Seed et al. (1976)Upper limit
Seed et al. (1976)Average
Undrained Responserange within mesh
Figure 9. Rate of excess pore pressure buildup from the analysis for fully undrained conditions and comparison with the empirical findings of Seed et al. (1976)

0 0.2 0.4 0.6 0.8 1 1.2N / NL
0
0.2
0.4
0.6
0.8
1
r u
a/b = 0.3
a/b = 0.2
a/b = 0.5
no drainage(a/b = 0)
initialliquefaction
Figure 10. Rate of excess pore pressure buildup from analyses for various improvement ratios a/b and comparison with the analysis for fully undrained conditions (a/b=0)
The results in terms of the time-history of the excess pore pressure ratio ru for all improvement ratios (a/b = 0, 0.2, 0.3 and 0.5) are presented in Figure 10, where time is again presented in terms of N/NL (as in Figure 9). As observed, the curve for a/b = 0 (undrained conditions) holds as the maximum possible rate of excess pore pressure buildup. As the improvement ratio a/b increases, the rate of excess pore pressure generation decreases due to drainage. More importantly for this study, the maximum value of ru = ru,max decreases as the improvement ratio a/b increases, and this is qualitative accordance with the design charts of Seed & Booker (1977) shown in Figure 8. A detailed study of the results of Figure 10 shows that the maximum value of ru in all analyses is attained sometime within the 0 < N/NL ≤ 1 time window, after which the ru slowly reduces, on average, with time, even though the seismic shaking continues. This qualitative result has been shown to hold in all performed analyses, the presentation of which is beyond the scope of this paper. What is of importance here is to compare the foregoing qualitative result to what the design charts of Seed & Booker (1977) predict for the value of ru,max. For example, for an improvement geometry of a/b = 0.3, if Tad = 2 for N/NL = 1, the maximum value of ru = ru,max = 0.55. If the same shaking continued for N/NL = 2, then its corresponding value of Tad would double, since the duration of the shaking td would double. For this Tad = 4 and N/NL = 2, ru,max = 0.81. Similarly, for N/NL = 3, then Tad = 6, leading to ru,max = 0.84. Finally, for N/NL = 4, then Tad = 8, leading to ru,max = 0.83. Summarizing this type of chart values for Tad(N/NL=1) = 2, 5 and 10 in Figure 11, it is concluded that according to the Seed & Booker (1977) charts, the ru,max values initially increase for N/NL = 1 to 3 and show a decrease for N/NL = 4. This type of response is not in accordance with the typical result of the numerical analyses, that is shown with a dashed line in Figure 11b, and implies that the maximum value of ru (ru,max) is being reached for N/NL ≤ 1. The observed differences are explained as follows: − For design purposes, the important factor is the maximum ru value reached during shaking. Hence,
Seed & Booker (1977) defined ru,max as the ever-current maximum value of ru from the beginning of shaking. As such, an ru,max value can either increase or remain constant with time, but cannot decrease. Hence, the decrease in the ru,max value for N/NL=4 is physically improbable.
− The Seed & Booker (1977) charts imply an ru value increasing with time, at least up until N/NL = 3, whereas the numerical analyses show an ru value reaching its peak sometime before N/NL = 1. This difference can be attributed to assumption (c) of the Seed & Booker (1977) work, i.e. the fact that

the drains are set to dissipate an ru rate of buildup from the fully undrained tests, a rate that was never reached in the improved ground due to the drainage that initiates from the beginning of the shaking.
1 2 3 4N / NL
0
0.2
0.4
0.6
0.8
1
r u,m
ax
Tad(N/NL=1)2510
1 2 3 4N / NL
0
1
2
3
r u,m
ax /
r u,m
ax(N
/NL=
1)
Figure 11. The (indirect) effect of seismic motion duration (N/NL) on the peak excess pore
pressure ratio ru,max for a/b=0.3 and various initial values of Tad according to the Seed & Booker (1977) charts and qualitative comparison with numerical analyses (dashed line in Fig.11b)
CONCLUSIONS This paper proposes and validates a numerical methodology for evaluating the effectiveness of a group of gravel drains for mitigating earthquake-induced liquefaction. In an in-depth study of the available design methods, the first step is the evaluation of the cornerstone of the relative literature, i.e. the design charts of Seed & Booker (1977). By performing parametric numerical analyses in an effort to duplicate the assumptions of their work, the following conclusions were drawn. − The use of the design chart for N/NL = 4 leads, in general, to smaller values of ru,max than those
resulting from the N/NL = 3 chart. A reduction of ru,max with time (or N/NL) is physically impossible and therefore the use of the chart for N/NL=4 should be avoided.
− An inherent conservatism observed in the Seed & Booker (1977) charts for thin layers with insignificant drain resistance can be attributed to the fact that the drains are set to dissipate a rate of ru buildup from fully undrained tests, whereas in practice this rate is never reached in the improved ground due to the drainage that initiates from the very beginning of the shaking. To remedy this, preliminary results imply that the use of the chart for N/NL = 1 practically suffices for all cases.
Further verification of the foregoing general conclusions is currently underway in order to fully quantify the depicted conservatism of the Seed & Booker (1977) methodology, a trait that applies only to cases with an insignificant drain resistance L, i.e. cases where the drain permeability kd is much larger than that of the natural sand ks and the thickness of the sand layer is small. In all other cases, the Seed & Booker (1977) charts become potentially unconservative and this should be taken into account in design.
AKNOWLEDGEMENTS The work presented herein has been financially supported by the General Secretariat for Research and Technology (Γ.Γ.Ε.Τ.) of Greece, through research project ΕΠΑΝ – ∆Π23 (“X-SOILS”). This contribution is gratefully acknowledged.

REFERENCES
Andrianopoulos, K.I., “Numerical modeling of static and dynamic behavior of elastoplastic soils”,
Doctorate Thesis, Department of Geotechnical Engineering, School of Civil Engineering, National Technical University of Athens (in Greek), 2006
Andrianopoulos, K.I., Papadimitriou, A.G., Bouckovalas, G.D., “Implementation of a bounding surface model for seismic response of sands”, Proceedings, 4th International FLAC Symposium on Numerical Modeling in Geomechanics, May, 2006
Andrianopoulos, K.I., Papadimitriou, A.G., Bouckovalas, G.D., “Use of a new bounding surface model for the analysis of earthquake-induced liquefaction phenomena”, Proceedings, 4th International Conference on Earthquake Geotechnical Engineering, June, 2007
Arulmoli, K., Muraleetharan, K.K., Hossain, M.M. and Fruth, L.S., “VELACS: verification of liquefaction analyses by centrifuge studies; Laboratory Testing Program – Soil Data Report”, Research Report, The Earth Technology Corporation, 1992
Boulanger R.W., Idriss I.M., Stewart D.P., Hashash Y. and Schmidt B., “Drainage capacity of stone columns or gravel drains for mitigating liquefaction”, Geotechnical Special Publication No.75, Proceedings, Specialty Conference on Geotechnical Earthquake Engineering and Soil Dynamics III, Seattle Washington, ASCE, Vol.1, 678-690, 1998
Brennan, A.J., “Liquefaction remediation by vertical drain groups”, PhD Thesis, University of Cambridge UK, 2004
Brennan, A.J. and Madabhushi, S.P.G., “Liquefaction remediation by vertical drains with varying penetration depths”, Soil Dynamics and Earthquake Engineering, 26(5):469-475, 2006
DeAlba, P., Seed, H.B. and Chan, C.K., “Sand liquefaction in large-scale simple shear tests”, Journal of the Geotechnical Engineering Division, ASCE, 102(GT9): 909-927, 1976
Han J. and Ye S.-L., “Simplified method for consolidation rate of stone columns reinforced foundations”, Journal of Geotechnical and Geoenvironmental Engineering, ASCE, 127(7): 597-603, 2001
Hosono, Y. and Yoshimine, M., “Liquefaction of sand in simple shear condition”, Proceedings, International Conference on Cyclic Behaviour of Soils and Liquefaction Phenomena, 129-136, Bochum, Germany, March 31 – April 2, 2004
Iai, S. and Koizumi, K., “Estimation of earthquake induced excess pore pressure for gravel drains”, Proceedings, 7th Japan Earthquake Symposium, 679-684, 1986
Itasca Consulting Group, Inc., “FLAC – Fast Lagrangian Analysis of Continua”, Version 3.4, User’s Manual, Minneapolis: Itasca, 1998
Matsubara, K., Mihara, M. and Tsujita M., “Analysis of gravel drain against liquefaction and its application to design”, Proceedings, 9th World Conference on Earthquake Engineering, Vol. III 249-254, 1988
Papadimitriou, A.G., Bouckovalas, G.D. and Dafalias, Y.F., “Plasticity model for sand under small and large cyclic strains”, Journal of Geotechnical and Geoenvironmental Engineering, ASCE, 127, no. 11, 973-983, 2001
Papadimitriou, A.G. and Bouckovalas, G.D., “Plasticity model for sand under small and large cyclic strains: a multiaxial formulation”, Soil Dynamics and Earthquake Engineering, 22, 191-204, 2002
Papadimitriou, A.G., Vytiniotis, A.C. and Bouckovalas, G.D., “Equivalence between 2D and 3D numerical analyses of the seismic response of improved sites”, Proceedings, 8th US National Conference on Earthquake Engineering, paper 2020, San Francisco, CA, April 18 – 22, 2006
Seed, H.B., and Booker, J.R., “Stabilization of potentially liquefiable sand deposits using gravel drains”, Journal of the Geotechnical Engineering Division, ASCE, 103(GT7): 757-768, 1977
Seed, H.B., Martin, P.P. and Lysmer, J. “Pore water pressure changes during soil liquefaction”, Journal of the Geotechnical Engineering Division, ASCE, 102(GT4): 323-346, 1976
Sloan, S.W., Abbo A. J. and Sheng D., “Refined explicit integration of elastoplastic models with automatic error control”, Engineering Computations, 18 (1/2), 121-154, 2001
Onoue A., “Diagrams considering well resistance for designing spacing ratio of gravel drains”, Soils and Foundations, 28(3): 160-168, 1988