NUMERICAL ESTIMATION OF FATIGUE LIFE …nehrukrish.weebly.com/uploads/5/0/1/3/50130213/rr1.pdf ·...
39
NUMERICAL ESTIMATION OF FATIGUE LIFE ANALYSIS OF GAS TURBINE BLADE A PROJECT REPORT-PHASE-I (PAE302) Submitted by NEHRU.K (1328030) in partial fulfillment for the award of the degree of MASTER OF TECHNOLOGY in AERONAUTICAL ENGINEERING DEPARTMENT OF AERONAUTICAL ENGINEERING SCHOOL OF AERONAUTICAL SCIENCES HINDUSTAN INSTITUTE OF TECHNOLOGY AND SCIENCE PADUR, CHENNAI - 603 103 NOV 2014
Transcript of NUMERICAL ESTIMATION OF FATIGUE LIFE …nehrukrish.weebly.com/uploads/5/0/1/3/50130213/rr1.pdf ·...
NUMERICAL ESTIMATION OF FATIGUE LIFE
ANALYSIS OF GAS TURBINE BLADE
A PROJECT REPORT-PHASE-I (PAE302)
Submitted by
NEHRU.K
(1328030)
in partial fulfillment for the award of the degree
of
MASTER OF TECHNOLOGY in
AERONAUTICAL ENGINEERING
DEPARTMENT OF AERONAUTICAL ENGINEERING
SCHOOL OF AERONAUTICAL SCIENCES
HINDUSTAN INSTITUTE OF TECHNOLOGY AND SCIENCE
PADUR, CHENNAI - 603 103
NOV 2014
HINDUSTAN UNIVERSITY: PADUR, CHENNAI - 603 103
BONAFIDE CERTIFICATE
Certified that this project report titled “NUMERICAL ESTIMATION OF
FATIGUE LIFE ANALYSIS OF GAS TURBINE BLADE” is the bonafide
work of “NEHRU.K (1328030)” who carried out the project work under my
supervision. Certified further that to the best of my knowledge the work reported
here does not form part of any other project / research work on the basis of which
a degree or award was conferred on an earlier occasion on this or any other
candidate.
HEAD OF THE DEPARTMENT SUPERVISOR
Prof. Dr. DHILIP A SHAH Prof. Dr R.ASOKAN
Department of Aeronautical Department of Aeronautical
Engineering Engineering
Hindustan Institute of Hindustan Institute of
Technology
Technology and Science, Padur and Science, Padur
The Project Phase I Viva-Voce Examination is held on _______________
INTERNAL EXAMINER EXTERNAL EXAMINER

ACKNOWLEDGEMENT
It’s a matter of pride and privilege for me to express my deep gratitude to the
management of Hindustan Institute of Technology and Science for providing me
the necessary facilities and support.
I wish to express my heartfelt gratitude to Dr. Dilip A Shah, Head of the Department
of Aeronautical Engineering for much of his valuable support encouragement in
carrying out this work.
I would like to thank my internal guide Prof. Dr. R.Asokan, for continually guiding
and actively participating in my project, giving valuable suggestions to complete the
project work.
I would like to thank all the technical and teaching staff of the Aeronautical
Engineering Department, who extended directly or indirectly all support.
Last, but not the least, I am deeply indebted to my parents and friends who have been
the greatest support while I worked day and night for the project to make it a success.

LIST OF ABBREVIATIONS
LCF =Low Cycle Fatigue
HCF= High Cycle Fatigue
σe =is fatigue strength for n cycles under zero σm
σa = fatigue strength for n cycles under σm
σm = mean stress
σu = ultimate tensile strength
σy = yield strength

LIST OF FIGURES
S.NO
CONTENT
PAGE NO.
1.
2.
3.
4.
5.
6.
7.
8.
9.
10.
11.
12.
13.
14.
15.
1.1 Gas Turbine
1.2 Turbine Blade and dovetail
1.3 Failure Blade
1.4 S-N Curve
1.5 Mean Stress Theories
1.6 Campbell Diagram
1.7 Goodman Diagram
3.1 Flow Chart of HCF-LCF Assessment
5.1 Catia Model of Blade With Dove Tale
5.2 Blade View
5.3 Line Diagram of Blade
5.4 Drafting of The Blade
5.5 Structural Mesh in Blade Profile
5.6 Mask View of The Blade
5.7 Cut Section of The Blade Meshed Element
2
3
6
8
13
15
16
20
24
25
25
26
27
27
28
ABSTRACT
This paper summarizes the design and analysis of Gas turbine blade, CATIA is used
for design of solid model and HYPERMESH software for analysis for F.E. model generated,
by applying boundary condition, this paper also includes specific post processing and life
assessment of blade. How the program makes effective use of the HYPERMESH pre-processor
to mesh complex turbine blade geometries and apply boundary conditions. Here under we
presented how Designing of a turbine blade is done in CATIA with the help of co-ordinate
generated on GDS-point spline loft from Excel. And to demonstrate the pre-processing
capabilities, static and dynamic stress analyses results, generation of Campbell and Interference
diagrams and life assessment. The principal aim of this paper is to get the natural frequencies
and mode shape of the turbine blade.
TABLE OF CONTENTS
CHAPTER
NO.
TITLE
PAGE NO.
List of Abbreviations
List of Figures
Abstract
iv
v
vi
1 INTRODUCTION
1.1 Gas Turbine
1.2 Turbine Blade Failure
1.3 Types Of Fatigue Loads
1.4 Current Approach
1.5 Failure Analysis of Turbine Blades
1.6 S-N curves
1.7 Fatigue Stress Concentration
1.8 Fatigue Stress Life and Strain Life
1.9 Design Evaluation Tools
1.9a. Campbell Diagram
1.9b. Goodman Diagram
1
1
2
4
5
9
12
12
2 LITERATURE SURVEY
2.1 Introduction
2.2 Summary
13
13
3
METHODOLOGY
3.1 Introduction
3.2 Limitations
3.3 Summary
16
16
17
4 SOFT WARE –AN OVERVIEW
4.1 Introduction
4.1.1 Catia
4.1.2 Hypermesh
4.2 Summary
18
18
19
20
5 MODELLING
5.1 Introduction
5.2 Design
5.2.1 Design view
5.2.2 Design Coordinate
5.3 Meshing
5.3.1 Meshing view
21
21
22
23
24
26
6
REFERENCES
27
CHAPTER 1. INTRODUCTION
1.1Gas Turbine
Gas turbine engine or simply a gas turbine is an internal combustion engine, using gases
such as air as the working fluid. Thermodynamic aspect of the operation of the gas turbine is
ideally modelled by the Brayton cycle. Gas turbine engine, unlike the steam turbine, consists
of several key components; those are the compressor, combustion chamber, and turbine, which
are assembled along a rotating shaft, to perform different tasks of an internal combustion
engine. Gas intake from the inlet is first compressed using an axial compressor; which performs
the exact opposite of a simple turbine. The pressurized gas is then directed through a diffuser
(a diverging nozzle) stage, in which the gas loses its velocity, but increases the temperature and
the pressure further.
In the next stage, gas enters the combustion chamber where a fuel is mixed with the gas
and ignited. As a result of the combustion, the temperature and pressure of the gas rise to an
incredibly high level. This gas then to the shaft. An average size gas turbine produces shaft
rotation rates as high as 10,000 RPM, while smaller turbines may produce 5 times as much.
Gas turbines can be used to produce torque (by the rotating shaft), thrust (by high speed gas
exhaust), or both in combination. In the first case, as in the steam turbine, the mechanical work
delivered by the shaft is merely a transformation of enthalpy (pressure) of the high temperature
and pressure gas. Part of the shaft work is used to drive the compressor through an internal
mechanism. This form of the gas turbine is used mainly for electric power generation and as
power plants for vehicles such as tanks and even cars. The US M1 Abrams tank uses a gas
turbine engine as the power plant.
In the second case, the high pressure gas is directed through a converging nozzle to
increase velocity, and the thrust is generated by the exhaust gas. This type of gas turbine is
often called Jet engine or turbojet engine, which powers the military fighter aircraft. The
turbofan is an advanced variant of above, and the combination of both thrust and work
generation is used in turboprop engines, where shaft work is used to drive a propeller. There
exist many variants of the gas turbines designed for specific tasks. They are preferred over
other engines (mainly reciprocating engines) due to their high power to weight ratio, less
vibration, high operation speeds, and reliability. The waste heat is dissipated almost entirely as
the exhaust. In electrical power generation, this waste thermal energy is used to boil water to
run a steam turbine. The process is known as combined cycle power generation.
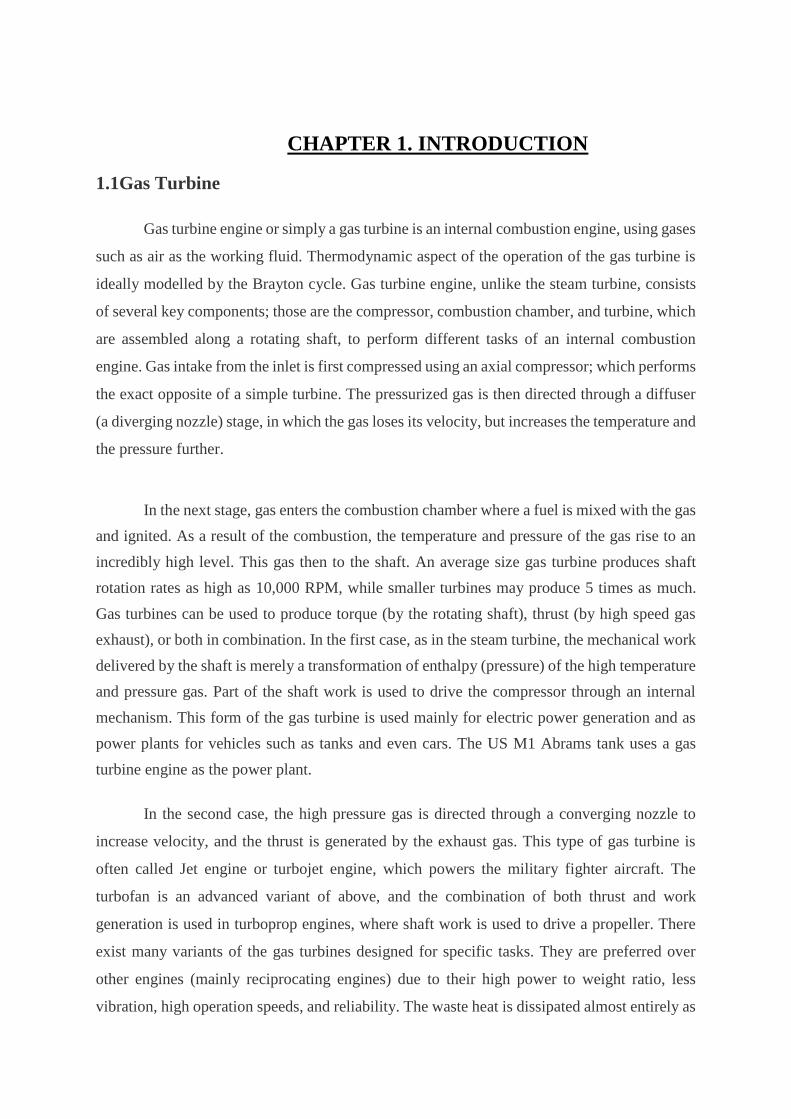
Fig. 1.1 Gas Turbine
The major function of the turbine is to extract energy from the hot gas flow to drive the
compressor and the accessory gearbox. Gas turbine blades work mostly at high temperature
gradients and are subjected to high rotational velocity. High speed results in large centrifugal
forces in blade and simultaneous high temperature reduces disc material strength. The service
life of critical aerospace components is governed by the modes of degradation and failure such
as: fatigue, fracture, yielding, creep, corrosion, erosion, wear, etc. In that fatigue is the main
cause for turbine blade failure. Metals when subjected to repeated cyclic load exhibit damage
by fatigue. The magnitude of stress in each cycle is not sufficient to cause failure with a single
cycle. Large number of cycles is therefore needed for failure by fatigue.
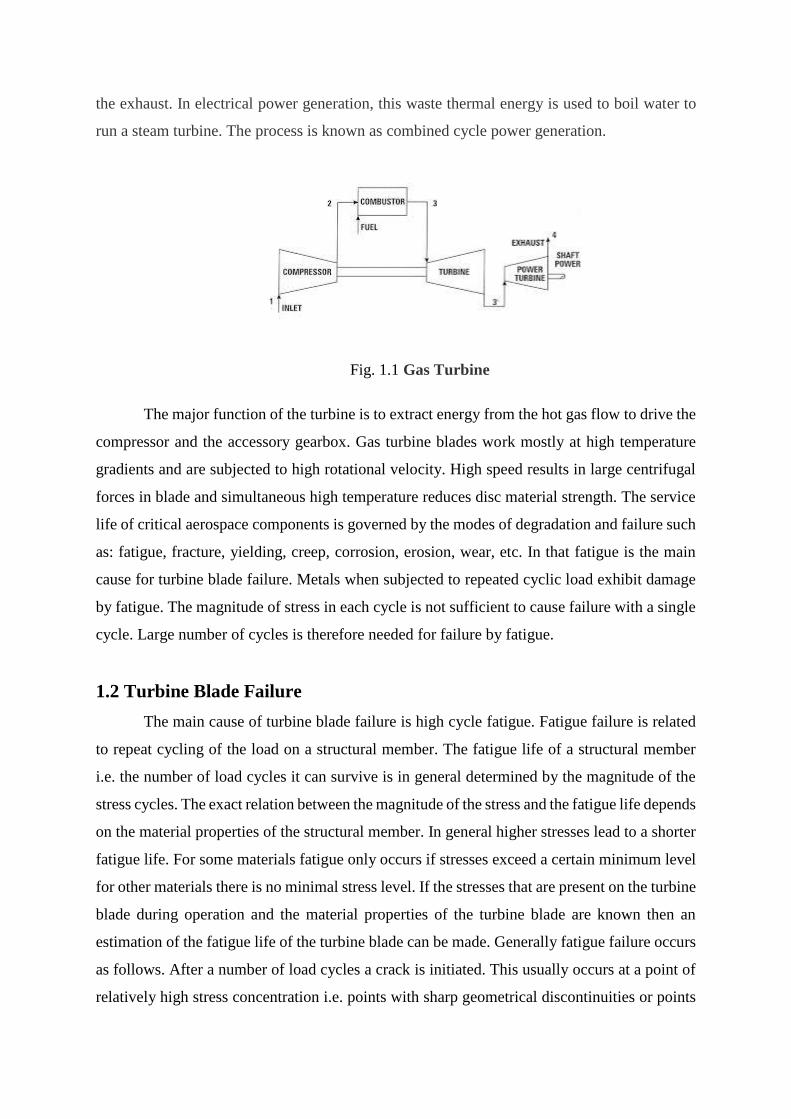
1.2 Turbine Blade Failure
The main cause of turbine blade failure is high cycle fatigue. Fatigue failure is related
to repeat cycling of the load on a structural member. The fatigue life of a structural member
i.e. the number of load cycles it can survive is in general determined by the magnitude of the
stress cycles. The exact relation between the magnitude of the stress and the fatigue life depends
on the material properties of the structural member. In general higher stresses lead to a shorter
fatigue life. For some materials fatigue only occurs if stresses exceed a certain minimum level
for other materials there is no minimal stress level. If the stresses that are present on the turbine
blade during operation and the material properties of the turbine blade are known then an
estimation of the fatigue life of the turbine blade can be made. Generally fatigue failure occurs
as follows. After a number of load cycles a crack is initiated. This usually occurs at a point of
relatively high stress concentration i.e. points with sharp geometrical discontinuities or points
with relatively rough or soft surfaces. Once the crack is initiated it advances incrementally
through the material with each stress cycle. In general this advance is very slow up to a certain
point where it accelerates. The final failure occurs very rapidly. High cycle fatigue corresponds
to failure after a relatively large number of load cycles. High cycle fatigue occurs at stress
levels well below the yield strength of the material where deformation is elastic. The failure of
a structural member is not caused by excessive loading but by the repeated cycling of the load.
In principle there are two ways in which the failure of turbine blades due to fatigue problems
can be eliminated. These are a correct structural design and the prevention of cyclic loading.
The correct design of a structural member can usually eliminate or dramatically reduce fatigue
problems. For a turbine blade this is not always possible. The design of a blade is usually
constrained by aerodynamic properties, weight, rotor length, etc. which can make the
elimination of fatigue problems through design modifications very difficult if not impossible.
The prevention of cyclic loading in gas turbines is virtually impossible in practice. The complex
interior of the gas turbine makes the elimination of excitations difficult. There are numerous
excitations that (can) occur within a gas turbine. These range from kee vibrations like
intermittent stalls, surges and liquid slugs to forced vibrations like unbalance, vane passing,
rotor stator rubbing and cavitation. Self-excited vibrations l i e blade flutter and shaft hysteresis
generally do not occur in well-designed turbines. The frequency of free vibrations can in
general not be easily predicted as these mainly depend on the characteristics of a specific
turbine.
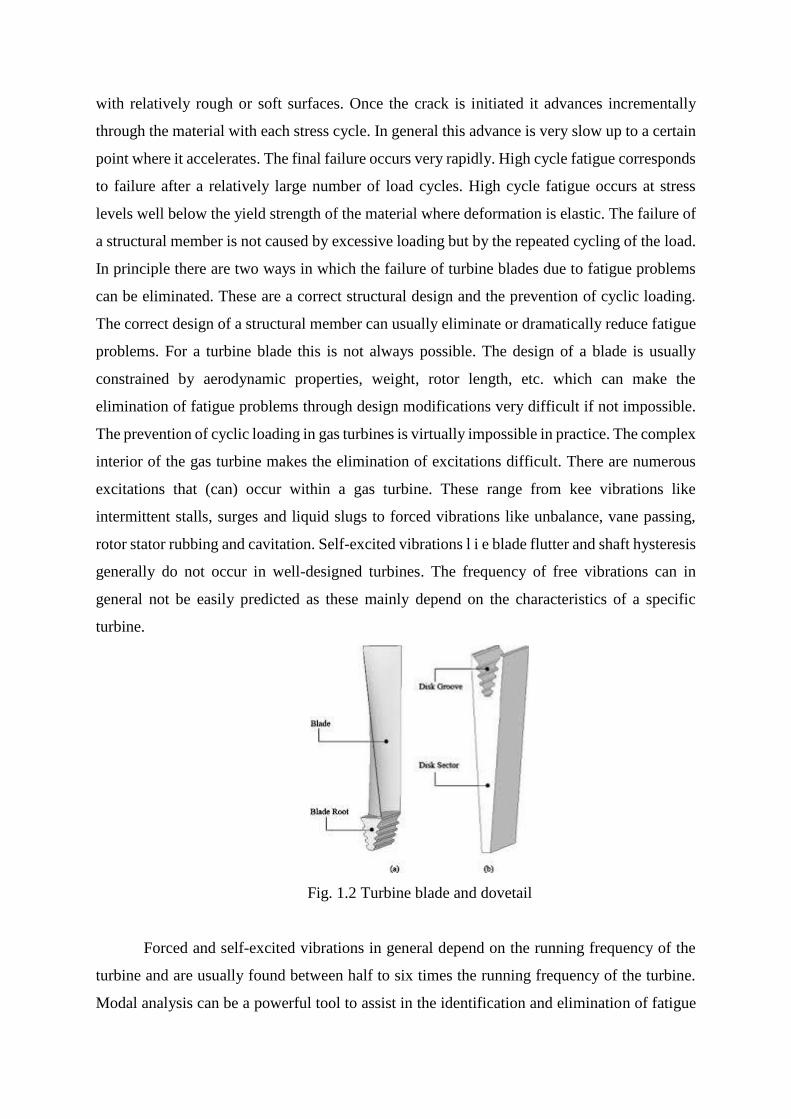
Fig. 1.2 Turbine blade and dovetail
Forced and self-excited vibrations in general depend on the running frequency of the
turbine and are usually found between half to six times the running frequency of the turbine.
Modal analysis can be a powerful tool to assist in the identification and elimination of fatigue
problems. The most obvious use of modal analysis is in determining the natural frequencies of
the turbine blades. Knowledge of these frequencies can be very useful in avoiding excessive
excitations and thereby reducing the risk of fatigue failure. A less obvious application of modal
analysis is in the validation of computer generated models of the turbine blades. These models
can be very useful to investigate turbine and turbine blade properties under running conditions.
Finite element models can be used to predict the influence of design changes on the stresses
and strains acting on the turbine blade under running conditions.
1.3 Types of Fatigue Loads
A. Low Cycle Fatigue
B. High Cycle Fatigue
Fatigue can be classified in to low cycle fatigue and high cycle fatigue. The main cause
of turbine blade failure is high cycle fatigue. Fatigue failure is related to Repeated cycling of
the load on a structural member. The fatigue life of a structural member i.e. the number of load
cycles it can survive is in general determined by the magnitude of the stress cycles. The exact
relation between the magnitudes of the stress and the fatigue life depends on the material
properties of the structural member. In general higher stresses lead to a shorter fatigue life. For
some materials fatigue only occurs if stresses exceed a certain minimum level for other
materials there is no minimal stress level. If the stresses that are present on the turbine blade
during operation and the material properties of the turbine blade are known then an estimation
of the fatigue life of the turbine blade can be made. In Gas turbines, blades are usually the most
critical engine components, which must endure substantial mechanical and thermal loading.
Thus now a day we are using the single crystal nickel-base super alloy as the blade material.
Fatigue life is enhanced by a low Young’s modulus, this since the stresses will be lower for a
crystal orientation with low stiffness compared to a direction with a higher stiffness when a
constant strain is considered. A problem arises in the turbine section it will significantly affect
the whole engine function and, of course, safety of the aircraft. Excessive rotational speed of
turbine is sometimes permissible for aircraft in the case of heavy operational conditions. The
joint between the turbine blade and the disc usually represents the most critical area from the
point of view of the static and fatigue approaches.
Super alloys constitute a large fraction of the materials of construction in turbine
engines because of their unique combination of physical and mechanical properties. In aircraft
engines, it is typical to consider density-normalized properties; thus alloy densities, which are
typically in the range of 7.7–9.0 g/cm3, are of specific interest. Optimization of the relevant set
of mechanical properties is of paramount importance and is dependent on a high level of control
and understanding of the processes of manufacturing, because mechanical properties are a
strong function of microstructure. Mechanical properties of primary interest include tensile
properties, creep, fatigue, and cyclic crack growth. Depending on the details of component
design, any one of these four properties may be life limiting. The super alloys are having
relatively high tensile and ultimate stresses. The loads associated with these regions are mainly
the centrifugal forces and thermal stresses. Fatigue lives at critical points in the blade are
computed using finite element stress results and the failure criterion developed.
1.4 Current Approach
The current approach used at Sulzer Elbar B.V. to identify turbine blade vibration
characteristics is directed at the refurbishment of old turbine blades. In the current approach
the natural frequencies of a turbine blade are not measured. Instead the turbine blade is excited
using an unknown pulse signal. The frequency of the first dominant peak in the output spectrum
of the turbine blade is measured. This measurement is performed both before and after the
repair process. If the frequency of the dominant peak in the output spectrum has changed during
the repair then either material is removed from the blade or added to the blade to adjust this
frequency so that it coincides with the dominant frequency before repair. The idea behind the
current approach is as follows. Based on practical experience it is assumed that the first natural
frequency of the turbine blade is the only natural frequency of interest. This frequency is
assumed to be solely responsible for all vibration problems. The turbine blade that is to be
refurbished has generally not failed. This means that the first natural frequency of the turbine
blade must have been chosen correctly. If the location of the dominant resonance peaks in the
output spectrum is identical both before and after repair then the repair process is assumed to
not have changed this natural frequency. Consequently the characteristics of the turbine blade
are assumed to be adequate to eliminate the chance of failure. Although practice has shown
that the current approach is adequate for the refurbishment of turbine blades it cannot be applied
to evaluate new turbine blade designs or design modifications.
The lack of reference material makes it impossible to evaluate the adequacy of the
turbine blade design based on the output spectrum. Another problem is that the current
approach does not provide detailed information on the vibration characteristics of a turbine
blade. For proven turbine blade designs this may not be a problem as practice has already
shown that the blade design is adequate to prevent vibration problems. For new or modified
turbine blade designs the current approach will not work. In order for a new or modified design
to be worthwhile the turbine blade design will have to be pushed to its limits. This can only be
safely done if extensive knowledge about the vibrational behavior of the turbine blade is
available the current approach simply does not provide the needed information. In order to
ensure that failure due to vibrational problems will not occur intimate knowledge of the stress
and strain distributions across the turbine blade under operational conditions are needed.
Currently only limited measurements under operational conditions are possible. An alternative
to obtaining the required data from measurements is the use of finite element modelling. Finite
element models can be used to accurately predict the stress and strain distributions across the
turbine blade. An important condition.
1.5 Failure Analysis of Turbine Blades
Aircraft engine components are subjected to variable amplitude load conditions usually
they tend to experience fatigue damage. A reliable lifetime prediction is particularly important
in the design, safety assessments and optimization of engineering materials and structures.
Many fatigue damage accumulation theories have been put forward to predict the fatigue lives
of structure components, such as linear damage rule. The natural tendency in the
implementation of a “damage tolerant” approach to fatigue would be to relate remaining life
based on predictions of crack propagation rate to flaw size. Whereas LCF involves early crack
initiation and a long propagation life as a fraction of total life, pure HCF damage is rarely
observed in service or even in the laboratory. It is therefore impractical to apply the damage
tolerant approach as used for LCF to pure HCF.
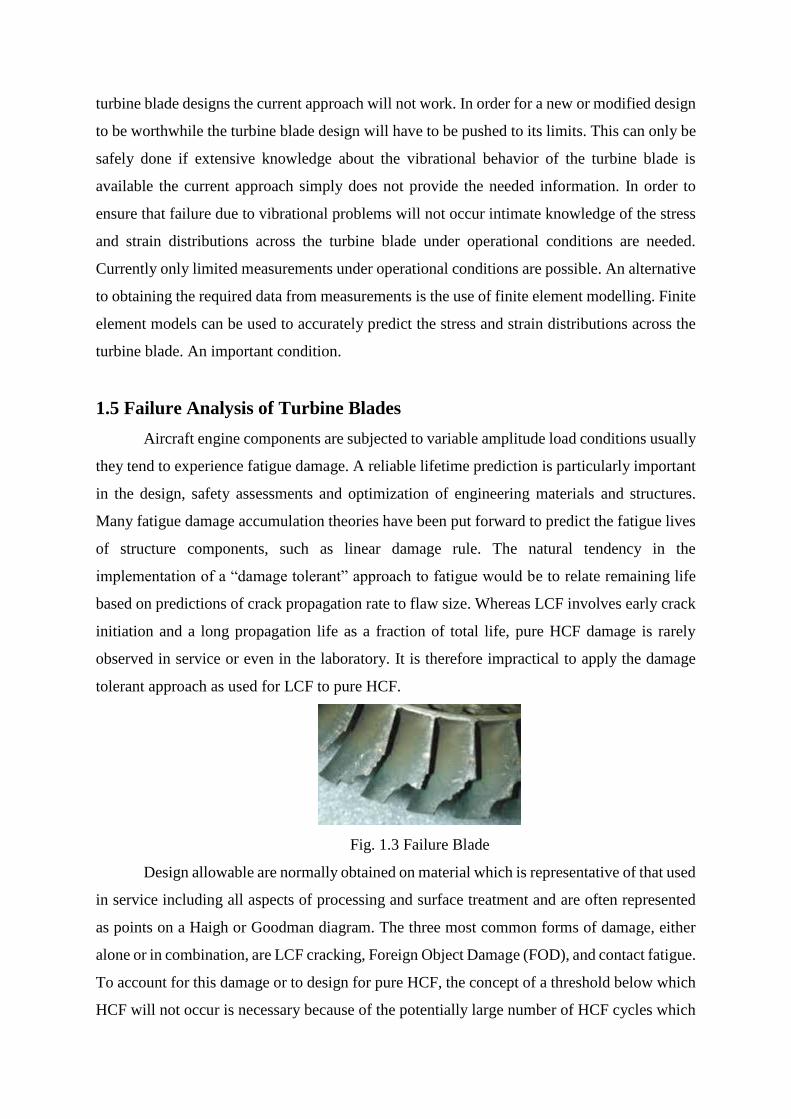
Fig. 1.3 Failure Blade
Design allowable are normally obtained on material which is representative of that used
in service including all aspects of processing and surface treatment and are often represented
as points on a Haigh or Goodman diagram. The three most common forms of damage, either
alone or in combination, are LCF cracking, Foreign Object Damage (FOD), and contact fatigue.
To account for this damage or to design for pure HCF, the concept of a threshold below which
HCF will not occur is necessary because of the potentially large number of HCF cycles which
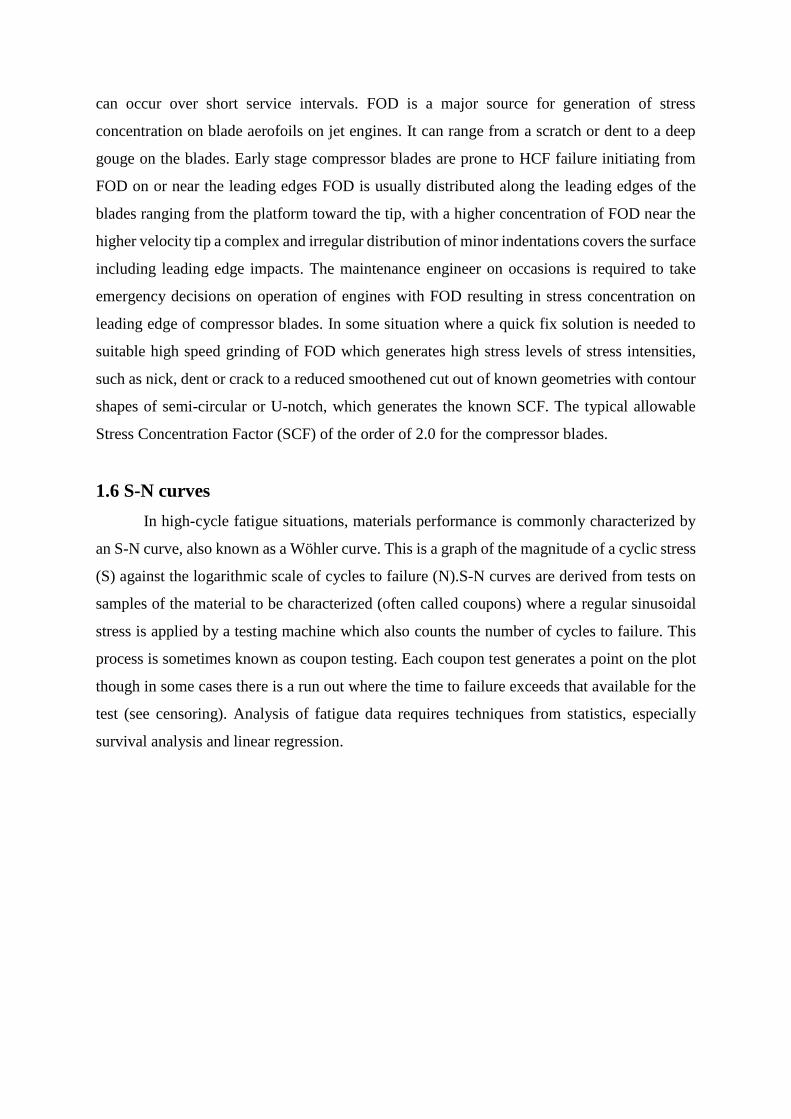
can occur over short service intervals. FOD is a major source for generation of stress
concentration on blade aerofoils on jet engines. It can range from a scratch or dent to a deep
gouge on the blades. Early stage compressor blades are prone to HCF failure initiating from
FOD on or near the leading edges FOD is usually distributed along the leading edges of the
blades ranging from the platform toward the tip, with a higher concentration of FOD near the
higher velocity tip a complex and irregular distribution of minor indentations covers the surface
including leading edge impacts. The maintenance engineer on occasions is required to take
emergency decisions on operation of engines with FOD resulting in stress concentration on
leading edge of compressor blades. In some situation where a quick fix solution is needed to
suitable high speed grinding of FOD which generates high stress levels of stress intensities,
such as nick, dent or crack to a reduced smoothened cut out of known geometries with contour
shapes of semi-circular or U-notch, which generates the known SCF. The typical allowable
Stress Concentration Factor (SCF) of the order of 2.0 for the compressor blades.
1.6 S-N curves
In high-cycle fatigue situations, materials performance is commonly characterized by
an S-N curve, also known as a Wöhler curve. This is a graph of the magnitude of a cyclic stress
(S) against the logarithmic scale of cycles to failure (N).S-N curves are derived from tests on
samples of the material to be characterized (often called coupons) where a regular sinusoidal
stress is applied by a testing machine which also counts the number of cycles to failure. This
process is sometimes known as coupon testing. Each coupon test generates a point on the plot
though in some cases there is a run out where the time to failure exceeds that available for the
test (see censoring). Analysis of fatigue data requires techniques from statistics, especially
survival analysis and linear regression.
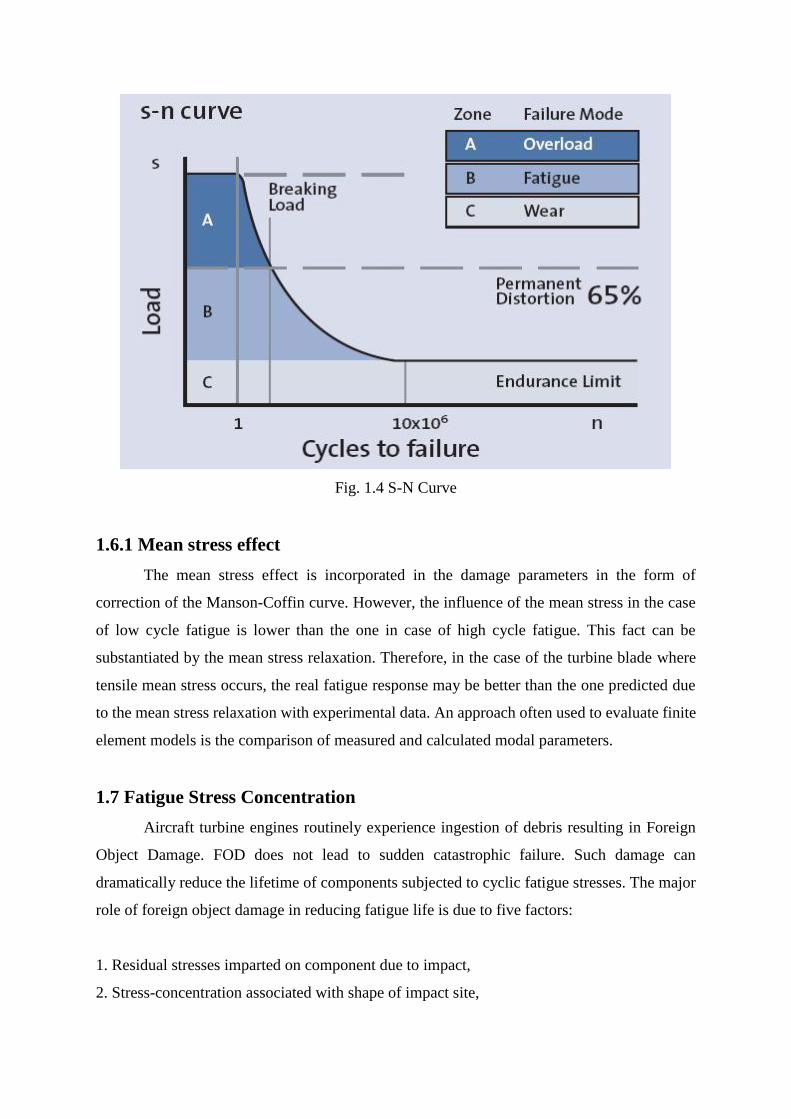
Fig. 1.4 S-N Curve
1.6.1 Mean stress effect
The mean stress effect is incorporated in the damage parameters in the form of
correction of the Manson-Coffin curve. However, the influence of the mean stress in the case
of low cycle fatigue is lower than the one in case of high cycle fatigue. This fact can be
substantiated by the mean stress relaxation. Therefore, in the case of the turbine blade where
tensile mean stress occurs, the real fatigue response may be better than the one predicted due
to the mean stress relaxation with experimental data. An approach often used to evaluate finite
element models is the comparison of measured and calculated modal parameters.
1.7 Fatigue Stress Concentration
Aircraft turbine engines routinely experience ingestion of debris resulting in Foreign
Object Damage. FOD does not lead to sudden catastrophic failure. Such damage can
dramatically reduce the lifetime of components subjected to cyclic fatigue stresses. The major
role of foreign object damage in reducing fatigue life is due to five factors:
1. Residual stresses imparted on component due to impact,
2. Stress-concentration associated with shape of impact site,
3. Incipient micro cracks formed during impact,
4. Plastic work in the material, or
5. Distortion of the microstructure.
1.7a Geometric Stress Concentration
In most structures, fatigue cracking usually initiates at a stress concentration. The stress
concentration may by inherent present in design, such as a hole, fillet, thread, or other
geometrical feature, or the stress concentration can result from a manufacturing process, such
as residual tensile stresses introduced by heat treatment or rough surface finish. The effect of
notches on fatigue strength is determined by comparing the S-N curves of notched and un
notched specimens. The data for the notched specimens are usually plotted in terms of nominal
stress based on the net cross section of the specimen. The effect of the notch with decreasing
the fatigue strength is reported as the fatigue strength reduction factor, or the fatigue notch
factor, Kf:
For metals that do not have a definite fatigue limit, fatigue notch factor is based on the fatigue
strength at a specified cycles. Values of the fatigue notch factor vary with the severity of the
notch, i,e material, type of loading, type of notch, and applied stress level. Notched fatigue data
are also noted using a notch sensitivity factor, q:
This relationship compares the theoretical stress-concentration factor, Kt to the fatigue
notch factor, Kf. In this relationship, a material that experiences no reduction in fatigue due to
a notch will have a notch sensitivity factor q=0, while one that experiences a reduction in
fatigue up to the full theoretical value will have a notch sensitivity factor q=1. The value of q
is dependent on the material and the radius of the notch at root, the notch sensitivity factor q
significantly decreases with smaller notch radii. Although it seems counterintuitive, it occurs
because Kf increases more slowly than Kt with decreasing notch radius. For notches with large
radii, Kf is almost equal to Kt. For materials with small notches, Kf is less than Kt. In addition,
lower-strength metals are less affected than high strength metals by geometric discontinuities
that reduce fatigue resistance, because high-strength metals have limited capacity for
deformation and crack tip blunting.
Effective Stress Concentration Factors Peak stress near a stress raiser would be Kt times
larger than the nominal stress at the notched cross section. However, Kt is an ideal value based
on linear elastic behaviour and depends only on the proportions of the dimensions of the stress
raiser and the notched part. Notch radius, Local plastic deformation, residual stress, notch
radius, part size, temperature, material characteristics, and load type influence the extent to
which the peak notch stress approaches the theoretical value of Kt, σnom. To deal with the
various phenomena that influence stress concentration, the concepts of effective stress
concentration factor and notch sensitivity have been introduced.
The effective stress concentration factor of a specimen is defined to be the ratio of the
stress calculated for the load at which structural damage is initiated in the specimen free of the
stress raiser to the nominal stress corresponding to the load at which damage starts in the sample
with the stress raiser. Kσ is the effective stress concentration factor as determined by the
Experimental study of the specimen. Factors determined should be regarded more as strength
reduction factors than as quantities that correspond to an actual stress in the body. The fatigue
strength is the maximum amplitude of fully reversed cyclic stress that a specimen can withstand
for a given number of load cycles. The notch sensitivity index can vary from 0 for complete
insensitivity to notches to 1 for the full theoretical effect. Notch sensitivity in fatigue decreases
as the notch radius decreases and as the grain size increases a larger part will generally have
greater notch sensitivity than a smaller part with proportionally similar dimensions this
variation is known as the scale effect larger notch radii result in lower stress gradients near the
notch, and more material is subjected to higher stresses.
1.7b Design for Minimum SCF
As a general rule, force should be transmitted from point to point as smoothly as
possible. The lines connecting the force transmission path are sometimes called the force (or
stress) flow. Sharp transitions in the direction of the force flow should be removed by
smoothing contours and rounding notch roots. When stress raisers are necessitated by
functional requirements, the raisers should be placed in regions of low nominal stress if
possible. A fatigue failure is characterized by two distinct regions the first of these is due to
progressive development of the crack while the second is due to the sudden fracture the zone
of sudden fracture is very similar in appearance to the fracture of a brittle material such as cast
iron that has failed in tension. The crack propagation zone could be distinguished from a
polished appearance. A careful examination of the failed cross section could also reveal the site
of crack origin.
1.8 Fatigue Stress Life and Strain Life
One of the most effective methods of improving fatigue life is to induce residual
compressive stresses on the surface of the part. This is often accomplished by shot peening or
by surface rolling with contoured rollers. Shot peening involves propelling fine steel or cast
iron shot into the surface at high velocities. The severity of the stress produced by shot peening
is monitored by measuring the residual deformation of shot-peened specimens called Almena
strips. In addition to inducing compressive stress on the surface, the surface layers are also
strengthened by the cold working that occurs during shot peening. Important variables in shot
peening include the hardness of the shot, the size, the shape, and the velocity. Shot peening
must be carefully controlled so as not to introduce surface damage to the part. Shot peening
imparts greater fatigue life during high-cycle fatigue than it does for higher-stress low-cycle
fatigue. There are many types of fluctuating stresses. Several of the more common types
encountered.
A fully reversed stress cycle, where the maximum and minimum stresses are equal, is
commonly used in testing. This is the type of stress produced, for example, by the R.R. Moore
rotating-beam fatigue machine, which is similar to what a shaft may encounter during service.
Since this was the original type of machine used to generate fatigue data, quite a bit of the data
in the literature is for fully reversed bending with no mean stress applied on top of it. Another
common stress cycle is the repeated stress cycle, in which there is a mean stress applied on top
of the maximum and minimum stresses. Maximum and minimum stresses in the cycle do not
necessarily have to be equal in value. The last type of loading cycle is the random or irregular
stress cycle, in which the part is subjected to random loads during service. Although a majority
of the fatigue data in the literature is for fully reversed bending, that is capable of tension and
compression loading in both the high- and low-cycle fatigue ranges. These modern test frames
are closed-loop servo hydraulically controlled and can be programmed with almost any desired
fatigue spectrum.
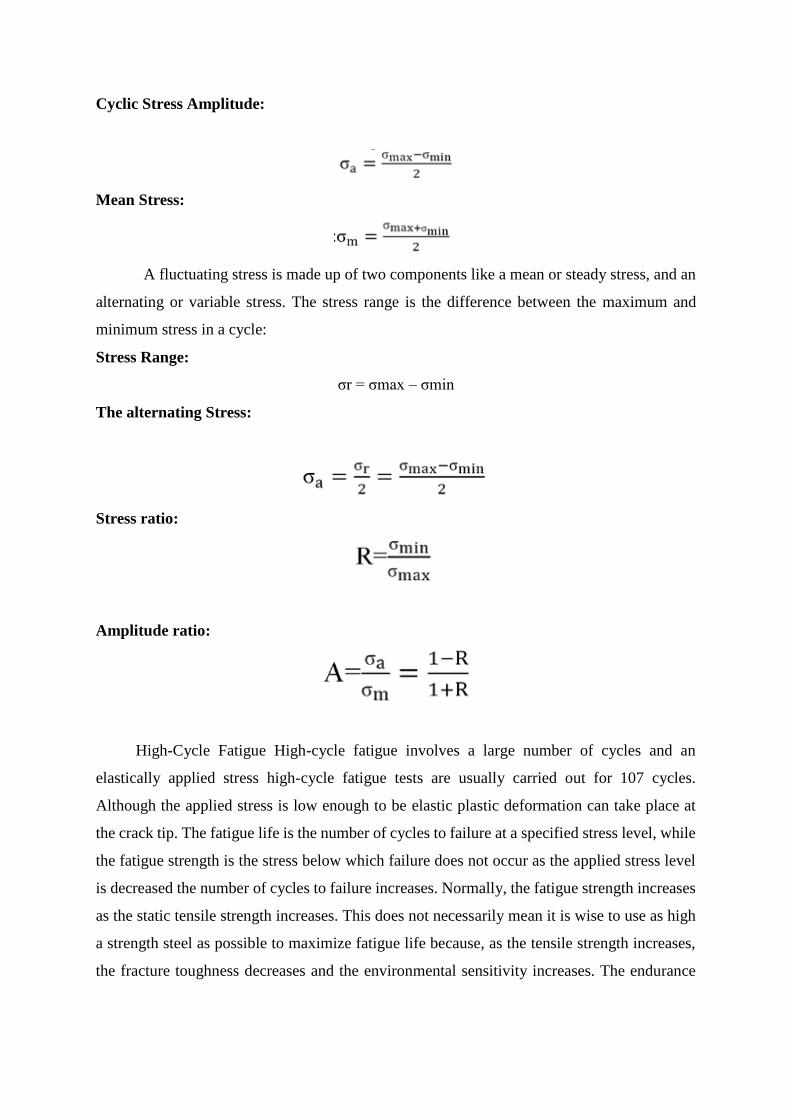
Cyclic Stress Amplitude:
Mean Stress:
A fluctuating stress is made up of two components like a mean or steady stress, and an
alternating or variable stress. The stress range is the difference between the maximum and
minimum stress in a cycle:
Stress Range:
σr = σmax – σmin
The alternating Stress:
Stress ratio:
Amplitude ratio:
High-Cycle Fatigue High-cycle fatigue involves a large number of cycles and an
elastically applied stress high-cycle fatigue tests are usually carried out for 107 cycles.
Although the applied stress is low enough to be elastic plastic deformation can take place at
the crack tip. The fatigue life is the number of cycles to failure at a specified stress level, while
the fatigue strength is the stress below which failure does not occur as the applied stress level
is decreased the number of cycles to failure increases. Normally, the fatigue strength increases
as the static tensile strength increases. This does not necessarily mean it is wise to use as high
a strength steel as possible to maximize fatigue life because, as the tensile strength increases,
the fracture toughness decreases and the environmental sensitivity increases. The endurance
limit of high-strength steels is extremely sensitive to surface condition, residual-stress state,
and the presence of inclusions that act as stress concentrations.
1.8.1 Mean Stress Theories
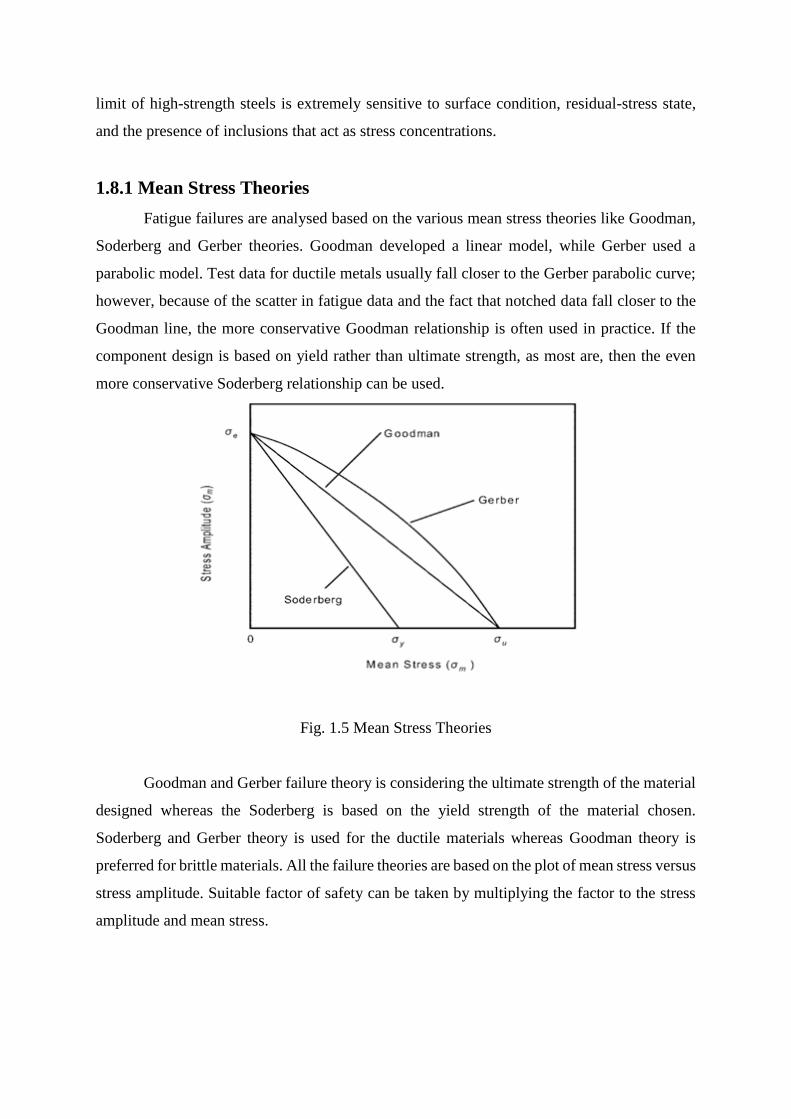
Fatigue failures are analysed based on the various mean stress theories like Goodman,
Soderberg and Gerber theories. Goodman developed a linear model, while Gerber used a
parabolic model. Test data for ductile metals usually fall closer to the Gerber parabolic curve;
however, because of the scatter in fatigue data and the fact that notched data fall closer to the
Goodman line, the more conservative Goodman relationship is often used in practice. If the
component design is based on yield rather than ultimate strength, as most are, then the even
more conservative Soderberg relationship can be used.
Fig. 1.5 Mean Stress Theories
Goodman and Gerber failure theory is considering the ultimate strength of the material
designed whereas the Soderberg is based on the yield strength of the material chosen.
Soderberg and Gerber theory is used for the ductile materials whereas Goodman theory is
preferred for brittle materials. All the failure theories are based on the plot of mean stress versus
stress amplitude. Suitable factor of safety can be taken by multiplying the factor to the stress
amplitude and mean stress.
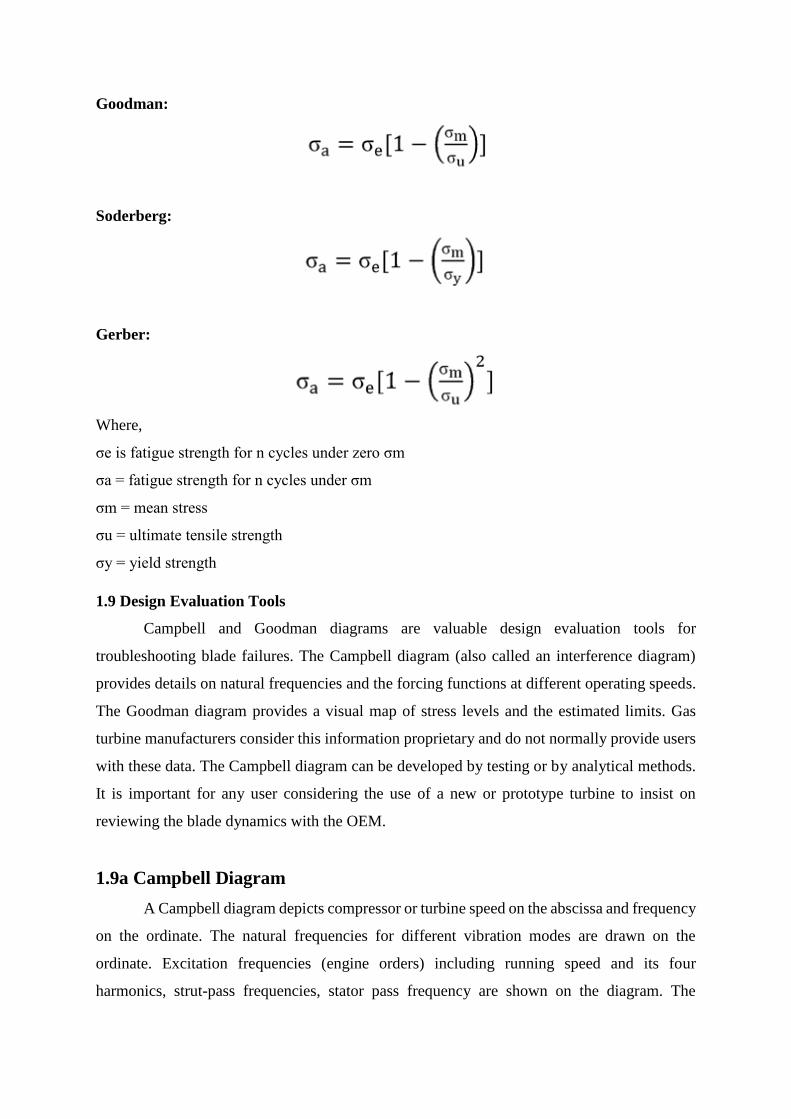
Goodman:
Soderberg:
Gerber:
Where,
σe is fatigue strength for n cycles under zero σm
σa = fatigue strength for n cycles under σm
σm = mean stress
σu = ultimate tensile strength
σy = yield strength
1.9 Design Evaluation Tools
Campbell and Goodman diagrams are valuable design evaluation tools for
troubleshooting blade failures. The Campbell diagram (also called an interference diagram)
provides details on natural frequencies and the forcing functions at different operating speeds.
The Goodman diagram provides a visual map of stress levels and the estimated limits. Gas
turbine manufacturers consider this information proprietary and do not normally provide users
with these data. The Campbell diagram can be developed by testing or by analytical methods.
It is important for any user considering the use of a new or prototype turbine to insist on
reviewing the blade dynamics with the OEM.
1.9a Campbell Diagram
A Campbell diagram depicts compressor or turbine speed on the abscissa and frequency
on the ordinate. The natural frequencies for different vibration modes are drawn on the
ordinate. Excitation frequencies (engine orders) including running speed and its four
harmonics, strut-pass frequencies, stator pass frequency are shown on the diagram. The
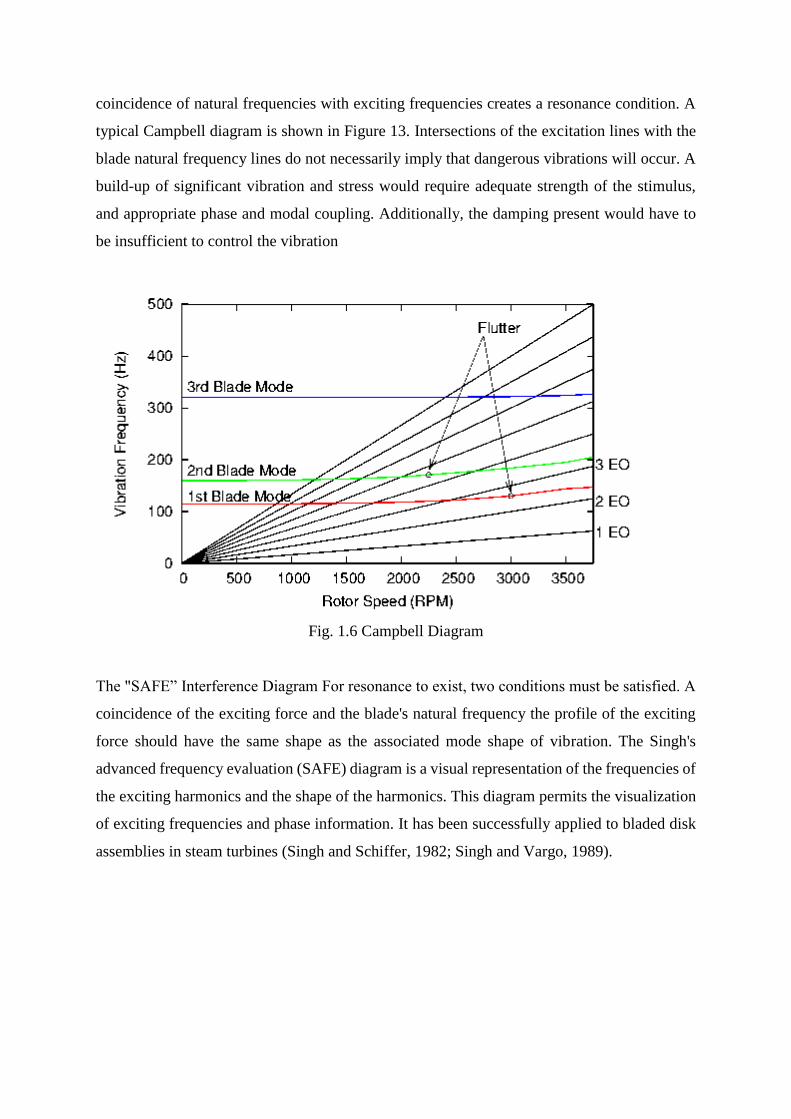
coincidence of natural frequencies with exciting frequencies creates a resonance condition. A
typical Campbell diagram is shown in Figure 13. Intersections of the excitation lines with the
blade natural frequency lines do not necessarily imply that dangerous vibrations will occur. A
build-up of significant vibration and stress would require adequate strength of the stimulus,
and appropriate phase and modal coupling. Additionally, the damping present would have to
be insufficient to control the vibration
Fig. 1.6 Campbell Diagram
The "SAFE” Interference Diagram For resonance to exist, two conditions must be satisfied. A
coincidence of the exciting force and the blade's natural frequency the profile of the exciting
force should have the same shape as the associated mode shape of vibration. The Singh's
advanced frequency evaluation (SAFE) diagram is a visual representation of the frequencies of
the exciting harmonics and the shape of the harmonics. This diagram permits the visualization
of exciting frequencies and phase information. It has been successfully applied to bladed disk
assemblies in steam turbines (Singh and Schiffer, 1982; Singh and Vargo, 1989).
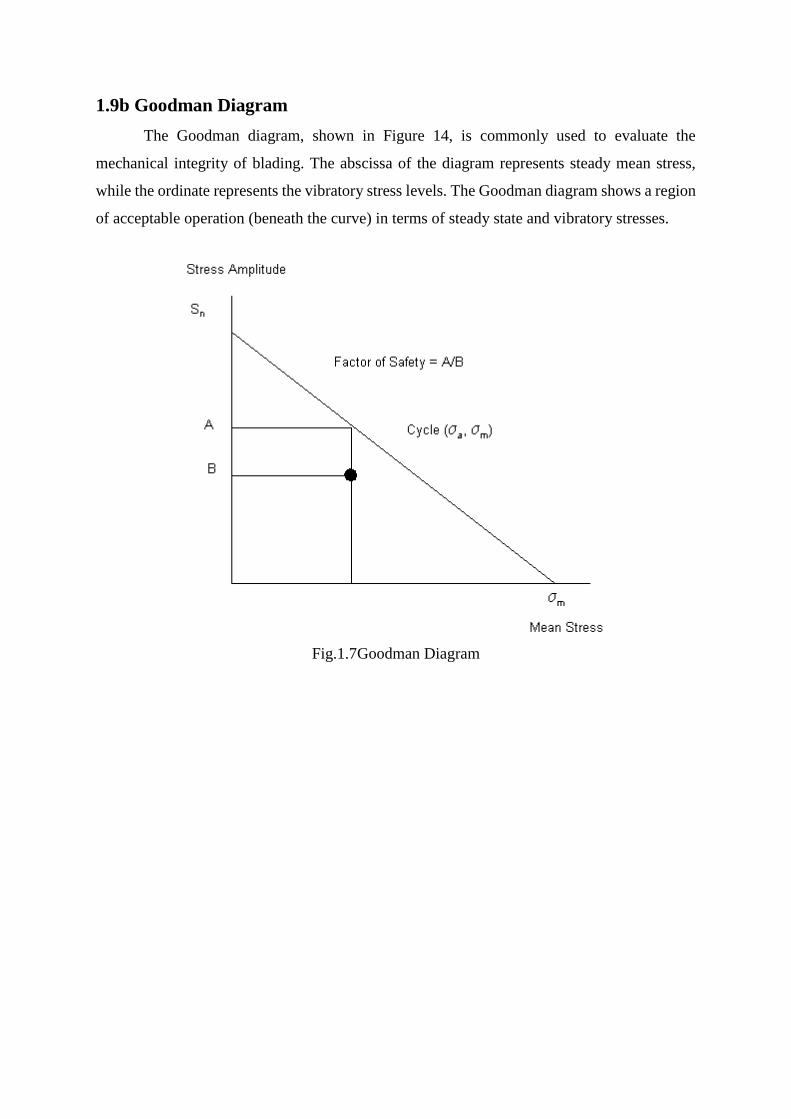
1.9b Goodman Diagram
The Goodman diagram, shown in Figure 14, is commonly used to evaluate the
mechanical integrity of blading. The abscissa of the diagram represents steady mean stress,
while the ordinate represents the vibratory stress levels. The Goodman diagram shows a region
of acceptable operation (beneath the curve) in terms of steady state and vibratory stresses.
Fig.1.7Goodman Diagram
CHAPTER 2. LITERATURE SURVEY
2.1 Introduction
The complexity while analyzing the low cycle fatigue and high cycle fatigue in Gas
turbine blades, can be minimized in many ways that can be explained in below followed survey.
2.2 Summary
Aarash Rahman (2013) used different failure mechanisms, resonant vibration of
blades has a major role and therefore is the subject of many recent research works.
Therefore, in this paper, modal analysis of a first stage blade in ALSTOM gas turbine
is investigated and natural frequencies and vibration modes of blade are found in various
conditions. For this purpose, a cloud-point model of a gas turbine blade has been created
using 3D Laser Digitizer. Then the numerical calculation by finite element method
using ANSYS software based on experimental test conditions is utilized and
Experimental natural frequencies have been obtained. The results show acceptable
agreement between the experimental and FEM results
Dianyin Hu (2013) this paper focuses on a crack growth life assessment method for a
turbine component under high low combined cycle fatigue (HLCCF) loading through
experimental and numerical methods. Crack growth tests under HLCCF loading on five
full scale turbine components, attached to actual turbine discs, were conducted at
elevated temperature by using a Ferris wheel combined fatigue system to simulate the
stress under HLCCF loading and temperature distributions.
M. Mirzaei (2004) sthis paper describes the stress analysis and life assessment of a
first-stage air-cooled blade made of the super alloy IN738LC. Three-dimensional finite
element thermal and stress analyses of the blade were carried out for the steady-state
full-load operation. The results of these analyses were used for determination of the
regions where the combination of high temperature and high tensile stress was sufficient
for significant creep-fatigue crack growth. Accordingly, a critical point at the leading
edge of the aerofoil, near the root, was selected for crack modelling. An incremental
crack growth scheme was considered and the total life for the growth of a 0.5mm surface
crack to a 5mm through-thickness crack was calculated.
Madan Kumara M C (2008) Nickel base single crystal material is used due to the
effectiveness over polycrystalline blade materials. HCF caused by large resonance
stresses is one of the main problems in turbine blade design. Fatigue analysis is done
for the notched linearly varying rotating blade, the alternating stress, strain energy,
stress intensity and life of the rotating blade is found. Influence of size and location of
the damage on blade’s life is reported. Failure analysis of the rotating blade is carried
to know the effect of the notch on the damaged blade and use it in critical conditions.
Binesh Philip (2000) the fatigue life of the blade subjected to static and dynamic loads,
the analysis is divided into two parts. In the first part, the blade is subjected to static
loading that is centrifugal and gas bending load. Results obtained are based on the above
process. In case of static loading, it is observed that the dovetail regions will have a
minimum life in LCF. And in case of dynamic loading, it is observed that the maximum
speed of the fan blade is close to one of the blade passing frequencies. Hence, the
deflections are predominantly similar. It is also observed that under dynamic loading,
the aerofoil is having a minimum life in HCF.
Nandish R.V (2006) the severity of Foreign Object Damage induced notches can vary
significantly, depending on their geometry and location on the aerofoil. HCF caused by
large resonance stresses is one of the main problems in turbine blade design. Fatigue
analysis is done for the notched rotating blade, the alternating stress, fatigue stress
concentration factor and life of the rotating blade is found for the known stress
concentration factor. Failure analysis of the rotating blade is carried to give the
information to maintenance engineer for critical usage of turbine blades.
Patil A.A (2011) the failure of a second stage blade in a gas turbine was investigated
by mechanical examinations of the failed blade. The blade was made of a nickel-base
alloy Inconel 738LC. The turbine engine has been in service for about 73,500 hrs. An

analytical calculation parallel to the finite element method was utilized to determine the
static stresses due to huge centrifugal force. The dynamic characteristics of the turbine
blade were evaluated by the finite element mode and harmonic analysis. Finally
according to the log sheet records and by using a Campbell diagram there was a good
agreement between the failure signs and FEM results which showed the broken blade
has been resonated by the third vibration mode occasionally before the failure occurred.

CHAPTER 3. METHODOLOGY
3.1 INTRODUCTION
As the fan blade is spinning at full speed, it is subjected to steady centrifugal and gas
bending loads. This can lead to low cycle fatigue, whereas excitation from secondary flows
between blade and casing lead to high cycle fatigue. The procedure for fatigue life estimation
is represented as a flow chart.
Fig. 3.1 Flowchart of HCF- LCF assessment
As depicted in the methodology flow chart, it is important to have a finite element
model. The quality of results is dependent on the quality of FE model. Denser the mesh used
for analysis, better will be the results. The FE model is generated in HYPERMESH. The FE
element library contains a variety of element types. The use of these elements is governed by
the type of problem, time for solving the problem and quality of results. It is also advisable to
have best quality mesh for fatigue life assessment. For the current problem, a mesh
convergence study was carried out to decide on the quality of mesh
3.2 Limitations
In order to mesh the fan blade, a mesh convergence study was carried out. It was for
the type of the element used and the density of the mesh. A cantilever beam was considered for
the study.
3.3 Summary
Hence it can be said that wok discussed in this chapter has centered has on the design
of two basic experiment analyzing the low cycle fatigue and high cycle fatigue in Gas turbine
blades.
4. CHAPTER SOFT WARE –AN OVERVIEW
4.1 INTRODUCTION
4.1.1 CATIA
CATIA - which stands for Computer Aided Three-dimensional Interactive Application
is the most powerful and widely used CAD (computer aided design) software of its kind in the
world. CATIA is owned/developed by Systems of France and until 2010, was marketed
worldwide by IBM.
4.1.2 Hyper mesh
Hyper Mesh presents users with an advanced suite of easy-to-use tools to build and edit
CAE models. For 2D and 3D model creation, users have access to a variety of mesh-generation
capabilities, as well as Hyper Mesh’s powerful auto meshing module.
Surface meshing
Solid map hexa meshing
Tetra meshing
CFD meshing
SPH meshing
Hyper Morph is powerful solution for interactively and parametrically changing the shape of a
finite element model. Its unique approach enables rapid shape variations on the finite element
mesh without sacrificing mesh quality. During the morphing process, Hyper Morph also allows
the creation of shape variables, which can be used for subsequent design optimization studies.
Using Altair BatchMeshe is the fastest way to automatically generate high-quality finite
element meshes for large assemblies. By minimizing manual meshing tasks, this auto meshing
technology provides more time for value-added engineering simulation activities. BatchMesher
provides user-specified control over meshing criteria and geometry clean-up parameters as well
as the ability to output to customize model file formats.

4.2 Summary
The greater the rate of convergence, the better the mesh quality. It means that the correct
solution has been achieved faster in this case the solution may not converge or the rate of
convergence will be impaired.
5. CHAPTER MODELLING
5.1 Introduction
This project summarizes the design and analysis of Gas turbine blade, on which CATIA
V5 is used for deign of solid model of the turbine blade with the help of the spline and extrude
options HYPERMESH software is used analysis of F.E. model generated by meshing of the
blade using the solid brick element present in the HYPERMESH software itself and thereby
applying the boundary condition. This project specifies how the program makes effective use
of the HYPERMESH pre-processor to analyse the complex turbine blade geometries and apply
boundary conditions to examine structural performance of the blade
5.2 Design
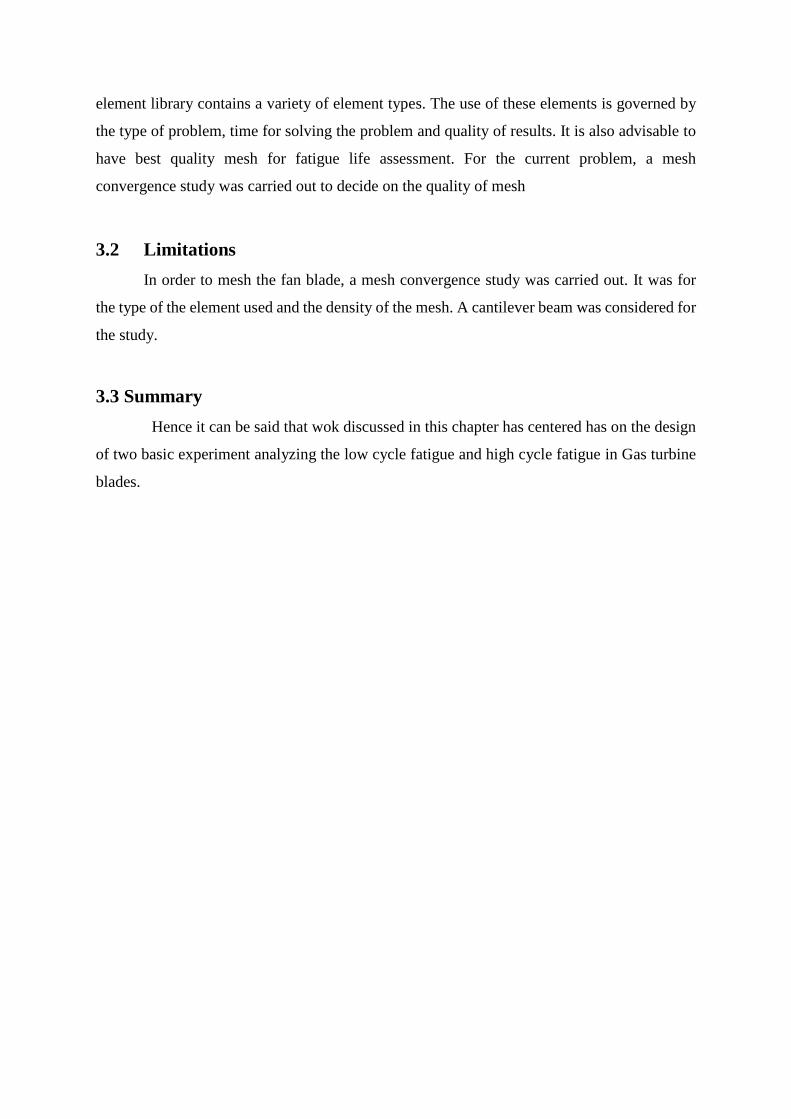
5.2.1 Design view
CATIA MODEL OF BLADE WITH DOVE TALE
Fig.5.1 Catia Model of Blade with Dove Tale
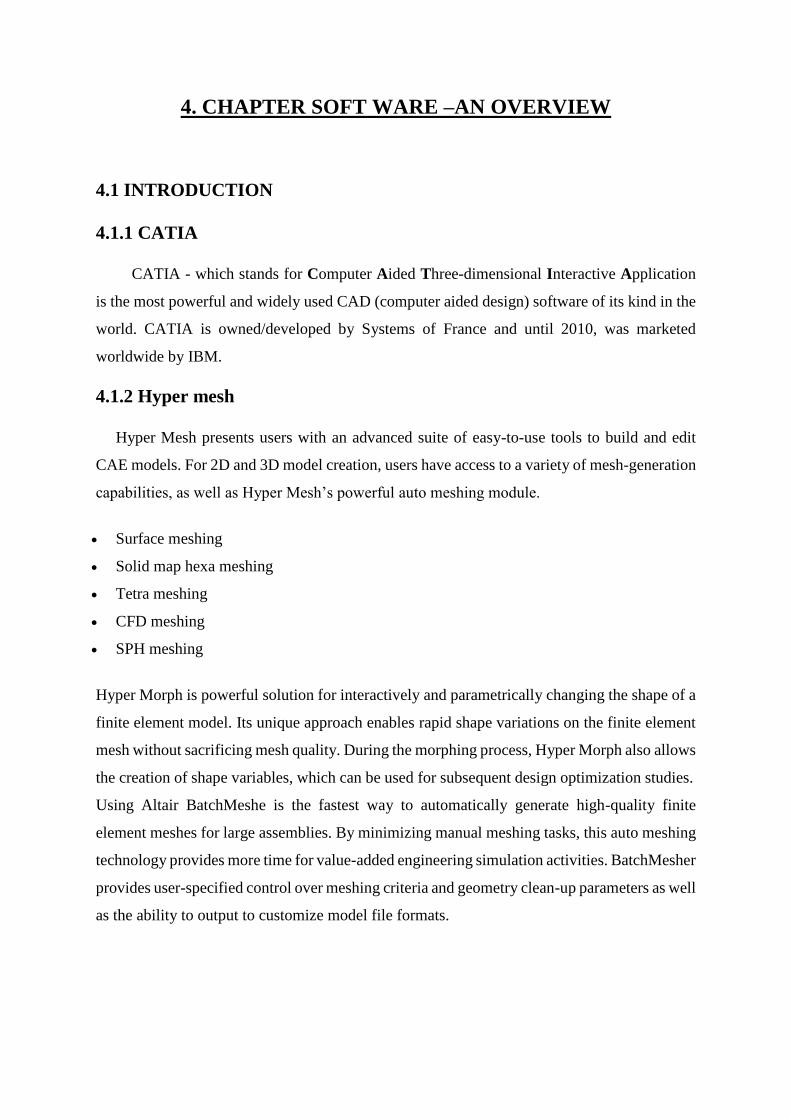
BLADE VIEWS
Fig.5.2Blade Views
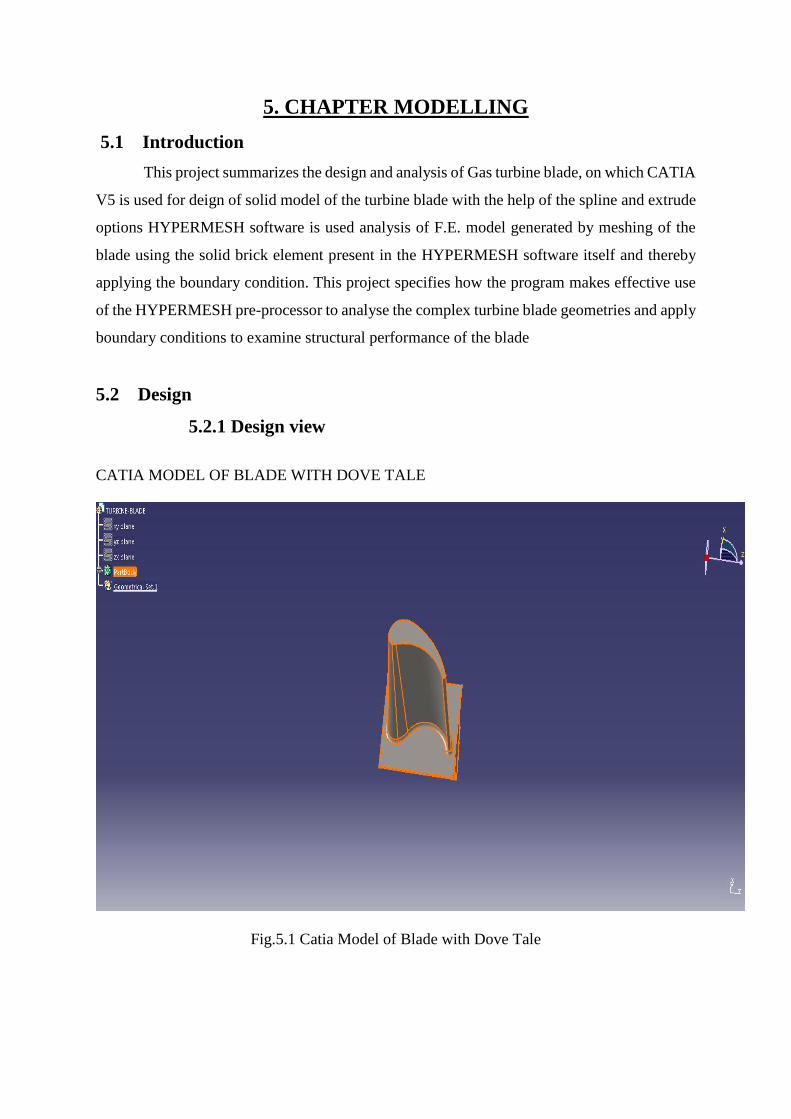
LINE DIAGRAM OF BLADE
Fig.5.3Line Diagram of Blade
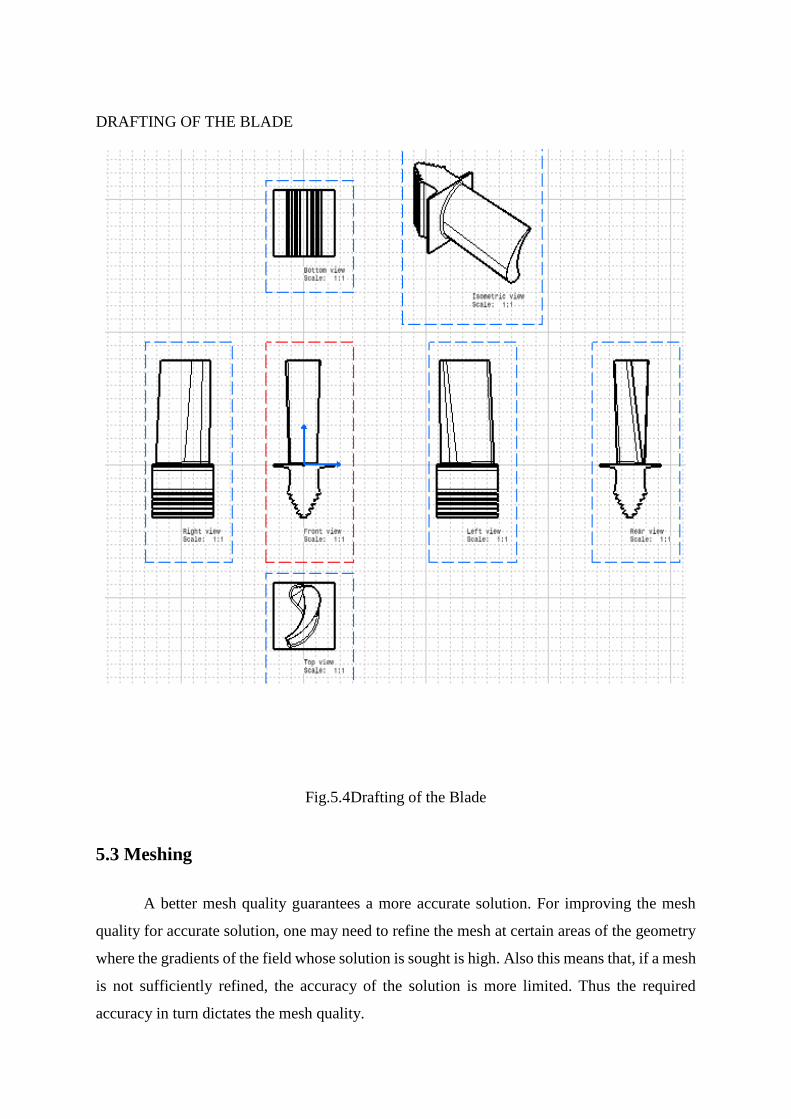
DRAFTING OF THE BLADE
Fig.5.4Drafting of the Blade
5.3 Meshing
A better mesh quality guarantees a more accurate solution. For improving the mesh
quality for accurate solution, one may need to refine the mesh at certain areas of the geometry
where the gradients of the field whose solution is sought is high. Also this means that, if a mesh
is not sufficiently refined, the accuracy of the solution is more limited. Thus the required
accuracy in turn dictates the mesh quality.
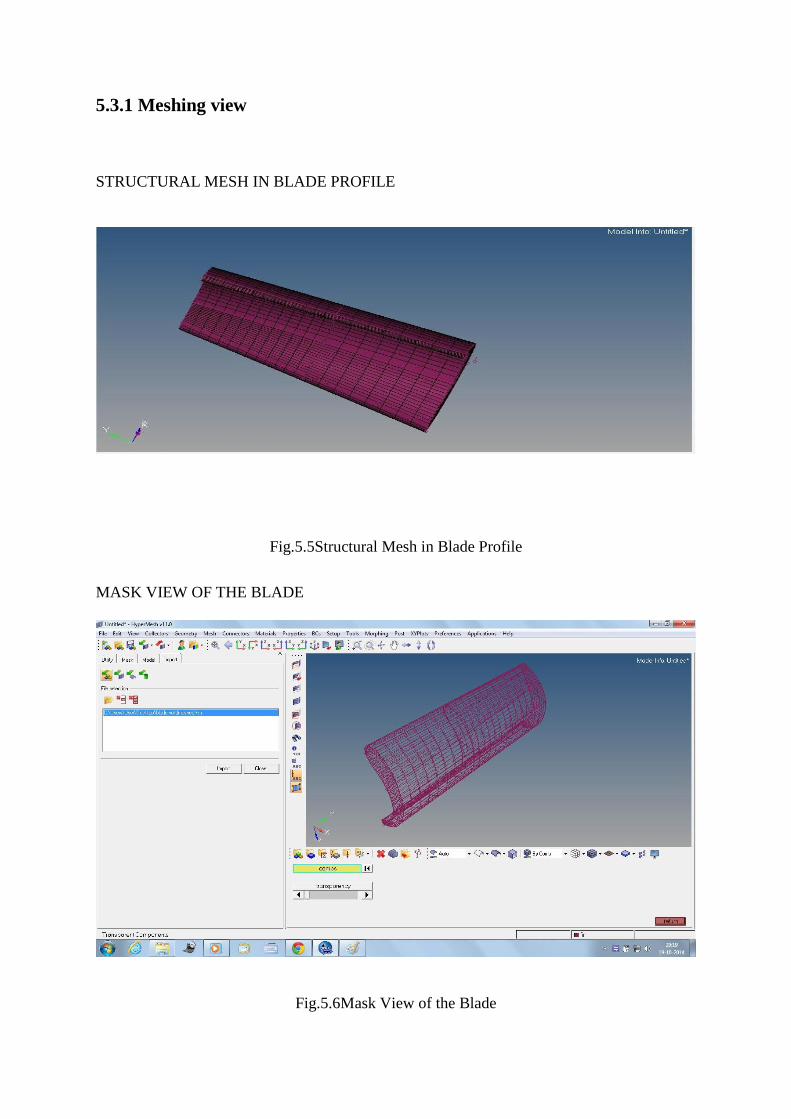
5.3.1 Meshing view
STRUCTURAL MESH IN BLADE PROFILE
Fig.5.5Structural Mesh in Blade Profile
MASK VIEW OF THE BLADE
Fig.5.6Mask View of the Blade
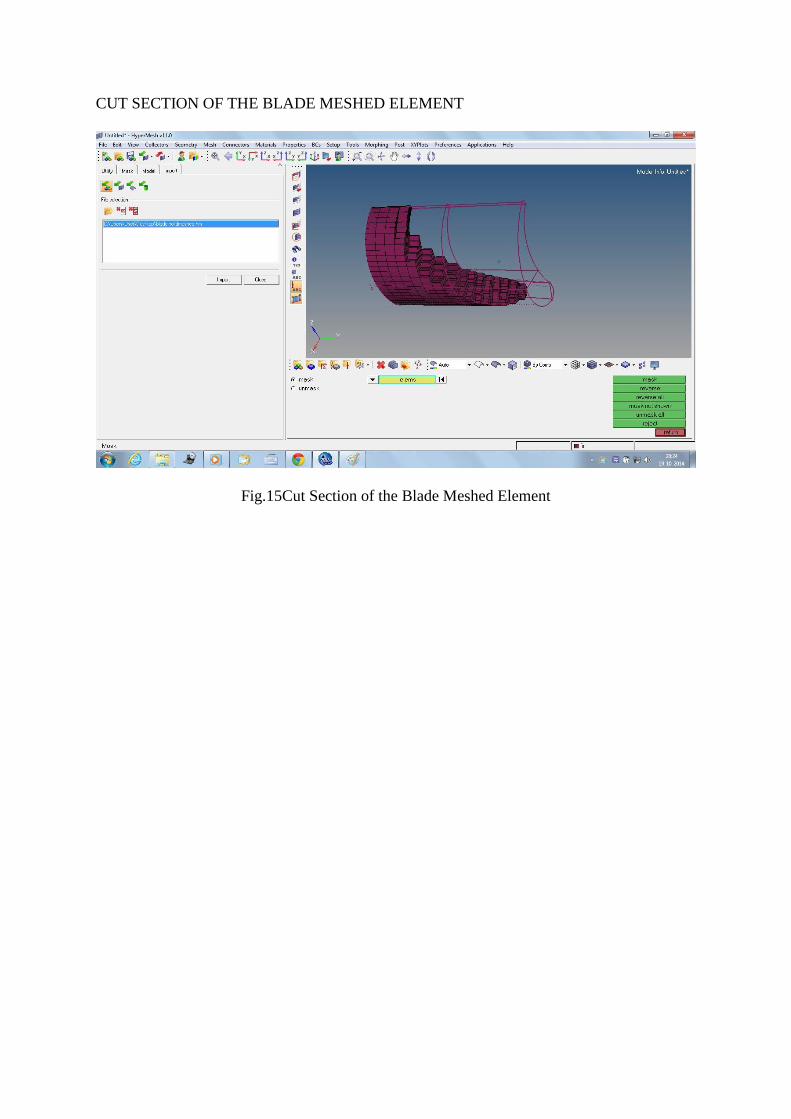
CUT SECTION OF THE BLADE MESHED ELEMENT
Fig.15Cut Section of the Blade Meshed Element
6. REFERENCES
[1]Binesh philip1, n. c. Mahindra babu2 “numerical estimation of fatigue life of aero engine
fan blades “September 2010
[2]Madan kumara m c1, nandish. r. v2, madhu e3“fatigue failure analysis of rotating blade of
uniform varying cross section with damage at the leading edge”4, April 2014
[3]Aarashrahmani “modal analysis of a first stage blade in Alstom gas turbine and comparison
with experimental results” march 2013
[4]R.Q. Wang, C.D. Cho, J.X. Nia. Combined fatigue life test and extrapolation of turbine disk
mortise at elevated temperature. Journal of Engineering for Gas Turbine and Power,
Transactions of the ASME, 127 (2005) 863-868.
[5]N.X. Hoe, Z.X. Wen, Q.M. Yu, et al. Application of a combined high and low cycle fatigue
life model on life prediction of SC blade. International Journal of Fatigue, 31(2009) 616-
619.
[6]C. Schweizer, T. Seifert, B. Nieweg, et al. Mechanisms and modelling of fatigue crack
growth under combined low and high cycle fatigue loading. International Journal of Fatigue,
33(2011) 194-202.
[7]D.Y. Hu, R.Q. Wang, G. C. Hoe, Combined Fatigue Experiments on Full Scale Turbine
Components", Aircraft Engineering and Aerospace Technology, 2013, 85(2013) (on line).
[8]S.A. Meguid, P.S. Kanth, A. Czekanski. Finite element analysis of fir-tree region in turbine
discs. Finite Elements in Analysis and Design, 35(2000) 305-317.
[9]A. Pineau, S.D. Antolovich. High temperature fatigue of nickel-base super alloys-a review
with special emphasis on deformation models and oxidation. Engineering Failure Analysis,
16(2009) 2668-2697.
[10]P. J. Golden, T. Nicholas. The effect of angle on dovetail fretting experiments in Ti-6Al-
4V. Fatigue & Fracture of Engineering Materials & Structures, 28(2005) 1169-1175.
[11]S. Issler, E. Roos. Numerical and experimental investigations into life assessment of blade-
disc connections of gas turbines. Nuclear Engineering and Design, 226(2003) 155-164.
[12]R.Q. Wang, J.X. Nie. A new experimental method to study combined fatigue of actual
turbine disk mortise teeth at elevated temperature. Journal of Engineering for Gas Turbines and
Power, Transaction of the ASME, 119(1997) 969-972.
[13] S. Bhat, R. Patibandla, Metal Fatigue and Basic Theoretical Models: A Review, Alloy
Steel - Properties and Use, Dr. Eduardo Valencia Morales (Ed.), ISBN: 978-953-307-484-9,
2011 In Tech, DOI: 10.5772/28911.
[14] Patil.A.A, Shirsat U.M, “Study of Failure Analysis of Gas Turbine Blade”, IOSR Journal
of Engineering, 2878-8719 PP 37-43.
[15] Segersäll, Mikael, “Nickel-Based Single-Crystal Super alloys: the crystal orientation
influence on high temperature properties”, Licentiate Thesis, Linköping University Electronic
Press, Linköping Studies in Science and Technology. Thesis, ISSN 0280-7971; 1568, 2013.
[16] LucjanWitek, “Failure analysis of turbine disc of an aero engine”, Engineering Failure
Analysis 13 (2006) 9–17
[17] Tresa M. Pollock, Sammy Tin, Nickel-Based Super alloys for Advanced Turbine Engines:
Chemistry, Microstructure, and Properties. JOURNAL OF PROPULSION AND POWER Vol.
22, No. 2, March–April 2006
[18] ArifSugianto,,NanangYulian, Failure Analysis of a First Stage High Pressure Turbine
Blade in an Aero Engine Turbine on PK-GSG Boeing B747-400. Dept of Aircraft Engineering,
Research and Development Material Process - Engineering Services GMF Aero Asia,
Soekarno-Hatta Intl Airport, Tangerang 19103, Banteng, Indonesia