Numerical and Experimental Investigations of...
158
Numerical and Experimental Investigations of Design Parameters Defining Gas Turbine Nozzle Guide Vane Endwall Heat Transfer Frank G. Rubensdörffer Doctoral Thesis 2006
Transcript of Numerical and Experimental Investigations of...

Numerical and Experimental Investigations of Design Parameters
Defining Gas Turbine Nozzle Guide Vane Endwall Heat Transfer
Frank G. Rubensdörffer
Doctoral Thesis 2006

Akademisk avhandling som med tillstånd av Kungliga Tekniska Högskolan i Stockholm framlägges till offentlig granskning för avläggande av teknisk doktorsexamen i energiteknik, fredagen den 31e mars 2006, kl. 10.00 i salen M3, Brinellvägen 64, Kungliga Tekniska Högskolan, Stockholm. Avhandlingen försvaras på engelska. TRITA-KRV-2006-01 ISSN 1100/7990 ISRN KTH-KRV-R-06-01-SE ISBN 91-7178-242-7 © 2006 Frank G. Rubensdörffer
Doctoral Thesis Frank G. Rubensdörffer Page I
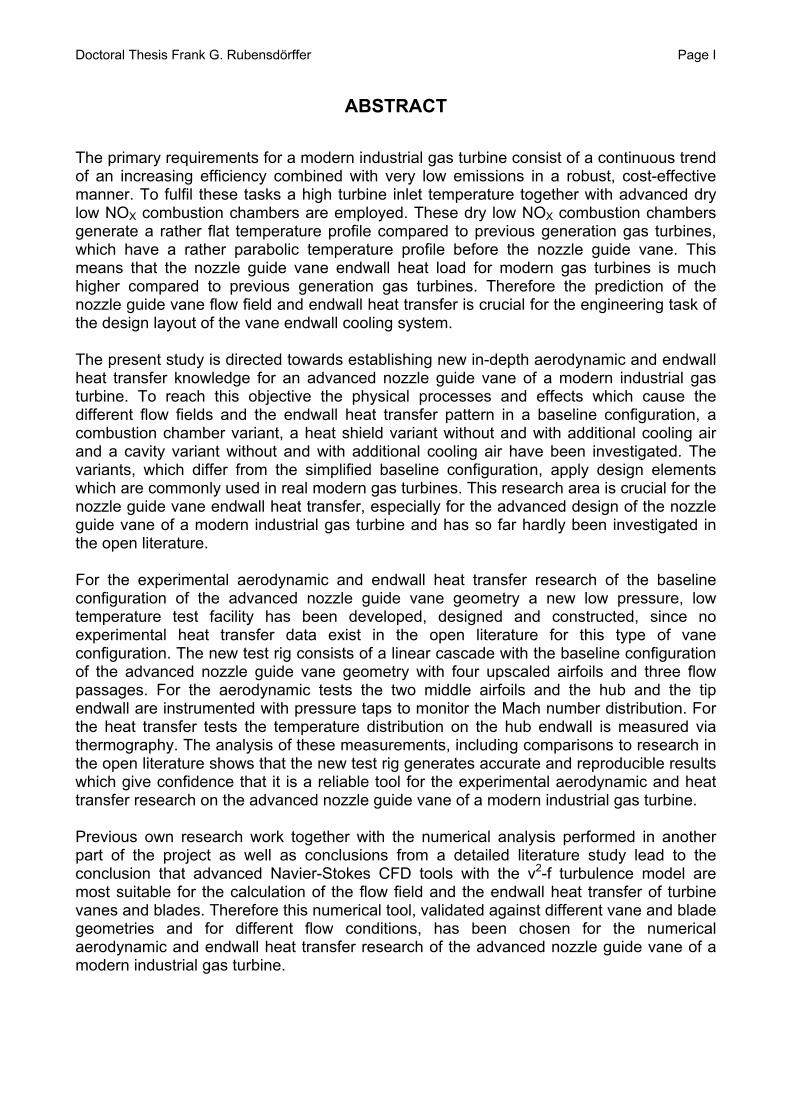
ABSTRACT
The primary requirements for a modern industrial gas turbine consist of a continuous trend of an increasing efficiency combined with very low emissions in a robust, cost-effective manner. To fulfil these tasks a high turbine inlet temperature together with advanced dry low NOX combustion chambers are employed. These dry low NOX combustion chambers generate a rather flat temperature profile compared to previous generation gas turbines, which have a rather parabolic temperature profile before the nozzle guide vane. This means that the nozzle guide vane endwall heat load for modern gas turbines is much higher compared to previous generation gas turbines. Therefore the prediction of the nozzle guide vane flow field and endwall heat transfer is crucial for the engineering task of the design layout of the vane endwall cooling system. The present study is directed towards establishing new in-depth aerodynamic and endwall heat transfer knowledge for an advanced nozzle guide vane of a modern industrial gas turbine. To reach this objective the physical processes and effects which cause the different flow fields and the endwall heat transfer pattern in a baseline configuration, a combustion chamber variant, a heat shield variant without and with additional cooling air and a cavity variant without and with additional cooling air have been investigated. The variants, which differ from the simplified baseline configuration, apply design elements which are commonly used in real modern gas turbines. This research area is crucial for the nozzle guide vane endwall heat transfer, especially for the advanced design of the nozzle guide vane of a modern industrial gas turbine and has so far hardly been investigated in the open literature. For the experimental aerodynamic and endwall heat transfer research of the baseline configuration of the advanced nozzle guide vane geometry a new low pressure, low temperature test facility has been developed, designed and constructed, since no experimental heat transfer data exist in the open literature for this type of vane configuration. The new test rig consists of a linear cascade with the baseline configuration of the advanced nozzle guide vane geometry with four upscaled airfoils and three flow passages. For the aerodynamic tests the two middle airfoils and the hub and the tip endwall are instrumented with pressure taps to monitor the Mach number distribution. For the heat transfer tests the temperature distribution on the hub endwall is measured via thermography. The analysis of these measurements, including comparisons to research in the open literature shows that the new test rig generates accurate and reproducible results which give confidence that it is a reliable tool for the experimental aerodynamic and heat transfer research on the advanced nozzle guide vane of a modern industrial gas turbine. Previous own research work together with the numerical analysis performed in another part of the project as well as conclusions from a detailed literature study lead to the conclusion that advanced Navier-Stokes CFD tools with the v2-f turbulence model are most suitable for the calculation of the flow field and the endwall heat transfer of turbine vanes and blades. Therefore this numerical tool, validated against different vane and blade geometries and for different flow conditions, has been chosen for the numerical aerodynamic and endwall heat transfer research of the advanced nozzle guide vane of a modern industrial gas turbine.

Page II Doctoral Thesis Frank G. Rubensdörffer
The evaluation of the numerical and experimental investigations of the baseline configuration of the advanced design of a nozzle guide vane shows the flow field of an advanced mid-loaded airfoil design with the features to reduce total airfoil losses. For the hub endwall of the baseline configuration of the advanced design of a nozzle guide vane the flow characteristics and heat transfer features of the classical vane endwall secondary flow model can be detected with a very weak intensity and geometric extension compared to the studies of less advanced vane geometries in the open literature. A detailed analysis of the numerical simulations and the experimental data showed very good qualitative and quantitative agreement for the three-dimensional flow field and the endwall heat transfer. These findings, together with the evaluations obtained from the open literature, lead to the conclusions that selected CFD software Fluent together with the applied v2-f turbulence model exhibits a high level of general applicability and is not tuned to a special vane or blade geometry. Therefore the CFD code Fluent with the v2-f turbulence model has been selected for the research of the influence of the several geometric variants of the baseline configuration on the flow field and the hub endwall heat transfer of the advanced nozzle guide vane of a modern industrial gas turbine. Most of the vane endwall heat transfer research in the open literature has been carried out only for baseline configurations of the flow path between combustion chamber and nozzle guide vane. Such a simplified geometry consists of a long, planar undisturbed approach length upstream of the nozzle guide vane. The design of real modern industrial gas turbines however requires often significant variations from this baseline configuration consisting of air-cooled heat shields and purged cavities between the combustion chamber and the nozzle guide vane. A detailed evaluation of the flow field and the endwall heat transfer shows major differences between the baseline and the heat shield configuration. The heat shield in front of the airfoil of the nozzle guide vane influences the secondary flow field and the endwall heat transfer pattern strongly. Additional cooling air, released under the heat shield has a distinctive influence as well. Also the cavity between the combustion chamber and the nozzle guide vane affects the secondary flow field and the endwall heat transfer pattern. Here the influence of additional cavity cooling air is more decisive. The results of the detailed studies of the geometric variants are applied to formulate guidelines for an optimized design of the flow path between the combustion chamber and the nozzle guide vane and the nozzle guide vane endwall cooling configuration of next-generation industrial gas turbines. Keywords: Turbomachinery, secondary flow, endwall heat transfer, linear cascade test facility, CFD, RANS, V2F turbulence model, combustion chamber nozzle guide vane interface, heat shield, cavity, cooling air.

Doctoral Thesis Frank G. Rubensdörffer Page III
PREFACE
The thesis is based on the following papers: 1 Rubensdörffer F. and Fransson T. H.; 2004
“A New Test Facility for Evaluation of Parameters Defining Nozzle Guide Vane Endwall Heat Transfer”, 17th Symposium on Measuring Techniques in Transonic and Supersonic Flow in Cascades and Turbomachines, Stockholm, Sweden.
2 Rubensdörffer F. G. and Fransson T. H.; 2005
“Numerical and Experimental Investigations of Nozzle Guide Vane Endwall Heat Transfer”, ISABE-2005-1118, 17th International Symposium on Airbreathing Engines, Munich, Germany.
3 Rubensdörffer F. G. and Fransson T. H.; 2006 “Numerical Investigations of Geometric Design Parameters Defining Nozzle Guide Vane Endwall Heat Transfer”, ASME Paper No. GT2006-90177, Barcelona, Spain.
The present study has been initiated and activated by the following research work: 4 Rubensdörffer, F. G. and Hjalmarsson, C. S.; 1998
“Experimental and Numerical Investigation of Heat Transfer on a Cooled Turbine Vane”, ASME Paper No. 98-GT-212 Stockholm, Sweden.
5 Rådeklint, U.R., Hjalmarsson, C. S., Annerfeldt M. O. and Rubensdörffer, F. G.; 1999
“Thermal Performance of a Film Cooled Inlet Guide Vane”, ISABE-99-7202, 14th International Symposium on Airbreathing Engines, Florence, Italy.

Page IV Doctoral Thesis Frank G. Rubensdörffer

Doctoral Thesis Frank G. Rubensdörffer Page V
ACKNOWLEDGEMENTS
I would like to express my gratitude to my supervisor Prof. Torsten Fransson at the Chair of Heat and Power Technology at the Royal Institute of Technology (KTH), Stockholm, who made this work possible and realizable. This work was initiated and supported as a part of the Cooling Technology project within the Swedish Gas Turbine Center (GTC) with Lic. Eng. Sven Gunnar Sundkvist, director of GTC and funded by Siemens Industrial Turbomachinery AB, Finspong, Sweden with Mats Annerfeldt, Lic. Eng. Ulf Rådeklint and Dr. Christian Troger as managers. This support is gratefully acknowledged. Special thanks to Karl-Uno Andersson, spending his time for discussing CFD problems, Kirill Letounovski for the design of the test facility and Dr. Esa Utrianen, Sergey Shukin, and Christer Hjalmarsson and all my other colleagues from Siemens for fruitful discussions, comments and ideas during the last years. For the success with the turbulence measurements I would like to thank Lic. Eng. Johan Hjärne and for the instructive discourses and explanations of turbulence modeling I would like to thank Lic. Eng. Andreas Sveningsson from Chalmers. The work would not have been possible without the creative engagement of Leif Ruud and Bengt Pettersson from the laboratory workshop and Thomas Larsson from the Fluid Dynamic Laboratory at Siemens while manufacturing, assembling and operation of the test facility. I would like to thank Assoc. Prof. Andrew Martin, Lic. Eng. Julien Roux, Jens Fridh and Ann Brånth from KTH for their indispensable guidance, support and help. Explicit thanks goes to my parents, my sisters and my relatives in Germany for their continuous support and motivation, also by supplying me with special comfort-food. Finally I want to express my gratitude to my wife Ramona for her love, unconditional support and encouragement.

Page VI Doctoral Thesis Frank G. Rubensdörffer
Doctoral Thesis Frank G. Rubensdörffer Page VII
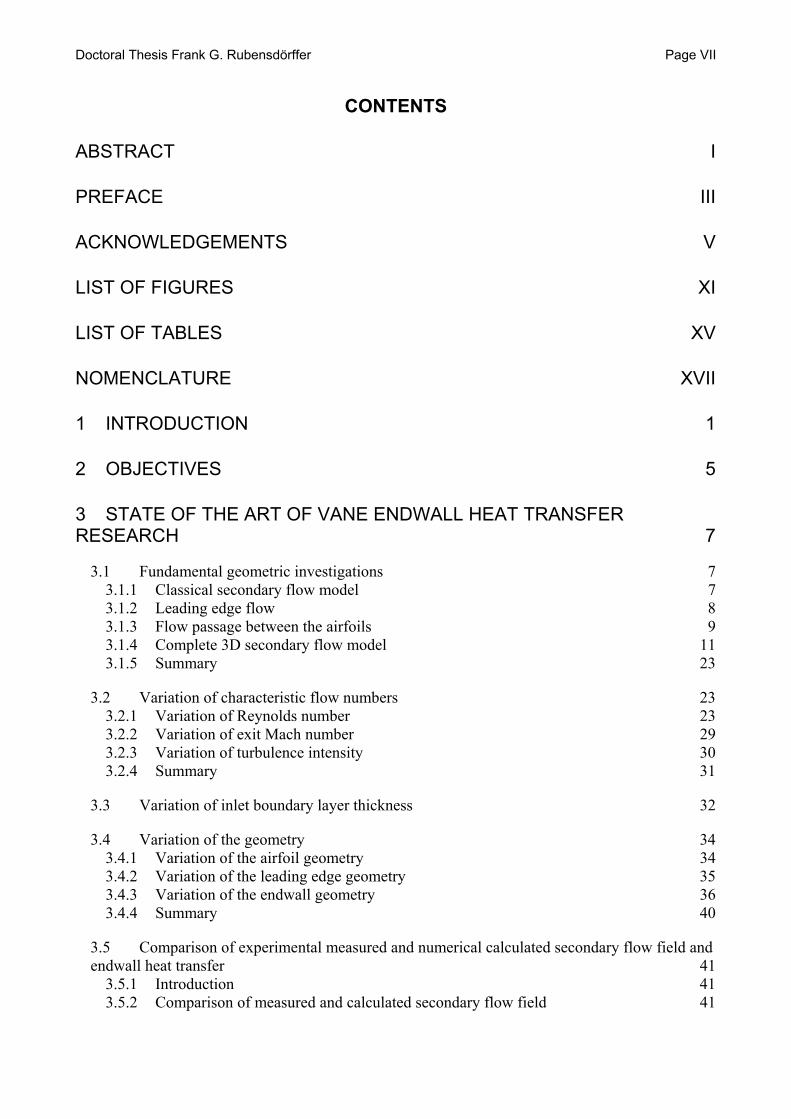
CONTENTS
ABSTRACT I
PREFACE III
ACKNOWLEDGEMENTS V
LIST OF FIGURES XI
LIST OF TABLES XV
NOMENCLATURE XVII
1 INTRODUCTION 1
2 OBJECTIVES 5
3 STATE OF THE ART OF VANE ENDWALL HEAT TRANSFER RESEARCH 7
3.1 Fundamental geometric investigations 7 3.1.1 Classical secondary flow model 7 3.1.2 Leading edge flow 8 3.1.3 Flow passage between the airfoils 9 3.1.4 Complete 3D secondary flow model 11 3.1.5 Summary 23
3.2 Variation of characteristic flow numbers 23 3.2.1 Variation of Reynolds number 23 3.2.2 Variation of exit Mach number 29 3.2.3 Variation of turbulence intensity 30 3.2.4 Summary 31
3.3 Variation of inlet boundary layer thickness 32
3.4 Variation of the geometry 34 3.4.1 Variation of the airfoil geometry 34 3.4.2 Variation of the leading edge geometry 35 3.4.3 Variation of the endwall geometry 36 3.4.4 Summary 40
3.5 Comparison of experimental measured and numerical calculated secondary flow field and endwall heat transfer 41
3.5.1 Introduction 41 3.5.2 Comparison of measured and calculated secondary flow field 41

Page VIII Doctoral Thesis Frank G. Rubensdörffer
3.5.3 Comparison of measured and calculated endwall heat transfer 42 3.5.4 Summary 46
3.6 Conclusions 47
4 METHOD OF ATTACK 51
5 EXPERIMENTAL DESIGN AND METHOD 53
5.1 Introduction 53
5.2 Cold low pressure test facility 54 5.2.1 Test facility design 54 5.2.2 Test section design 56 5.2.3 Instrumentation 62
5.3 Measurement and data acquisition 65
5.4 Data evaluation 66
5.5 Accuracy of the measurements and uncertainty analysis 69 5.5.1 Validation of the chosen measurement method 69 5.5.2 Uncertainty analysis 69
5.6 Quality of the flow field in the linear cascade 71
5.7 Summary 72
6 COMPUTATIONAL FLUID DYNAMICS METHOD 73
6.1 Governing equations 73
6.2 Turbulence 74
6.3 Reynolds averaged Navier-Stokes equations 74
6.4 Turbulence modeling 76 6.4.1 Overview 76 6.4.2 The v2-f turbulence model 76
7 NUMERICAL CALCULATION 79
7.1 Computational domain 79
7.2 Solver 80
7.3 Grid independence study 81
Doctoral Thesis Frank G. Rubensdörffer Page IX
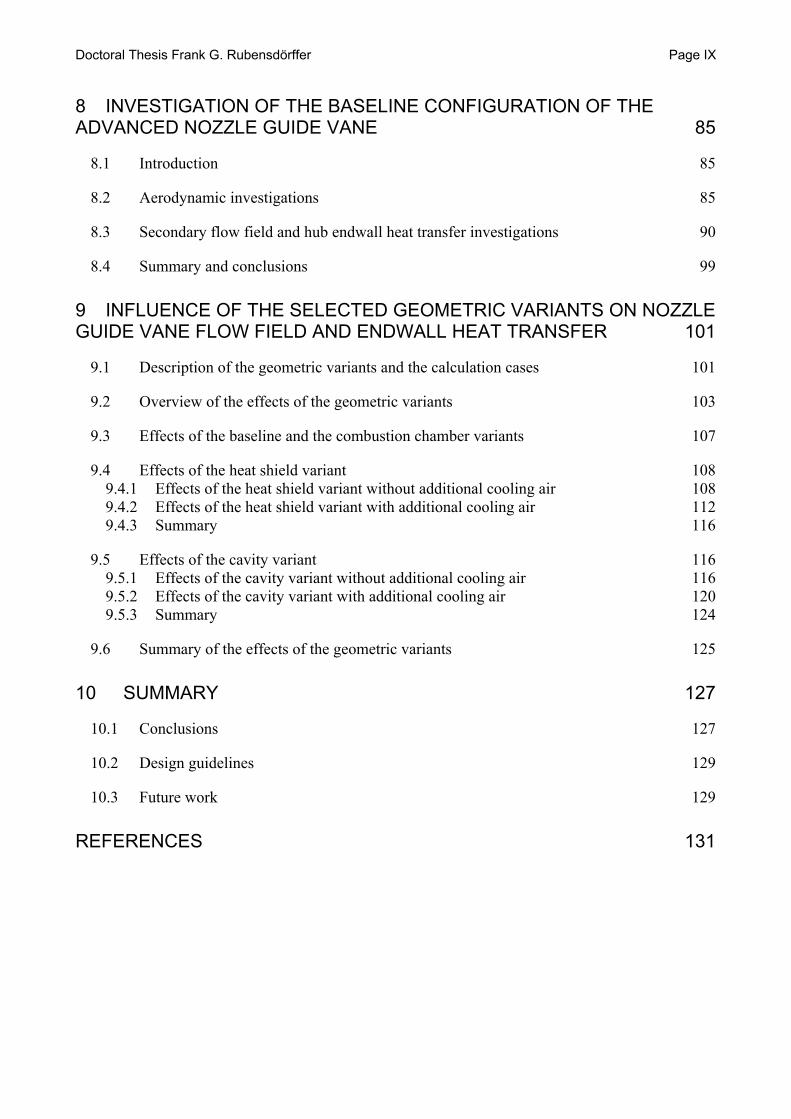
8 INVESTIGATION OF THE BASELINE CONFIGURATION OF THE ADVANCED NOZZLE GUIDE VANE 85
8.1 Introduction 85
8.2 Aerodynamic investigations 85
8.3 Secondary flow field and hub endwall heat transfer investigations 90
8.4 Summary and conclusions 99
9 INFLUENCE OF THE SELECTED GEOMETRIC VARIANTS ON NOZZLE GUIDE VANE FLOW FIELD AND ENDWALL HEAT TRANSFER 101
9.1 Description of the geometric variants and the calculation cases 101
9.2 Overview of the effects of the geometric variants 103
9.3 Effects of the baseline and the combustion chamber variants 107
9.4 Effects of the heat shield variant 108 9.4.1 Effects of the heat shield variant without additional cooling air 108 9.4.2 Effects of the heat shield variant with additional cooling air 112 9.4.3 Summary 116
9.5 Effects of the cavity variant 116 9.5.1 Effects of the cavity variant without additional cooling air 116 9.5.2 Effects of the cavity variant with additional cooling air 120 9.5.3 Summary 124
9.6 Summary of the effects of the geometric variants 125
10 SUMMARY 127
10.1 Conclusions 127
10.2 Design guidelines 129
10.3 Future work 129
REFERENCES 131

Page X Doctoral Thesis Frank G. Rubensdörffer
Doctoral Thesis Frank G. Rubensdörffer Page XI
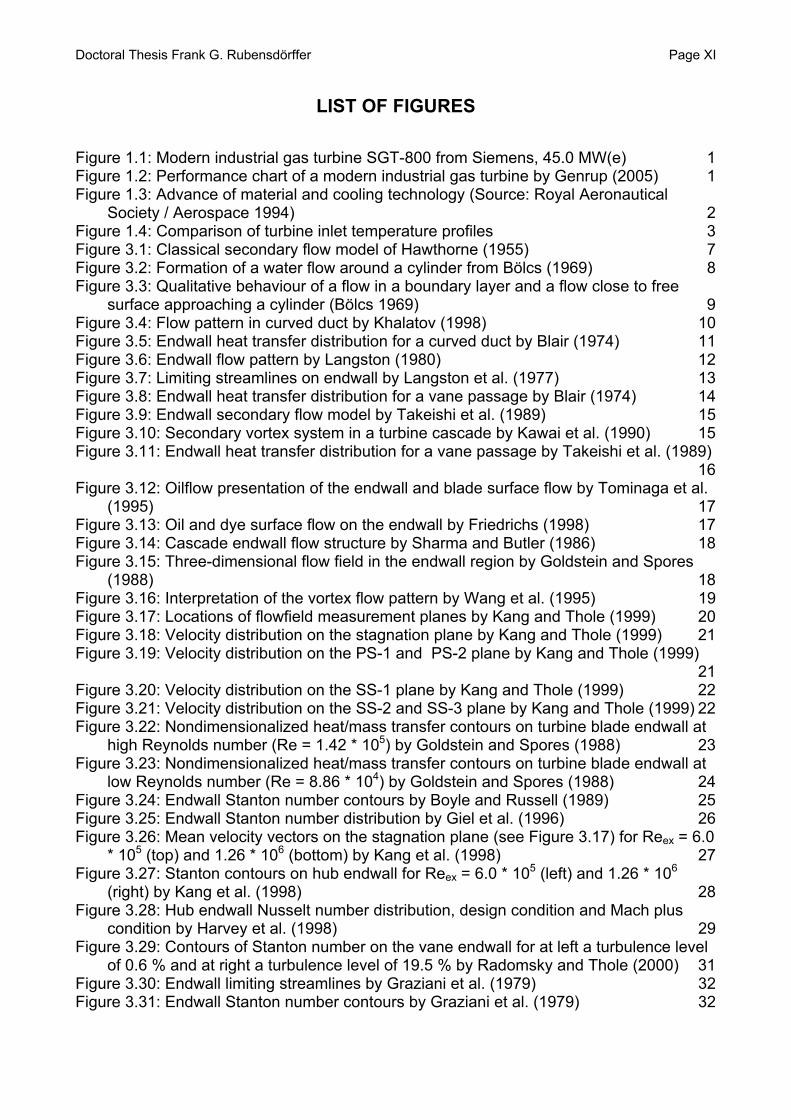
LIST OF FIGURES
Figure 1.1: Modern industrial gas turbine SGT-800 from Siemens, 45.0 MW(e) 1 Figure 1.2: Performance chart of a modern industrial gas turbine by Genrup (2005) 1 Figure 1.3: Advance of material and cooling technology (Source: Royal Aeronautical
Society / Aerospace 1994) 2 Figure 1.4: Comparison of turbine inlet temperature profiles 3 Figure 3.1: Classical secondary flow model of Hawthorne (1955) 7 Figure 3.2: Formation of a water flow around a cylinder from Bölcs (1969) 8 Figure 3.3: Qualitative behaviour of a flow in a boundary layer and a flow close to free
surface approaching a cylinder (Bölcs 1969) 9 Figure 3.4: Flow pattern in curved duct by Khalatov (1998) 10 Figure 3.5: Endwall heat transfer distribution for a curved duct by Blair (1974) 11 Figure 3.6: Endwall flow pattern by Langston (1980) 12 Figure 3.7: Limiting streamlines on endwall by Langston et al. (1977) 13 Figure 3.8: Endwall heat transfer distribution for a vane passage by Blair (1974) 14 Figure 3.9: Endwall secondary flow model by Takeishi et al. (1989) 15 Figure 3.10: Secondary vortex system in a turbine cascade by Kawai et al. (1990) 15 Figure 3.11: Endwall heat transfer distribution for a vane passage by Takeishi et al. (1989)
16 Figure 3.12: Oilflow presentation of the endwall and blade surface flow by Tominaga et al.
(1995) 17 Figure 3.13: Oil and dye surface flow on the endwall by Friedrichs (1998) 17 Figure 3.14: Cascade endwall flow structure by Sharma and Butler (1986) 18 Figure 3.15: Three-dimensional flow field in the endwall region by Goldstein and Spores
(1988) 18 Figure 3.16: Interpretation of the vortex flow pattern by Wang et al. (1995) 19 Figure 3.17: Locations of flowfield measurement planes by Kang and Thole (1999) 20 Figure 3.18: Velocity distribution on the stagnation plane by Kang and Thole (1999) 21 Figure 3.19: Velocity distribution on the PS-1 and PS-2 plane by Kang and Thole (1999)
21 Figure 3.20: Velocity distribution on the SS-1 plane by Kang and Thole (1999) 22 Figure 3.21: Velocity distribution on the SS-2 and SS-3 plane by Kang and Thole (1999) 22 Figure 3.22: Nondimensionalized heat/mass transfer contours on turbine blade endwall at
high Reynolds number (Re = 1.42 * 105) by Goldstein and Spores (1988) 23 Figure 3.23: Nondimensionalized heat/mass transfer contours on turbine blade endwall at
low Reynolds number (Re = 8.86 * 104) by Goldstein and Spores (1988) 24 Figure 3.24: Endwall Stanton number contours by Boyle and Russell (1989) 25 Figure 3.25: Endwall Stanton number distribution by Giel et al. (1996) 26 Figure 3.26: Mean velocity vectors on the stagnation plane (see Figure 3.17) for Reex = 6.0
* 105 (top) and 1.26 * 106 (bottom) by Kang et al. (1998) 27 Figure 3.27: Stanton contours on hub endwall for Reex = 6.0 * 105 (left) and 1.26 * 106
(right) by Kang et al. (1998) 28 Figure 3.28: Hub endwall Nusselt number distribution, design condition and Mach plus
condition by Harvey et al. (1998) 29 Figure 3.29: Contours of Stanton number on the vane endwall for at left a turbulence level
of 0.6 % and at right a turbulence level of 19.5 % by Radomsky and Thole (2000) 31 Figure 3.30: Endwall limiting streamlines by Graziani et al. (1979) 32 Figure 3.31: Endwall Stanton number contours by Graziani et al. (1979) 32

Page XII Doctoral Thesis Frank G. Rubensdörffer
Figure 3.32: Nondimensionalized heat/mass transfer contours on turbine blade endwall with thick inlet boundary layer by Goldstein and Spores (1988) 33
Figure 3.33: Tested cascades and shapes of airfoils stacked lines by Wang and Han (1995) 34
Figure 3.34: Limiting streamlines on endwalls by Wang and Han (1995) 34 Figure 3.35: Leading edge fillet by Zess and Thole (2001) 35 Figure 3.36: Meridional view of half cascade with straight and divergent contoured endwall
by Duden et al. (1998) 36 Figure 3.37: Blade and meridional profile by Dossena et al. (1998) 37 Figure 3.38: Convergent endwall geometries by Shih et al. (2000) 38 Figure 3.39: Profiled endwall design by Gregory-Smith et al. (2001) 39 Figure 3.40: Hub endwall profile shapes by Chana (1992) 39 Figure 3.41: Measured hub endwall Nusselt numbers by Chana (1992) 40 Figure 3.42: Comparison of the calculated and measured wake profiles by Tominaga et al.
(1995) 41 Figure 3.43: Measured and calculated hub endwall Nusselt number distribution by Harvey
et al. (1998) 42 Figure 3.44: Stanton number distribution on endwall by Kalitzin and Iaccarino (1999) 43 Figure 3.45: Measured and calculated (v2-f turbulence model) leading edge horseshoe
vortex roll-up in stagnation plane by Hermanson et al. (2002) 44 Figure 3.46: Measured contours of Stanton number on endwall by Hermanson et al. (2002)
45 Figure 3.47: Calculated (v2-f turbulence model) contours of Stanton number on endwall by
Hermanson et al. (2002) 46 Figure 5.1: New advanced nozzle guide vane of a modern industrial gas turbine 53 Figure 5.2: Profile and Mach number distribution of the nozzle guide vane airfoil midspan
54 Figure 5.3: Schematic diagram of test facility 55 Figure 5.4: Test facility 56 Figure 5.5: Schematic diagram of the test section 57 Figure 5.6: Geometric parameters of the profile of the airfoils and the airfoil section of the
linear cascade 58 Figure 5.7: Layout of the thin film foil heater 59 Figure 5.8: Thin film foil heater 60 Figure 5.9: Tip endwall with sapphire glass viewports 61 Figure 5.10: Test section for aerodynamic tests 62 Figure 5.11: Hub endwall pressure tap distribution for aerodynamic tests 63 Figure 5.12: Airfoil pressure tap distribution 64 Figure 5.13: Instrumented airfoils 64 Figure 5.14: Measurement setup for heat transfer tests 66 Figure 5.15: Leading edge- and suction side-area infrared image of the heated hub
endwall 67 Figure 5.16: Complete hub endwall temperature distribution in Excel 68 Figure 5.17: Maximum uncertainty for Mach number 70 Figure 5.18: Mach number distribution around the left and the right airfoil in a cross section
at z = 60.0 mm 71 Figure 7.1: Computational domain for CFD calculations 79 Figure 7.2: Wedge cells in airfoil leading edge region 80 Figure 7.3: Calculated Mach number distribution around airfoil midspan for the fine and
very fine mesh 82

Doctoral Thesis Frank G. Rubensdörffer Page XIII
Figure 7.4: Hub endwall temperature distribution for the fine mesh 83 Figure 7.5: Hub endwall temperature distribution for the very fine mesh 83 Figure 8.1: Calculated and measured Mach number distribution around the airfoil in a
cross section at z = 60.0 mm 86 Figure 8.2: Calculated hub endwall Mach number distribution 86 Figure 8.3: Mach number comparison locations on hub endwall 87 Figure 8.4: Comparison of calculated and measured Mach number on hub endwall in inlet
section before the airfoils 88 Figure 8.5: Comparison of calculated and measured Mach number on hub and tip endwall
in leading edge section 89 Figure 8.6: Comparison of calculated and measured Mach number on hub endwall
between airfoil pressure and suction side 89 Figure 8.7: Comparison of calculated and measured Mach number on hub endwall after
airfoil trailing edge 90 Figure 8.8: Endwall secondary flow model by Takeishi et al. (1989) 91 Figure 8.9: Calculated streaklines on hub endwall 92 Figure 8.10: Calculated horseshoe vortex streamlines in leading edge region 93 Figure 8.11: Course of pressure and suction side leg of horseshoe vortex 93 Figure 8.12: Calculated hub endwall heat transfer distribution 94 Figure 8.13: Measured hub endwall heat transfer distribution 94 Figure 8.14: Comparison of calculated and measured Nusselt number on hub endwall in
leading edge section 96 Figure 8.15: Comparison of calculated and measured Nusselt number on hub endwall
between airfoil pressure and suction side at x = 29.5 mm 97 Figure 8.16: Comparison of calculated and measured Nusselt number on hub endwall
between airfoil pressure and suction side at x = 59.5 mm 97 Figure 8.17: Comparison of calculated and measured Nusselt number on hub endwall in
front of airfoil leading edge at y = 0.00 mm 98 Figure 8.18: Comparison of calculated and measured Nusselt number on hub endwall in
the middle between the airfoil leading edges at y = 72.75 mm 99 Figure 9.1: Hot gas path of a modern industrial gas turbine 101 Figure 9.2: Geometric variants of hub endwall geometry 102 Figure 9.3: Nusselt number distribution on hub endwall for different variants 104 Figure 9.4: Position of the velocity distribution plane at x = -5.0 mm in baseline
configuration 105 Figure 9.5: Axial velocity distribution on plane x = -5.0 mm for different variants 106 Figure 9.6: Hub endwall streaklines for combustion chamber configuration 107 Figure 9.7: Hub endwall heat transfer distribution for combustion chamber configuration
108 Figure 9.8: Hub endwall heat transfer distribution for heat shield configuration without
additional cooling air 109 Figure 9.9: Longitudinal vortex after hub heat shield 110 Figure 9.10: Development of the flank vortices 110 Figure 9.11: Development of the counter vortex 111 Figure 9.12: Streamlines of boundary layer air covering area PS 112 Figure 9.13: Hub endwall heat transfer distribution for heat shield configuration with
additional cooling air 113 Figure 9.14: Streamlines of additional cooling air leaving the heat shield cavity 114 Figure 9.15: Nozzle guide vane surface discoloration 114
Page XIV Doctoral Thesis Frank G. Rubensdörffer
Figure 9.16: Development of the passage vortex out of the heat shield cooling air and the pressure side flank vortex 115
Figure 9.17: Course of the flank vortices without and with additional heat shield cooling air 116
Figure 9.18: Hub endwall heat transfer distribution for cavity configuration without additional cooling air 117
Figure 9.19: Impingement of the pressure side boundary layer air 118 Figure 9.20: Course of the intruded cavity air 118 Figure 9.21: Streamlines of the suction side boundary layer air 119 Figure 9.22: Streamlines of the flow approaching to the airfoil leading edge 120 Figure 9.23: Hub endwall heat transfer distribution for cavity configuration with additional
cooling air 121 Figure 9.24: Course of the additional cooling air in the cavity 122 Figure 9.25: Streamlines of the additional cooling air, leaving the cavity 122 Figure 9.26: Streamlines of the boundary layer air forming the flank vortices 123 Figure 9.27: Streamlines of boundary layer air impinging on hub endwall 123 Figure 9.28: Streamlines of pressure side boundary layer air without and with additional
cavity cooling air 124

Doctoral Thesis Frank G. Rubensdörffer Page XV
LIST OF TABLES
Table 5.1: Dimensions of the profile of the airfoils and the airfoil section of the linear cascade 58
Table 5.2: Thin film heater foil specifications 59 Table 5.3: Technical characteristics of sapphire glass 60 Table 5.4: Uncertainty estimates 69 Table 7.1: Convergence criteria for flow field quantities 81 Table 7.2: Mesh specifications 82 Table 8.1: Boundary conditions for the numerical CFD calculations 85 Table 9.1: Boundary conditions for the several geometric variants 103

Page XVI Doctoral Thesis Frank G. Rubensdörffer

Doctoral Thesis Frank G. Rubensdörffer Page XVII
NOMENCLATURE
Latin letters A [mm2] Area cp [J/kgK] Specific heat capacity E [J/kg] Total energy f [1/s] Elliptic relaxation function fi [m/s2] Acceleration due to volume forces h [mm] Channel height of the airfoil section k [W/m2K] Heat transition coefficient k [m2/s2] Turbulent kinetic energy Lax [mm] Airfoil axial chord length LC [mm] Airfoil chord length m& [kg/s] Mass flow Ma [-] Mach number Nu [-] Nusselt number (based on chord length) p [Pa] Pressure Pr [-] Prandtl number q [W/m2] Heat flux Q [W] Electrical power R [J/kgK] Specific gas constant Re [-] Reynolds number (based on chord length) s [mm] Airfoil surface distance smax [mm] Total airfoil surface distance Sh [J/m3s] Energy source term St [-] Stanton number Stm [-] local mass transfer Stanton number Stmo [-] local mass transfer Stanton number for flat plate t [mm] Pitch t [s] Time T [K] Temperature TCR [(Ω/Ω)/K] Temperature coefficient of resistance u [m/s] Velocity v [m/s] Velocity v2 [m2/s2] Velocity variance scale x, X [m] Coordinate y, Y [m] Coordinate y+ [-] Non-dimensional wall distance z, Z [m] Coordinate Greek letters α [W/m2K] Heat transfer coefficient α [°] Flow angle δ [m, µm] Thickness δij [-] Kronecker delta ε [-] Surface emissivity

Page XVIII Doctoral Thesis Frank G. Rubensdörffer
ε [m2/s3] Dissipation rate Φ [-] Turbulent quantity κ [-] Ratio of specific heat λ [W/mK] Thermal conductivity µ [kg/ms] Dynamic viscosity
ρ [kg/m3] Density ρ [Ω mm2/m] Electric resistivity σ [W/m2K4] Stefan Boltzmann constant σ = 5.67*10-8 W/m2K4
τij [-] Reynolds stress tensor Subscripts cond Conductive conv Convective cool Additional cooling air ele Electrical foil Thin film heater foil in Inlet kap Kapton per Perspex rad Radiation stat Static sty Styrofoam tot Total out Outlet W Wall ∞ Bulk Others ¯ Mean value ΄ Fluctuating value

Doctoral Thesis Frank G. Rubensdörffer Page 1
1 INTRODUCTION
Modern industrial gas turbines like the SGT-800, see Figure 1.1, have to fulfil the requirements of an increasing efficiency combined with very low emissions in a robust, cost-effective way.
Figure 1.1: Modern industrial gas turbine SGT-800 from Siemens, 45.0 MW(e) Looking at the performance chart for the design of a modern industrial gas turbine, see Figure 1.2, it is obvious that the need to achieve higher total gas turbine efficiency leads to an increase of the turbine inlet temperature. To take advantage of the higher turbine inlet temperature the turbine pressure ratio also has to be increased. The trend of increasing turbine inlet temperatures started in the 1940’s with the first jet engines and continues to modern gas turbines, see Figure 1.3.
Figure 1.2: Performance chart of a modern industrial gas turbine by Genrup (2005)

Page 2 Doctoral Thesis Frank G. Rubensdörffer
Figure 1.3: Advance of material and cooling technology (Source: Royal Aeronautical Society / Aerospace 1994) As it can be recognized from Figure 1.3, the increase in turbine inlet temperature has proceeded much faster than the progress in the development of more advanced vane and blade materials. Indeed turbine inlet temperature levels exceeded maximum tolerable material temperature by several hundred K starting in the 1960’s, and this trend has continued since ever. This condition is realizable only through the application of advanced vane and blade cooling technology to keep the material temperature below the allowable, lifetime-limiting level. Presently up to 25 % of the total gas turbine mass flow is used to cool the critical hot gas turbine components. This requirement contradicts the objective of gas turbine efficiency maximisation in three ways. First the re-entering of the cooling air into the hot gas path in the turbine generates aerodynamic losses when the cold cooling air interacts with the high-enthalpy, complex, three-dimensional vane and blade flow field. Second the extraction of the cooling air from the compressor, bypassing the combustion chamber inhibits that additional energy can be added to the compressed air in the combustion chamber. Third the bypassing of cooling air aside parts of the turbine leads to a lower mass flow through the expanding parts of the turbine, where the high-enthalpy air should perform work. Thus it is critical that vane and blade cooling technology is optimised for ensuring high efficiencies with maintained hot component lifetimes. The requirement of very low emissions leads to the application of dry low NOX combustion chambers with lean premixed combustion. These combustion chambers are often convectively cooled. All air from the compressor, including the combustion chamber cooling air passes through the combustion chamber to lower the maximum combustion temperature level so that thermal NOX formation is minimized. This leads to a rather flat temperature profile to the turbine nozzle guide vane, i.e. there are rather small differences between the maximum centreline temperature and the minimum temperature at hub and
Doctoral Thesis Frank G. Rubensdörffer Page 3
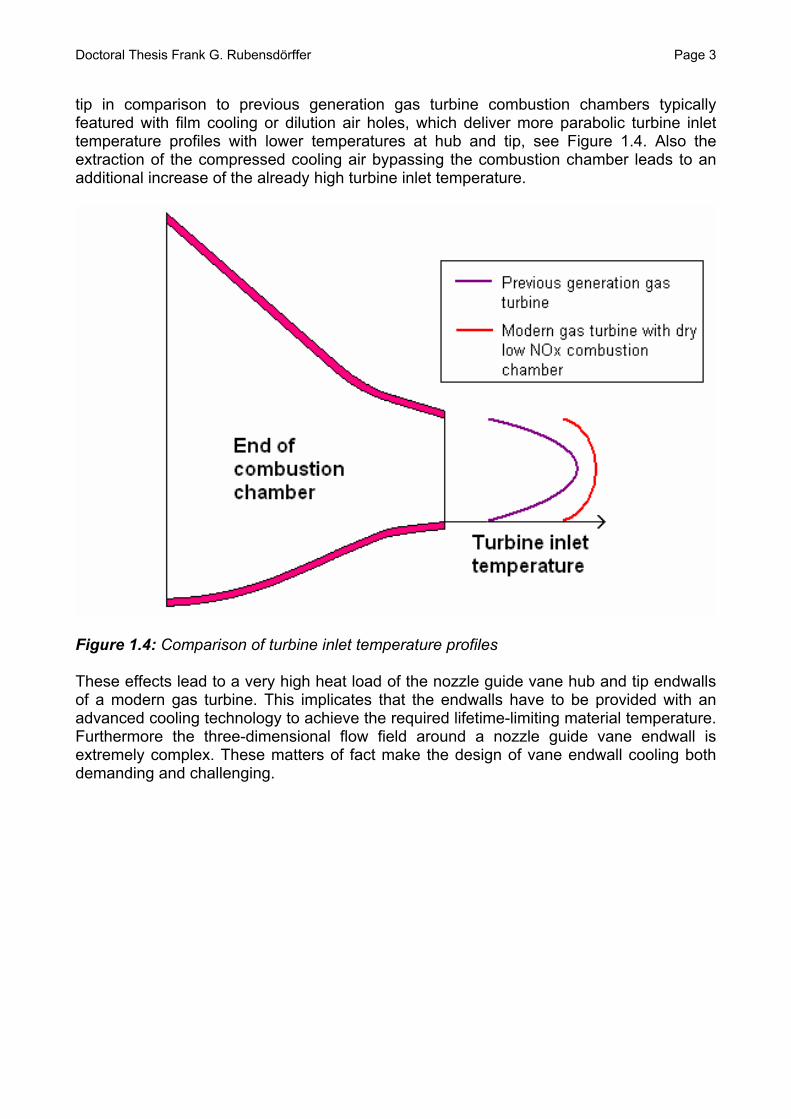
tip in comparison to previous generation gas turbine combustion chambers typically featured with film cooling or dilution air holes, which deliver more parabolic turbine inlet temperature profiles with lower temperatures at hub and tip, see Figure 1.4. Also the extraction of the compressed cooling air bypassing the combustion chamber leads to an additional increase of the already high turbine inlet temperature.
Figure 1.4: Comparison of turbine inlet temperature profiles These effects lead to a very high heat load of the nozzle guide vane hub and tip endwalls of a modern gas turbine. This implicates that the endwalls have to be provided with an advanced cooling technology to achieve the required lifetime-limiting material temperature. Furthermore the three-dimensional flow field around a nozzle guide vane endwall is extremely complex. These matters of fact make the design of vane endwall cooling both demanding and challenging.

Page 4 Doctoral Thesis Frank G. Rubensdörffer

Doctoral Thesis Frank G. Rubensdörffer Page 5
2 OBJECTIVES
The prediction of the nozzle guide vane endwall heat transfer is crucial for the engineering task of the design layout of the vane endwall cooling system. The calculation and design tools commonly used in the industry are mostly based on two-dimensional boundary layer theory approaches, which cannot take into account the three-dimensional characteristics of the vane flow field and endwall heat transfer and therefore contain an undesirable inaccurateness. Also time-consuming experimental approaches cannot be used as a design tool, but only for the verification of single specific designs. Thus there is a strong need for a new, advanced design tool, based on real physical phenomena. Therefore the principal objective of this research work is to create in-depth knowledge of the influence of several geometric variants of the flow path design between the combustion chamber and the nozzle guide vane on the vane flow field and endwall heat transfer, in order to understand the physical mechanisms and effects defining nozzle guide vane endwall heat transfer. This research area is very determining for the whole endwall heat transfer and has hardly been investigated in the open literature. A complementary objective of the present work is to provide new guidelines for an optimum design layout of the nozzle guide vane endwall configuration. The fulfilment of this objective contributes to the ability to apply an optimized endwall cooling system to ensure that the maximum lifetime-limiting material design temperatures of the nozzle guide vane endwall are not exceeded, with a minimized consumption of cooling air in order to increase the overall efficiency of the modern industrial gas turbine. Another objective of the current research work is to find and validate an applicable tool for the reliable calculation of nozzle guide vane endwall heat transfer This kind of numerical tool with an appropriate advanced turbulence model based on real physical phenomena has to be validated against several vane geometries to secure that it is not tuned to a special vane geometry. Therefore the validation of the chosen turbulence model is carried out for a less advanced nozzle guide vane geometry in a collaboration work within this project and for the geometry of an advanced nozzle guide vane of a modern industrial gas turbine against investigations in a new test rig within this research work.

Page 6 Doctoral Thesis Frank G. Rubensdörffer
Doctoral Thesis Frank G. Rubensdörffer Page 7
3 STATE OF THE ART OF VANE ENDWALL HEAT TRANSFER RESEARCH
A vast amount of research has been performed in the area of vane secondary flow field phenomena and endwall heat transfer. This overview concentrates first on the fundamental research work. After that, focus is turned to investigations that are primary engaged in the influence of the flow field characteristics and the geometric parameters on the vane endwall heat transfer. To cover completely the large amount of significant research work which is dealing only with the vane secondary flow field would go beyond the scope of this work. An extensive review on this research area is given by Sieverding (1984, 2004) 3.1 Fundamental geometric investigations
The elementary flow field of a vane passage consists of the flow around the leading edge and the flow field in the passage between the airfoils. Additional secondary flow effects, which occur due to the combination of these two basic flow patterns and the effects of the trailing edge, contribute additionally to the complexity of the flow situation. 3.1.1 Classical secondary flow model
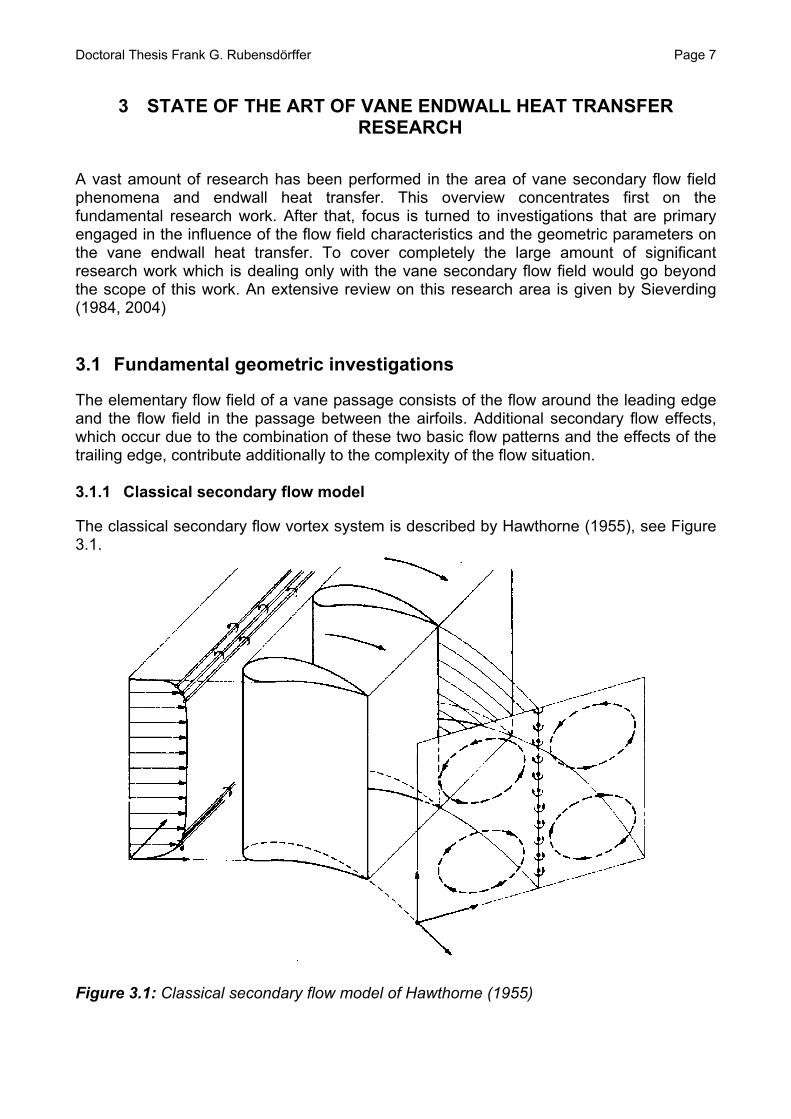
The classical secondary flow vortex system is described by Hawthorne (1955), see Figure 3.1.
Figure 3.1: Classical secondary flow model of Hawthorne (1955)

Page 8 Doctoral Thesis Frank G. Rubensdörffer
It consists of a flow with endwall boundary layers approaching the vane passage. After passing the vane passage consisting of the airfoils and the endwalls the flow pattern consists of a large passage vortex and smaller counterrotating trailing edge filament vortices. The passage vortex arises from forces caused by the curvature-induced inertia of the undisturbed part of the flow in the midspan region and forces due to the pressure gradient between pressure and suction side on the low velocity flow in the endwall boundary layer. In this model, no further secondary flow features are specifically mentioned. 3.1.2 Leading edge flow
Bölcs (1969) demonstrated the analogy of the behaviour of a flow approaching an airfoil leading edge with a flow with boundary layer approaching a cylinder, see Figure 3.2 and Figure 3.3.
Figure 3.2: Formation of a water flow around a cylinder from Bölcs (1969)

Doctoral Thesis Frank G. Rubensdörffer Page 9
Figure 3.3: Qualitative behaviour of a flow in a boundary layer and a flow close to free surface approaching a cylinder (Bölcs 1969) An undisturbed boundary layer flow approaches a cylinder. Due to pressure gradients, the boundary layer rolls up and divides into two legs on either side of the cylinder. This flow pattern is called horseshoe vortex because of its particular shape. The separation saddle point and the endwall separation lines occur due to the secondary boundary layer flow field on the endwall. 3.1.3 Flow passage between the airfoils
The examination of the flow passage between the vane airfoils and the hub and tip endwalls without the influence of the horseshoe vortex can be carried out in a curved duct, see Blair, 1974; Boyle and Hoose, 1989; Khalatov, 1998. The combination of centrifugal forces in the freestream area and the traversal pressure gradient in the boundary layer create the large three-dimensional passage vortex. Shortly after the beginning of the curved duct in the junction between the endwall and the suction side, a small counterrotating corner vortex appears, induced by the viscous interaction within the passage vortex. These flow patterns can be seen in Figure 3.4.

Page 10 Doctoral Thesis Frank G. Rubensdörffer
Figure 3.4: Flow pattern in curved duct by Khalatov (1998) The impact of the flow patterns on the endwall heat transfer distribution can be seen in Figure 3.5. In the beginning of the duct the heat transfer shows a decrease due to the increase of the thickness of the incoming turbulent boundary layer. Then flow accelerates in the curved duct and comes into the influence of the passage vortex, which leads to an increase of the heat transfer. The counterrotating corner vortex in the junction between the endwall and the airfoil suction side leads to an increasing heat transfer in that area.

Doctoral Thesis Frank G. Rubensdörffer Page 11
Figure 3.5: Endwall heat transfer distribution for a curved duct by Blair (1974) 3.1.4 Complete 3D secondary flow model
Langston (1980) presents a complete three-dimensional secondary flow vortex model, which can be seen in Figure 3.6. This model implies an inlet boundary layer approaching to the leading edge, forming the horseshoe vortex. The horseshoe vortex consists of the rolling up of the incoming boundary layer in front of the leading edge, the pressure side

Page 12 Doctoral Thesis Frank G. Rubensdörffer
and a suction side leg which develop from the leading edge vortex dividing at the separation saddle point. The suction side leg stays in the junction between endwall and airfoil and becomes the counter vortex. The pressure side leg migrates behind the separation line over from the pressure side to the next suction side due to the traversal pressure gradient and merges with and becomes a part of the large passage vortex.
Figure 3.6: Endwall flow pattern by Langston (1980) In summary, this model combines the effects of the leading edge flow, the flow in the passage between the airfoils and the classical secondary flow model. The model has been evaluated from the measurements of Langston et al. (1977). In Figure 3.7, the limiting streamlines on the endwall, which are a result of the described secondary flow pattern, are shown.

Doctoral Thesis Frank G. Rubensdörffer Page 13
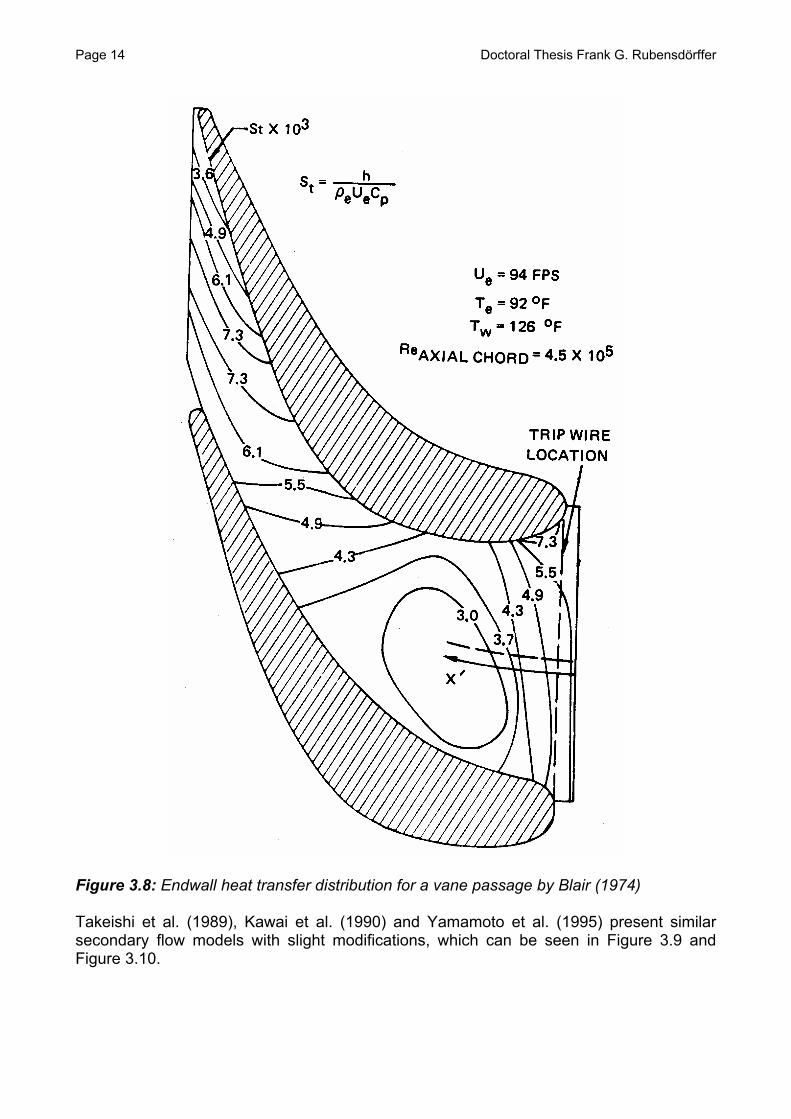
Figure 3.7: Limiting streamlines on endwall by Langston et al. (1977) The separation saddle point SS1, the attachment line a1-a2 and the two separation lines SS1-s1 and SS1-s2 can clearly be seen. Blair (1974), Boyle and Hoose (1989) and Khalatov (1998) use similar secondary flow models to describe the flow phenomena. In Figure 3.8 the heat transfer pattern for the complete vane passage is illustrated. In comparison to the curved duct, in the complete vane passage a horseshoe vortex emerges, which leads to an increased heat transfer in the leading edge region.
Page 14 Doctoral Thesis Frank G. Rubensdörffer
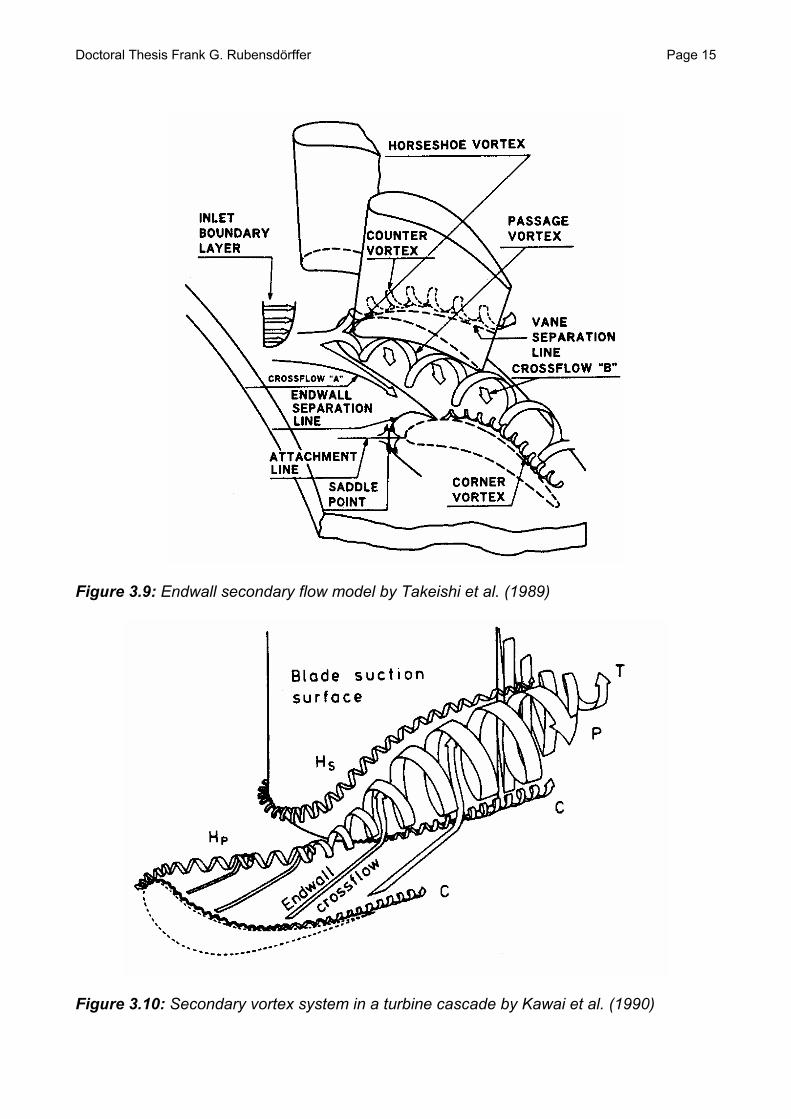
Figure 3.8: Endwall heat transfer distribution for a vane passage by Blair (1974) Takeishi et al. (1989), Kawai et al. (1990) and Yamamoto et al. (1995) present similar secondary flow models with slight modifications, which can be seen in Figure 3.9 and Figure 3.10.
Doctoral Thesis Frank G. Rubensdörffer Page 15
Figure 3.9: Endwall secondary flow model by Takeishi et al. (1989)
Figure 3.10: Secondary vortex system in a turbine cascade by Kawai et al. (1990)

Page 16 Doctoral Thesis Frank G. Rubensdörffer
Figure 3.11 shows the heat transfer distribution on a vane passage endwall with the increased heat transfer in the leading edge region caused by the horseshoe vortex, increased heat transfer along the separation line and in the airfoil wake region.
Figure 3.11: Endwall heat transfer distribution for a vane passage by Takeishi et al. (1989) Similar results have been obtained by Harvey and Jones (1990) and Nicklas (2001). They confirmed the presented heat transfer distribution with an area of high heat transfer in the leading edge region due to the horseshoe vortex, an increase in heat transfer in the channel flow due to the accelerating of the flow, and increased heat transfer in the trailing edge region. To confirm the occurrence of the secondary flow field structures presented in the secondary flow field models flow field visualisation techniques have been applied by Gaugler and Russell (1980), Sonoda (1985), Harrison (1989), Tominaga et al. (1995) and Friedrichs et al. (1998). The oilflow distributions, shown in Figure 3.12 and in Figure 3.13 reflect definitely the consequences and effects of the secondary flow patterns like horseshoe vortex, endwall separation lines, endwall cross flow and passage vortex.

Doctoral Thesis Frank G. Rubensdörffer Page 17
Figure 3.12: Oilflow presentation of the endwall and blade surface flow by Tominaga et al. (1995)
Figure 3.13: Oil and dye surface flow on the endwall by Friedrichs (1998)

Page 18 Doctoral Thesis Frank G. Rubensdörffer
Sharma and Butler (1986), Goldstein and Spores (1988) and Wang et al. (1995) present more complex secondary flow models, shown in Figure 3.14 to Figure 3.16.
Figure 3.14: Cascade endwall flow structure by Sharma and Butler (1986)
Figure 3.15: Three-dimensional flow field in the endwall region by Goldstein and Spores (1988)

Doctoral Thesis Frank G. Rubensdörffer Page 19
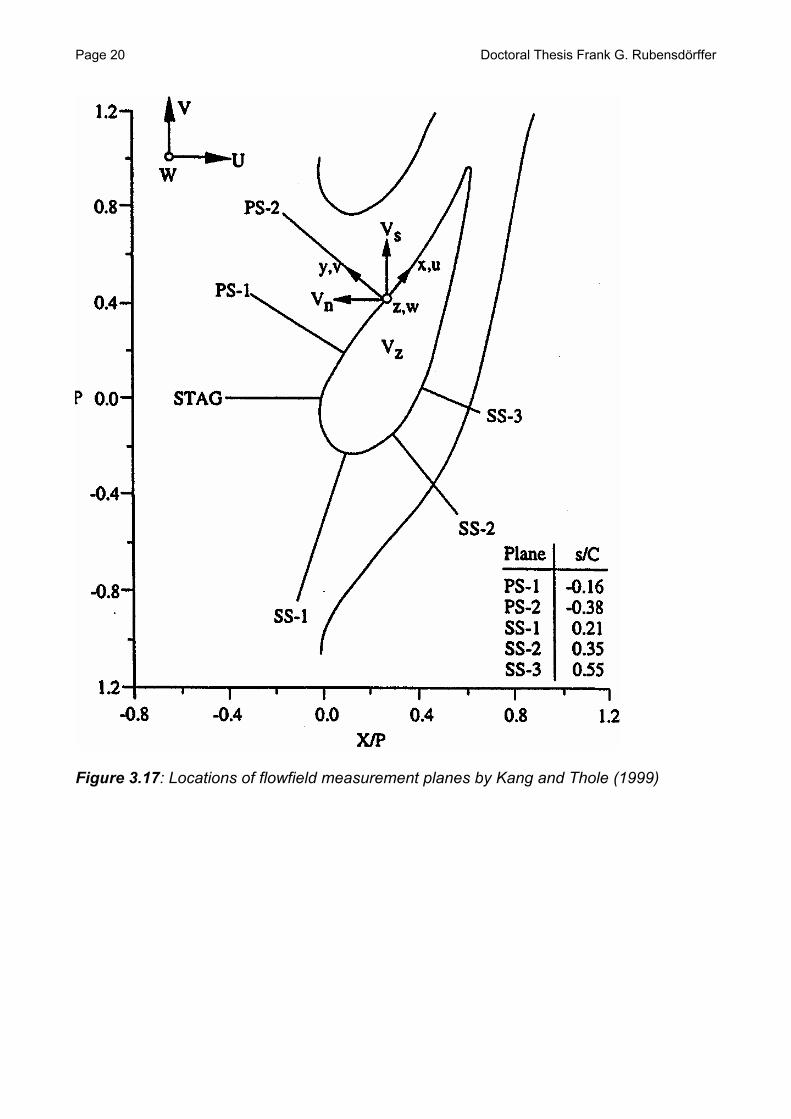
Figure 3.16: Interpretation of the vortex flow pattern by Wang et al. (1995) The main features are the same as in the simple models. The models differ mainly in the propagation of the suction side leg of the horseshoe vortex in the vicinity of the passage vortex. Also, the origin and the number of the small counterrotating corner vortices varies. All models exaggerate the rate of rotation of the vortices. This means that especially the major passage vortex performs much less rotations compared to the illustration. Another possibility to verify the occurrence of the secondary flow field is detailed flow field measurements with LDV, made by Kang and Thole (1999) in six planes in the leading edge region and in the beginning of pressure and suction side. The positions of the measurement planes and the velocity distributions are shown in Figure 3.17 - Figure 3.21. Here the appearance of the horseshoe vortex and the propagation of the suction and pressure side leg are clearly documented. These measurements give a very detailed quantitative documentation of the secondary flow effects and show evidence of the low rate of rotation of the secondary vortices, especially for the passage vortex. The occurrence of the small counterrotating corner vortices however could not be verified.
Page 20 Doctoral Thesis Frank G. Rubensdörffer
Figure 3.17: Locations of flowfield measurement planes by Kang and Thole (1999)

Doctoral Thesis Frank G. Rubensdörffer Page 21
Figure 3.18: Velocity distribution on the stagnation plane by Kang and Thole (1999)
Figure 3.19: Velocity distribution on the PS-1 and PS-2 plane by Kang and Thole (1999)

Page 22 Doctoral Thesis Frank G. Rubensdörffer
Figure 3.20: Velocity distribution on the SS-1 plane by Kang and Thole (1999)
Figure 3.21: Velocity distribution on the SS-2 and SS-3 plane by Kang and Thole (1999)

Doctoral Thesis Frank G. Rubensdörffer Page 23
3.1.5 Summary
The secondary flow field of an undisturbed flow approaching the airfoil of a nozzle guide vane is detailed documented in the open literature with its principle components horseshoe vortex with pressure and suction side leg, passage vortex and small counterrotating corner vortices. The influence of these secondary flow field components on the vane endwall heat transfer is significant and decisive. That means that the horseshoe vortex and the passage vortex mainly determine the vane endwall heat transfer. The influence of the small counterrotating corner vortices on the vane endwall heat transfer however is not proved by experiments. 3.2 Variation of characteristic flow numbers
3.2.1 Variation of Reynolds number
Goldstein and Spores (1988) investigate the influence of the Reynolds number on endwall heat transfer by using naphthalene sublimation technique founded on the heat-mass transfer analogy.
Figure 3.22: Nondimensionalized heat/mass transfer contours on turbine blade endwall at high Reynolds number (Re = 1.42 * 105) by Goldstein and Spores (1988)

Page 24 Doctoral Thesis Frank G. Rubensdörffer
Figure 3.23: Nondimensionalized heat/mass transfer contours on turbine blade endwall at low Reynolds number (Re = 8.86 * 104) by Goldstein and Spores (1988) The decrease of the Reynolds number has nearly no influence on the endwall heat transfer (Stanton number distribution) with the exception of the trailing edge wake region, where a significant decrease of the heat transfer can be observed, probably due to the larger stagnation zone behind the trailing edge, compare Figure 3.22 and Figure 3.23. Similar results have been found by Kumar et al. (1985), who evaluated the extensive database of York et al. (1982) that contains endwall heat transfer data under conditions simulating those of a inlet guide vane in an advanced gas turbine. Wedlake et al. (1988), Harasgama and Wedlake (1990) and Harvey et al. (1998) carried out measurements of endwall heat transfer with a coarse measurement grid without resolution of local effects. Their results show an expected increase of the endwall Nusselt number distribution with increasing Reynolds number. Harvey et al. (1998) stated that the heat transfer rate roughly correlates with the Reynolds number ratio to the power of 0.8, which supports the assumption of fully turbulent end wall boundary layers. Blair (1992) reported a slight increase of the heat transfer in the beginning of the flow passage with increasing Reynolds number due to earlier transition of the boundary layer. Further downstream, the heat transfer decreases at higher Reynolds numbers because of the thicker turbulent boundary layer. Again, higher heat transfer in the trailing edge wake region at the lower Reynolds number can be observed. Boyle and Russell (1989) investigated endwall heat transfer for a wide range of Reynolds numbers, see Figure 3.24. The average endwall Stanton number is not so much affected by the variation of the Reynolds number. In the free stream, it is close to St ~ Re-0.2. In contrast, the local heat transfer pattern is strongly affected by the variation of the Reynolds number. A significant change in the local heat transfer pattern occurs at approximately Re = 1.65 * 105. For lower Reynolds numbers the heat transfer contours tend to follow the inviscid streamlines and then deflect towards the suction side. For lower Reynolds numbers, the secondary flow from pressure towards suction side occurs to a greater

Doctoral Thesis Frank G. Rubensdörffer Page 25
degree. At higher Reynolds numbers, the Stanton number distribution reflects the influence of the local free stream velocity.
Figure 3.24: Endwall Stanton number contours by Boyle and Russell (1989) Similar effects were determined by Giel et al. (1996), see Figure 3.25.

Page 26 Doctoral Thesis Frank G. Rubensdörffer
Figure 3.25: Endwall Stanton number distribution by Giel et al. (1996)

Doctoral Thesis Frank G. Rubensdörffer Page 27
The decrease of the Stanton number due to the increasing Reynolds number exceeds the expected increase from assuming St ~ Re-0.2 in the free flow area. Further downstream, the minimum Stanton number region moves from the middle of the flow channel closer to the pressure side for increasing Reynolds number. The Reynolds number effects are more pronounced at lower turbulence intensity.
Figure 3.26: Mean velocity vectors on the stagnation plane (see Figure 3.17) for Reex = 6.0 * 105 (top) and 1.26 * 106 (bottom) by Kang et al. (1998)
Page 28 Doctoral Thesis Frank G. Rubensdörffer
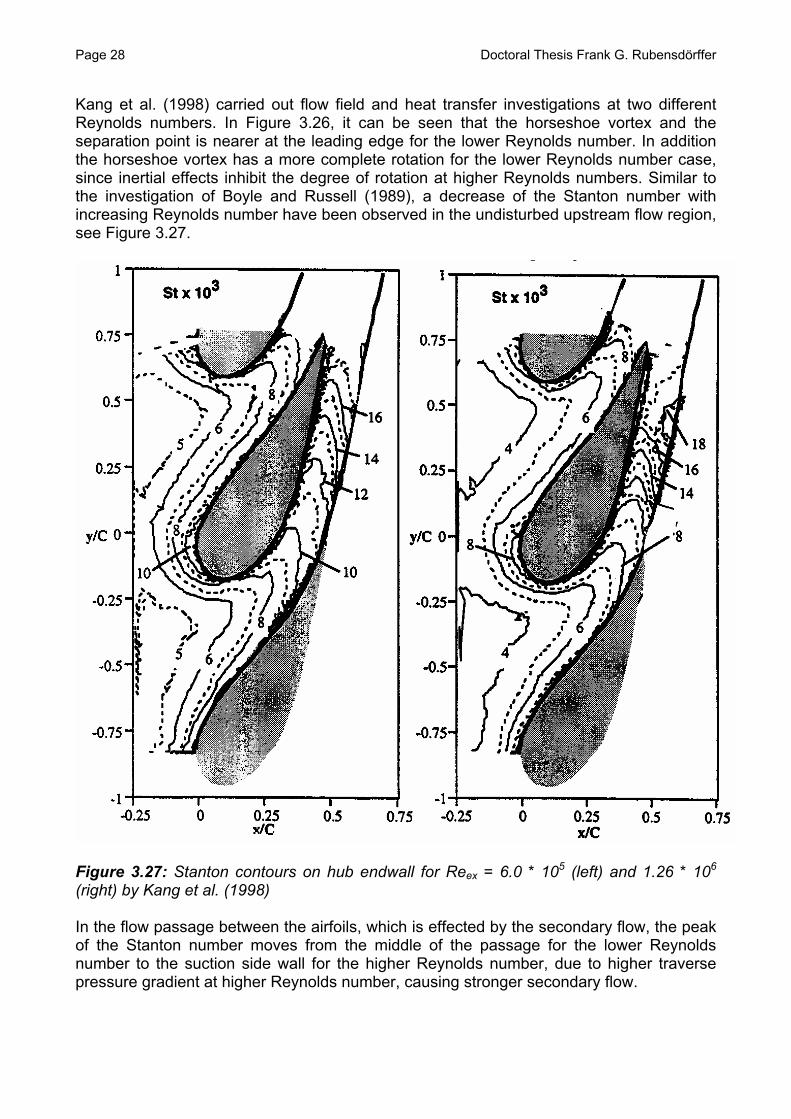
Kang et al. (1998) carried out flow field and heat transfer investigations at two different Reynolds numbers. In Figure 3.26, it can be seen that the horseshoe vortex and the separation point is nearer at the leading edge for the lower Reynolds number. In addition the horseshoe vortex has a more complete rotation for the lower Reynolds number case, since inertial effects inhibit the degree of rotation at higher Reynolds numbers. Similar to the investigation of Boyle and Russell (1989), a decrease of the Stanton number with increasing Reynolds number have been observed in the undisturbed upstream flow region, see Figure 3.27.
Figure 3.27: Stanton contours on hub endwall for Reex = 6.0 * 105 (left) and 1.26 * 106 (right) by Kang et al. (1998) In the flow passage between the airfoils, which is effected by the secondary flow, the peak of the Stanton number moves from the middle of the passage for the lower Reynolds number to the suction side wall for the higher Reynolds number, due to higher traverse pressure gradient at higher Reynolds number, causing stronger secondary flow.

Doctoral Thesis Frank G. Rubensdörffer Page 29
3.2.2 Variation of exit Mach number
Perdichizzi (1989) performed aerodynamic measurements of loss contours, vorticity contours and secondary velocity vectors in 4 consecutive exit planes at various exit Mach numbers in the range from Maex = 0.32 to 1.38 to determine the influence of the exit Mach number on the secondary flow field. For an exit Mach number of 0.32, a large passage vortex, the wake behind the trailing edge and a corner vortex are identified. Large losses are caused by the wake and the corner vortex and smaller losses are caused by the passage vortex in the plane directly downstream of the blades. The passage vortex decays further down in the flow field as shown by the decaying loss contours and the loss core moves from suction side to the middle of the channel. At an increased Mach number of 0.92, the passage vortex moves closer to endwall and the loss level decreases. An additional increase of the Mach number leads to supersonic flow. The secondary flow field is rather distorted due to shocks. There are additional and determining losses due to the shock waves.
Figure 3.28: Hub endwall Nusselt number distribution, design condition and Mach plus condition by Harvey et al. (1998)
Page 30 Doctoral Thesis Frank G. Rubensdörffer
Kumar et al. (1985) found that the increase of the exit Mach number has little impact on the vane endwall heat transfer. Primary changes occur in the trailing edge and wake region. In the downstream part of the flow channel between the airfoils the increasing exit Mach number leads to a slight decrease of the endwall heat transfer. Similar results have been shown by Giel et al. (1996), see Figure 3.25 along with Harasgama and Wedlake (1990) and Harvey et al. (1998), see Figure 3.28. 3.2.3 Variation of turbulence intensity
Gregory-Smith and Cleak (1990) carried out aerodynamic measurements in a cascade without and with a turbulence grid to evaluate the influence of the turbulence level on secondary flow and losses. The results show that the turbulence level has little effect on the secondary loss or the kinetic energy of the secondary flow despite the fact that the higher inlet turbulence leads to a reduction of the inlet boundary layer thickness which leads to somewhat smaller vortices in the secondary flow. In the analysis of the heat transfer data of York et al. (1982), Kumar et al. (1985) stated that the turbulence intensity only influences the leading edge part of the endwall. Similar results were evaluated by Giel et al. (1996), see Figure 3.25. The higher turbulence level affects mostly the region in front of the vanes in the horseshoe vortex path. In addition, the peak heat transfer levels are lower at higher turbulence levels. In the leading edge region the reduction of heat transfer caused by reduced secondary flow resulting from the thinner inlet boundary layer at the higher turbulence level overshadows the increase of the heat transfer due to increased turbulence. Further downstream, the heat transfer pattern is nearly independent of the inlet turbulence level. This is because vortices from the secondary flow field scour the endwall independently of the inlet turbulence level. Downstream of the vortices, the free stream turbulence level is increased to a certain level and the influence of the thick boundary layer for the low turbulence case is eliminated. Radomsky and Thole (2000a, 2000b) compared the effects of low turbulence level (0.6 %) to very high turbulence level (19.5 %) on the flow field and on endwall heat transfer. A look at the flow field shows that the inlet boundary layer is thinner and the horseshoe vortex moves closer to the leading edge for the higher inlet turbulence level. There is a more complete roll-up of the horseshoe vortex for the lower freestream turbulence case. The impact of those features on the endwall heat transfer can be seen in Figure 3.29. As a result of the higher inlet turbulence, higher values of the Stanton number can be observed throughout the whole vane endwall because of the large difference between the low and high turbulence level. In the leading edge region, the gradient of the Stanton number isolines is higher for the high turbulence level. Further downstream to the trailing edge region, the two heat transfer patterns are very similar. The heat transfer in this region is mainly dominated by the secondary flow field rather than by the inlet turbulence level.

Doctoral Thesis Frank G. Rubensdörffer Page 31
Figure 3.29: Contours of Stanton number on the vane endwall for at left a turbulence level of 0.6 % and at right a turbulence level of 19.5 % by Radomsky and Thole (2000) 3.2.4 Summary
The influence of the Reynolds number is minor on the average endwall heat transfer. In the sphere of influence of the free stream the dependency is close to St ~ Re-0.2. The Reynolds number has a major influence in the stagnation zone, in the zones where the boundary layer is influenced by the Reynolds number and in the trailing edge zone, where a higher Reynolds number leads to a higher heat transfer. The influence of the Reynolds number on the heat transfer is higher at lower turbulence levels. The exit Mach number has a low impact on the endwall heat transfer. Primary changes occur in the flow path exit region. An increase of the exit Mach number leads to a slight decrease of the endwall heat transfer in the downstream part of the flow channel. The inlet turbulence level has a low impact on the secondary flow field and a very low influence on the endwall heat transfer. The inlet turbulence level affects mostly the leading edge region in front of the vanes, where the heat transfer decreases. In all other regions only a large increase of the inlet turbulence level can lead to an increase of the endwall heat transfer.

Page 32 Doctoral Thesis Frank G. Rubensdörffer
3.3 Variation of inlet boundary layer thickness
Graziani et al. (1979) investigated the influence of the inlet boundary layer thickness on the flow field in a vane passage, see Figure 3.30, and on the endwall heat transfer, see Figure 3.31.
Figure 3.30: Endwall limiting streamlines by Graziani et al. (1979) For the thinner inlet boundary layer the saddle point moves further downstream and closer to the pressure side. An apparent reduction in the severity of the crossflow behind the endwall separation line for the thinner inlet boundary layer can also be observed.
Figure 3.31: Endwall Stanton number contours by Graziani et al. (1979) A comparison of the heat transfer pattern on the endwalls shows that the area of the influence of the horseshoe vortex is larger for the thick inlet boundary layer. However, the maximum and minimum value of heat transfer are nearly the same for both inlet boundary layers. Also in the entrance region the average value of the heat transfer is hardly affected despite the large difference in the inlet boundary layer thickness. Further downstream, the influence of the vortex pattern can clearly be seen in the heat transfer pattern for the thick
Doctoral Thesis Frank G. Rubensdörffer Page 33
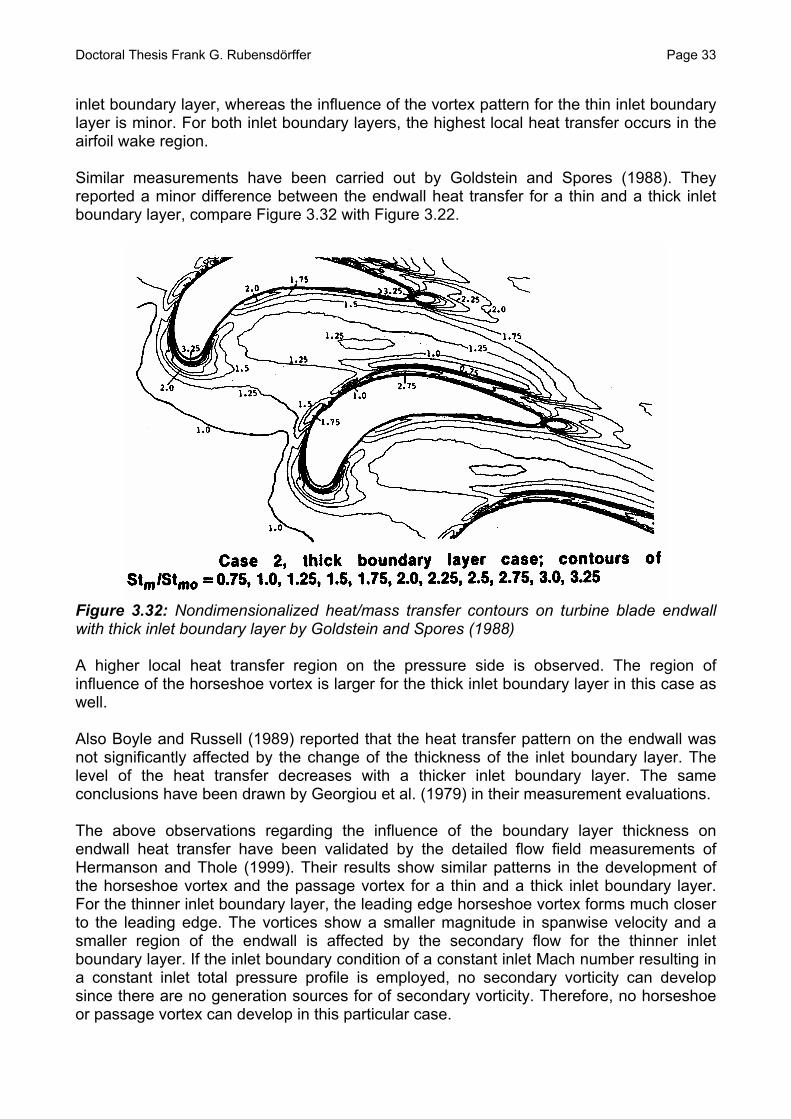
inlet boundary layer, whereas the influence of the vortex pattern for the thin inlet boundary layer is minor. For both inlet boundary layers, the highest local heat transfer occurs in the airfoil wake region. Similar measurements have been carried out by Goldstein and Spores (1988). They reported a minor difference between the endwall heat transfer for a thin and a thick inlet boundary layer, compare Figure 3.32 with Figure 3.22.
Figure 3.32: Nondimensionalized heat/mass transfer contours on turbine blade endwall with thick inlet boundary layer by Goldstein and Spores (1988) A higher local heat transfer region on the pressure side is observed. The region of influence of the horseshoe vortex is larger for the thick inlet boundary layer in this case as well. Also Boyle and Russell (1989) reported that the heat transfer pattern on the endwall was not significantly affected by the change of the thickness of the inlet boundary layer. The level of the heat transfer decreases with a thicker inlet boundary layer. The same conclusions have been drawn by Georgiou et al. (1979) in their measurement evaluations. The above observations regarding the influence of the boundary layer thickness on endwall heat transfer have been validated by the detailed flow field measurements of Hermanson and Thole (1999). Their results show similar patterns in the development of the horseshoe vortex and the passage vortex for a thin and a thick inlet boundary layer. For the thinner inlet boundary layer, the leading edge horseshoe vortex forms much closer to the leading edge. The vortices show a smaller magnitude in spanwise velocity and a smaller region of the endwall is affected by the secondary flow for the thinner inlet boundary layer. If the inlet boundary condition of a constant inlet Mach number resulting in a constant inlet total pressure profile is employed, no secondary vorticity can develop since there are no generation sources for of secondary vorticity. Therefore, no horseshoe or passage vortex can develop in this particular case.
Page 34 Doctoral Thesis Frank G. Rubensdörffer
3.4 Variation of the geometry
3.4.1 Variation of the airfoil geometry
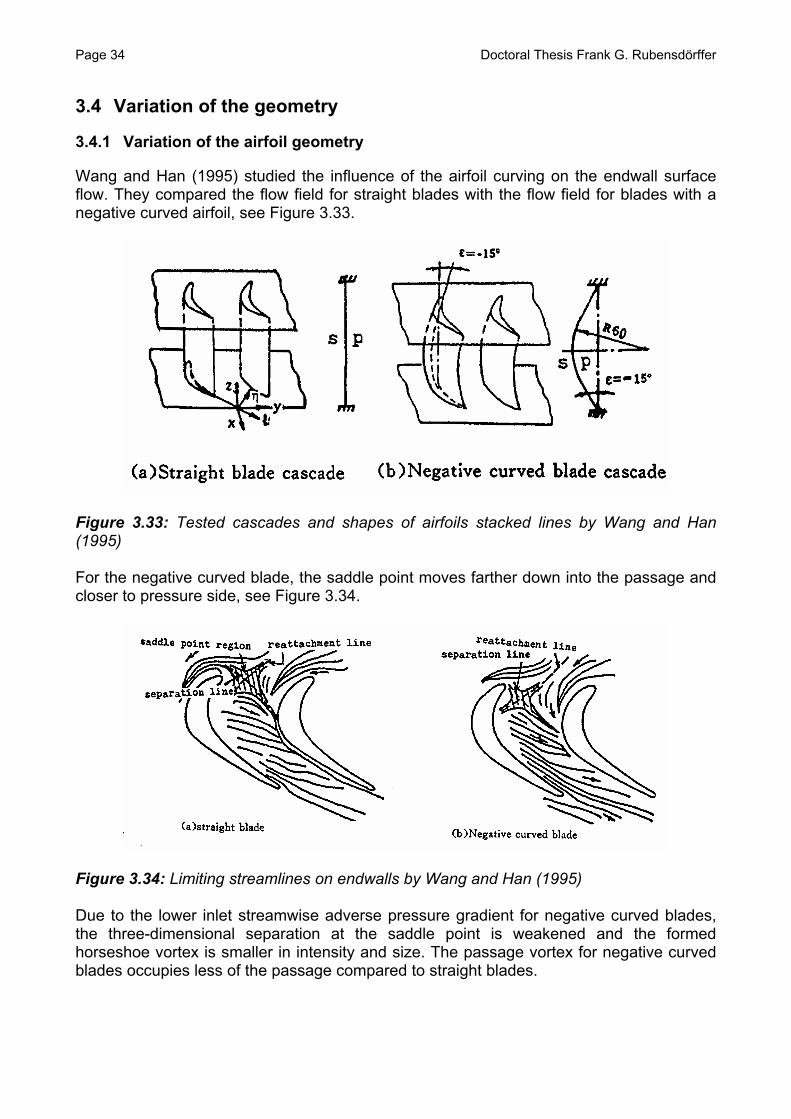
Wang and Han (1995) studied the influence of the airfoil curving on the endwall surface flow. They compared the flow field for straight blades with the flow field for blades with a negative curved airfoil, see Figure 3.33.
Figure 3.33: Tested cascades and shapes of airfoils stacked lines by Wang and Han (1995) For the negative curved blade, the saddle point moves farther down into the passage and closer to pressure side, see Figure 3.34.
Figure 3.34: Limiting streamlines on endwalls by Wang and Han (1995) Due to the lower inlet streamwise adverse pressure gradient for negative curved blades, the three-dimensional separation at the saddle point is weakened and the formed horseshoe vortex is smaller in intensity and size. The passage vortex for negative curved blades occupies less of the passage compared to straight blades.

Doctoral Thesis Frank G. Rubensdörffer Page 35
Similar studies have been carried out by Wang et al. (2001), who examined positively bowed blades in a cascade. Here, the saddle point moves upstream and towards next suction side towards middle of blade passage for the positively bowed blade. The positively bowed blades stabilise the passage vortex structure, which leads to a decrease of the secondary losses. 3.4.2 Variation of the leading edge geometry
Sauer et al. (2000) analysed the influence of different leading edge bulbs on the secondary flow. They found a considerable reduction of the secondary flow losses with an asymmetric bulb that had a pronounced suction side and a less extended pressure side. This bulb intensifies the suction side branch of the horseshoe vortex in the endwall region, which is counter-rotating to the secondary channel vortex. As a result, the secondary channel vortex is moved away from the suction side profile boundary layer and is deformed. This mechanism results in a considerable reduction of the endwall losses. Zess and Thole (2001) used a leading edge fillet to prevent the formation of the horseshoe vortex. Various fillet geometries have been tested to fulfil this design task. The final fillet, which can be seen in Figure 3.35, has a length of two boundary layer thicknesses and a height of one boundary layer thickness. It is asymmetric and has an elliptical shape.
Figure 3.35: Leading edge fillet by Zess and Thole (2001) With this fillet on the pressure side, the horseshoe vortex is eliminated and the development of the passage vortex is delayed and the passage vortex is not fully developed. The influence of the fillet on suction side can be noted by less crossflow connected to a less distinctive passage vortex. The turbulent kinetic energy levels decreased significantly with the leading edge fillet in the leading edge region and on suction and pressure side. Both investigations showed, that the secondary flow field is very sensitive for geometrical or flow field changes in the leading edge region.

Page 36 Doctoral Thesis Frank G. Rubensdörffer
3.4.3 Variation of the endwall geometry
Duden et al. (1998) investigated the possibilities to control the secondary flow by endwall contouring. They stated that a decreasing of the radial pressure gradient toward the midspan on airfoil suction side obstructs radial movement of secondary flow. This can be achieved by lowering the pressure level at the endwall via endwall contouring, see Figure 3.36.
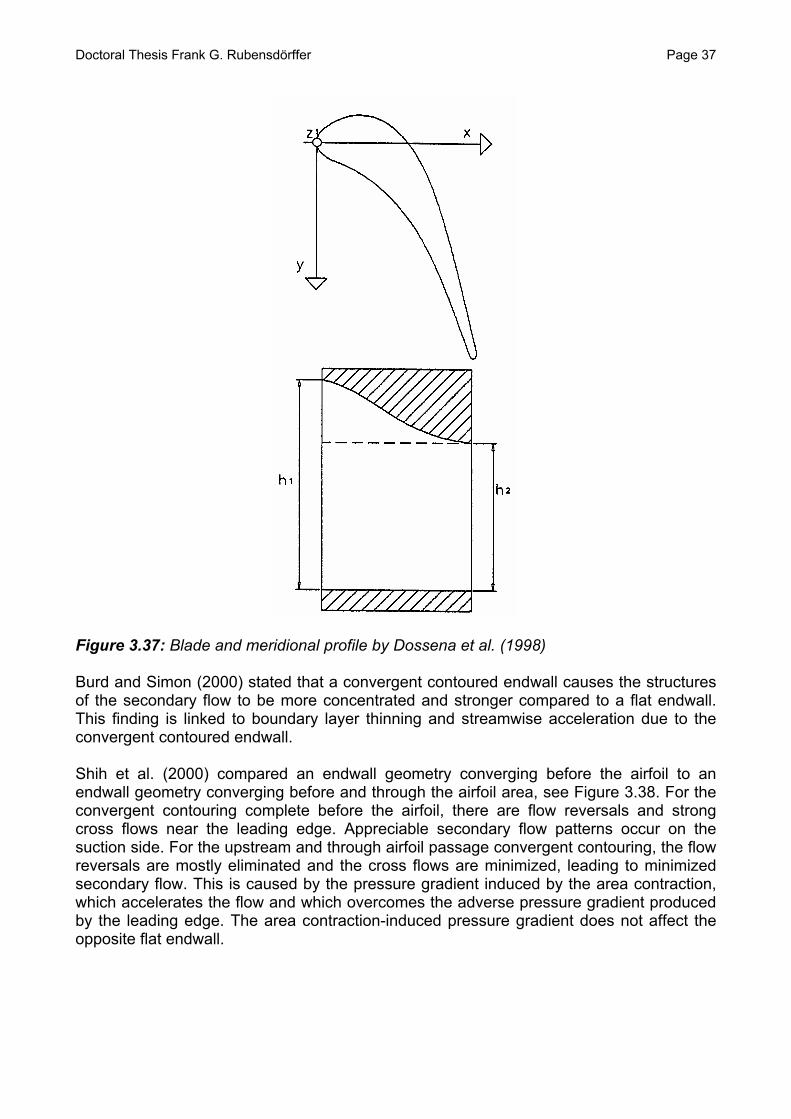
Figure 3.36: Meridional view of half cascade with straight and divergent contoured endwall by Duden et al. (1998) Dossena et al. (1998) studied the influence of a convergent contoured endwall, see Figure 3.37, on the secondary flow. The chosen convergent contoured endwall leads to a reduction of pitchwise pressure gradient in the first part of the flow channel, which produces less intense secondary flow effects. The improvement of the streamwise pressure distribution, which means a lower inlet velocity followed by greater flow acceleration, reduces vane and endwall boundary layer thickness and the related losses. Streamwise contracting of the channel produces lower loss levels, also affecting secondary losses due to lower velocity in the beginning of the vane passage. The secondary vortex structures are strongly affected by the endwall contouring. On the flat side there is lower vortex intensity. On the profiled side, the contraction inhibits the formation of a proper passage vortex in its migration towards midspan due to intensive vortex stretching due to local acceleration.
Doctoral Thesis Frank G. Rubensdörffer Page 37
Figure 3.37: Blade and meridional profile by Dossena et al. (1998) Burd and Simon (2000) stated that a convergent contoured endwall causes the structures of the secondary flow to be more concentrated and stronger compared to a flat endwall. This finding is linked to boundary layer thinning and streamwise acceleration due to the convergent contoured endwall. Shih et al. (2000) compared an endwall geometry converging before the airfoil to an endwall geometry converging before and through the airfoil area, see Figure 3.38. For the convergent contouring complete before the airfoil, there are flow reversals and strong cross flows near the leading edge. Appreciable secondary flow patterns occur on the suction side. For the upstream and through airfoil passage convergent contouring, the flow reversals are mostly eliminated and the cross flows are minimized, leading to minimized secondary flow. This is caused by the pressure gradient induced by the area contraction, which accelerates the flow and which overcomes the adverse pressure gradient produced by the leading edge. The area contraction-induced pressure gradient does not affect the opposite flat endwall.

Page 38 Doctoral Thesis Frank G. Rubensdörffer
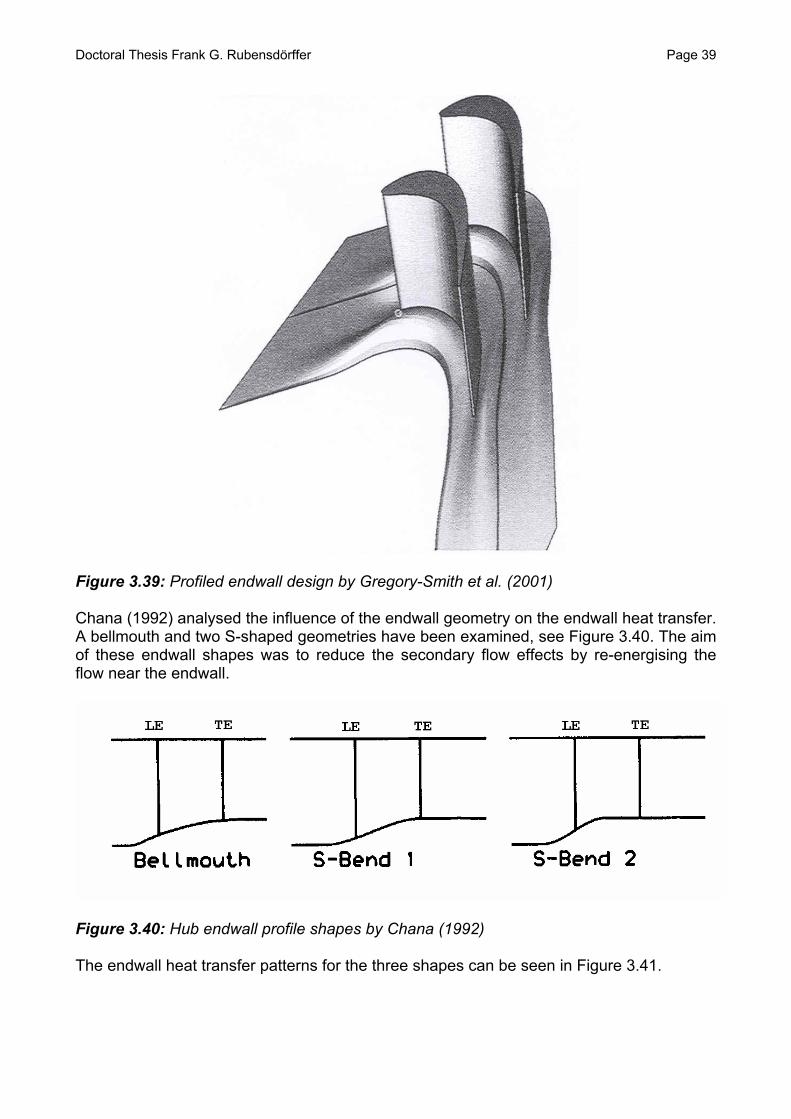
Figure 3.38: Convergent endwall geometries by Shih et al. (2000) Gregory-Smith et al. (2001) showed that it is possible to reduce the secondary flow significantly, in particular the passage vortex, by the application of an adapted non-axis-symmetric endwall with the endwall curvature being used to counteract the cross passage pressure gradient, see Figure 3.39.
Doctoral Thesis Frank G. Rubensdörffer Page 39
Figure 3.39: Profiled endwall design by Gregory-Smith et al. (2001) Chana (1992) analysed the influence of the endwall geometry on the endwall heat transfer. A bellmouth and two S-shaped geometries have been examined, see Figure 3.40. The aim of these endwall shapes was to reduce the secondary flow effects by re-energising the flow near the endwall.
Figure 3.40: Hub endwall profile shapes by Chana (1992) The endwall heat transfer patterns for the three shapes can be seen in Figure 3.41.

Page 40 Doctoral Thesis Frank G. Rubensdörffer
Figure 3.41: Measured hub endwall Nusselt numbers by Chana (1992) The bellmouth and the S1-shape show a peak in the heat transfer in the middle of the flow passage between trailing edge and the middle of the suction side. For the S2-shape, the peak moves towards the pressure side trailing edge region, with a decrease of the heat transfer in the suction side region. The S2-shape leads to less crossflow and an extended separation distance on the endwall, combined with reduced effect of secondary flow migration towards suction side. With the S1-shape and the bellmouth shape, crossflow occurs fairly early in the flow passage so that a new thinner boundary layer covers the remaining passage. This yields in high heat transfer in the passage and near the suction side downstream of the separation line on the endwall. As the boundary layer thickens further downstream, the heat transfer decreases. The flat tip endwall heat transfer distribution shows no difference between the three different shapes of the hub endwall. Hence, the tip endwall heat transfer is not influenced by the shape of the hub endwall. 3.4.4 Summary
Most of the studies of the variation of the geometries are only aerodynamic studies. There the influence of a particular geometry change only on the secondary flow field is explicated without any direct conclusions on the influence on the endwall heat transfer. The variation of the airfoil geometry influences the intensity of the secondary flow field and the position of the separation saddle point. With the application of a leading edge fillet the secondary flow can be reduced. The horseshoe vortex on the pressure side can be eliminated. The passage vortex can be minimized. A convergent contoured endwall leads to much less secondary flow and losses due to boundary layer thinning and streamwise acceleration. The design of the geometry of the opposite endwall has nearly no influence on the local endwall heat transfer. Summarized it can be concluded that the variation of the endwall geometry has a determining influence on the endwall secondary flow. That means that the secondary flow field and the endwall heat transfer can be targeted influenced and controlled by the layout of the complete endwall and especially of the endwall leading edge area.

Doctoral Thesis Frank G. Rubensdörffer Page 41
3.5 Comparison of experimental measured and numerical calculated secondary flow field and endwall heat transfer
3.5.1 Introduction
Most of the previous presented studies were either only experimental or only numerical. In this subchapter several studies are presented, where experimental measurements of the flow field through a vane and the vane endwall heat transfer are compared to numerical calculations with different CFD codes in order to judge the quality and capability of the chosen numerical method. 3.5.2 Comparison of measured and calculated secondary flow field
Tominaga et al. (1995) compared the measurements of the internal flow phenomena in a linear turbine cascade with three-dimensional Navier-Stokes computations using an implicit, time asymptotic finite difference scheme together with the algebraic Balwin-Lomax turbulence model. A good agreement between the calculation and the measurements, see Figure 3.42, is achieved, when the inlet boundary layer on the endwall is taken into account.
Figure 3.42: Comparison of the calculated and measured wake profiles by Tominaga et al. (1995) Also Duden et al. (1998) found good agreements between measured and calculated flow field by using a three-dimensional Navier-Stokes code with a standard k-ε turbulence model. Similar results have been achieved by Dossena et al. (1998), who used a three-dimensional Navier-Stokes code with a standard k-ω turbulence model by Wilcox. They compared the total pressure losses at several downstream planes. Zess and Thole verified flow field measurements in the vane leading edge region using three-dimensional Navier-Stokes calculations the commercial code Fluent with the RNG-k-e turbulence model.

Page 42 Doctoral Thesis Frank G. Rubensdörffer
3.5.3 Comparison of measured and calculated endwall heat transfer
Harvey et al. (1998) compared measured endwall heat transfer with calculated values using a three-dimensional Navier-Stokes code with an algebraic mixing length turbulence model and wall functions for the near wall treatment. As can be seen in Figure 3.43, the calculation reproduces the secondary flow effects on the endwall heat transfer quite fair.
Figure 3.43: Measured and calculated hub endwall Nusselt number distribution by Harvey et al. (1998) The greatest differences are that the V-shape in the contour at the inlet is closer to the pressure side compared to the measurements, and an area of higher heat transfer is calculated near the pressure side trailing edge corner. The maximum deviation in heat transfer is within 20 % of the measurements, which is rather good regarding the relatively unsophisticated modeling of the turbulent endwall boundary layer. Boyle and Jackson (1995) tested several algebraic turbulence models in a three-dimensional Navier-Stokes solver to predict endwall heat transfer. They found reasonably good agreement with the greatest differences because of transition prediction and overpredictition in peak heat transfer. Roy et al. (2000) reported reasonable quantitative agreement calculating endwall heat transfer by using a three-dimensional Navier-Stokes solver with the one equation Spalart-Almaras turbulence model. Hermann and Rubensdörffer (2001) applied all turbulence models and near wall approaches including the v2-f turbulence model by Durbin (1991) implemented in Fluent (2001) and the boundary layer program TEXSTAN of Crawford (1986) for vane airfoil heat transfer calculations using a vane experimental case of Arts et al. (1990) as validation case. They found the only reasonable agreement between measurement and calculations either by using the v2-f turbulence model or the simple boundary layer approach. Kalitzin and Iaccarino (1999) verified calculations of endwall heat transfer using a three-dimensional Navier-Stokes solver with a modified v2-f turbulence model by Durbin (1991), with measurements by Giel et al. (1996), see Figure 3.25, case 1. The calculated heat
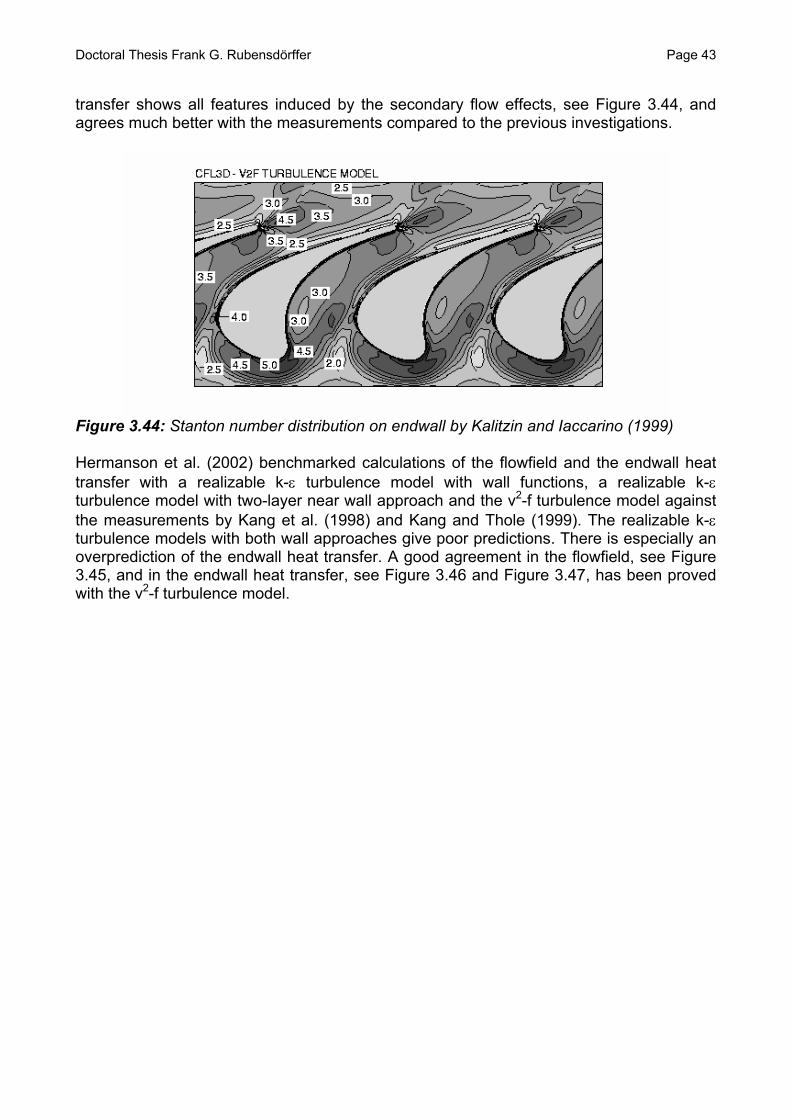
Doctoral Thesis Frank G. Rubensdörffer Page 43
transfer shows all features induced by the secondary flow effects, see Figure 3.44, and agrees much better with the measurements compared to the previous investigations.
Figure 3.44: Stanton number distribution on endwall by Kalitzin and Iaccarino (1999) Hermanson et al. (2002) benchmarked calculations of the flowfield and the endwall heat transfer with a realizable k-ε turbulence model with wall functions, a realizable k-ε turbulence model with two-layer near wall approach and the v2-f turbulence model against the measurements by Kang et al. (1998) and Kang and Thole (1999). The realizable k-ε turbulence models with both wall approaches give poor predictions. There is especially an overprediction of the endwall heat transfer. A good agreement in the flowfield, see Figure 3.45, and in the endwall heat transfer, see Figure 3.46 and Figure 3.47, has been proved with the v2-f turbulence model.

Page 44 Doctoral Thesis Frank G. Rubensdörffer
Figure 3.45: Measured and calculated (v2-f turbulence model) leading edge horseshoe vortex roll-up in stagnation plane by Hermanson et al. (2002)

Doctoral Thesis Frank G. Rubensdörffer Page 45
Figure 3.46: Measured contours of Stanton number on endwall by Hermanson et al. (2002)

Page 46 Doctoral Thesis Frank G. Rubensdörffer
Figure 3.47: Calculated (v2-f turbulence model) contours of Stanton number on endwall by Hermanson et al. (2002) In a collaboration research work with Chalmers University of Technology (Svenningsson, 2003) the performance of different v2-f turbulence models using the Kang and Thole (1999) experimental test case was analysed. It was concluded that the v2-f turbulence model implemented in the commercial CFD code Fluent (2001) is an accurate tool regarding prediction of nozzle guide vane flow field and endwall heat transfer. 3.5.4 Summary
The comparisons of the measured and calculated secondary flow field show that it is accomplishable to achieve good calculation results with a CFD code with a simple, unsophisticated turbulence model. The calculation results give a good agreement with the measurements of the secondary flow field.

Doctoral Thesis Frank G. Rubensdörffer Page 47
For the qualitative accurate prediction of the endwall heat transfer however, it is necessary to apply a CFD code with more advanced turbulence models. From the presented studies the conclusion can be drawn that the commercial CFD code Fluent with the advanced v2-f turbulence model is an appropriate tool to calculate secondary flow and endwall heat transfer in a gas turbine vane. 3.6 Conclusions
The flow field and the endwall heat transfer of various vane geometries of previous generation gas turbines were investigated in the open literature. These vane geometries generate a high, distinctive secondary flow field in terms of intensity and geometric extension and with it connected losses. This secondary flow field induced by an undisturbed flow approaching the airfoil of the vane is defined by the aerodynamic originated vortex system, which also determines the vane endwall heat transfer. The main flow field parameters - Reynolds number, exit Mach number and inlet turbulence level - have only a lower influence on the nozzle guide vane secondary flow field and endwall heat transfer. The literature study indicates clearly that the state-of-the-art in this research field is high. The advanced geometry of a nozzle guide vane of a modern industrial gas turbine however, is designed to minimize the secondary flow field and the related losses. It is expected that this kind of advanced nozzle guide vane has a different aerodynamic and endwall heat transfer performance. This performance, which also is determining for the design task of the vane endwall cooling configuration, is unknown and therefore raises several remaining questions. Among these, the following can be mentioned:
• How do the occurrence, the characteristics, the distribution and the intensity of the secondary flow field and the endwall heat transfer pattern for the advanced design of the nozzle guide vane of modern industrial gas turbine look like compared to the present knowledge on more traditional vanes?
• What is the influence of changes of the main flow field parameters - Reynolds
number, exit Mach number and inlet turbulence level - on the secondary flow field and the endwall heat transfer pattern for the advanced design of the nozzle guide vane of modern industrial gas turbine?
All evaluated studies from the open literature have applied some kind of baseline configuration with a long planar continuous hub endwall which results in an undisturbed boundary layer flow approaching the airfoil of the investigated vane. In a real gas turbine however, the flow path between the combustion chamber and the nozzle guide vane is interrupted by several design elements, which disturb and change the approaching flow field to the nozzle guide vane. Furthermore the geometric studies in the open literature with small changes of the endwall geometry in the leading edge area showed that the secondary flow field and with it the endwall heat transfer pattern of the nozzle guide vane is very sensitive to changes in the endwall area before the airfoil of the vane. This means that the secondary flow field and the endwall heat transfer pattern of a nozzle guide vane can be strongly influenced and varied by geometrical changes of the flow path between the combustion chamber and the nozzle guide vane, which creates the following unanswered question:
Page 48 Doctoral Thesis Frank G. Rubensdörffer
• How are the secondary flow field and the endwall heat transfer pattern of the advanced nozzle guide vane of modern industrial gas turbine affected by geometric design changes of the flow path between the combustion chamber and the nozzle guide vane?
The main flow field parameters - Reynolds number, exit Mach number and inlet turbulence level - are determined by the complete aerodynamic turbine design and by the combustion chamber design and therefore cannot be varied for the optimisation of the secondary flow field and the endwall heat transfer of a nozzle guide vane. In addition conclusions from the literature study show that the main flow field parameters have only a lower influence on the nozzle guide vane secondary flow field and endwall heat transfer. Furthermore the new type of advanced design of the nozzle guide vane is believed to have a major influence on the occurrence of secondary flow, which determinates the endwall heat transfer. Therefore this study will concentrate on the aerodynamic and endwall heat transfer performance of the advanced nozzle guide vane design. The unknown influence of the geometric flow path design changes is determining for the design task of the vane endwall cooling configuration. Therefore the present study will create in-depth knowledge of the influence of several geometric variants of the flow path design between the combustion chamber and the nozzle guide vane on the secondary flow field and endwall heat transfer of the advanced designed nozzle guide vane. In the open literature, experimental and numerical approaches with its related advantages and disadvantages are documented to solve similar questions raised for the advanced designed nozzle guide vane. With the experimental approach detailed and reliable measurement data of the flow field and the endwall heat transfer of a vane can be generated. The disadvantages of the experimental approach are the high consumption of financial and time resources together with the drawback of the limited flexibility of quick geometric changes and the limitations in the flow field and thermal boundary conditions. The numerical approach however provides a high flexibility of geometric and boundary condition changes. Here the disadvantage is that the quality of the flow field results and especially of the heat transfer results is dependent on the CFD code together with the applied turbulence model. In order to profit from the advantages of both approaches and aiming to avoid their disadvantages, both approaches are combined in the present study. The aerodynamic and heat transfer research of a baseline configuration of the advanced nozzle guide vane is both done experimentally in a new test rig as well as numerically. It can be concluded from the study of the open literature for all kind of vane configurations that for the numerical calculation of the vane flow field and especially for the vane endwall heat transfer calculation it is necessary to apply a CFD code with an advanced turbulence model. The results reported in the open literature for CFD codes with the advanced v2-f turbulence model are very promising and yielded good agreement between the reported measurements and the achieved calculations, which however were all obtained at previous generation vane geometries. Thus the following question is raised:
• Is an advanced CFD code with the applied v2-f turbulence model generally applicable for nozzle guide vane flow field and endwall heat transfer calculations and not simply tuned to measurements obtained for a specific vane?

Doctoral Thesis Frank G. Rubensdörffer Page 49
In the present study the reliable measurements of the flow field and the endwall heat transfer of the advanced nozzle guide vane of modern industrial gas turbine obtained in the new test facility will be used to validate the applied CFD code with the v2-f turbulence model. Based on the state-of-the-art from the open literature there is a clear need for more detailed knowledge about the secondary flow field and endwall heat transfer performance of an advanced, high-loaded nozzle guide vane of a modern industrial gas turbine. This need arises as the vane flow field and the endwall heat transfer under the advanced flow conditions, minimizing secondary flow field and the related losses, cannot be expected to respond in the same way as for vane geometries of previous generation gas turbines which generate a high, distinctive secondary flow field in terms of intensity and geometric extension.

Page 50 Doctoral Thesis Frank G. Rubensdörffer
Doctoral Thesis Frank G. Rubensdörffer Page 51
4 METHOD OF ATTACK
In the vane endwall heat transfer state of the art chapter the requirement for reliable aerodynamic and endwall heat transfer measurement data of an advanced nozzle guide vane of a modern industrial gas turbine for the analysis of the performance of the advanced vane design has been raised. No experimental heat transfer data exist in the open literature for this type of configuration. Therefore a new test facility with a linear cascade with a baseline configuration of the advanced nozzle guide vane of a modern industrial gas turbine with a parallel undisturbed flow field in front of the airfoil of the vane will be designed and built. In the design and layout of the test facility the conclusions from the open literature vane endwall heat transfer research are included and incorporated. Aerodynamic and heat transfer research work will be carried out and evaluated. Own research work (Hermann and Rubensdörffer, 2001), collaboration research work with Chalmers University of Technology (Svenningsson, 2003) and the conclusions from the vane endwall heat transfer research in the open literature is used to choose an appropriate reliable numerical tool for the prediction of the nozzle guide vane flow field and endwall heat transfer. This numerical tool will be applied for the aerodynamic and heat transfer research on the baseline configuration of the advanced nozzle guide vane. The achieved results of the numerical research will be validated against the aerodynamic and heat transfer research work acquired in the new test rig for the baseline configuration of the advanced nozzle guide vane. The chosen numerical tool, now validated against different vane and blade geometries and for different flow conditions, will then be applied for the aerodynamic and heat transfer research on several geometric variants of the baseline configuration of the advanced nozzle guide vane. In the flow path upstream of the vane, typical design elements used in real gas turbines like the design of the end of the dry low NOX combustion chamber, cooled heat shields or purged cavities are implemented. The flow field, the secondary flow features and the endwall heat transfer of the several variants will be examined, analyzed and compared. Conclusions from the investigations will be drawn to define new design guidelines for the design layout of new nozzle guide vanes of next-generation industrial gas turbines.

Page 52 Doctoral Thesis Frank G. Rubensdörffer

Doctoral Thesis Frank G. Rubensdörffer Page 53
5 EXPERIMENTAL DESIGN AND METHOD
5.1 Introduction
The advanced nozzle guide vane of a modern industrial gas turbine is shown in Figure 5.1. It is an innovative high flow deflection transonic nozzle guide vane. The new-generation complete turbine design adopts relatively short nozzle guide vanes with a low airfoil height to chord length ratio less than 1. Furthermore these new advanced nozzle guide vanes operate under transonic flow conditions since the first turbine stage is highly loaded. This means that the enthalpy drop across the first turbine stage needs to be high while both maintaining a maximum full-stage efficiency and keeping an acceptable temperature at the rotor blade leading edge. Under these conditions, the common use of film cooling air, discharged through perforation holes located directly in the vane endwalls, is not desired because of the related stage efficiency drop. Thus other techniques have to be found so that the required lifetime-limiting endwall material temperature is not exceeded. Therefore this new advanced nozzle guide vane configuration has been selected for the experimental and numerical research on the flow field, the secondary flow features and the endwall heat transfer.
Figure 5.1: New advanced nozzle guide vane of a modern industrial gas turbine

Page 54 Doctoral Thesis Frank G. Rubensdörffer
In Figure 5.2 the profile and the Mach number distribution of the nozzle guide vane airfoil in midspan position can be seen. The airfoil is a modern advanced design. The exit Mach number results from the complete turbine design. For the given exit Mach number an optimum pitch to chord ratio is applied to minimize the profile losses. It is a slim airfoil design with an optimized maximum profile thickness to chord ratio to minimize airfoil friction losses. The airfoil is mid-loaded to combine the advantages of the front-loaded and the aft-loaded airfoil design. The low Mach number on the beginning of the suction side leads to less secondary flow. The course of the Mach number achieved on the end of the suction side conduces to the avoidance of shocks in the trailing edge area. On the pressure side a common velocity distribution with a simultaneous acceleration without any diffusion zone is applied to avoid any kind of separation.
0.00
0.10
0.20
0.30
0.40
0.50
0.60
0.70
0.80
0.90
1.00
0.00 0.10 0.20 0.30 0.40 0.50 0.60 0.70 0.80 0.90 1.00
s/smax
Mac
h nu
mbe
r
Pressure side Suction side
Leading edge position s/smax = 0.457
Figure 5.2: Profile and Mach number distribution of the nozzle guide vane airfoil midspan 5.2 Cold low pressure test facility
5.2.1 Test facility design
The new cold low pressure test facility was designed within the framework of the current study with the purpose to provide a test facility for steady state aerodynamic and endwall heat transfer measurements of a baseline configuration of the presented new advanced nozzle guide vane of a modern industrial gas turbine. The new cold low pressure test facility was manufactured and assembled in the Fluid Dynamics Laboratory at Siemens Industrial Turbomachinery AB in Finspong, Sweden.

Doctoral Thesis Frank G. Rubensdörffer Page 55
The test facility, shown in Figure 5.3 consists of the following major parts: - Laboratory workshop compressors
- Diffusor
- Settling chamber with honeycomb
- Transition duct
- Turbulence grid
- Test section
- Outlet diffusor
- Stack
Honeycomb
Diffusor
Settling chamber
Turbulencgrid
Figure 5.3: Schematic diagram of test facility The laboratory workshop compressors supply air6.0 kg/s at a pressure of 1.5 bar in a temperaturewhich is connected to the air supply, is 1200 mfrom 340 mm to the outlet diameter of 500 mm. Dmm long settling chamber with an included honedisturbances in the flow. Next follows a 1000 msection changes smoothly from 500 mm circularflow direction. Downstream of the transition duct a turbulence grid with 21 mm square openings aturbulence level. After the test section an outpressure. The outlet diffusor is then connected ttest facility is shown in Figure 5.4.
Transition duct
Outlet diffusor
e
Test section
to the test facility. They can deliver up to range between 20 to 40 °C. The diffusor, m long and increases the inlet diameter ownstream of the diffusor there is a 600 ycomb to calm the flow and to minimize m long transition duct, where the cross
to 436 mm * 574 mm rectangular in the and 246 mm upstream of the test section, nd 6 mm bars is installed to increase the let diffusor is installed to recover static o an exhaust stack. A photograph of the

Page 56 Doctoral Thesis Frank G. Rubensdörffer
Outlet diffusor
Honeycomb
Settling chamber Test
section Diffusor Transition duct
Turbulence grid
Figure 5.4: Test facility 5.2.2 Test section design
Figure 5.5 illustrates a schematic diagram of the test section. It consists of three parts: the inlet section, the airfoil section and the outlet section. The inlet section is delimited by the hub endwall, the tip endwall and the two side walls. The hub endwall is planar and starts two times the airfoil chord length upstream the leading edge of the airfoils. Beneath the hub endwall an adjustable boundary layer bleed is employed to secure a parallel approaching flow field with a new boundary layer. A trip wire is installed at the beginning of the hub endwall to insure a uniform turbulent boundary layer on the hub endwall. The tip endwall is formed like the end of a real dry low NOX combustion chamber. The left side wall is equipped with a window to provide optical access to the inlet section of the investigated area of the test section, e.g. for laser measurements or facilitating the installation and alignment of aerodynamic probes.
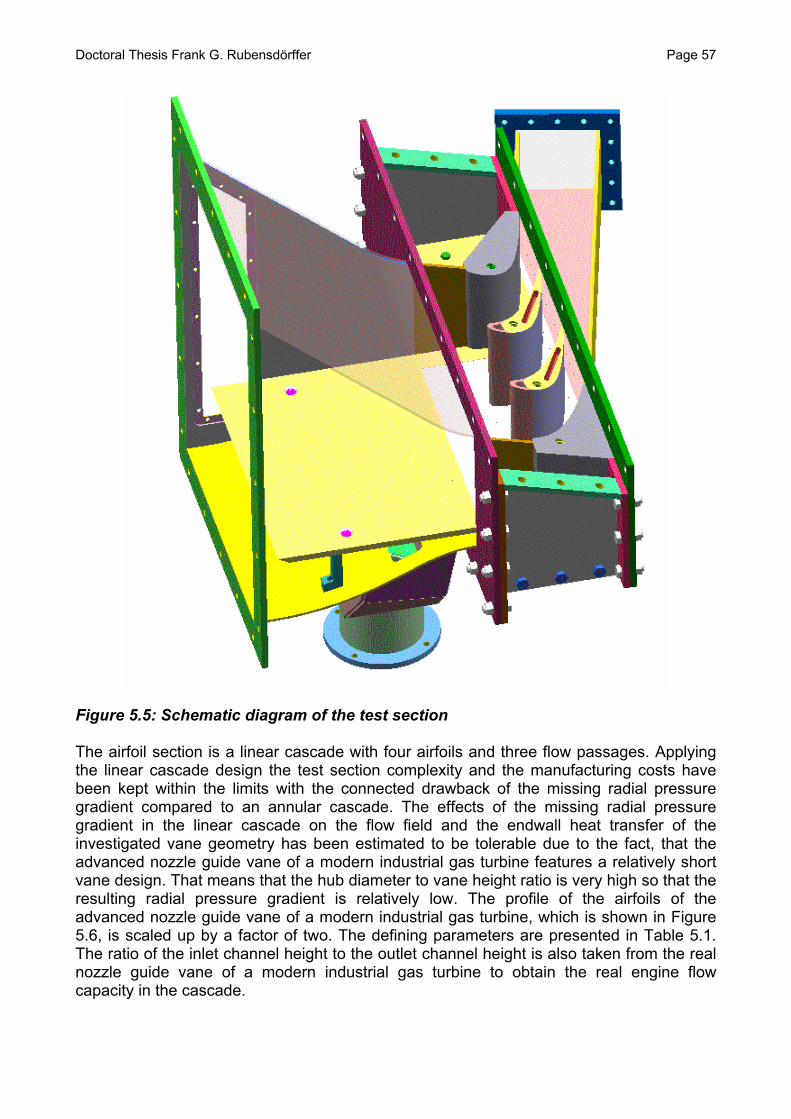
Doctoral Thesis Frank G. Rubensdörffer Page 57
Figure 5.5: Schematic diagram of the test section The airfoil section is a linear cascade with four airfoils and three flow passages. Applying the linear cascade design the test section complexity and the manufacturing costs have been kept within the limits with the connected drawback of the missing radial pressure gradient compared to an annular cascade. The effects of the missing radial pressure gradient in the linear cascade on the flow field and the endwall heat transfer of the investigated vane geometry has been estimated to be tolerable due to the fact, that the advanced nozzle guide vane of a modern industrial gas turbine features a relatively short vane design. That means that the hub diameter to vane height ratio is very high so that the resulting radial pressure gradient is relatively low. The profile of the airfoils of the advanced nozzle guide vane of a modern industrial gas turbine, which is shown in Figure 5.6, is scaled up by a factor of two. The defining parameters are presented in Table 5.1. The ratio of the inlet channel height to the outlet channel height is also taken from the real nozzle guide vane of a modern industrial gas turbine to obtain the real engine flow capacity in the cascade.
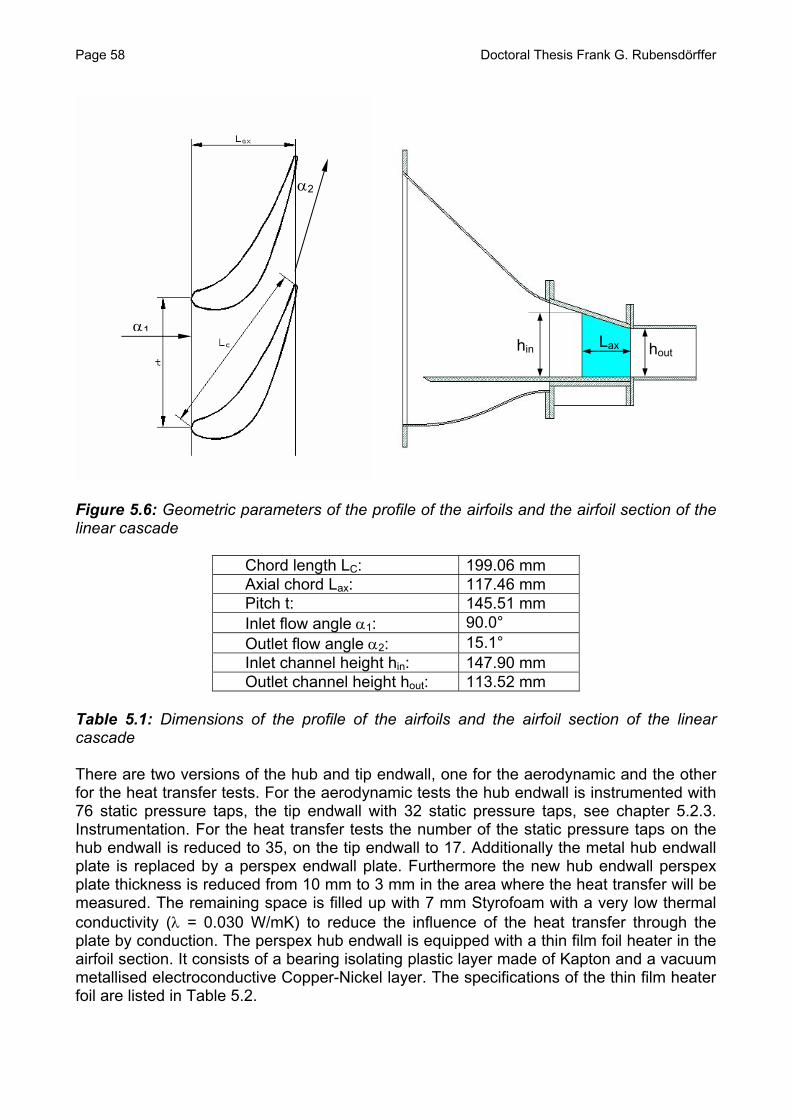
Page 58 Doctoral Thesis Frank G. Rubensdörffer
α2
n hout
Figure 5.6: Geometric parameters of the profile of the airfoilslinear cascade
Chord length LC: 199.06Axial chord Lax: 117.46Pitch t: 145.51Inlet flow angle α1: 90.0° Outlet flow angle α2: 15.1° Inlet channel height hin: 147.90Outlet channel height hout: 113.52
Table 5.1: Dimensions of the profile of the airfoils and thecascade There are two versions of the hub and tip endwall, one for thfor the heat transfer tests. For the aerodynamic tests the hub76 static pressure taps, the tip endwall with 32 static pressInstrumentation. For the heat transfer tests the number of thhub endwall is reduced to 35, on the tip endwall to 17. Additiplate is replaced by a perspex endwall plate. Furthermore thplate thickness is reduced from 10 mm to 3 mm in the area wmeasured. The remaining space is filled up with 7 mm Styroconductivity (λ = 0.030 W/mK) to reduce the influence of tplate by conduction. The perspex hub endwall is equipped wiairfoil section. It consists of a bearing isolating plastic layer mmetallised electroconductive Copper-Nickel layer. The specififoil are listed in Table 5.2.
hi
α1
and the air
mm mm mm
mm mm
airfoil sec
e aerodyna endwall is iure taps, se static presonally the me new hubhere the hefoam with ahe heat tranth a thin filmade of Kaptcations of th
Lax
foil section of the
tion of the linear
mic and the other nstrumented with ee chapter 5.2.3. sure taps on the etal hub endwall
endwall perspex at transfer will be very low thermal sfer through the foil heater in the on and a vacuum e thin film heater
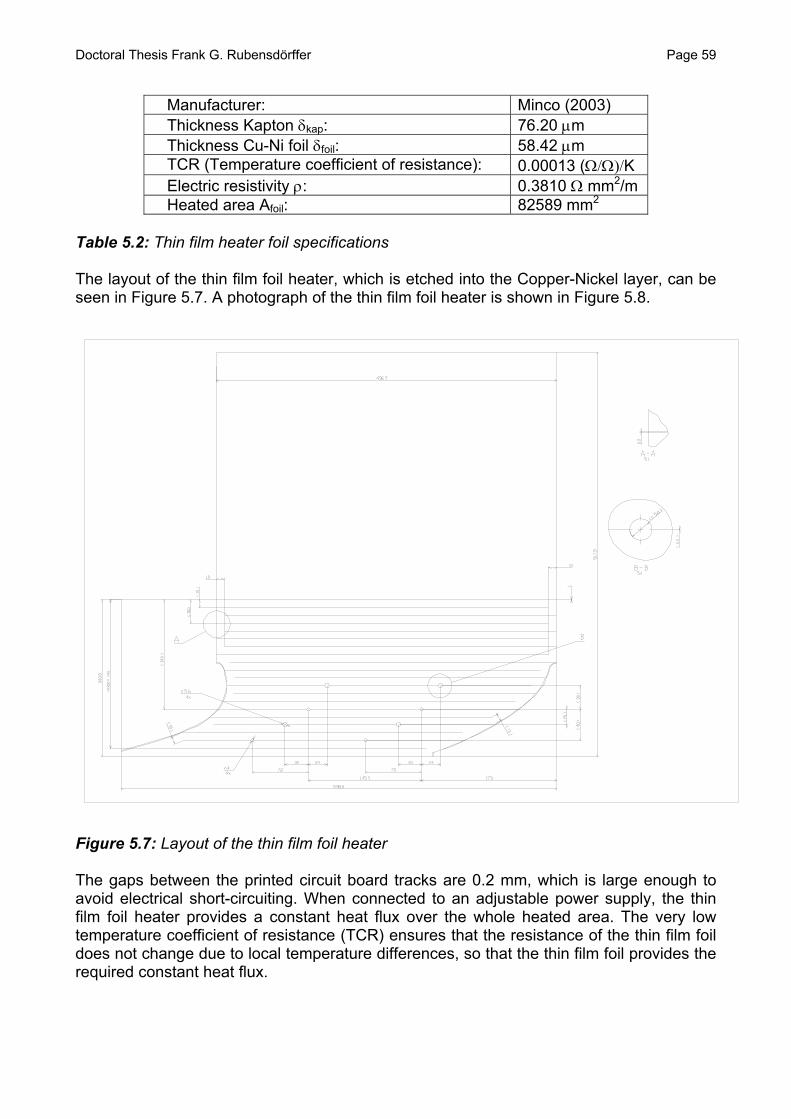
Doctoral Thesis Frank G. Rubensdörffer Page 59
Manufacturer: Minco (2003) Thickness Kapton δkap: 76.20 µm Thickness Cu-Ni foil δfoil: 58.42 µm TCR (Temperature coefficient of resistance): 0.00013 (Ω/Ω)/K Electric resistivity ρ: 0.3810 Ω mm2/m Heated area Afoil: 82589 mm2
Table 5.2: Thin film heater foil specifications The layout of the thin film foil heater, which is etched into the Copper-Nickel layer, can be seen in Figure 5.7. A photograph of the thin film foil heater is shown in Figure 5.8.
Figure 5.7: Layout of the thin film foil heater The gaps between the printed circuit board tracks are 0.2 mm, which is large enough to avoid electrical short-circuiting. When connected to an adjustable power supply, the thin film foil heater provides a constant heat flux over the whole heated area. The very low temperature coefficient of resistance (TCR) ensures that the resistance of the thin film foil does not change due to local temperature differences, so that the thin film foil provides the required constant heat flux.

Page 60 Doctoral Thesis Frank G. Rubensdörffer
Figure 5.8: Thin film foil heater The tip endwall in the airfoil section for the heat transfer tests is provided with four viewports in order to have optical access for an infrared camera to the heated hub endwall, see Figure 5.9. The windows of the viewports are equipped with sapphire glass, whose technical characteristics can be seen in Table 5.3.
Manufacturer: Viktor Kyburz AG (2002) Technical identification: Colourless synthetic sapphire,
corundum single crystal Chemical formula: Al2O3Crystal system: hexagonal Transmittance between 0.60 and 3.50 µm: 0.82 Thickness: 5.00 mm
Table 5.3: Technical characteristics of sapphire glass Production and cost limitations prevented the use of a single, continuous sapphire glass viewport. This leads to the disadvantages of the viewport frames.

Doctoral Thesis Frank G. Rubensdörffer Page 61
Figure 5.9: Tip endwall with sapphire glass viewports The contour of the outlet section has been designed with the help of 2D-CFD calculations to secure that the flow field through the three flow passages has a good periodicity without the use of adjustable tailboards. The complete test section can be seen in Figure 5.10. For the heat transfer tests, the inside of the test section is painted completely black in order to obtain a high, constant surface emissivity.

Page 62 Doctoral Thesis Frank G. Rubensdörffer
Figure 5.10: Test section for aerodynamic tests 5.2.3 Instrumentation
A pitot tube is installed in the inlet cross section of the test section to measure the total upstream pressure. In the same cross section a calibrated gold plated hot wire probe from Dantec (2003) is used to measure the inlet turbulence quantities. The hot wire has a diameter of 5 µm, a total length of 3 mm and an active length of 1.2 mm. The hot wire probe is removed for the aerodynamic and the heat transfer measurements. In the vicinity of the upstream edge of the planar hub endwall a 3-hole wedge probe, described and calibrated by Fridh (2003), is used to verify the parallel approaching flow field. Also this wedge probe is removed for the aerodynamic and heat transfer measurements to secure an undisturbed flow field in the test section. The static pressure distribution on the hub endwall is measured with 76 static pressure taps, see Figure 5.11, the tip endwall pressure distribution is measured via 32 static pressure taps, placed in the leading edge cross section and in the outlet cross section. For the heat transfer tests the number of the static pressure taps in the hub endwall is reduced to 35, located in the inlet section upstream of the airfoil section and in the outlet cross section immediately downstream of the airfoil section.
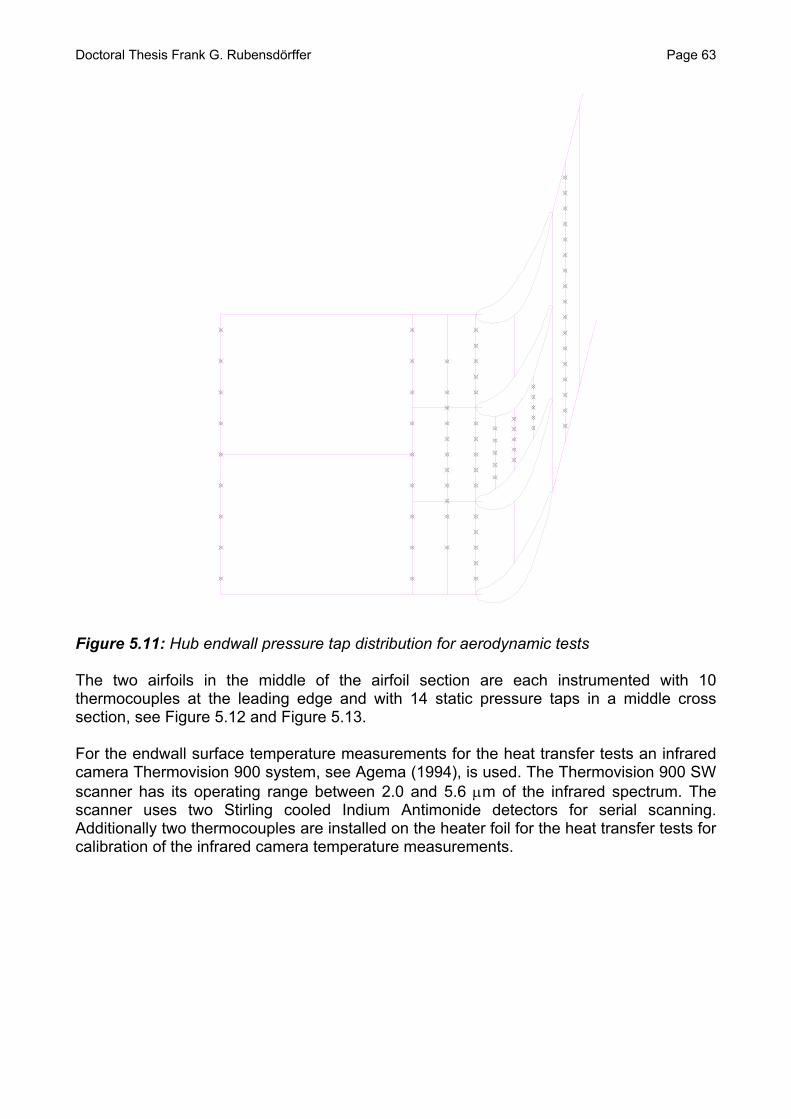
Doctoral Thesis Frank G. Rubensdörffer Page 63
Figure 5.11: Hub endwall pressure tap distribution for aerodynamic tests The two airfoils in the middle of the airfoil section are each instrumented with 10 thermocouples at the leading edge and with 14 static pressure taps in a middle cross section, see Figure 5.12 and Figure 5.13. For the endwall surface temperature measurements for the heat transfer tests an infrared camera Thermovision 900 system, see Agema (1994), is used. The Thermovision 900 SW scanner has its operating range between 2.0 and 5.6 µm of the infrared spectrum. The scanner uses two Stirling cooled Indium Antimonide detectors for serial scanning. Additionally two thermocouples are installed on the heater foil for the heat transfer tests for calibration of the infrared camera temperature measurements.

Page 64 Doctoral Thesis Frank G. Rubensdörffer
Figure 5.12: Airfoil pressure tap distribution
Figure 5.13: Instrumented airfoils
Doctoral Thesis Frank G. Rubensdörffer Page 65
5.3 Measurement and data acquisition
Two kinds of measurements are carried out in the described test facility depending upon the mode of operation, i.e. aerodynamic tests or heat transfer tests. The aerodynamic tests are intended for the measurements of the pressure distribution on the hub and tip endwall and on the two airfoils. Examination and control of the flow periodicity through the cascade and the adjustment of the boundary layer bleed flow are other objectives in such tests. The mass flow from the laboratory workshop supply to the rig is measured by a v-cone from McCrometer's. The mass flow through the cascade is adjusted so that the pressure drop over the cascade agrees as much as possible with the real engine conditions. The mass flow through the boundary layer bleed is measured by an orifice plate according to ISO 5167-1. It is adjusted so that the approaching flow is parallel to the planar hub endwall, which is controlled by the removable 3-hole wedge probe. The pressure taps are connected to the PSI pressure measurement system. The thermocouples for temperature measurements are connected to a Datascan analog/digital converter system. All incoming data are logged by a Scadapro data logging system, which is used to review the data, check trends and extract average values for interesting time periods as a data file for further evaluation with Excel. For online monitoring the temperature and pressure measurements from the Scadapro logging system are implemented into Excel datasheets with DDE-links. This means, that all important measurands for the rig like pressure distributions, temperature distributions and all other deduced parameters like Mach number distributions, mass flows and pressure ratios can be monitored and controlled online. For the hub endwall heat transfer tests a similar operation point of the test rig as used in the aerodynamic test is adjusted. A constant heat flux in the hub endwall is applied by the thin film foil heater connected to adjustable power supply. A wattmeter Yokogawa WT 110 is used to measure the electrical power consumed by the thin film foil heater. Due to different local heat transfer coefficients a surface temperature pattern is generated on the heated hub endwall, which is measured by the infrared camera. Because of the frames for the sapphire glasses in the tip endwall and the limited optical access to the hub endwall, several infrared images have to be taken from different optic angles but from the same distance to the hub endwall. These temperature images taken by the infrared camera are saved in a matrix form in a chosen number of pixels. The complete measurement setup can be seen in Figure 5.14.

Page 66 Doctoral Thesis Frank G. Rubensdörffer
Figure 5.14: Measurement setup for heat transfer tests 5.4 Data evaluation
The pressure measurements on the airfoil, the pressure distribution on the tip and hub endwall are used to calculate the Mach number distributions:
⎥⎥⎥
⎦
⎤
⎢⎢⎢
⎣
⎡−⎟⎟
⎠
⎞⎜⎜⎝
⎛−
=
−
11
21
κκ
κ stat
tot
ppMa (5.1)
The main mass flow and the boundary layer bleed mass flow are calculated from the pressure measurements. All other data like the temperature measurements in the leading edge and the hub endwall temperatures are saved as raw data. All data is saved in Excel worksheets. The infrared images of the heated hub endwall have been taken with the infrared camera from different optic angles to get a complete coverage of the whole heated hub endwall. In Figure 5.15 two examples of the infrared images with the heated hub endwall, thermocouples, airfoils and viewport frames (cf. Figure 5.9) can be seen. These infrared images are extracted as data files.
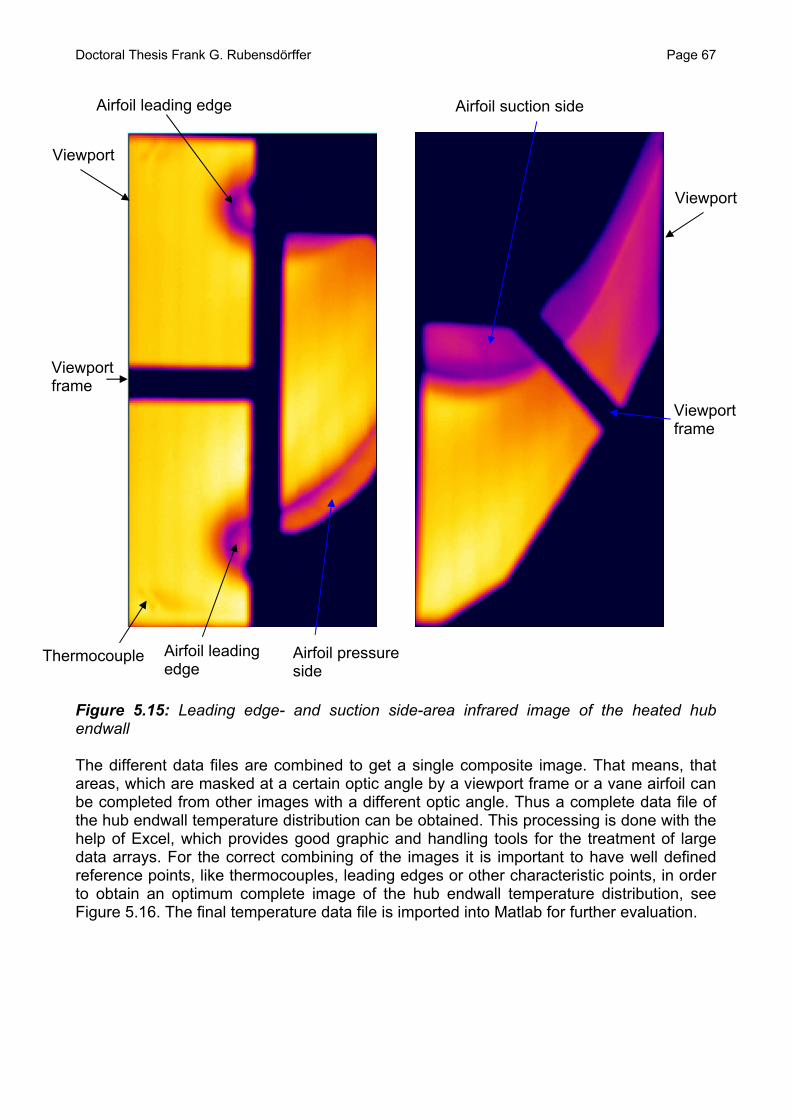
Doctoral Thesis Frank G. Rubensdörffer Page 67
Airfoil leading edge Airfoil suction side
Viewport
Viewport
Viewport frame
Viewport frame
Airfoil leading edge
Airfoil pressure side
Thermocouple
Figure 5.15: Leading edge- and suction side-area infrared image of the heated hub endwall The different data files are combined to get a single composite image. That means, that areas, which are masked at a certain optic angle by a viewport frame or a vane airfoil can be completed from other images with a different optic angle. Thus a complete data file of the hub endwall temperature distribution can be obtained. This processing is done with the help of Excel, which provides good graphic and handling tools for the treatment of large data arrays. For the correct combining of the images it is important to have well defined reference points, like thermocouples, leading edges or other characteristic points, in order to obtain an optimum complete image of the hub endwall temperature distribution, see Figure 5.16. The final temperature data file is imported into Matlab for further evaluation.

Page 68 Doctoral Thesis Frank G. Rubensdörffer
Figure 5.16: Complete hub endwall temperature distribution in Excel The measured hub endwall temperature distribution is used to evaluate the non-dimensional hub endwall heat transfer distribution, which is defined by:
λα CLNu *
= (5.2)
where the convective heat transfer coefficient α is defined as:
∞−=
TTq
W
convα (5.3)
The convective heat flux qconv can be calculated by:
condradeleconv qqqq −−= (5.4) where qele is defined by
foil
foilele A
Qq = (5.5)
qrad is the radiation heat transfer from the heater foil to the surrounding rig:

Doctoral Thesis Frank G. Rubensdörffer Page 69
( )44
∞−∗∗= TTq Wrad εσ (5.6) where it is assumed that all surrounding surfaces are uniform at T∞. qcond is conductive heat transfer through the perspex/styrofoam hub endwall:
( )∞−= TTkq Wcond (5.7) with
sty
sty
per
perk
λδ
λδ
+=
1 (5.8)
These calculations are done in Matlab for the complete surface temperature matrix. This leads to the Nusselt number distribution on the hub endwall. 5.5 Accuracy of the measurements and uncertainty analysis
5.5.1 Validation of the chosen measurement method
Applying the values from a nominal measurement case into Equation 5.4 to 5.7 shows that the ratio of the radiation heat flux to the total heat flux is around 3.7 % and the ratio of the conductive heat transfer through the wall to the total heat flux around 2.1 %. Thus it appears that the chosen measurement method as well as the adjusted temperatures are well applicable for the measurement task. 5.5.2 Uncertainty analysis
The uncertainty estimates for the direct measurands are acquired from the calibration of the instrumentation and can be seen in Table 5.4:
∆T∞ ±1.5 K ∆TW ±0.5 K ∆(TW - T∞) ±2.0 K ∆qele ±0.35 % ∆ε ±0.01 ∆pstat ±69 Pa ∆ptot ±69 Pa
Table 5.4: Uncertainty estimates A maximum uncertainty analysis for the deduced measurands like heat transfer coefficient α and Mach number has been performed. The maximum uncertainty is derived by the method of linear error propagation based on the first Taylor series, see Coleman and Steele (1999).
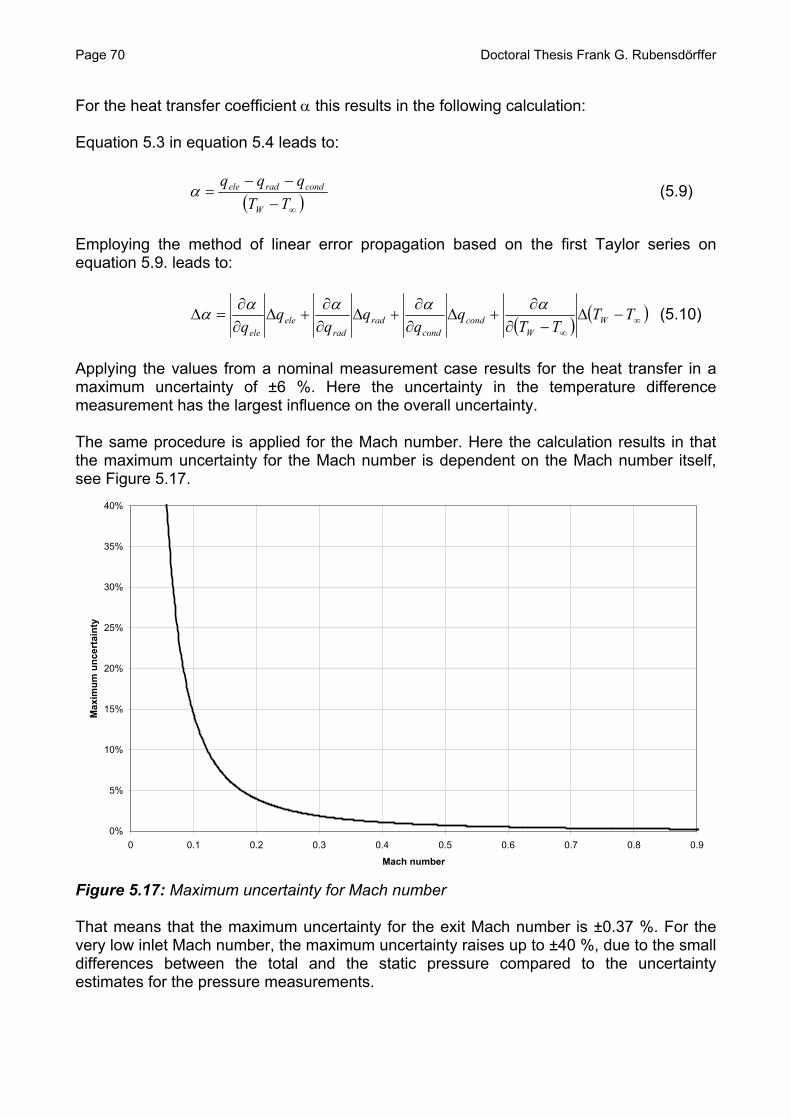
Page 70 Doctoral Thesis Frank G. Rubensdörffer
For the heat transfer coefficient α this results in the following calculation: Equation 5.3 in equation 5.4 leads to:
( )∞−−−
=TTqqq
W
condradeleα (5.9)
Employing the method of linear error propagation based on the first Taylor series on equation 5.9. leads to:
( ) ( ∞∞
−∆−∂
∂+∆
∂∂
+∆∂∂
+∆∂∂
=∆ TTTT
qq W
Wcond
condrad
radele
ele
ααααα ) (5.10)
Applying the values from a nominal measurement case results for the heat transfer in a maximum uncertainty of ±6 %. Here the uncertainty in the temperature difference measurement has the largest influence on the overall uncertainty. The same procedure is applied for the Mach number. Here the calculation results in that the maximum uncertainty for the Mach number is dependent on the Mach number itself, see Figure 5.17.
0%
5%
10%
15%
20%
25%
30%
35%
40%
0 0.1 0.2 0.3 0.4 0.5 0.6 0.7 0.8 0.9
Mach number
Max
imum
unc
erta
inty
Figure 5.17: Maximum uncertainty for Mach number That means that the maximum uncertainty for the exit Mach number is ±0.37 %. For the very low inlet Mach number, the maximum uncertainty raises up to ±40 %, due to the small differences between the total and the static pressure compared to the uncertainty estimates for the pressure measurements.

Doctoral Thesis Frank G. Rubensdörffer Page 71
5.6 Quality of the flow field in the linear cascade
The real flow through a nozzle guide vane row of gas turbine is approximately periodic and the numerically calculated flow through one flow passage of a nozzle guide vane with periodic boundary conditions is perfectly fully periodic. Periodicity means that the flow field at corresponding points in geometric equal flow passages is identical. This means that also the secondary flow field and the corresponding heat transfer phenomena are equal in corresponding areas of the flow passage. In order to secure the best possible periodicity in the linear cascade without adjustable tailboards the outlet of the test section of the linear cascade has been designed with the help of 2D CFD calculations. The periodicity in the linear cascade is verified by the comparison of the Mach number distribution around the left and the right airfoil in a cross section with constant height in spanwise direction, see Figure 5.18. The Mach number is based on the inlet total pressure and the airfoil static pressure measurements.
0.00
0.10
0.20
0.30
0.40
0.50
0.60
0.70
0.80
0.90
1.00
0.00 0.10 0.20 0.30 0.40 0.50 0.60 0.70 0.80 0.90 1.00
s/smax
Mac
h nu
mbe
r
Left airfoilRight airfoil
Pressure side Suction side
Leading edge position s/smax = 0.457
Figure 5.18: Mach number distribution around the left and the right airfoil in a cross section at z = 60.0 mm The measured Mach numbers are identical at the leading edge and adjacent regions on the pressure and the suction side. This means that the flow field in the leading edge area is fully periodic. Further downstream on the suction side the difference between the left and the right airfoil starts from ∆ Ma = 0.021 (3.4 %) at s/smax = 0.635 to a maximum deviation of ∆ Ma = 0.073 (9.3 %) at the end of the suction side. On the pressure side the deviation between the left and the right airfoil increases continuously on the way from the leading edge area to the end of the pressure side with a maximum deviation of ∆ Ma = 0.078 (12.2 %).

Page 72 Doctoral Thesis Frank G. Rubensdörffer
The evaluation shows that the achieved periodicity level is good in the inlet area and the first half of the flow path. Even in the rest of the flow passage the periodicity is satisfactory. Additionally the conclusions from the vane endwall heat transfer research chapter show that differences in the exit Mach number have only a low influence on the vane endwall heat transfer. Therefore the achieved periodicity in the linear cascade is assessed to be sufficient for the flow field and endwall heat transfer measurements in the baseline configuration of the advanced nozzle guide vane of a modern industrial gas turbine. 5.7 Summary
For the aerodynamic and heat transfer investigations of a baseline configuration of an advanced nozzle guide vane of a modern industrial gas turbine a new low pressure, low temperature test facility has been developed, designed, constructed and commissioned. The constructed test rig consists of a linear cascade with a baseline configuration of the advanced nozzle guide vane geometry with four upscaled airfoils and three flow passages. For the aerodynamic investigations the airfoils and the hub and tip endwall are instrumented with pressure taps. These pressure measurements are used for the evaluation of the Mach number distribution around the airfoil and on the endwalls of the nozzle guide vane. For the heat transfer investigations the hub endwall is equipped with a thin-film heater foil, and the tip endwall is equipped with four sapphire glass viewports in order to have optical access for thermography measurements of the hub endwall temperature distribution. These temperature measurements are used for the evaluation of the Nusselt number distribution on the hub endwall of the nozzle guide vane. The commissioning measurements, the uncertainly analysis, the analysis of the accuracy of the measurements and the analysis of the quality of the flow field show that the new test rig generates accurate and reproducible results with a satisfactory periodicity which give confidence that it is a reliable tool for the experimental aerodynamic and heat transfer research on an advanced nozzle guide vane of a modern industrial gas turbine.

Doctoral Thesis Frank G. Rubensdörffer Page 73
6 COMPUTATIONAL FLUID DYNAMICS METHOD
6.1 Governing equations
The three-dimensional flow of a fluid in a definite domain can be described at all points P = (x1, x2, x3) and times t, if the velocity vr = (u1, u2, u3), the density ρ, the pressure p and the temperature T are known. In CFD these six quantities are determined from the conservation equations for mass (continuity equation), momentum (Navier-Stokes equations) and energy. Additionally in this study it is assumed that the pressure can be related to the temperature and density using the ideal gas equation of state. This set of equations provides the basis for the numerical simulation of a ideal gas fluid dynamic process and can be written for a compressible flow in Cartesian coordinates as follows (Schlichting and Gersten, 1997): Mass conservation:
0)(=
∂∂
+∂∂
i
i
xu
tρρ (6.1)
Momentum conservation:
ik
kij
i
j
j
i
jij
jii fxu
xu
xu
xxp
xuu
tu ρδµ
ρρ+
⎥⎥⎦
⎤
⎢⎢⎣
⎡⎟⎟⎠
⎞⎜⎜⎝
⎛
∂∂
−∂
∂+
∂∂
∂∂
+∂∂
−=∂
∂+
∂∂
32)()( (6.2)
Energy conservation:
( ) hijijjjj
j Suxx
Exx
EutE
+∂∂
+⎟⎟⎠
⎞⎜⎜⎝
⎛
∂∂
∂∂
=∂
∂+
∂∂ τµρρ
Pr)()( (6.3)
with ⎟⎟⎠
⎞⎜⎜⎝
⎛
∂∂
−∂
∂+
∂∂
=k
kij
i
j
j
iij x
uxu
xu δµτ
32 (6.4)
Here, i = 1, 2, 3 and j = 1, 2, 3 are the Cartesian coordinate directions x, y, z and δij is the Kronecker delta (δij = 1 for i = j and δij = 0 for i ≠ j). E is the total internal energy, including the kinetic energy. fi takes the external forces due to gravity into account. Sh describes the local energy sources. Pr is the Prandtl number, defined as:
λµ pc⋅=Pr (6.5)
As equation of state the ideal gas law is used:
TRp ⋅⋅= ρ (6.6) where R is the specific gas constant.
Page 74 Doctoral Thesis Frank G. Rubensdörffer
Equations 6.1 to 6.3 define a system of combined, non-linear, partial differential equations, for which apart from a few exceptional cases, no analytical solution exists. Thus, this system of equations has to be solved numerically. 6.2 Turbulence
The nature of turbulence is extremely complex and has been described in detail by a vast number of fluid dynamic researchers, e.g. Tennekes and Lumley (1972) and Pope (2000). It is characterised by three-dimensionality, unsteadiness, strong vorticity, random fluctuations, diffusivity and dissipation. It usually occurs at moderate to high Reynolds numbers and consists of a large spectrum of rotational flow structures with a wide range of length scales. These flow structures are called eddies. The largest eddies in a turbulent flow are dependent and anisotropic, whereas the smallest eddies are isotropic. The turbulent flow is always dissipative. This means that energy has always to enter the flow continuously if the turbulence level is to be sustained. The turbulence extracts energy from the mean flow in regions where the turbulence is subjected to mean flow velocity gradients. This process is called vortex stretching and usually it is the stretching of the largest eddies that contribute most to the transfer of energy from the mean flow to the fluctuating turbulent motion. The energy is transported through the various scales. Here the larger scales affect the smaller scales by their strain rate and so vorticity is stretched by the applied shear stress. This leads to an exchange of energy. So the energy is transferred from the larger scales to the smaller ones. The energy of the smallest scales of the flow is dissipated into heat due to the viscous forces. Hence the kinetic energy of the mean flow decreases and the entropy of the flow increases by the influence of the viscous forces. Because of these explicated processes and characteristics a turbulent flow cannot be described in detail as a function of time and space for a complex, industrially relevant flow field within reasonable limits for computational efforts. Therefore statistical methods have to be applied to characterize a turbulent flow, where averages in time and space are introduced. 6.3 Reynolds averaged Navier-Stokes equations
Using instantaneous variables in Equation 6.1 to 6.3 the three-dimensional, turbulent fluid flow in a definite domain can be described. With a complete set of boundary conditions this system of equations can be solved directly without any further modeling with the so called Direct Numerical Simulation (DNS). This kind of simulation, which resolves the flow down to the smallest length and time scales, requires enormous amount of computer power and is not yet applicable for engineering purposes. The commonly used approach for industrial applications is the averaging concept. There, only the influence of the turbulence on the average properties of the flow is of interest. Thus an average for each instantaneous flow variable is applied. For turbulent flows Reynolds averaging and decomposition is the most appropriate form of averaging. The turbulent quantity Φι such as velocity, pressure, temperature and other scalars can be decomposed into a steady, mean value iΦ and a fluctuating component (Versteeg and Malalasekera, 1995):
iΦ′

Doctoral Thesis Frank G. Rubensdörffer Page 75
iii Φ′+Φ=Φ (6.7) The definition of the time averaged, mean quantity iΦ is:
∫+
∞→⋅Φ≡Φ
Tt
t iTi dtT
0
0
1lim (6.8)
The time average of the fluctuations iΦ′ is, by definition, zero:
01lim 0
0
=⋅Φ′≡Φ′ ∫+
∞→
Tt
t iTi dtT
(6.9)
Applying the described Reynolds averaging to the flow variables in the instantaneous continuity equation 6.1 and the momentum equations 6.2 results in the Reynolds-averaged Navier-Stokes (RANS) equations: Continuity equation:
0)(=
∂∂
+∂∂
i
i
xu
tρρ (6.10)
Momentum equations:
[ ]jiijjij
jii uuxx
pxuu
tu ′⋅′⋅−
∂∂
+∂∂
−=∂
∂+
∂∂ ρτ
ρρ )()( (6.11)
with ⎟⎟⎠
⎞⎜⎜⎝
⎛
∂∂
−∂
∂+
∂∂
=k
kij
i
j
j
iij x
uxu
xu δµτ
32 (6.12)
The Reynolds-averaged Navier-Stokes equations have the same form as the instantaneous Navier-Stokes equations except for the additional term, which have been introduced into the momentum equation:
jiij uu ′⋅′⋅−=′ ρτ (6.13) This additional term is called the Reynolds stresses term. It is a symmetric tensor with six unknown components for the three-dimensional flow. Reynolds stresses result from the turbulent fluctuating motion of the fluid in addition to the Newtonian shear stresses τij. The correlations for the additional turbulent fluctuating motions are unknown. Therefore the RANS equations are not closed. This closure-problem can be solved by modeling the Reynolds stress tensor τ'ij by a turbulence model.

Page 76 Doctoral Thesis Frank G. Rubensdörffer
6.4 Turbulence modeling
6.4.1 Overview
The main task of turbulence modeling is to supply computational procedures that predict the Reynolds stresses and the scalar transport terms. Wilcox (1993) reviewed in detail the state of the art of turbulence models. According to Lakshminarayana (1996) the closure techniques of turbulence modeling can be classified as follows:
1. Zero-Equation or Algebraic Eddy Viscosity Models: The models employ an algebraic form for the Reynolds stresses ji uu ′⋅′⋅− ρ . They are based on the mixing length hypothesis by Prandtl (1925). The widely used models are from Patankar and Spalding (1970), Cebeci and Smith (1974) and Baldwin and Lomax (1978).
2. One-Equation Models: The models employ an additional partial differential equation for a turbulence velocity scale, e.g. the turbulence model of Spalart and Allmaras (1992)
3. Two-Equation Models: The models employ one partial differential equation for a turbulent length scale and one partial differential equation for a turbulence velocity scale. The most widely used models are the k-ε model by Launder and Spalding (1974) and the k-ω model by Wilcox (1993).
4. Reynolds Stress Models (RSM): The models employ several partial differential equations for all of the components of the Reynolds stress tensor ji uu ′⋅′⋅− ρ
5. Direct Numerical Simulation (DNS): The time-dependent, three-dimensional structure including all length and time scales is resolved through a numerical solution of the time dependent Navier-Stokes equations.
6.4.2 The v2-f turbulence model
The v2-f turbulence model was originally proposed by Durbin (1991). It has become increasingly popular because it has been shown to be superior to other turbulence models to model flow fields with complex flow structures e.g. separation and reattachment in a diffusor (Iaccarino, 2001). The v2-f turbulence model is based on the standard k-ε model, but incorporates near-wall turbulence anisotropy and non-local pressure-strain effects. It is a general low-Reynolds-number turbulence model. The v2-f turbulence model solves, in addition to the partial differential equations for the turbulent kinetic energy k and the dissipation rate ε, one partial differential equation for the velocity variance scale v2 and one for the elliptic relaxation function f. The velocity variance scale v2 instead of the turbulent kinetic energy k is used to evaluate the eddy viscosity. v2, which can be thought of as the velocity fluctuation normal to the streamlines, has shown to provide an accurate scaling in representing the damping of turbulent transport close to the wall. This feature is not provided by the standard k-ε model, which fails to reproduce the characteristics of the eddy viscosity in the near wall region. Another advantage of the v2-f turbulence model is that it is valid all the way up to solid walls. For this purpose the calculation mesh at the surfaces must be very fine, y+ around 1, to assure the required resolution of the surface boundary layer. This feature is very important for the correct calculation of the convective heat transfer. That makes it possible to avoid using wall functions as near wall approach, which are not capable to model wall boundary layers and convective heat transfer in complex flow fields with vortex systems correctly. Therefore even more advanced turbulence models like the Reynolds Stress Model fail to predict convective heat transfer

Doctoral Thesis Frank G. Rubensdörffer Page 77
when using wall functions as near wall approach in complex flow fields. Furthermore the v2-f turbulence model combines numerical robustness in combination with a moderate computational effort to model the physics in the flow. Also, own research work (Hermann and Rubensdörffer, 2001) and the collaboration research work with Chalmers University of Technology (Svenningsson, 2003) together with the study of the open literature, showed that the best results in prediction of the flow field and the endwall heat transfer of a nozzle guide vane are achieved with advanced CFD codes applying the v2-f turbulence model, because the v2-f turbulence model reproduces the real physical processes much better than less advanced turbulence models. For those reasons the v2-f turbulence model is preselected for this study for the calculation of the flow field and the endwall heat transfer of the advanced nozzle guide vane of a modern industrial gas turbine.

Page 78 Doctoral Thesis Frank G. Rubensdörffer

Doctoral Thesis Frank G. Rubensdörffer Page 79
7 NUMERICAL CALCULATION
7.1 Computational domain
The computational domain, representing one flow passage, models analogue to the experimental setup the inlet section, the airfoil section and the outlet section of the test rig. It is illustrated in Figure 7.1.
Total pressure inlet
Suction side
Static pressure outlet
Periodic boundaries
Pressure side Hub endwall
Figure 7.1: Computational domain for CFD calculations The total pressure inlet of the computational domain is located two chords upstream of the leading edge of the airfoil, where the planar hub endwall begins and the inlet boundary conditions in the test rig have been measured. The tip endwall of the inlet section is formed like the end of a dry low NOX combustion chamber. The airfoil section is represented by the flow passage between the pressure side of the airfoil and the suction side of the next airfoil. A constant heat flux is applied on the hub endwall between the pressure side of the airfoil and the suction side of the next airfoil in the same area where the thin film foil heater is installed in the test rig. The tip endwall, the airfoils and the other walls of the inlet section are adiabatic. After the airfoils the static pressure outlet of the computational domain is located two chords downstream of the airfoil trailing edge in the exit flow direction to assure well-posed outflow conditions without any recirculation or backflow left. The hub and tip walls of the outlet section are modelled as symmetric walls to form a friction- and loss-free flow domain. Periodic boundary conditions were applied on the side walls of the inlet and the outlet section of the computational domain.
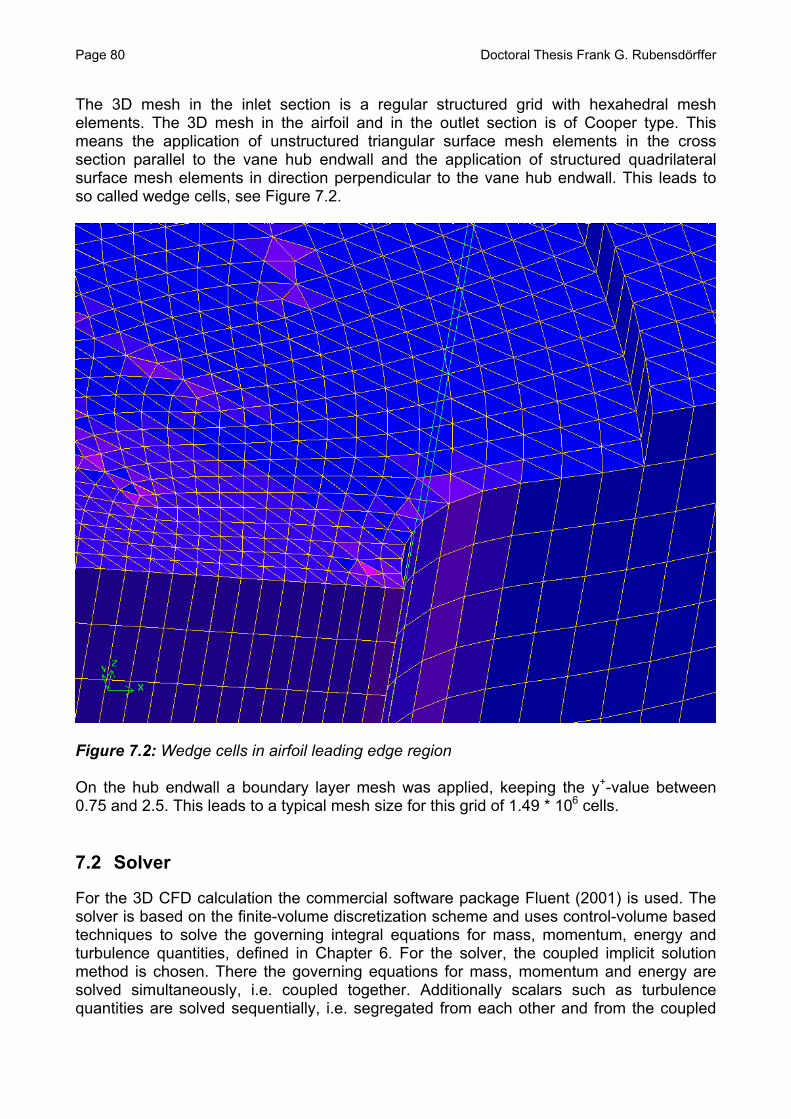
Page 80 Doctoral Thesis Frank G. Rubensdörffer
The 3D mesh in the inlet section is a regular structured grid with hexahedral mesh elements. The 3D mesh in the airfoil and in the outlet section is of Cooper type. This means the application of unstructured triangular surface mesh elements in the cross section parallel to the vane hub endwall and the application of structured quadrilateral surface mesh elements in direction perpendicular to the vane hub endwall. This leads to so called wedge cells, see Figure 7.2.
Figure 7.2: Wedge cells in airfoil leading edge region On the hub endwall a boundary layer mesh was applied, keeping the y+-value between 0.75 and 2.5. This leads to a typical mesh size for this grid of 1.49 * 106 cells. 7.2 Solver
For the 3D CFD calculation the commercial software package Fluent (2001) is used. The solver is based on the finite-volume discretization scheme and uses control-volume based techniques to solve the governing integral equations for mass, momentum, energy and turbulence quantities, defined in Chapter 6. For the solver, the coupled implicit solution method is chosen. There the governing equations for mass, momentum and energy are solved simultaneously, i.e. coupled together. Additionally scalars such as turbulence quantities are solved sequentially, i.e. segregated from each other and from the coupled

Doctoral Thesis Frank G. Rubensdörffer Page 81
quantities. The governing equations are non-linear and coupled. Therefore several iterations of the solution process have to be performed until a converged solution is achieved. The discrete, non-linear governing equations are linearized to an implicit form to produce a system of equations for the dependent variables in every computational cell. The resulting linear equation system is then solved to get an updated flow field solution. Implicit means that for a given variable the unknown value in each cell is calculated using a relation that includes both existing and unknown values from the neighbouring cells. This leads to that each unknown appears in several equations in the system. These equations are solved simultaneously to give the unknown quantities. A second-order upwind discretization scheme is used to convert the governing equations into algebraic equations that can be solved numerically. With this approach the higher-order accuracy in space is achieved by the additional use of the upstream cell gradient when calculating the cell quantities. Multigrid schemes are applied to accelerate the convergence of the solver and by that reduce CPU time needed to obtain a converged solution by computing correction on coarse grid levels. The convergence of the calculation has been checked by the residuals of the continuity, the velocities, the energy, the turbulent kinetic energy, the dissipation rate, the velocity variance scale and the elliptic relaxation function. Additionally the mass and energy balance of the domain have to be fulfilled. The criteria which have to be reached to achieve a converged solution are listed in Table 7.1.
Criterion
Residual of continuity, velocities, turbulent kinetic energy, dissipation, velocity variance scale, elliptic relaxation function
1.0*10-3
Residual of energy 1.0*10-6
Mass balance ∆ m& / m& inlet 1.0*10-5
Energy balance ∆Q/Qinlet 1.0*10-5
Table 7.1: Convergence criteria for flow field quantities The average number of iterations to reach the required convergence criteria with the described solver was around 8000 iterations. 7.3 Grid independence study
For every CFD calculation a grid independence study has to be done to demonstrate that the calculated solution of the flow field is not dependent of the chosen mesh and that the resolution of the mesh for the flow field is fine enough. Normally the calculations start with a coarse mesh. Then the mesh is refined in several steps until the calculated solution no longer depends on the resolution of the mesh. In the present calculation with the application of the v2-f turbulence model it is necessary to keep the y+-value of the first cell of the hub endwall around 1. With this request and the concurrently meeting of the requirement to keep the aspect ratio of the cells lower than 200 it is not possible to create a coarse mesh. Therefore only a fine and a very fine mesh, see Table 7.2, have been created and applied for the grid independence study.

Page 82 Doctoral Thesis Frank G. Rubensdörffer
First cell height in mm y+ on hub endwall Total number of cells
Fine mesh 0.010 0.75 – 2.50 1.49 * 106
Very fine mesh 0.005 0.35 – 1.75 4.19 * 106
Table 7.2: Mesh specifications Figure 7.3 shows the calculated Mach number distribution around the airfoil from pressure side to suction side with the leading edge position at s/smax = 0.457 in the midspan section with assumed boundary conditions for the fine and the very fine mesh.
0.00
0.10
0.20
0.30
0.40
0.50
0.60
0.70
0.80
0.90
1.00
0.00 0.10 0.20 0.30 0.40 0.50 0.60 0.70 0.80 0.90 1.00
s/smax
Mac
h nu
mbe
r
Fine mesh
Very fine mesh
Pressure side Suction side
Leading edge positions/smax=0.457
Figure 7.3: Calculated Mach number distribution around airfoil midspan for the fine and very fine mesh It can be recognized that the course of the Mach number for the fine and very fine mesh are almost congruent except for a small area in the middle of the suction side, where the courses of the Mach numbers show some very small deviations from each other. In Figure 7.4 and in Figure 7.5 the hub endwall temperature distribution for assumed boundary conditions for the fine and the very fine mesh can be seen.

Doctoral Thesis Frank G. Rubensdörffer Page 83
Figure 7.4: Hub endwall temperature distribution for the fine mesh
Figure 7.5: Hub endwall temperature distribution for the very fine mesh Also here the temperature patterns for both meshes are almost congruent with a maximum quantitative deviation of 0.4 K. A small qualitative difference in the heat transfer pattern can be recognized in the trailing edge area.

Page 84 Doctoral Thesis Frank G. Rubensdörffer
The observed deviations for the flow field and the endwall heat transfer between the fine and the very fine mesh can be considered as negligible. Therefore the conclusion is drawn that the fine mesh is appropriate for the calculation of the flow field and the endwall heat transfer of the chosen geometry of the advanced nozzle guide vane of a modern industrial gas turbine.

Doctoral Thesis Frank G. Rubensdörffer Page 85
8 INVESTIGATION OF THE BASELINE CONFIGURATION OF THE ADVANCED NOZZLE GUIDE VANE
8.1 Introduction
For the baseline configuration of the advanced design of the nozzle guide vane of a modern industrial gas turbine aerodynamic and heat transfer measurements according to Chapter 5 and numerical CFD calculations according to Chapter 7 have been carried out. An objective with this approach is to investigate the flow field, the secondary flow features and the basic physical processes defining nozzle guide vane endwall heat transfer. Another objective is to validate the chosen numerical CFD tool against reliable, reproducible measurements for the advanced nozzle guide vane of a modern industrial gas turbine. The boundary conditions for the numerical CFD calculations have been taken from the baseline test cases described in Chapter 5 and can be seen in Table 8.1.
Aerodynamic tests Heat transfer tests
ptotal in 134600 Pa 133845 Pa pstatic out 94126 Pa 99145 Pa Reout 3.35 * 106 3.07 * 106
Tinlet 298.15 K 307.15 K qendwall 0.00 W/m2 7386 W/m2
kinlet 4.60 m2/s2 4.60 m2/s2
εinlet 51.0 m2/s3 51.0 m2/s3
Table 8.1: Boundary conditions for the numerical CFD calculations 8.2 Aerodynamic investigations
Figure 8.1 shows the calculated Mach number distribution around the airfoil from pressure side to suction side with the leading edge position at s/smax = 0.457 in a cross section with constant height in spanwise direction and the measured Mach number distribution around the left and the right airfoil in the rig. The qualitative course of the Mach number conforms to the Mach number course from the total turbine layout for a mid-loaded airfoil of the advanced nozzle guide vane, compare Figure 5.2. The calculated and measured Mach number courses of the investigated case are somewhat lower compared to the design case. This is caused by the lower pressure ratio across the investigated nozzle guide vane due to limitations of the test facility. The comparison of the CFD calculation and the measurements of the baseline configuration shows an overall good agreement on pressure and suction side. On pressure side the measurements show a maximum deviation to the calculation of ∆ Ma = 0.086 (13.5 %) at the end of the airfoil. On suction side the deviation starts at s/smax = 0.80 and reaches a maximum of ∆ Ma = 0.069 (9.4 %). These deviations are mainly caused by the non-adjustable design of the outlet section and the outlet diffusor of the test section, which leads to the small imperfection in the periodicity of the flow field through the test rig.
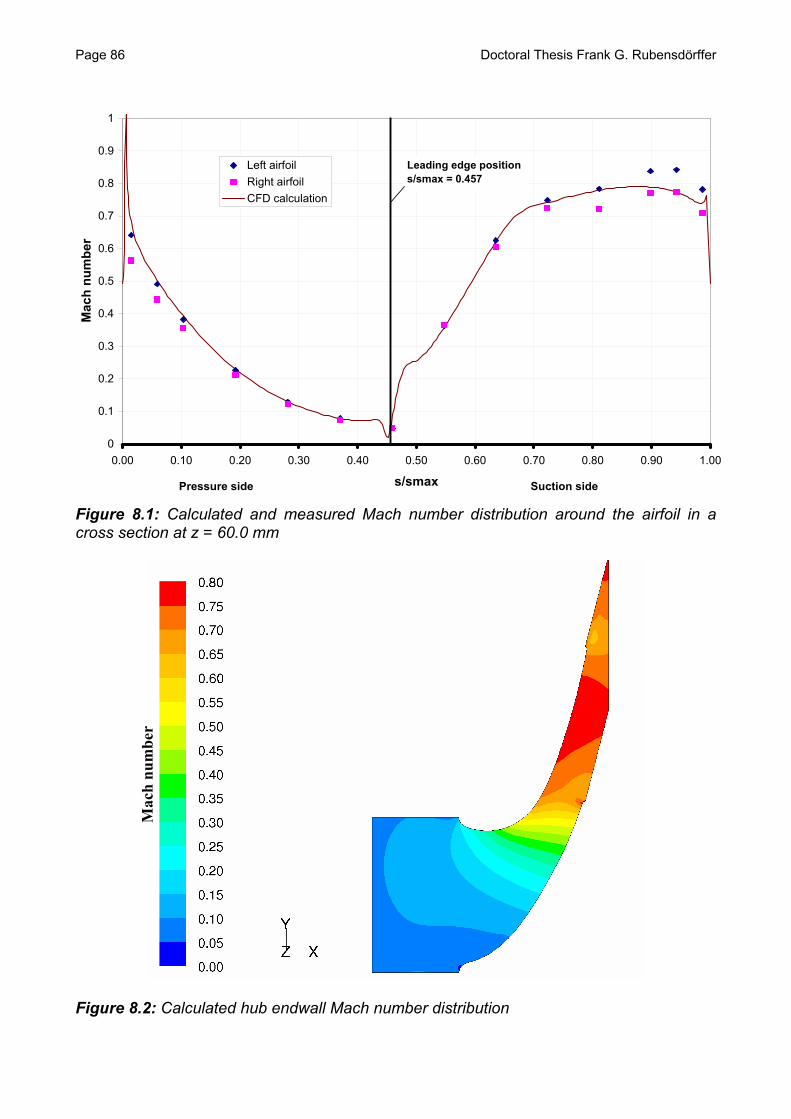
Page 86 Doctoral Thesis Frank G. Rubensdörffer
0
0.1
0.2
0.3
0.4
0.5
0.6
0.7
0.8
0.9
1
0.00 0.10 0.20 0.30 0.40 0.50 0.60 0.70 0.80 0.90 1.00
s/smax
Mac
h nu
mbe
r
Left airfoilRight airfoilCFD calculation
Pressure side Suction side
Leading edge position s/smax = 0.457
Figure 8.1: Calculated and measured Mach number distribution around the airfoil in a cross section at z = 60.0 mm
Mac
h nu
mbe
r
Figure 8.2: Calculated hub endwall Mach number distribution

Doctoral Thesis Frank G. Rubensdörffer Page 87
The calculated airfoil-to-airfoil Mach number distribution on the hub endwall, shown in Figure 8.2, is typical for the advanced design of the airfoil of the nozzle guide vane of a modern industrial gas turbine. It is characterized by the simultaneous velocity growth with no diffusion zones. Hence, the flow separation risk is eliminated. The low acceleration in the front part of the airfoil is designed to minimize the aerodynamic losses related to secondary flow and to cooling air discharged through the film cooling holes in the leading edge region of the airfoil. On the pressure side the flow accelerates moderately with an extremely low overexpansion at the trailing edge region in order to minimize the profile losses. On the suction side the airfoil features a slight overexpansion behind the throat area which, however, does not lead to flow separation, which would be connected with losses and increased heat transfer to the airfoil. The quite uniform velocity distribution of the flow field in the channel reduces the risk of aerodynamic losses due to friction between flow parts having different velocity. All this features contribute to the design target of the airfoil of the advanced nozzle guide vane to reduce the total losses compared to the traditional "flat" type of airfoils. Figure 8.3 shows the locations for the comparison of the calculated and measured Mach number on the hub endwall. The pressure measurements were performed on several defined measurement points whereas the results from the calculation were taken from continuous lines in the flow channel, marked green in Figure 8.3.
-98.0-378.0
X
Y
0.0-41.0
89.5
29.559.5
139.5
Figure 8.3: Mach number comparison locations on hub endwall

Page 88 Doctoral Thesis Frank G. Rubensdörffer
Figure 8.4 shows the comparison of the calculated and measured Mach numbers on the hub endwall at the locations x = -378.0 mm, x = -98.0 mm and x = -41.0 mm in the inlet section upstream the airfoils. At all three locations there is very good agreement with an almost congruent course of the calculations and measurements at x = -98.0 mm and x = -41.0 mm with a maximum deviation less than ∆ Ma = 0.002 (2.2 %). For the Mach number distribution at x = -378.0 mm the maximum deviation is ∆ Ma = 0.007, which is 12.4 % of the calculated Mach number in this section. This seems rather high, but can be explained by the fact that the inlet boundary condition of the CFD calculation is taken from the total pressure measurement at x = - 400.0 mm. In that inlet area, the Mach number is relatively low, thus a small difference between the total and static pressure measurements within the limits of the measurement accuracy will generate a Mach number deviation in the shown magnitude. This impact of the measurement accuracy decreases with the increasing Mach number downstream in the flow field, see Figure 5.17.
0.00
0.02
0.04
0.06
0.08
0.10
0.12
0.14
0.16
-150 -100 -50 0 50 100 150 200 250 300
y coordinate in mm
Mac
h nu
mbe
r
x=-378.0 mmx=-98.0 mmx=-41.0 mmCFD x=-378.0 mmCFD x=-98.0 mmCFD x=-41.0 mm
Figure 8.4: Comparison of calculated and measured Mach number on hub endwall in inlet section before the airfoils In Figure 8.5 the comparison of the calculated and measured Mach numbers on the hub and tip endwall in the leading edge section x = 0.0 mm can be seen. Both at the hub and at the tip endwall there is very good agreement with a maximum deviation of ∆ Ma = 0.005 (3.5 %). Also the comparison on the next three locations in the flow channel between the airfoil pressure and suction side shows a very good agreement with a congruent course of the calculations and the measurements with a maximum deviation less than ∆ Ma = 0.015 (2.3 %) at the third comparison line in the flow channel at x = 89.5 mm, see Figure 8.6.

Doctoral Thesis Frank G. Rubensdörffer Page 89
0.00
0.02
0.04
0.06
0.08
0.10
0.12
0.14
0.16
0.18
0.20
-150 -100 -50 0 50 100 150 200 250 300
y coordinate in mm
Mac
h nu
mbe
r
x=0.0 mm Hubx=0.0 mm TipCFD x=0.0 mm HubCFD x=0.0 mm Tip
Figure 8.5: Comparison of calculated and measured Mach number on hub and tip endwall in leading edge section
0
0.1
0.2
0.3
0.4
0.5
0.6
0.7
0.8
0 20 40 60 80 100 120 140 160 180 200
y coordinate in mm
Mac
h nu
mbe
r
x=29.5 mmx=59.5 mmx=89.5 mmCFD x=29.5 mmCFD x=59.5 mmCFD x=89.5 mm
Figure 8.6: Comparison of calculated and measured Mach number on hub endwall between airfoil pressure and suction side

Page 90 Doctoral Thesis Frank G. Rubensdörffer
Even at the last comparison line downstream of the trailing edge of the airfoils at x = 139.5 mm the agreement between the calculations and the measurements is rather good despite the small imperfectness in the periodicity of the test rig with a maximum deviation less than ∆ Ma = 0.040 (5.4 %), see Figure 8.7. Unfortunately a failure of a pressure measurement system block, measuring the trailing edge section hub and tip pressure occurred at the time when all other data was gathered. A repetition of the measurements has been carried out with only the trailing edge hub middle flow channel pressure taps in operation. Therefore the accounted measurement data shown in Figure 8.7 is not for the complete hub and tip flow channel in the trailing edge section.
0.6
0.65
0.7
0.75
0.8
200 220 240 260 280 300 320 340 360 380 400
y coordinate in mm
Mac
h nu
mbe
r
x=139.5 mm HubCFD x=139.5 mm Hub
Figure 8.7: Comparison of calculated and measured Mach number on hub endwall after airfoil trailing edge Summarizing the very good agreements of the calculated and measured Mach numbers it can be concluded that the applied CFD model is very suitable to calculate the Mach number distribution of the flow field through the advanced nozzle guide vane of a modern industrial gas turbine. 8.3 Secondary flow field and hub endwall heat transfer investigations
The analysed baseline configuration represents the frequently in the open literature examined geometry of an airfoil, which is approached by a parallel flow with an undisturbed endwall boundary layer, see Chapter 3. A commonly used illustrated model of the secondary flow field can be seen in Figure 8.8.

Doctoral Thesis Frank G. Rubensdörffer Page 91
Figure 8.8: Endwall secondary flow model by Takeishi et al. (1989) Characteristic features are the attachment line, the separation saddle point, the endwall separation lines and the several vortices. At the separation saddle point, the approaching boundary layer starts to roll up in front of the airfoil leading edge and divides into a pressure and suction side leg. The pressure and suction side leg follow the endwall separation lines and form the horseshoe vortex. The pressure side leg of the horseshoe vortex migrates in the flow channel over to the next airfoil suction side. The suction side leg of the horseshoe vortex stays on the endwall at the beginning of the airfoil suction side. It separates then from the endwall, following the vane separation line on the airfoil suction side, forming the counter vortex. Under the counter vortex in the corner between the endwall and the airfoil a small corner vortex is developing. Directly on the hub endwall there is a slight crossflow from the pressure side to the suction side of the next airfoil due

Page 92 Doctoral Thesis Frank G. Rubensdörffer
to the pressure gradient. Like all secondary flow models the rate of rotation of the vortices are exaggerated. This means that all shown vortices in reality perform much fewer rotations compared to the illustration. In Figure 8.9 to Figure 8.11 most of the in the model described secondary flow field features can be recognized in the calculated hub endwall streaklines and horseshoe vortex streamlines. These flow features lead to the calculated and measured hub endwall heat transfer pattern, see Figure 8.12 and Figure 8.13.
Endwall cross flow
Pressure side endwall separation line
Suction side endwall separation line
Separation saddle point
Attachment line
Figure 8.9: Calculated streaklines on hub endwall

Doctoral Thesis Frank G. Rubensdörffer Page 93
Figure 8.10: Calculated horseshoe vortex streamlines in leading edge region
Figure 8.11: Course of pressure and suction side leg of horseshoe vortex

Page 94 Doctoral Thesis Frank G. Rubensdörffer
Figure 8.12: Calculated hub endwall heat transfer distribution
Nus
selt
num
ber
Figure 8.13: Measured hub endwall heat transfer distribution

Doctoral Thesis Frank G. Rubensdörffer Page 95
The conversion of the incoming boundary layer into the horseshoe vortex in front of the leading edge causes high heat transfer in that area by the effects of the impingement of the deflected boundary layer and the secondary flow effects described by Bölcs (1969). The pressure and suction side leg of the horseshoe vortex are inducing the endwall separation lines, where the undisturbed incoming thick boundary layer is disordered and a new thin boundary layer emerges. This leads to an increased heat transfer in those areas. In the measurements this feature is not so distinct for the pressure side leg of the horseshoe vortex as in the calculation, probably caused by conductive heat transfer through the bearing endwall plate for the heater foil, which dilutes sharp temperature gradients whereas the calculation assumes a perfect adiabatic wall under the heater foil as boundary condition. Increasing heat transfer in the mean flow path due to flow acceleration and higher heat transfer due to higher suction side velocity form the half moon shape heat transfer pattern on the suction side half of the endwall. Contrary to the secondary flow field model of Takeishi et al. (1989) the suction side leg of the horseshoe vortex of the examined baseline configuration does not separate from the endwall following the vane separation line on the airfoil. Instead the counter vortex stays in corner between the hub endwall and the suction side airfoil. Thus no counterrotating corner vortex emerges. The non-separated counter vortex causes high heat transfer on the hub endwall in the vicinity to the suction side airfoil. The effect that the suction side leg of the horseshoe vortex does not separate from the hub endwall has been observed by the flow visualization experiments by Wiers (2002), who studied a nozzle guide vane with a similar design. The detected features in the endwall secondary flow field and heat transfer pattern are all distinctly recognisable but they are very weak in terms of intensity and geometric extension compared to the studies of less advanced vane geometries in the open literature, see e.g. Figure 3.18 to Figure 3.21. This is the direct consequence of the special geometry of the investigated advanced nozzle guide vane, which is designed to minimize the occurrence of secondary flow and the related losses. The calculated and measured endwall Nusselt number distribution is on the same level as in the investigated geometries in the open literature, compare e.g. with Figure 3.28. Also the level of the calculated and measured endwall Stanton number, evaluated with an inlet Reynolds number of 800000 lies in the range 1 < St * 103 < 10, which agrees with the endwall Stanton number level in the studies of vanes of previous generation gas turbines, see e.g. Figure 3.8 and Figure 3.24. The comparison of the calculation with the measurements shows a very good agreement regarding both the qualitative heat transfer pattern as well as the quantitative values of the hub endwall heat transfer. The quantitative comparison of the calculated and measured heat transfer on the hub endwall leading edge section x = 0.00 mm, defined in Figure 8.3, shows a very good agreement with a maximum deviation less than ∆ Nu = 233 (6.1 %) in front of the leading edge in the heat transfer peaks and less than ∆ Nu = 136 (11.5 %) in the flow channel between the airfoils of, see Figure 8.14.
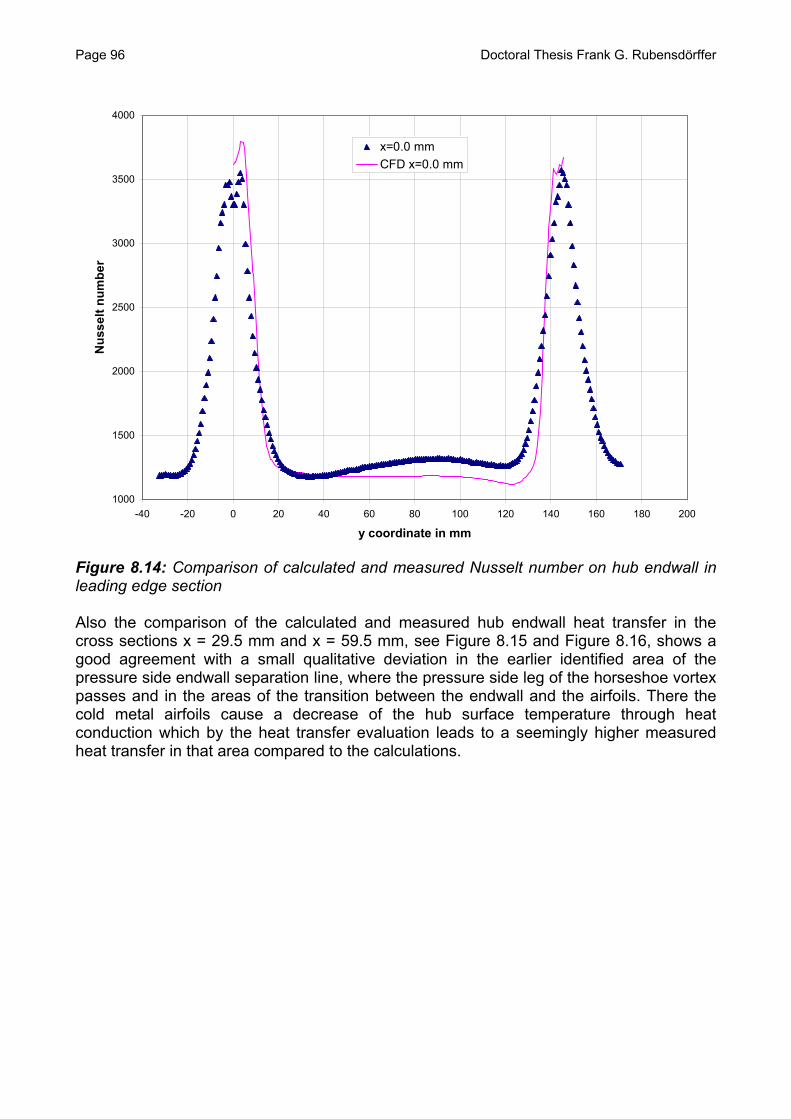
Page 96 Doctoral Thesis Frank G. Rubensdörffer
1000
1500
2000
2500
3000
3500
4000
-40 -20 0 20 40 60 80 100 120 140 160 180 200
y coordinate in mm
Nus
selt
num
ber
x=0.0 mmCFD x=0.0 mm
Figure 8.14: Comparison of calculated and measured Nusselt number on hub endwall in leading edge section Also the comparison of the calculated and measured hub endwall heat transfer in the cross sections x = 29.5 mm and x = 59.5 mm, see Figure 8.15 and Figure 8.16, shows a good agreement with a small qualitative deviation in the earlier identified area of the pressure side endwall separation line, where the pressure side leg of the horseshoe vortex passes and in the areas of the transition between the endwall and the airfoils. There the cold metal airfoils cause a decrease of the hub surface temperature through heat conduction which by the heat transfer evaluation leads to a seemingly higher measured heat transfer in that area compared to the calculations.

Doctoral Thesis Frank G. Rubensdörffer Page 97
1000
1500
2000
2500
3000
3500
0 20 40 60 80 100 120 140
y coordinate in mm
Nus
selt
num
ber
x=29.5 mmCFD x=29.5 mm
Horseshoe vortex pressure side leg passage area
Figure 8.15: Comparison of calculated and measured Nusselt number on hub endwall between airfoil pressure and suction side at x = 29.5 mm
1000
1500
2000
2500
3000
3500
40 50 60 70 80 90 100 110 120 130 140 150
y coordinate in mm
Nus
selt
num
ber
x=59.5 mmCFD x=59.5 mm
Horseshoe vortex pressure side leg passage area
Figure 8.16: Comparison of calculated and measured Nusselt number on hub endwall between airfoil pressure and suction side at x = 59.5 mm
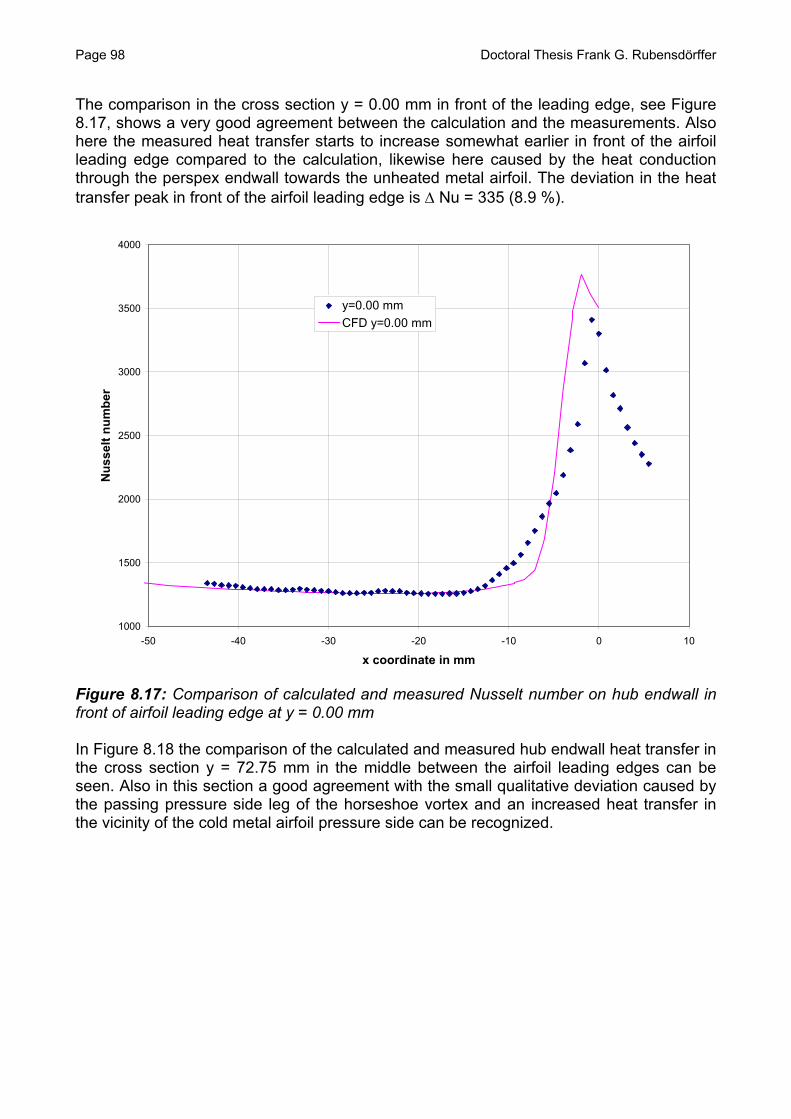
Page 98 Doctoral Thesis Frank G. Rubensdörffer
The comparison in the cross section y = 0.00 mm in front of the leading edge, see Figure 8.17, shows a very good agreement between the calculation and the measurements. Also here the measured heat transfer starts to increase somewhat earlier in front of the airfoil leading edge compared to the calculation, likewise here caused by the heat conduction through the perspex endwall towards the unheated metal airfoil. The deviation in the heat transfer peak in front of the airfoil leading edge is ∆ Nu = 335 (8.9 %).
1000
1500
2000
2500
3000
3500
4000
-50 -40 -30 -20 -10 0 10
x coordinate in mm
Nus
selt
num
ber
y=0.00 mmCFD y=0.00 mm
Figure 8.17: Comparison of calculated and measured Nusselt number on hub endwall in front of airfoil leading edge at y = 0.00 mm In Figure 8.18 the comparison of the calculated and measured hub endwall heat transfer in the cross section y = 72.75 mm in the middle between the airfoil leading edges can be seen. Also in this section a good agreement with the small qualitative deviation caused by the passing pressure side leg of the horseshoe vortex and an increased heat transfer in the vicinity of the cold metal airfoil pressure side can be recognized.
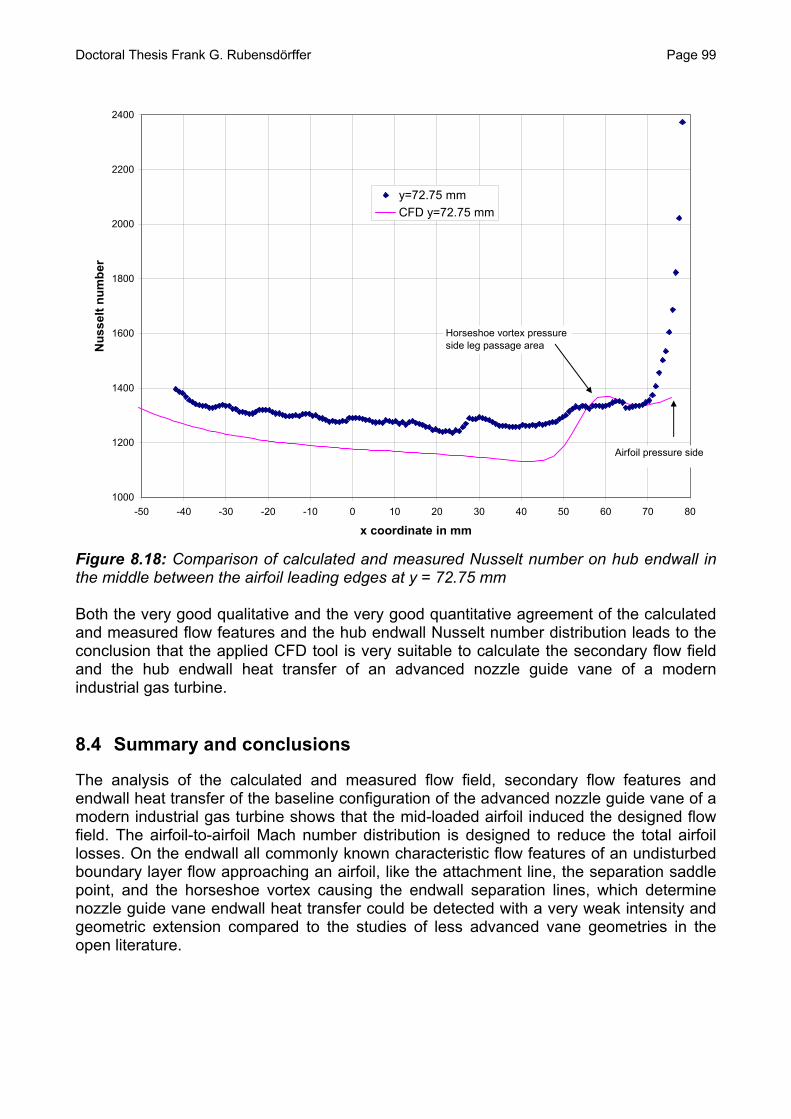
Doctoral Thesis Frank G. Rubensdörffer Page 99
1000
1200
1400
1600
1800
2000
2200
2400
-50 -40 -30 -20 -10 0 10 20 30 40 50 60 70 80
x coordinate in mm
Nus
selt
num
ber
y=72.75 mmCFD y=72.75 mm
Airfoil pressure side
Horseshoe vortex pressure side leg passage area
Figure 8.18: Comparison of calculated and measured Nusselt number on hub endwall in the middle between the airfoil leading edges at y = 72.75 mm Both the very good qualitative and the very good quantitative agreement of the calculated and measured flow features and the hub endwall Nusselt number distribution leads to the conclusion that the applied CFD tool is very suitable to calculate the secondary flow field and the hub endwall heat transfer of an advanced nozzle guide vane of a modern industrial gas turbine. 8.4 Summary and conclusions
The analysis of the calculated and measured flow field, secondary flow features and endwall heat transfer of the baseline configuration of the advanced nozzle guide vane of a modern industrial gas turbine shows that the mid-loaded airfoil induced the designed flow field. The airfoil-to-airfoil Mach number distribution is designed to reduce the total airfoil losses. On the endwall all commonly known characteristic flow features of an undisturbed boundary layer flow approaching an airfoil, like the attachment line, the separation saddle point, and the horseshoe vortex causing the endwall separation lines, which determine nozzle guide vane endwall heat transfer could be detected with a very weak intensity and geometric extension compared to the studies of less advanced vane geometries in the open literature.

Page 100 Doctoral Thesis Frank G. Rubensdörffer
The comparison of the flow field and the hub endwall heat transfer of the baseline configuration of the advanced nozzle guide vane of a modern industrial gas turbine, calculated with the commercial CFD code Fluent with the v2-f turbulence model with reliable, reproducible aerodynamic and heat transfer measurements in the new test rig, shows very good qualitative and quantitative agreement. It has to be pointed out that the improvement of the achieved accuracy in the numerical prediction especially of the endwall heat transfer is enormous compared to previous studies in the open literature with less advanced turbulence models. In previous own research work (Hermann and Rubensdörffer, 2001) the numerical approach with the v2-f turbulence model is validated using a vane experimental case of Arts et al. (1990) with the airfoil geometry of a highly loaded stage of a transonic nozzle guide vane of a high pressure gas turbine. For the in-depth analysis of the performance of the v2-f turbulence model to calculate the flow field and endwall heat transfer of a nozzle guide vane a collaboration research work together with Chalmers University of Technology in Gothenburg/Sweden was arranged in the Cooling Technology Project, organized by the Swedish Gas Turbine Center GTC (2002). In this research work, see Svenningsson (2003), the original v2-f turbulence model by Durbin (1991) and its variants by Kalitzin (1999) and Lien and Kalitzin (2001) were analyzed and validated in detail using the Kang and Thole (1999) experimental test case. This test case applied a short thick airfoil with a large leading edge radius, generating a relatively high level of secondary flow and related losses. The airfoil is taken from a nozzle guide vane of a modern jet engine. From this collaboration research work the conclusion can be drawn, that the original v2-f turbulence model by Durbin implemented in the commercial CFD code Fluent (2001) is an accurate tool regarding prediction of nozzle guide vane flow field and endwall heat transfer. The same nozzle guide vane geometry from Kang and Thole (1999) is used by Hermanson et al. (2002), where the superiority of the v2-f turbulence model in predicting endwall heat transfer compared to less advanced turbulence models for different flow conditions is proven. Kalitzin and Iaccarino (1999) verified the v2-f turbulence model with measurements by Giel et al. (1996) with the airfoil geometry of an advanced high-turning turbine blade of a high specific work rotor. From this it follows that the numerical approach with the v2-f turbulence model is validated also for different vane and blade geometries and for different flow conditions. Thus the chosen numerical CFD tool with the v2-f turbulence model exhibits a high level of general applicability and is not tuned to a special vane or blade geometry. This leads to the conclusion that the v2-f turbulence model is superior to less advanced turbulence models for vane flow field and endwall heat transfer calculations. Therefore the CFD code Fluent with the v2-f turbulence model has been selected for the research of the influence of several geometric variants of the baseline configuration on the flow field and the hub endwall heat transfer of the advanced nozzle guide vane of a modern industrial gas turbine.

Doctoral Thesis Frank G. Rubensdörffer Page 101
9 INFLUENCE OF THE SELECTED GEOMETRIC VARIANTS ON NOZZLE GUIDE VANE FLOW FIELD AND ENDWALL HEAT
TRANSFER
9.1 Description of the geometric variants and the calculation cases
The baseline configuration with the flat hub endwall is a rather academic case, where the basic flow features and endwall heat transfer of an undisturbed parallel flow field approaching the airfoil of an advanced nozzle guide vane of a modern industrial gas turbine have been investigated. In Figure 9.1 the real design of the hot gas path of a modern industrial gas turbine, starting with the end of the dry low NOX combustion chamber, including the nozzle guide vane and the first blade of the turbine can be seen. Typical design features are the converging end of the combustion chamber, the heat shields in front of the nozzle guide vane and the cavities between the combustion chamber end and the nozzle guide vane.
Tip cavity
Dry low NOX combustion chamber end
Tip endwall
Heat shields Nozzle guide
vane First blade
Hub endwall
Hub cavity
Figure 9.1: Hot gas path of a modern industrial gas turbine
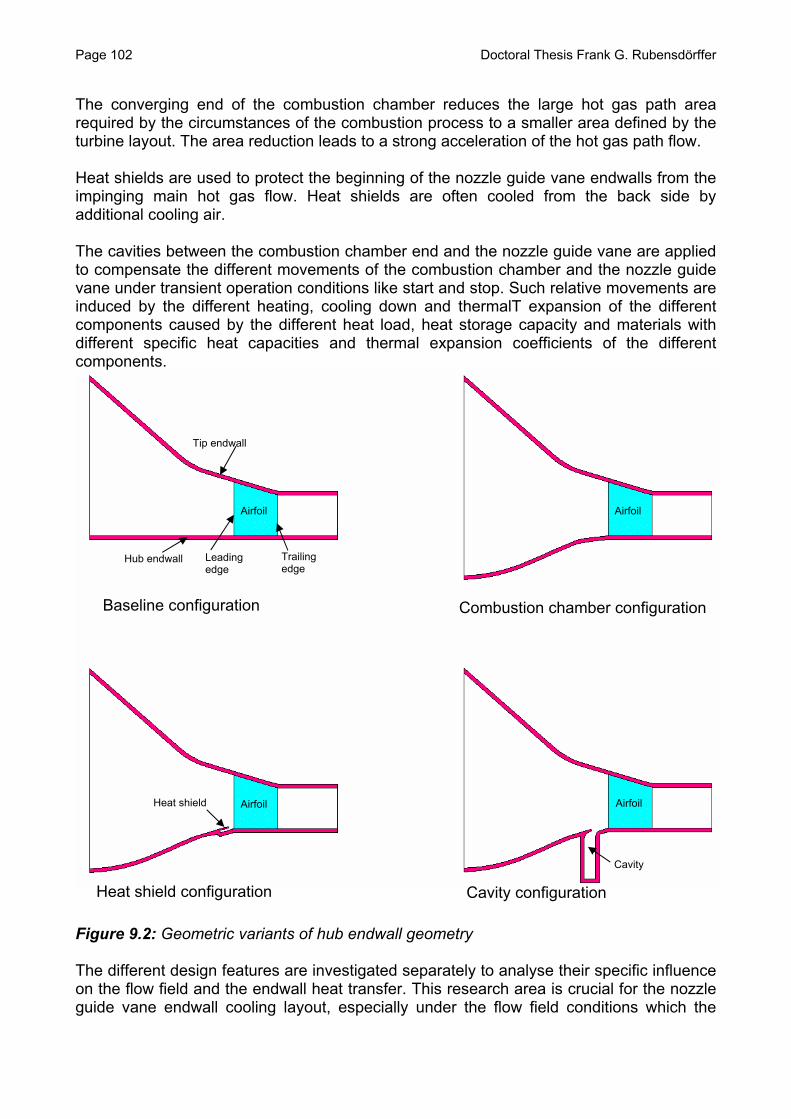
Page 102 Doctoral Thesis Frank G. Rubensdörffer
The converging end of the combustion chamber reduces the large hot gas path area required by the circumstances of the combustion process to a smaller area defined by the turbine layout. The area reduction leads to a strong acceleration of the hot gas path flow. Heat shields are used to protect the beginning of the nozzle guide vane endwalls from the impinging main hot gas flow. Heat shields are often cooled from the back side by additional cooling air. The cavities between the combustion chamber end and the nozzle guide vane are applied to compensate the different movements of the combustion chamber and the nozzle guide vane under transient operation conditions like start and stop. Such relative movements are induced by the different heating, cooling down and thermalT expansion of the different components caused by the different heat load, heat storage capacity and materials with different specific heat capacities and thermal expansion coefficients of the different components.
Tip endwall
Airfoil Airfoil
Trailing edge
Leading edge
Hub endwall
Baseline configuration Combustion chamber configuration
Heat shield Airfoil Airfoil
Cavity
Heat shield configuration Cavity configuration Figure 9.2: Geometric variants of hub endwall geometry The different design features are investigated separately to analyse their specific influence on the flow field and the endwall heat transfer. This research area is crucial for the nozzle guide vane endwall cooling layout, especially under the flow field conditions which the
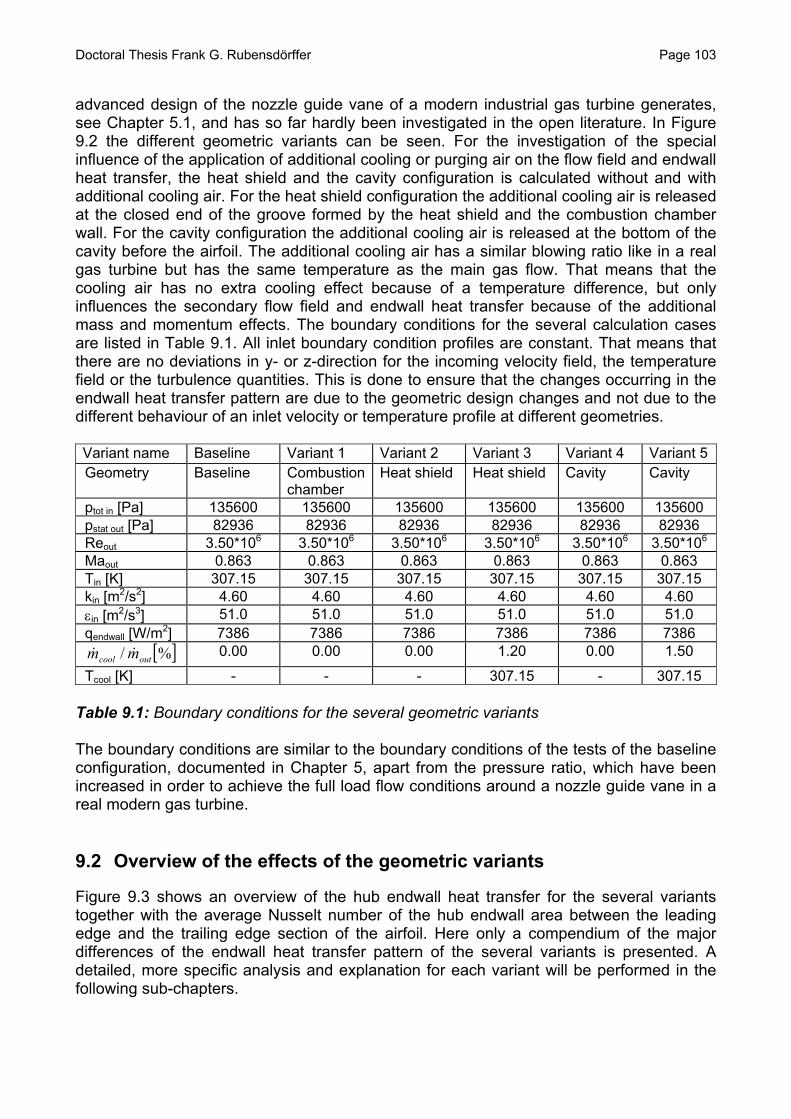
Doctoral Thesis Frank G. Rubensdörffer Page 103
advanced design of the nozzle guide vane of a modern industrial gas turbine generates, see Chapter 5.1, and has so far hardly been investigated in the open literature. In Figure 9.2 the different geometric variants can be seen. For the investigation of the special influence of the application of additional cooling or purging air on the flow field and endwall heat transfer, the heat shield and the cavity configuration is calculated without and with additional cooling air. For the heat shield configuration the additional cooling air is released at the closed end of the groove formed by the heat shield and the combustion chamber wall. For the cavity configuration the additional cooling air is released at the bottom of the cavity before the airfoil. The additional cooling air has a similar blowing ratio like in a real gas turbine but has the same temperature as the main gas flow. That means that the cooling air has no extra cooling effect because of a temperature difference, but only influences the secondary flow field and endwall heat transfer because of the additional mass and momentum effects. The boundary conditions for the several calculation cases are listed in Table 9.1. All inlet boundary condition profiles are constant. That means that there are no deviations in y- or z-direction for the incoming velocity field, the temperature field or the turbulence quantities. This is done to ensure that the changes occurring in the endwall heat transfer pattern are due to the geometric design changes and not due to the different behaviour of an inlet velocity or temperature profile at different geometries. Variant name Baseline Variant 1 Variant 2 Variant 3 Variant 4 Variant 5 Geometry Baseline Combustion
chamber Heat shield Heat shield Cavity Cavity
ptot in [Pa] 135600 135600 135600 135600 135600 135600 pstat out [Pa] 82936 82936 82936 82936 82936 82936 Reout 3.50*106 3.50*106 3.50*106 3.50*106 3.50*106 3.50*106
Maout 0.863 0.863 0.863 0.863 0.863 0.863 Tin [K] 307.15 307.15 307.15 307.15 307.15 307.15 kin [m2/s2] 4.60 4.60 4.60 4.60 4.60 4.60 εin [m2/s3] 51.0 51.0 51.0 51.0 51.0 51.0 qendwall [W/m2] 7386 7386 7386 7386 7386 7386
[ ]%/ outcool mm && 0.00 0.00 0.00 1.20 0.00 1.50
Tcool [K] - - - 307.15 - 307.15 Table 9.1: Boundary conditions for the several geometric variants The boundary conditions are similar to the boundary conditions of the tests of the baseline configuration, documented in Chapter 5, apart from the pressure ratio, which have been increased in order to achieve the full load flow conditions around a nozzle guide vane in a real modern gas turbine. 9.2 Overview of the effects of the geometric variants
Figure 9.3 shows an overview of the hub endwall heat transfer for the several variants together with the average Nusselt number of the hub endwall area between the leading edge and the trailing edge section of the airfoil. Here only a compendium of the major differences of the endwall heat transfer pattern of the several variants is presented. A detailed, more specific analysis and explanation for each variant will be performed in the following sub-chapters.
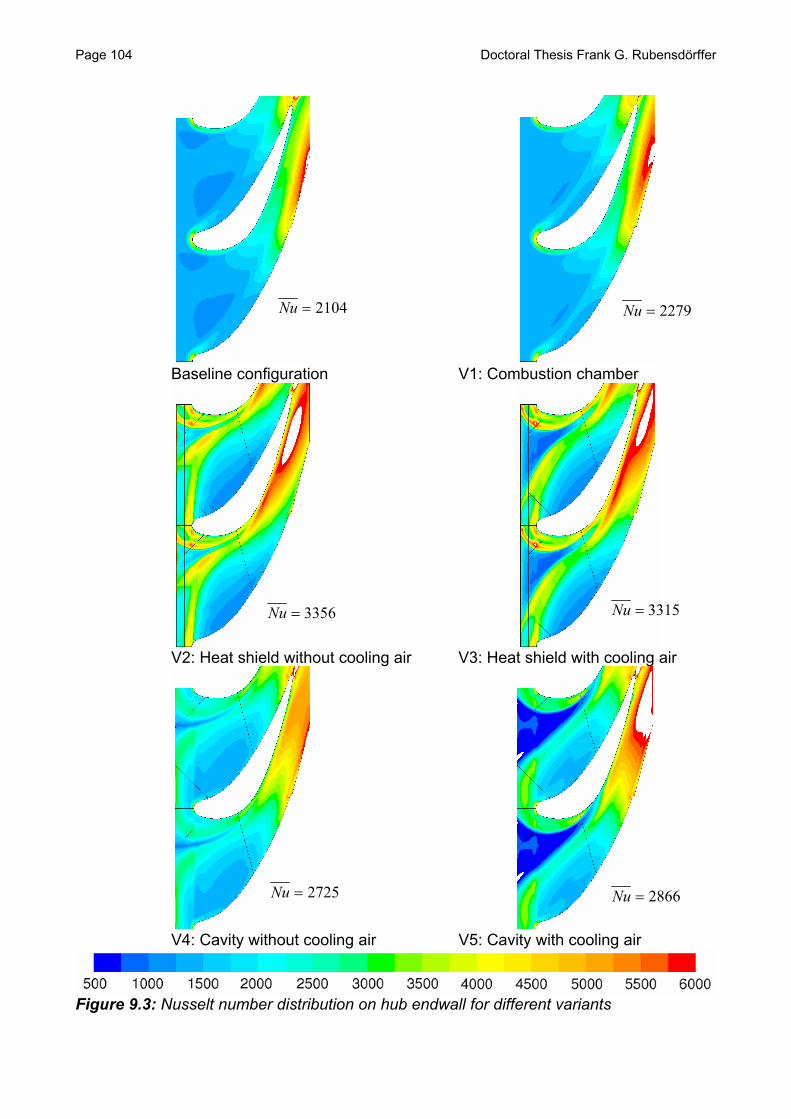
Page 104 Doctoral Thesis Frank G. Rubensdörffer
2104=Nu
Baseline confi
V2: Heat shiel
V4: Cavity wit
Figure 9.3: Nusselt number
2279=Nu
guration V1: Combustion cham
3356=Nu
d without cooling air V3: Heat shield with c
2725=Nu
hout cooling air V5: Cavity with cooling
distribution on hub endwall for different variants
ber
3315=Nu
ooling air
2866=Nu
air

Doctoral Thesis Frank G. Rubensdörffer Page 105
The baseline and the combustion chamber configuration have nearly the same endwall heat transfer pattern with a slightly higher average heat transfer for the combustion chamber configuration. All flow features documented in Chapter 8 like the horseshoe vortex, etc are visible. The heat shield configuration shows a much higher average heat transfer with a completely different structure of the heat transfer pattern in the leading edge region. In the trailing edge region, the area of the highest heat transfer is placed in the vicinity of the suction side, whereas for the baseline and the combustion chamber configuration the area of the highest heat transfer is placed in the vicinity of the pressure side. The additional cooling air has a moderate influence on the heat transfer pattern. The average heat transfer for the cavity configuration is lower than for the heat shield configuration, but higher than for the baseline and the combustion chamber configuration. The additional cooling air has a moderate influence on the characteristics of the heat transfer pattern. In Figure 9.5 the axial velocity distribution in the plane x = -5.0 mm after the obstructions just upstream the leading edge of the vane for the several variants can be seen. The pictures show the contour plot for one flow passage between the pressure side and next suction side of the vane in main flow direction, see Figure 9.4.
Suction side
Pressure side
Figure 9.4: Position of the velocity distribution plane at x = -5.0 mm in baseline configuration

Page 106 Doctoral Thesis Frank G. Rubensdörffer
Tip
Suction side Pressure
side
Hub
Baseline configuration V1: Combustion chamber
V2: Heat shield without cooling air V3: Heat shield with cooling air
V4: Cavity without cooling air V5: Cavity with cooling air
Figure 9.5: Axial velocity distribution on plane x = -5.0 mm for different variants
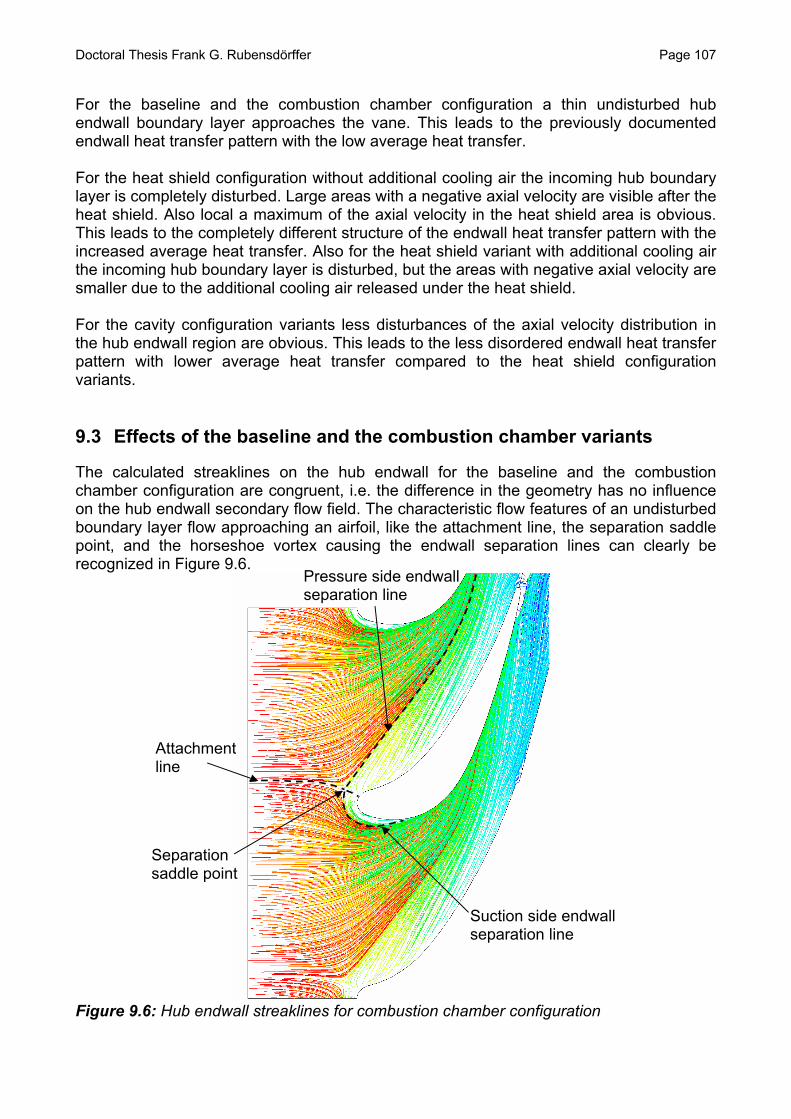
Doctoral Thesis Frank G. Rubensdörffer Page 107
For the baseline and the combustion chamber configuration a thin undisturbed hub endwall boundary layer approaches the vane. This leads to the previously documented endwall heat transfer pattern with the low average heat transfer. For the heat shield configuration without additional cooling air the incoming hub boundary layer is completely disturbed. Large areas with a negative axial velocity are visible after the heat shield. Also local a maximum of the axial velocity in the heat shield area is obvious. This leads to the completely different structure of the endwall heat transfer pattern with the increased average heat transfer. Also for the heat shield variant with additional cooling air the incoming hub boundary layer is disturbed, but the areas with negative axial velocity are smaller due to the additional cooling air released under the heat shield. For the cavity configuration variants less disturbances of the axial velocity distribution in the hub endwall region are obvious. This leads to the less disordered endwall heat transfer pattern with lower average heat transfer compared to the heat shield configuration variants. 9.3 Effects of the baseline and the combustion chamber variants
The calculated streaklines on the hub endwall for the baseline and the combustion chamber configuration are congruent, i.e. the difference in the geometry has no influence on the hub endwall secondary flow field. The characteristic flow features of an undisturbed boundary layer flow approaching an airfoil, like the attachment line, the separation saddle point, and the horseshoe vortex causing the endwall separation lines can clearly be recognized in Figure 9.6.
Pressure side endwall separation line
Separation saddle point
Attachment line
Suction side endwall separation line
Figure 9.6: Hub endwall streaklines for combustion chamber configuration

Page 108 Doctoral Thesis Frank G. Rubensdörffer
The almost identical hub endwall secondary flow field of the baseline and the combustion chamber configuration results in the nearly identical hub endwall heat transfer pattern of both configurations. This can be seen for the combustion chamber configuration in Figure 9.7, with the high heat transfer in the leading edge area LE and in the area of the hub endwall separation lines PS and SS1 and the half moon shape heat transfer pattern at SS2 on the suction side half of the hub endwall.
SS1
PS
Figure 9.7: Hub endwall heat transfer distribution for combusti The slightly overall higher heat transfer on the hub endwall configuration is induced by the acceleration of the flow field icombustion chamber before the airfoil passage. This leaincoming boundary layer for the combustion chamber conbaseline configuration. 9.4 Effects of the heat shield variant
9.4.1 Effects of the heat shield variant without additional
There are seven areas in the hub endwall heat transfer configuration without additional cooling air, marked in Figure 9from the endwall heat transfer pattern of the baseline configura
SS2
LE
LE
on chamber configuration
of the combustion chamber n the converging end of the ds to a somewhat thinner figuration compared to the
cooling air
pattern of the heat shield .8, which differs distinctively tion.
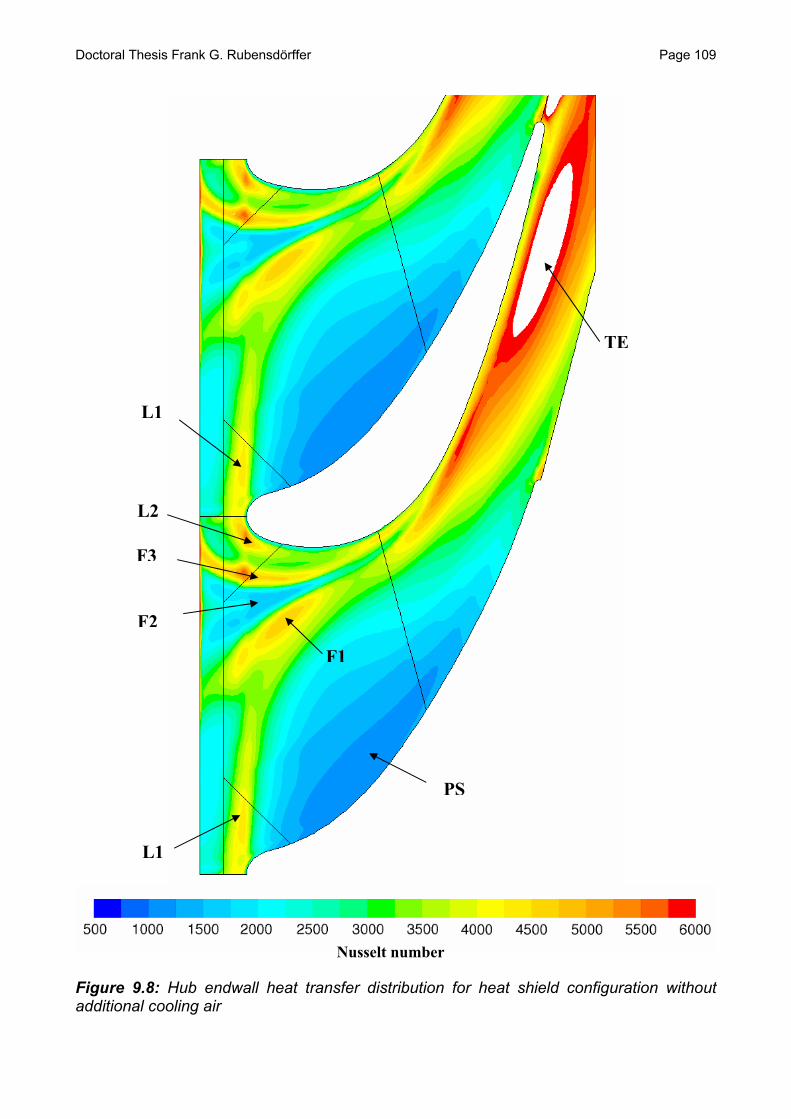
Doctoral Thesis Frank G. Rubensdörffer Page 109
1
Figure 9.8: Hub endwall heat tranadditional cooling air
Nusselt number
F1
F3
L2
L
sfer distributio
PS
F2
n for heat shield conf
TE
L1
iguration without

Page 110 Doctoral Thesis Frank G. Rubensdörffer
The incoming boundary layer is deflected after the heat shield, impinges on the hub endwall, forming a longitudinal vortex, see Figure 9.9.
L1
Heat shield
Leading edge
Figure 9.9: Longitudinal vortex after hub heat shield
F3
F2
F1
Heat shield
L1
Figure 9.10: Development of the flank vortices

Doctoral Thesis Frank G. Rubensdörffer Page 111
This leads together with the weak horseshoe vortex in front of the airfoil leading edge to an increased heat transfer in area L1 and L2. The deflected air from the pressure side moves under the heat shield towards the area F2. Also the deflected air from the leading edge zone and the suction side moves in the other direction towards area F2. Here the percentage of the deflected boundary layer air going from the pressure side towards area F2 is higher than the percentage of the leading edge and suction side air. In area F2 the boundary layer flow field is calm and undisturbed. This leads to a relatively low heat transfer in that area. Area F2 is wedged by two counterrotating flank vortices, which emanate from the deflected hub boundary layer air, leaving the heat shield cavity, see Figure 9.10. These phenomena cause high heat transfer in the areas F1 and F3. Above the area F1 the longitudinal vortex after the heat shield merges with the flank vortex of the pressure side air leaving the heat shield cavity. It forms a strong clockwise rotating vortex, see Figure 9.11.
TE
Figure 9.11: Development of the counter vortex

Page 112 Doctoral Thesis Frank G. Rubensdörffer
The weaker, counterrotating flank vortex emanating from the deflected leading edge and suction side boundary layer air meets the clockwise rotating vortex at the end of area F2 and is overridden and assimilated into a strong clockwise rotating passage vortex, which causes together with the accelerating flow a high heat transfer in area TE. In the area PS the heat transfer is relatively low. Here the boundary layer air, which is not involved in the longitudinal heat shield vortex, flows undisturbed over the hub endwall, forming a new insulating boundary layer, see Figure 9.12.
PS
Figure 9.12: Streamlines of boundary layer air covering area PS The pressure side leg of the horseshoe vortex, causing high heat transfer in the area PS in the baseline configuration is here in the heat shield configuration without cooling air absorbed and included into the longitudinal heat shield vortex. So the area of increased endwall heat transfer moves from the area PS to the area F1 towards the next suction side in the flow channel. The spots with high heat transfer in the areas L2 and F3 are caused by a combination of the effects of the flank and the horseshoe vortex respectively together with the longitudinal heat shield vortex. 9.4.2 Effects of the heat shield variant with additional cooling air
Figure 9.13 shows the hub endwall heat transfer pattern for the heat shield configuration with additional cooling air. The most obvious difference to the heat shield configuration without cooling air is the enlarged low heat transfer area F2. There the additional cooling air leaves the heat shield cavity, building up an undisturbed boundary layer flow, which leads to low heat transfer in the triangular area, see Figure 9.14.
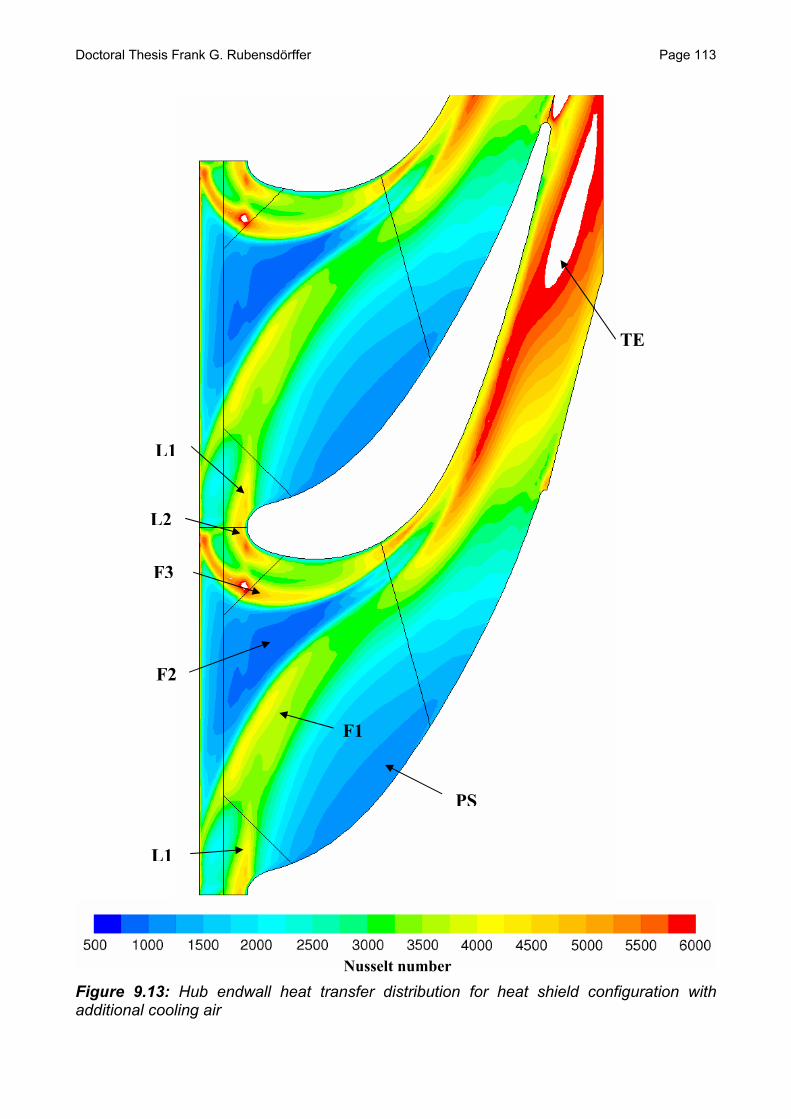
Doctoral Thesis Frank G. Rubensdörffer Page 113
TE
L1
L2
F3
F2
F1
PS
L1
Nusselt numberFigure 9.13: Hub endwall heat transfer distribution for heat shield configuration with additional cooling air

Page 114 Doctoral Thesis Frank G. Rubensdörffer
F2
Figure 9.14: Streamlines of additional cooling air leaving the heat shield cavity This effect was also observed in a real modern industrial gas turbine in operation with a similar airfoil profile. In Figure 9.15 the triangular area F2 approx. 1/3 of the pitch from the airfoil suction side affected by the cold cooling air leaving the heat shield cavity can clearly be recognized.
Film cooled leading edge
Airfoil pressure
side
Z
Y X
F2 Hub endwall
Heat shield
Figure 9.15: Nozzle guide vane surface discoloration
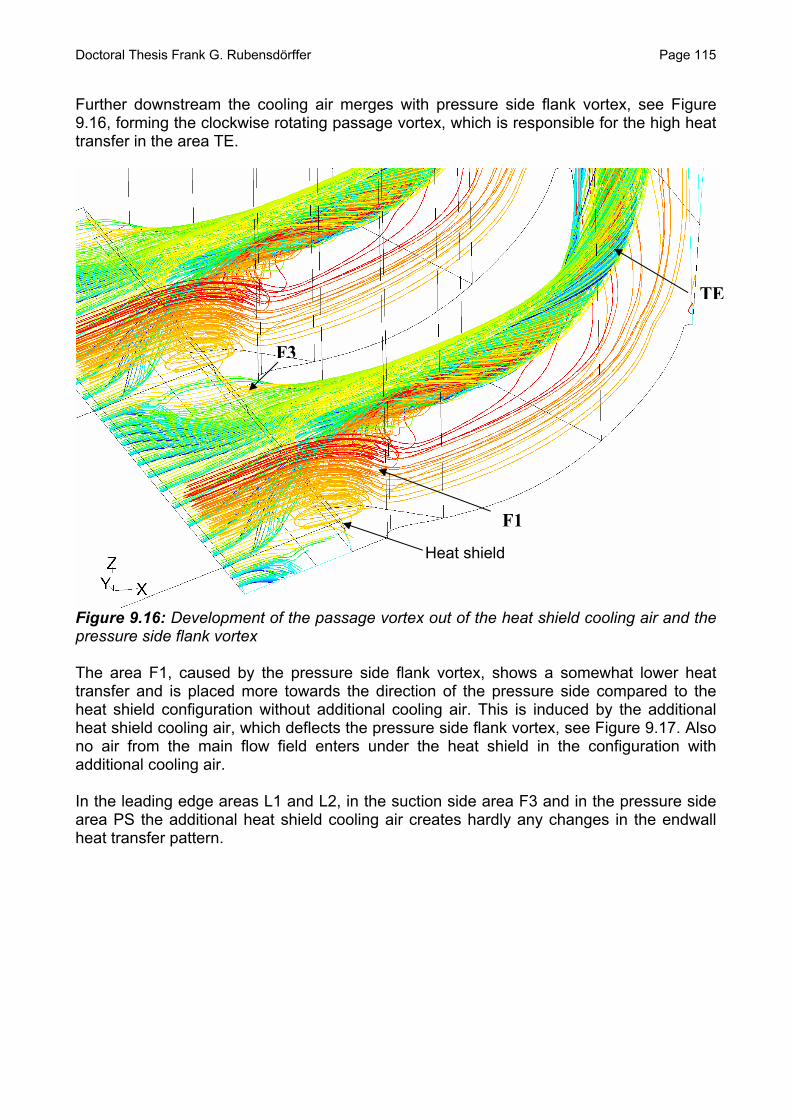
Doctoral Thesis Frank G. Rubensdörffer Page 115
Further downstream the cooling air merges with pressure side flank vortex, see Figure 9.16, forming the clockwise rotating passage vortex, which is responsible for the high heat transfer in the area TE.
TE
F3
F1
Heat shield
Figure 9.16: Development of the passage vortex out of the heat shield cooling air and the pressure side flank vortex The area F1, caused by the pressure side flank vortex, shows a somewhat lower heat transfer and is placed more towards the direction of the pressure side compared to the heat shield configuration without additional cooling air. This is induced by the additional heat shield cooling air, which deflects the pressure side flank vortex, see Figure 9.17. Also no air from the main flow field enters under the heat shield in the configuration with additional cooling air. In the leading edge areas L1 and L2, in the suction side area F3 and in the pressure side area PS the additional heat shield cooling air creates hardly any changes in the endwall heat transfer pattern.
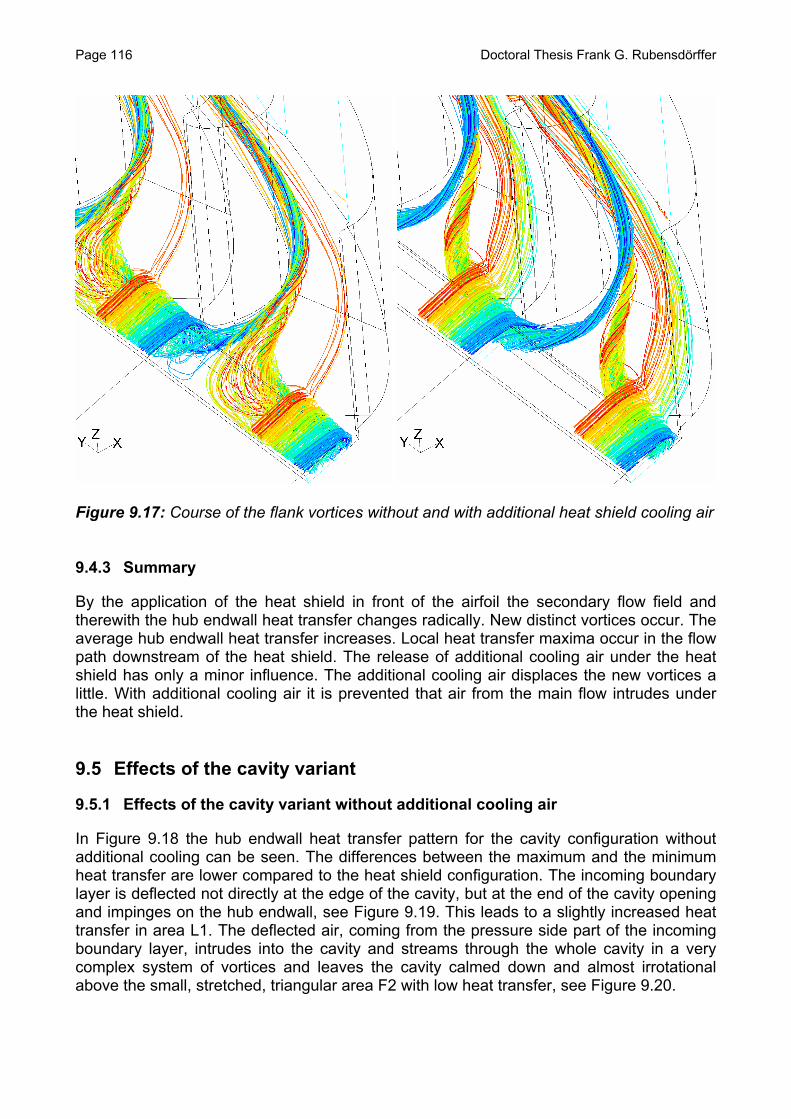
Page 116 Doctoral Thesis Frank G. Rubensdörffer
Figure 9.17: Course of the flank vortices without and with additional heat shield cooling air 9.4.3 Summary
By the application of the heat shield in front of the airfoil the secondary flow field and therewith the hub endwall heat transfer changes radically. New distinct vortices occur. The average hub endwall heat transfer increases. Local heat transfer maxima occur in the flow path downstream of the heat shield. The release of additional cooling air under the heat shield has only a minor influence. The additional cooling air displaces the new vortices a little. With additional cooling air it is prevented that air from the main flow intrudes under the heat shield. 9.5 Effects of the cavity variant
9.5.1 Effects of the cavity variant without additional cooling air
In Figure 9.18 the hub endwall heat transfer pattern for the cavity configuration without additional cooling can be seen. The differences between the maximum and the minimum heat transfer are lower compared to the heat shield configuration. The incoming boundary layer is deflected not directly at the edge of the cavity, but at the end of the cavity opening and impinges on the hub endwall, see Figure 9.19. This leads to a slightly increased heat transfer in area L1. The deflected air, coming from the pressure side part of the incoming boundary layer, intrudes into the cavity and streams through the whole cavity in a very complex system of vortices and leaves the cavity calmed down and almost irrotational above the small, stretched, triangular area F2 with low heat transfer, see Figure 9.20.
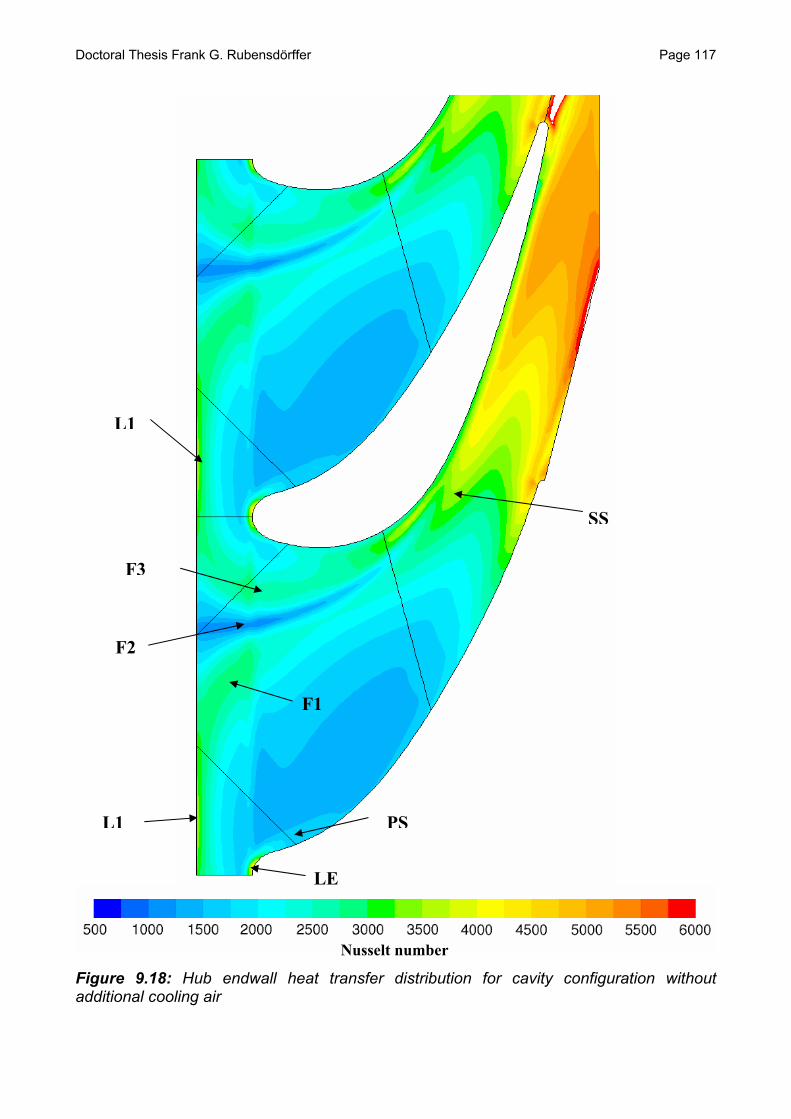
Doctoral Thesis Frank G. Rubensdörffer Page 117
L1
SS
F3
F2
F1
L1 PS
LE
Nusselt number
Figure 9.18: Hub endwall heat transfer distribution for cavity configuration without additional cooling air

Page 118 Doctoral Thesis Frank G. Rubensdörffer
F2
L1
Leading edge Cavity
Figure 9.19: Impingement of the pressure side boundary layer air
F2
Leading edge
Cavity
Figure 9.20: Course of the intruded cavity air
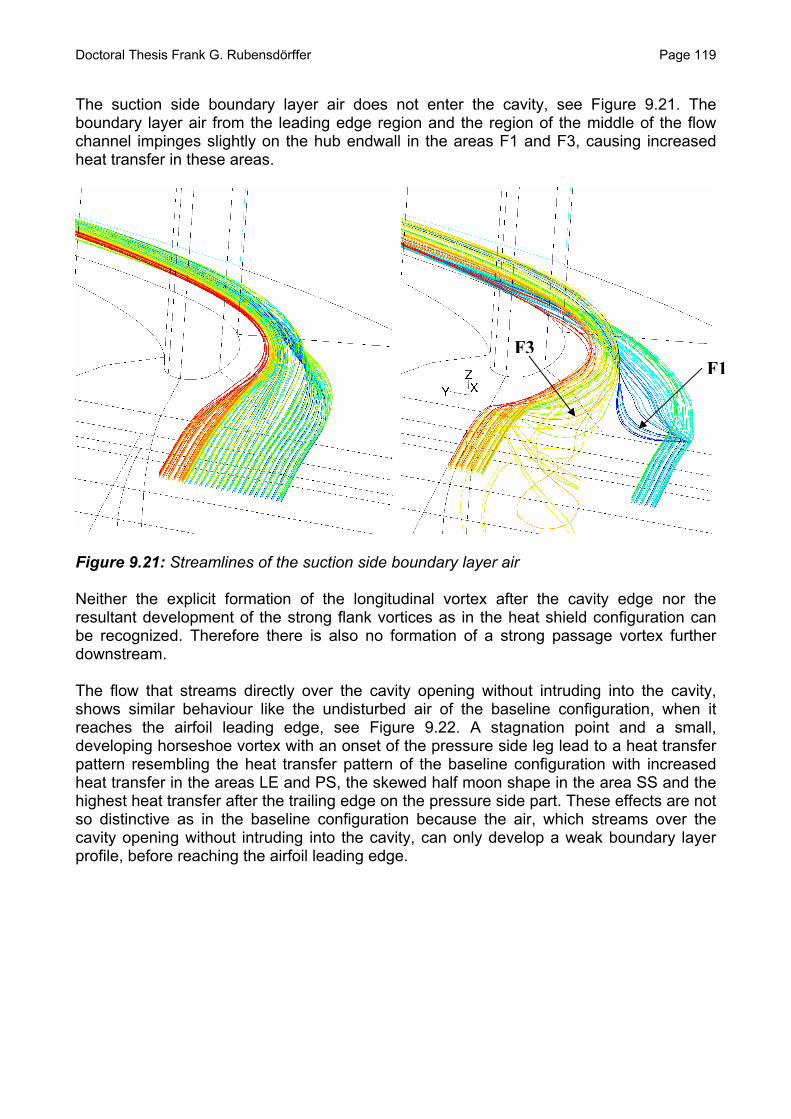
Doctoral Thesis Frank G. Rubensdörffer Page 119
The suction side boundary layer air does not enter the cavity, see Figure 9.21. The boundary layer air from the leading edge region and the region of the middle of the flow channel impinges slightly on the hub endwall in the areas F1 and F3, causing increased heat transfer in these areas.
F3F1
Figure 9.21: Streamlines of the suction side boundary layer air Neither the explicit formation of the longitudinal vortex after the cavity edge nor the resultant development of the strong flank vortices as in the heat shield configuration can be recognized. Therefore there is also no formation of a strong passage vortex further downstream. The flow that streams directly over the cavity opening without intruding into the cavity, shows similar behaviour like the undisturbed air of the baseline configuration, when it reaches the airfoil leading edge, see Figure 9.22. A stagnation point and a small, developing horseshoe vortex with an onset of the pressure side leg lead to a heat transfer pattern resembling the heat transfer pattern of the baseline configuration with increased heat transfer in the areas LE and PS, the skewed half moon shape in the area SS and the highest heat transfer after the trailing edge on the pressure side part. These effects are not so distinctive as in the baseline configuration because the air, which streams over the cavity opening without intruding into the cavity, can only develop a weak boundary layer profile, before reaching the airfoil leading edge.

Page 120 Doctoral Thesis Frank G. Rubensdörffer
PS
LE
Figure 9.22: Streamlines of the flow approaching to the airfoil leading edge 9.5.2 Effects of the cavity variant with additional cooling air
The hub endwall heat transfer pattern for the cavity configuration with additional cooling can be seen in Figure 9.23. The additional cooling air, released from the bottom of the cavity, streams nearly undisturbed without any vortices through the cavity, see Figure 9.24. The additional cooling air exits the cavity at the suction side half of the cavity opening, see Figure 9.25, and forms an undisturbed boundary layer flow which leads to the large triangular area F2 with low heat transfer. This area is bordered by two weak flank vortices, formed by boundary layer air which is deflected into the region after the cavity beyond the reach of the additional cooling air, see Figure 9.26. The flank vortices cause increased heat transfer in the areas F1 and F3, but they are not as distinctive as in the heat shield configuration. Therefore the resulting heat transfer in the areas F1 and F3 are lower compared to the heat shield configuration. Further downstream the flank vortices merge with the additional cooling air to the clockwise rotating passage vortex, which causes the increase of the area TE with high heat transfer and its displacement towards the suction side compared to the cavity configuration without additional cooling air. In area L1 the increased heat transfer is caused by the boundary layer air, which impinges on the hub endwall, see Figure 9.27. Area L1 is located further downstream because of the effects of the additional cooling.
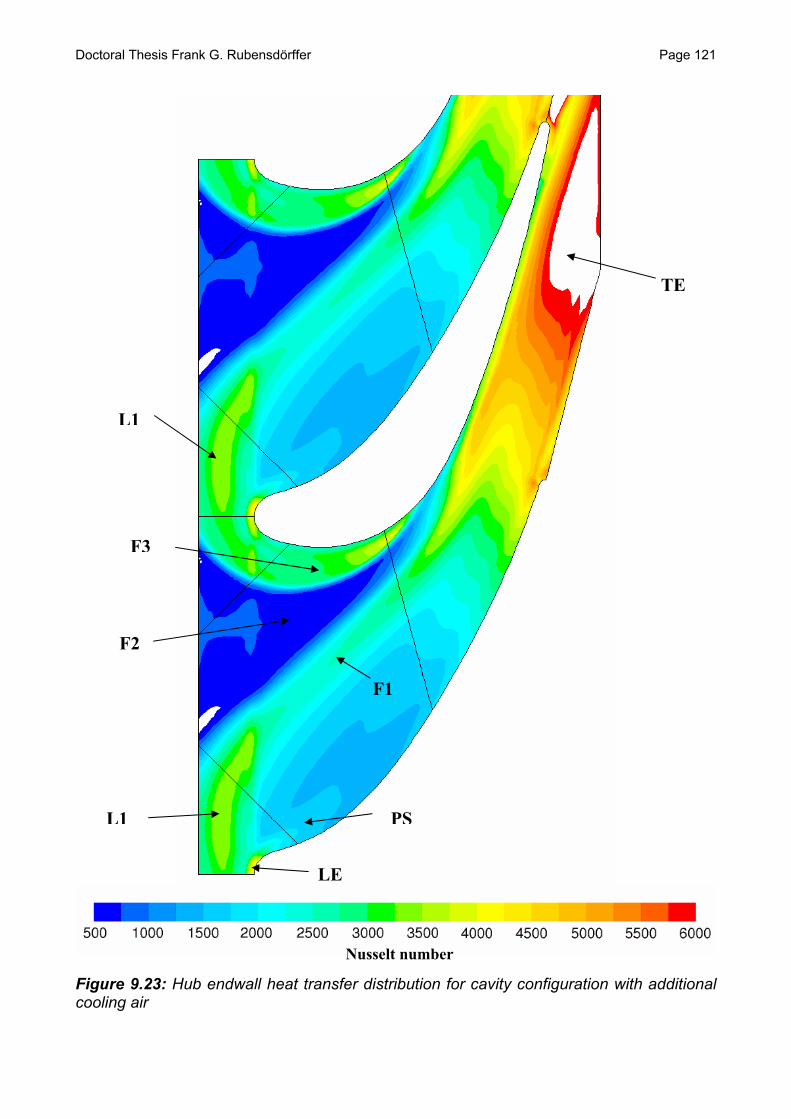
Doctoral Thesis Frank G. Rubensdörffer Page 121
TE
L1
F3
F2
F1
L1 PS
LE
Nusselt number
Figure 9.23: Hub endwall heat transfer distribution for cavity configuration with additional cooling air
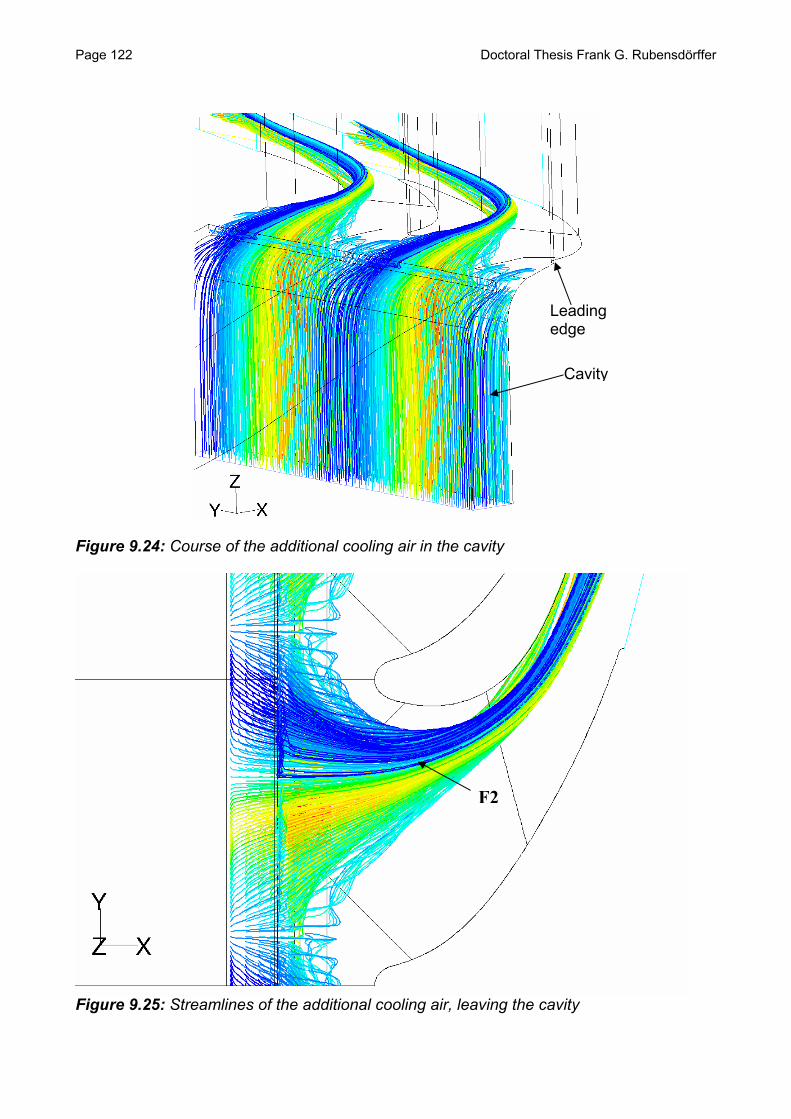
Page 122 Doctoral Thesis Frank G. Rubensdörffer
Leading edge
Cavity
Figure 9.24: Course of the additional cooling air in the cavity
F2
Figure 9.25: Streamlines of the additional cooling air, leaving the cavity

Doctoral Thesis Frank G. Rubensdörffer Page 123
F3
F1
Leading edge
Cavity Figure 9.26: Streamlines of the boundary layer air forming the flank vortices
L1
Figure 9.27: Streamlines of boundary layer air impinging on hub endwall
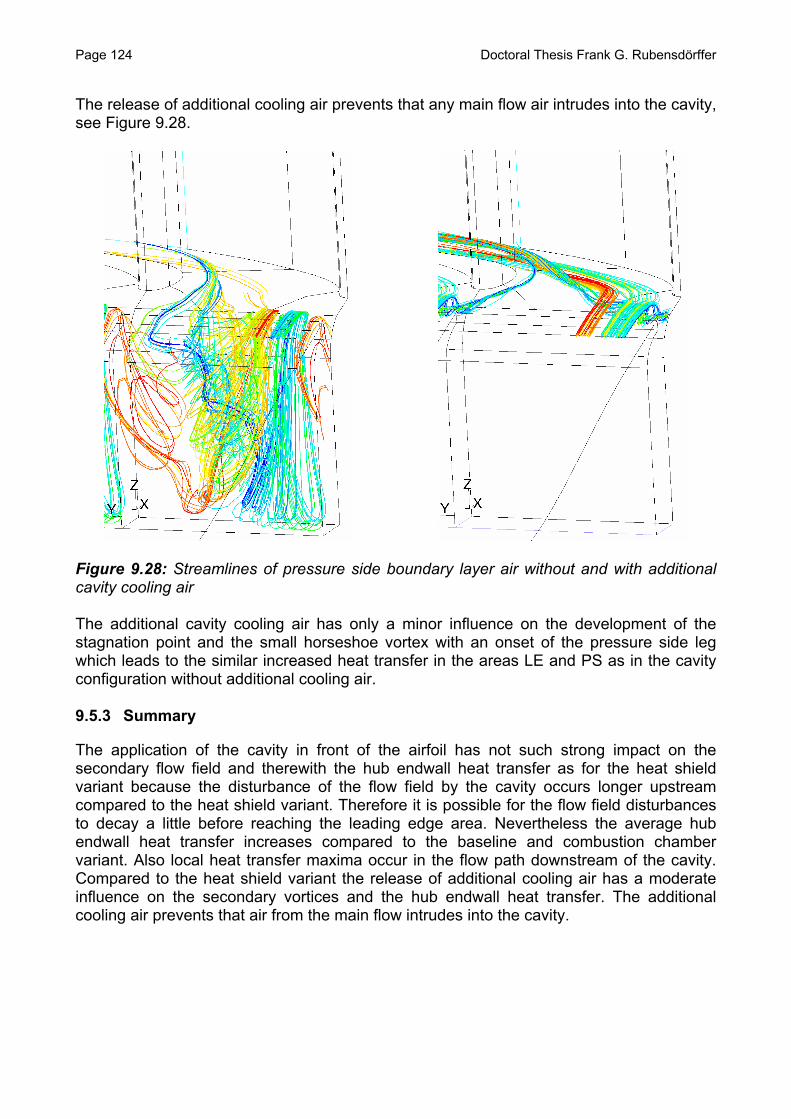
Page 124 Doctoral Thesis Frank G. Rubensdörffer
The release of additional cooling air prevents that any main flow air intrudes into the cavity, see Figure 9.28.
Figure 9.28: Streamlines of pressure side boundary layer air without and with additional cavity cooling air The additional cavity cooling air has only a minor influence on the development of the stagnation point and the small horseshoe vortex with an onset of the pressure side leg which leads to the similar increased heat transfer in the areas LE and PS as in the cavity configuration without additional cooling air. 9.5.3 Summary
The application of the cavity in front of the airfoil has not such strong impact on the secondary flow field and therewith the hub endwall heat transfer as for the heat shield variant because the disturbance of the flow field by the cavity occurs longer upstream compared to the heat shield variant. Therefore it is possible for the flow field disturbances to decay a little before reaching the leading edge area. Nevertheless the average hub endwall heat transfer increases compared to the baseline and combustion chamber variant. Also local heat transfer maxima occur in the flow path downstream of the cavity. Compared to the heat shield variant the release of additional cooling air has a moderate influence on the secondary vortices and the hub endwall heat transfer. The additional cooling air prevents that air from the main flow intrudes into the cavity.
Doctoral Thesis Frank G. Rubensdörffer Page 125
9.6 Summary of the effects of the geometric variants
The investigations of the selected geometric variants show that the secondary vortex system generated by aerodynamic forces in the advanced nozzle guide vane of a modern industrial gas turbine is relatively weak and can be altered easily by geometric design changes of the flow path like a heat shield and a cavity in front of the leading edge of the airfoil of the nozzle guide vane. That means that the application of obstructions in front of the leading edge of the airfoil changes the vane secondary flow field radically. New distinct vortex systems occur. Therewith the endwall heat transfer is also highly affected. The lowest average endwall heat transfer is obtained for the baseline and the combustion chamber variant with an undisturbed boundary layer approaching the airfoil of the nozzle guide vane. For the heat shield and for the cavity configuration a higher average endwall heat transfer occur. For those configurations, due to the new induced vortex systems, new higher local heat transfer maxima occur. The additional cooling air released under the heat shield or in the bottom of the cavity prevents mostly the intrusion of main flow under the heat shield or into the cavity. Also it is not possible for the additional cooling air to reach the pressure side part of the hub endwall.

Page 126 Doctoral Thesis Frank G. Rubensdörffer

Doctoral Thesis Frank G. Rubensdörffer Page 127
10 SUMMARY
10.1 Conclusions
The precise knowledge of the mechanisms and effects which define the nozzle guide vane flow field and the endwall heat transfer is the crucial factor for a well functioning design of a vane endwall cooling configuration. For the aerodynamic and heat transfer research the advanced design of a nozzle guide vane of a modern industrial gas turbine has been chosen. For the experimental research a new test rig has to be built to generate reliable detailed measurements, which do not exist in the open literature for this kind of vane configuration. The new linear cascade test facility with a baseline configuration of the advanced vane design consisting of four upscaled airfoils of a nozzle guide vane with a planar hub endwall has been designed, built and commissioned. The test facility was operated at low pressure and low temperature while retaining real gas turbine Mach and Reynolds numbers. Aerodynamic measurements have been performed with static pressure tap instrumentation on the two middle airfoils and on the hub and tip endwall. For the experimental investigations of the endwall heat transfer the hub endwall has been equipped with a thin film foil heater, providing constant heat flux. The hub endwall temperature was measured with an infrared camera through the tip endwall, which was equipped with sapphire glass windows. These measurements were used to evaluate Mach number distributions on the hub and tip endwall and on the airfoil and Nusselt number distributions on the hub endwall. For the numerical research the commercial software package Fluent was chosen. It is a finite-volume based solver, which uses a coupled-implicit solution method to solve the governing equations for mass, momentum, energy and turbulence quantities numerically. For the turbulence modeling the v2-f turbulence model, based on the k-ε turbulence model has been chosen. Previous own research work, the numerical analysis performed in another part of the project and conclusions from the literature study validated the v2-f turbulence model against different vane and blade geometries and for different flow conditions. The evaluation of the numerical and experimental research for the baseline configuration of the advanced nozzle guide vane of a modern industrial gas turbine leads to the following conclusions:
• The new linear cascade test facility is a reliable tool for the measurement of the flow field and the endwall heat transfer of an advanced nozzle guide vane of a modern industrial gas turbine.
• The new linear cascade test facility features a good reproducibility of the
measurements together with a satisfactory periodicity of the flow field through the test facility.
• The airfoil-to-airfoil Mach number distribution is characterized by the simultaneous
velocity growth, low acceleration in the front part of the airfoil, moderate acceleration on the pressure side of the airfoil with an extremely low overexpansion in the trailing edge region, a slight overexpansion behind the throat area on the
Page 128 Doctoral Thesis Frank G. Rubensdörffer
suction side of the airfoil without separation and a quite uniform velocity distribution in the flow channel in order to reduce the total losses of the advanced airfoil.
• On the hub endwall the characteristic secondary flow and heat transfer features of
an undisturbed boundary layer flow approaching an airfoil established in the open literature, like the attachment line, the separation saddle point, and the horseshoe vortex causing the endwall separation lines, which determine nozzle guide vane endwall heat transfer could be detected for the baseline configuration of the advanced nozzle guide vane of a modern industrial gas turbine with a very weak intensity and geometric extension compared to studies of less advanced vane geometries in the open literature.
The comparison of the numerical calculations with the experiments showed both very good qualitative and quantitative agreements of the calculated and measured flow field and hub endwall heat transfer for the vane baseline configuration. Together with the validation of the v2-f turbulence model at different vane and blade configurations and different flow conditions in the open literature the following conclusions can be drawn:
• The commercial CFD code Fluent in combination with the v2-f turbulence model is very suitable to calculate the flow field and the endwall heat transfer of the advanced nozzle guide vane of a modern industrial gas turbine.
• The chosen CFD tool with the v2-f turbulence exhibits a high level of general
applicability and is not tuned to a special airfoil or vane configuration. Therefore the CFD code Fluent with the v2-f turbulence was chosen for the numerical investigation of the flow field and the endwall heat transfer of a combustion chamber configuration, a heat shield configuration without and with additional cooling air and a cavity configuration without and with additional cooling air. These design variants have been selected to investigate the particular influence of the special design elements often applied in modern industrial gas turbines. The evaluation of the CFD calculations leads to following conclusions:
• The lowest average endwall heat transfer is obtained with an undisturbed boundary layer approaching the airfoil of the nozzle guide vane as is the case in the baseline and combustion chamber configuration.
• The application of design elements as heat shields and cavities in the flow path in
front of the airfoil of the nozzle guide vane changes the endwall secondary flow field fundamentally. New vortex systems occur. The resulting secondary flow field is absolute sweeping and decisive for the endwall heat transfer pattern. The average endwall heat transfer increases. Also local heat transfer maxima occur for the heat shield and cavity configuration, which do not appear for the undisturbed baseline and combustion chamber configuration.
• Additional cooling air has a moderate influence on the endwall heat transfer pattern.
The major difference without and with additional cooling air is that with additional cooling air it is prevented that air from the main flow field intrudes under the heat shield or intrudes into the cavity respectively.

Doctoral Thesis Frank G. Rubensdörffer Page 129
10.2 Design guidelines
The research work leads to the following new guidelines for the design layout of the nozzle guide vane endwall configuration from the aerodynamic and endwall cooling point of view:
• The design of the flow path in front of the airfoil of a nozzle guide vane should be as even and undisturbed as possible to minimize the average and local endwall heat transfer.
• If design elements as heat shields and cavities in front of the airfoil of a nozzle
guide vane are necessary from the structure point of view it should be aimed at that the distance between the design elements and the leading edge of the airfoil is as long as possible to give the flow field the possibility to settle and disturbances to fade out.
• Additional cavity or heat shield cooling air has the capability to stream through a
complete cavity, preventing the intrusion of hot air from the main flow field. The additional cooling air, released in the bottom of a cavity, under a heat shield or in the leading edge section through film cooling holes will always move towards the area lying one third of the pitch from the airfoil suction side. That means that the pressure side part of the endwall can never be reached with such kind of additional cooling air. To keep the material temperature in that area below the required lifetime-limiting maximum it is necessary to apply film cooling holes upstream on the secondary flow field endwall streaklines of this area. Another possibility is to cool the pressure side part of the endwall from the backside by convective cooling.
10.3 Future work
The trend in the turbine development veers towards the reduction in the number of nozzle guide vanes in order to save costs and reduce the amount of turbine cooling air, keeping or increasing the turbine efficiency at the same time. This leads to new, advanced profiles of the airfoil of the nozzle guide vane with an increased pitch between the airfoils. The investigation of the influence of the new vane configuration, also together with design elements like heat shields and cavities is absolutely essential for the assessment of the new nozzle guide vane concept from the aerodynamic and cooling point of view. In the present study simplified geometries for the examined configurations have been used to keep the meshing effort reasonable and to save computational time. Also low pressure and low temperature boundary conditions achieved in the test facility have been applied. In the future to assess real nozzle guide vane geometries it is planned to calculate a real annular nozzle guide vane configuration with combustion chamber edges, cavities, heat shields, film cooling holes and fillets under engine operation conditions with the validated CFD tool. Furthermore the design guidelines will be implemented in the design process of new nozzle guide vane concepts with the objective to minimize the consumption of turbine cooling air in a reliable, high efficient, next-generation industrial gas turbine.

Page 130 Doctoral Thesis Frank G. Rubensdörffer

Doctoral Thesis Frank G. Rubensdörffer Page 131
REFERENCES
Agema Thermovision 900 Series; 1994 “Users' Manual”, Agema Infrared Systems AB, Rinkebyvägen 19, Box 3, SE-18211 Danderyd, Sweden. Arts, T., Lambert de Rouvroit, M. and Rutherford, A.W.; 1990 "Aero-thermal investigation of a highly loaded transonic linear turbine guide vane cascade", Technical Note 174, Von Karman Institute for Fluid Dynamics, Rhode Saint Genese, Belgium. Baldwin, B. S. and Lomax, H.; 1978 "Thin Layer Approximation and Algebraic Model for Separated Turbulent Flow", AIAA Paper No. 78-252. Blair, M. F.; 1974 "An Experimental Study of Heat Transfer and Film Cooling on Large-Scale Turbine Endwalls", ASME Paper No. 74-GT-33, ASME Journal of Heat Transfer, Vol. 96, pp. 524-529. Blair, M. F.; 1992 "An Experimental Study of Heat Transfer in a Large-Scale Turbine Rotor Passage", ASME Paper No. 92-GT-195, Cologne, Germany. Bölcs, A.; 1969 "Flow Investigations in a Water Channel at Subsonic and Supersonic Velocities", Escher Wyss News, Vol. 42, No. 1. Boyle, M. T. and Hoose, K. V.; 1989 "End Wall Heat Transfer in a Vane Cascade and in a Curved Duct", ASME Paper No. 89-GT-90, Toronto, Ontario, Canada. Boyle, R. J. and Jackson, R.; 1995 "Heat Transfer Predictions for Two Turbine Nozzle Geometries at High Reynolds and Mach Numbers", ASME Paper No. 95-GT-104, ASME Journal of Turbomachinery, Vol. 119, pp. 270-283. Boyle, R. J. and Russell, L. M.; 1989 "Experimental Determination of Stator Endwall Heat Transfer", ASME Paper No. 89-GT-219, ASME Journal of Turbomachinery, Vol. 112, pp. 547-558. Burd, S. W. and Simon, T. W.; 2000 "Flow Measurements in a Nozzle Guide Vane Passage with Low Aspect Ratio and Endwall Contouring", ASME Paper No. 2000-GT-0213, Munich, Germany. Cebeci, T. and Smith, A. M. O.; 1974 "Analysis of Turbulent Boundary Layer", Applied Mathematics and Mechanics, Vol. 15, Academic Press, New York.
Page 132 Doctoral Thesis Frank G. Rubensdörffer
Chana, K. S.; 1992 "Heat Transfer and Aerodynamics of a High Rim Speed Turbine Nozzle Guide Vane with Profiled End Walls", ASME Paper No. 92-GT-243, Cologne, Germany. Coleman, H. W. and Steele, W. G.; 1999 "Experimentation and Uncertainty Analysis for Engineers", John Wiley and Sons, Inc, New York, ISBN: 0-471-12146-0. Crawford M. E.; 1986 "Simulation Codes for Calculation of Heat Transfer to Convectively Cooled Turbine Blades", Convective Heat Transfer and Film Cooling in Turbomachinery, T. Arts ed., Lecture Series 1986-06, Von Karman Institute for Fluid Dynamics, Rhode Saint Genese, Belgium. Dantec; 2003 Dantec Dynamics A/S, Tonsbacken 16 - 18, DK-2740 Skovlunde, Denmark. Dossena, V., Perdichizzi, A. and Savini, M.; 1998 "The Influence of Endwall Contouring on the Performance of a Turbine Nozzle Guide Vane", ASME Paper No. 98-GT-71, ASME Journal of Turbomachinery, Vol. 121, pp. 200-208. Duden, A., Raab, I. and Fottner, L.; 1998 "Controlling the Secondary Flow in a Turbine Cascade by Three-Dimensional Airfoil Design and Endwall Contouring", ASME Paper No. 98-GT-72, ASME Journal of Turbomachinery, Vol. 121, pp. 191-199. Durbin, P.A.; 1991 “Near-wall turbulence closure modeling without “damping functions”, Theoret. Comput. Fluid Dynamics. 3, pp. 1-13. Fluent; 2001 Fluent Inc., Centerra Resource Park, 10 Cavendish Court, Lebanon, NH 03766, USA Friedrichs, S., Hodson, H. P. and Dawes, W. N.; 1998 "The Design of an Improved Endwall Film-Cooling Configuration", ASME Paper No. 98-GT-483, Stockholm, Sweden. Fridh, J.; 2003 "Calibration of Pneumatic Probes for the Test Turbine", Internal Report No. KTH/HTP 03/16, Royal Institute of Technology, Stockholm, Sweden. Gaugler, R. E. and Russell, L. M.; 1980 "Streakline Flow Visualization Study of a Horseshoe Vortex in a Large-Scale, Two-Dimensional Turbine Stator Passage", ASME Paper No. 80-GT-4, New Orleans, Louisiana.

Doctoral Thesis Frank G. Rubensdörffer Page 133
Genrup, M.; 2005 "On Degradation and Monitoring Tools for Gas and Steam Turbines", PhD Thesis, Department of Heat and Power Engineering, Lund Institute of Technology, Lund, Sweden, ISRN LUTMDN/TMHP--05/1027--SE. Georgiou, D. P., Godard, M. and Richards, B. E.; 1979 "Experimental Study of the Iso-Heat-Transfer-Rate Lines on the End-Wall of a Turbine Cascade", ASME Paper No. 79-GT-20, San Diego, California. Giel, P. W., Thurman, D. R., Van Fossen, G. J., Hippensteele, S. A. and Boyle, R. J.; 1996 "Endwall Heat Transfer Measurements in a Transonic Turbine Cascade", ASME Paper No. 96-GT-180, ASME Journal of Turbomachinery, Vol. 120, pp. 305-313. Goldstein, R. J. and Spores, R. A.; 1988 "Turbulent Transport on the Endwall in the Region Between Adjacent Turbine Blades", ASME Journal of Heat Transfer, Vol. 110, pp. 862-869. Graziani, R. A., Blair, M. F., Taylor, J. R. and Mayle, R. M.; 1979 "An Experimental Study of Endwall and Airfoil Heat Transfer in a Large Scale Turbine Blade Cascade", ASME Paper No. 79-GT-99, ASME Journal of Engineering for Power, Vol. 102, pp. 257-267. Gregory-Smith, D. G. and Cleak, J. G. E.; 1990 "Secondary Flow Measurements in a Turbine Cascade with High Inlet Turbulence", ASME Paper No. 90-GT-20, ASME Journal of Turbomachinery, Vol. 114, pp. 173-183. Gregory-Smith, D. G., Ingram, G., Jayaraman, P., Harvey, N. W. and Rose, M. G.; 2001 "Non-Axisymmetric Turbine End Wall Profiling", ATI-CST-055/01, Proceedings, Fourth European Conference on Turbomachinery Fluid Dynamics and Thermodynamics, Florence, Italy. GTC; 2002 Swedish Gas Turbine Center, c/o Siemens Industrial Turbomachinery AB, SE-612 83 Finspong, Sweden, www.me.chalmers.se/gtc. Harrison, S.; 1989 "Secondary Loss Generation in a Linear Cascade of High-Turning Turbine Blades", ASME Paper No. 89-GT-47, Toronto, Ontario, Canada. Harasgama, S. P. and Wedlake, E. T.; 1990 "Heat Transfer and Aerodynamics of a High Rim Speed Turbine Tested in a RAE Isentropic Light Piston Cascade (ILPC)", ASME Paper No. 90-GT-41, Brussels, Belgium. Harvey, N. W. and Jones, T. V.; 1990 "Measurements and Calculation of End Wall Heat Transfer and Aerodynamics on a Nozzle Guide Vane in Annular Cascade", ASME Paper No. 90-GT-301, Brussels, Belgium.

Page 134 Doctoral Thesis Frank G. Rubensdörffer
Harvey, N. W., Rose, M.G. Coupland, J. and Jones, T. V.; 1998 "Measurements And Calculation of Nozzle Guide Vane End Wall Heat Transfer", ASME Paper No. 98-GT-66, ASME Journal of Turbomachinery, Vol. 121, pp. 184-190. Hawthorne, W.R.; 1955 "Rotational Flow Through Cascades", J. Mech. & Appl. Math., Vol. 3, pp. 266-292. Hermann, A. and Rubensdörffer, F.; 2001 "Numerical Investigation of Flow and Heat Transfer at Turbine Airfoils with Commercial Programs and Boundary Layer Codes", Siemens Internal Report, RT RGF 03/01. Hermanson, K., Kern, S., Picker, G. and Parnaix, S.; 2002 "Prediction of External Heat Transfer for Turbine Vanes and Blades with Secondary Flowfields", ASME Paper No. GT-2002-30206, Amsterdam, The Netherlands. Hermanson, K. S. and Thole, K.A.; 1999 "Effect of Inlet Conditions on Endwall Secondary Flows", AIAA Paper 99-0241, AIAA Aerospace Meeting, Reno, Nevada. Iaccarino, G.; 2001 "Predictions of a Turbulent Separated Flow Using Commercial CFD Codes", ASME Journal of Fluids Engineering, Vol. 123, pp. 819-828. Kalitzin, G.; 1999 "Application of the v2-f Model to Aerospace Configurations", Annual Research Briefs 1999, Center for Turbulence Research, Stanford University, Stanford, California. Kalitzin, G. and Iaccarino, G.; 1999 "Computation of Heat Transfer in a Linear Turbine Cascade", Annual Research Briefs 1999, Center for Turbulence Research, Stanford University, Stanford, California. Kang, M. B., Kohli, A. and Thole, K.A.; 1998 "Heat Transfer and Flowfield Measurements in the Leading Edge Region of a Stator Vane Endwall ", ASME Paper No. 98-GT-173, ASME Journal of Turbomachinery, Vol. 121, pp. 558-568. Kang, M. B. and Thole, K.A.; 1999 "Flowfield Measurements in the Endwall Region of a Stator Vane", ASME Paper No. 99-GT-188, ASME Journal of Turbomachinery, Vol. 122, pp. 255-262. Kawai, T., Shinoki, S. and Adachi, T.; 1990 "Visualization Study of Three-Dimensional Flows in a Turbine Cascade Endwall Region", JSME International Journal, Series II, Vol. 32, No. 2, pp 256-264. Khalatov, A.; 1998 "Improved Approach to an Endwall Heat Transfer Analysis: a Linear Guide Vane and a Curved Duct", ASME Paper No. 98-GT-293, Stockholm, Sweden.
Doctoral Thesis Frank G. Rubensdörffer Page 135
Kumar, G. N., Jenkins, R. M. and Sahu, U.; 1985 "Regionally Averaged Endwall Heat Transfer Correlations for a Linear Vane Cascade", ASME Paper No. 85-GT-19, Houston, Texas. Lakshminarayana, B.; 1996 "Fluid Dynamics and Heat Transfer of Turbomachinery", John Wiley and Sons, Inc, New York, ISBN: 0-471-85546-4. Langston, L. S., Nice, M. L. and Hooper, R. M.; 1976 "Three-Dimensional Flow Within a Turbine Cascade Passage", ASME Paper No. 76-GT-50, ASME Journal of Engineering for Power, Vol. 99, pp. 21-28. Langston, L. S.; 1980 "Crossflows in a Turbine Cascade Passage", ASME Paper No. 80-GT-05, ASME Journal of Engineering for Power, Vol. 102, pp. 866-874. Launder, B. E. and Spalding, D.B.; 1974 "The Numerical Computation of Turbulent Flows", Computational Methods in Applied Mechanics and Engineering, Vol. 3, pp. 269-289. Lien, F. S. and Kalitzin, G.; 2001 "Computations of Transonic Flow with the v2-f Turbulence Model", International Journal of Heat and Fluid Flow, Vol. 22, pp. 53-61. Minco; 2003 Minco Products, Inc., 7300 Commerce Lane, Minneapolis, Minnesota. Nicklas, M.; 2001 "Film-Cooled Turbine Endwall in a Transonic Flow Field: Part II: Heat Transfer and Film Cooling Effectiveness", ASME Paper No. 2001-GT-0146, New Orleans, Louisiana. Patankar, S. V. and Spalding, D. B.; 1970 "Heat and Mass Transfer in Boundary Layers", 2d ed., Intertext, London Perdichizzi, A.; 1989 "Mach Number Effects on Secondary Flow Development Downstream of a Turbine Cascade", ASME Paper No. 89-GT-67, Toronto, Ontario, Canada. Pope, S.B.; 2000 "Turbulent Flows", Cambridge University Press, Cambridge, ISBN: 0-521-59886-9. Prandtl, L.; 1925 "Bericht über Untersuchungen zur ausgebildeten Turbulenz", ZAMM, Vol. 5, pp. 136-139 Radomsky, R. W. and Thole, K.A.; 2000a "Flowfield Measurements for a Highly Turbulent Flow in a Stator Vane Passage", ASME Journal of Turbomachinery, Vol. 122, pp. 255-262.
Page 136 Doctoral Thesis Frank G. Rubensdörffer
Radomsky, R. W. and Thole, K.A.; 2000b "High Freestream Turbulence Effects on Endwall Heat Transfer for a Gas Turbine Stator Vane ", ASME Paper No. 2000-GT-0201, Munich, Germany. Roy, R. P., Squires, K. D., Gerenades, M., Song, S., Howe, W. J. and Ansari, A.; 2000 "Flow and Heat Transfer at the Hub Endwall of Inlet Vane Passages – Experiments and Simulations", ASME Paper No. 2000-GT-198, Munich, Germany. Sauer, H., Müller, R. and Vogeler, K.; 2000 "Reduction of Secondary Flow Losses in Turbine Cascades by Leading Edge Modifications at the Endwall ", ASME Paper No. 2000-GT-0473, Munich, Germany. Schlichting, H. and Gersten, K.; 1997 "Grenzschichttheorie", 9. Auflage, Springer Verlag, Berlin, Heidelberg, New York, ISBN: 3-540-55744-X. Sharma, O. P. and Butler, T. L.; 1986 "Prediction of Endwall Losses and Secondary Flows in Axial Flow Turbine Cascades", ASME Paper No. 86-GT-228, Dusseldorf, West Germany. Shih, T. I-P., Lin, Y. L. and Simon, T. W.; 2000 "Control of Secondary Flow in a Turbine Nozzle Guide Vane by Endwall Contouring", ASME Paper No. 2000-GT-0556, Munich, Germany. Sieverding, C. H.; 1984 "Recent Progress in the Understanding of Basic Aspects of Secondary Flows in Turbine Blade Passages", ASME Paper No. 84-GT-78, ASME Journal of Engineering for Gas Turbines and Power, Vol. 107, pp. 248-257. Sieverding, C. H.; 2004 "Understanding Secondary Flows in Turbine Bladings", Review of State-of-the-Art & Impact on Blade Design, Gas Turbine Engineering Lecture Series, Siemens, Orlando, Florida. Sonoda, T.; 1985 "Experimental Investigation on Spatial Development of Streamwise Vortices in a Turbine Inlet Guide Vane Cascade", ASME Paper No. 85-GT-20, Houston, Texas. Spalart, P. and Almaras, S.; 1992 "A One-Equation Turbulence Model for Aerodynamic Flows", AIAA Paper No. 92-0439. Sveningsson, A.; 2003 "Analysis of the Performance of Different v2-f Turbulence Models in a Stator Vane Passage Flow", Licentiate Thesis, Department of Thermo and Fluid Dynamics, Chalmers University of Technology, Gothenburg, Sweden, ISRN CTH-TFD-PB-03/02. Takeishi, K., Matsuura, M., Aoki, S. and Sato, T.; 1989 "An Experimental Study of Heat Transfer and Film Cooling on Low Aspect Ratio Turbine Nozzles", ASME Paper No. 89-GT-187, ASME Journal of Turbomachinery, Vol. 112, pp. 488-496.

Doctoral Thesis Frank G. Rubensdörffer Page 137
Tennekes, H. and Lumley, J.L.; 1972 "A First Course in Turbulence", The MIT Press, The Massachusetts Institute of Technology, ISBN: 0-262-20019-8. Tominaga, J., Outa, E. and Yamamoto, A.; 1995 "Effects of the Inlet Endwall Boundary Layer on 3-D Flows and Loss Evolution in a Linear Turbine Cascade", ASME Paper No. 95-GT-188, Houston, Texas. Viktor Kyburz AG; 2002 Industriestrasse 15, CH-2553 Safnern, Switzerland. Versteeg, H. K. and Malalasekera, W.; 1995 "An Introduction to Computational Fluid Dynamics The Finite Volume Method", Addison Wesley Longman Limited, Harlow, England, ISBN: 0-582-21884-5. Wang, H. P., Olson, S. J., Goldstein, R. J. and Eckert, E. R. G.; 1995 "Flow Visualisation in a Linear Turbine Cascade of High Performance Turbine Blades", ASME Paper No. 95-GT-7, Houston, Texas. Wang, S., Wang, Z. and Feng, G.; 2001 "Numerical Simulation of 3D Flow field Structure in a Turbine Cascade with Bowed Blades", ASME Paper No. 2001-GT-0442, New Orleans, Louisiana. Wang Zhongqi and Han Wanjin, 1995 "The Influence of Blade Negative Curving on the Endwall and Blade Surface Flow", ASME Paper No. 95-GT-441, Houston, Texas. Wedlake, E. T., Brooks, A.J. and Harasgama, S. P.; 1988 "Aerodynamic and Heat Transfer Measurement on a Transonic Nozzle Guide Vane", ASME Paper No. 88-GT-10, ASME Journal of Turbomachinery, Vol. 111, pp. 36-42. Wiers, S.-H.; 2002 "Experimental Investigation of a Gas Turbine Airfoil Aerodynamic Performance Without and With Film Cooling in an Annular Sector Cascade", PhD Thesis, Department of Energy Technology, Royal Institute of Technology, Stockholm, Sweden, ISRN KTH-KRV-R-01-03-SE, ISBN: 91-7283-184-7. Wilcox, D. C.; 1993 "Turbulence Modeling for CFD", DCW Industries, California, ISBN: 0-963-6051-0-0. Yamamoto, A., Kaba, K. and Matsunuma, T.; 1995 "Measurements and Visualization of Three-Dimensional Flows in a Linear Turbine Cascade", ASME Paper No. 95-GT-341, Houston, Texas. York, R. E., Hylton, L. D. and Mihelc, M. S.; 1983 "An Experimental Investigation of Endwall Heat Transfer and Aerodynamics in a Vane Cascade", ASME Paper No. 83-GT-52, ASME Journal of Engineering for Gas Turbines and Power, Vol. 106, pp. 159-167.

Page 138 Doctoral Thesis Frank G. Rubensdörffer
Zess, G. A. and Thole, K.A., 2001 "Computational Design and Experimental Evaluation of Using a Leading Edge Fillet on a Gas Turbine Vane", ASME Paper No. 2001-GT-0404, New Orleans, Louisiana.