Numerical Analysis of Leakage through Geomembrane Lining ... · dams with an upstream face lined...
7
The First Pan American Geosynthetics Conference & Exhibition 2-5 March 2008, Cancun, Mexico Numerical Analysis of Leakage through Geomembrane Lining Systems for Dams C.T. Weber, University of Texas at Austin, Austin, TX, USA J.G. Zornberg, University of Texas at Austin, Austin, TX, USA ABSTRACT A numerical simulation was performed to characterize the effects of leakage through defects on the performance of dams with an upstream face lined with a geomembrane. The objective of this study was to determine how leakage through a lining system would affect the design of blanket toe drains in an earth dam. Toe drains decrease the pore pressure at the downstream face and keep the seepage line (or phreatic surface) below the downstream boundary. Simulations were conducted to determine the location of the phreatic surface in a homogeneous dam due to the presence of defects in the liner. Numerical simulations were also conducted to determine the length of the toe drain needed to prevent discharge from occurring on the downstream face of the dam. In addition, the effect of the elevation of the phreatic surface within the dam on the stability of the downstream face of the dam was analyzed. This study provides evidence on the benefits of using a geomembrane liner regarding the stability and toe drain in earth dams. 1. INTRODUCTION Geomembranes have been used as a solution to dam seepage problems since 1959, beginning in Europe (Sembenelli and Rodriguez 1996) and Canada (Lacroix 1984). These thin sheets of polymer have been used to make the upstream face watertight in roller-compacted concrete dams, to retrofit masonry and concrete dams, and as the main impervious layer in fill dams. By reducing the amount of water passing through a dam, the service life of a dam can be lengthened since the degradation process is slowed down. The most pertinent issue regarding the use of geomembranes in dams is the material’s vulnerability to damage during installation and throughout the service life. The damage impacts the effectiveness of a geomembrane as an infiltration barrier, especially under high hydraulic heads, resulting in leakage through the geomembrane liner and into the body of the dam. Nosko and Touze-Foltz (2000) used an electrical damage detection system to evaluate the size, location and cause of damage during installation of geomembrane liners for over 300 landfill sites (more than 3,250,000 m 2 ). The damage occurring on the side slopes of the landfills can be considered analogous to the upstream face of an earth dam. The most common form of damage to the side slope was punctures caused by the underlying stone layer but imperfect welds and equipment damage also caused a good portion of the damage to the geomembrane. The majority of the defects ranged in size from 0.5 to 10 cm 2 (equivalent to defect diameters of 0.008 to 0.036 m). Overall, there were 4,194 defects detected, which translates to approximately one defect per 800 m 2 . Of course, this approximation of defect frequency is before construction quality assurance measures are undertaken, which minimizes the presence of defects but may not eliminate them completely. Defects can also occur after construction is complete. Using the frequency of one defect per 800 m 2 to determine the expected leakage rate through a geomembrane liner would yield highly conservative results. Giroud and Bonaparte (1989) recommended using one defect per 4000 m 2 in the design of landfill liners. The phreatic surface, also referred to as the line of seepage, is the line of zero pore pressure in an earth dam. Basically, it indicates the change in the water table due the head loss across the soil in an earth dam. The placement of a drainage blanket at the downstream toe is a method that is used to control, or eliminate, the exit point of the phreatic surface on the downstream face. The exit point, where the phreatic surface intersects the downstream face, would be the location below which seepage, or discharge, would occur on the downstream face. A geomembrane liner placed on the upstream face of an earth dam would likely affect the shape and location of the phreatic surface, but to what extent would depend on the defect size, frequency and location. It is important to determine what conditions, with regard to the geomembrane liner, would lead to discharge on the downstream face of the dam. To assess the geomembrane defect characteristics and conditions that may lead to discharge on the downstream face, two-dimensional and three-dimensional finite element analyses were conducted for a simple homogeneous embankment dam with and without a toe drain. The length of the drain was varied to determine the critical length needed to keep the line of seepage within the dam body. A schematic of the dam that was used for this analysis is shown in Figure 1. 1728 Weber, C.T., and Zornberg, J.G. (2008). “Numerical Analysis of Leakage through Geomembrane Lining Systems for Dams.” Proceedings of GeoAmericas 2008, the First PanAmerican Geosynthetics Conference and Exhibition, Cancún, Mexico, 2-5 March, pp. 1728-1734.
Transcript of Numerical Analysis of Leakage through Geomembrane Lining ... · dams with an upstream face lined...
The First Pan American Geosynthetics Conference & Exhibition2-5 March 2008, Cancun, Mexico
Numerical Analysis of Leakage through Geomembrane Lining Systems for Dams C.T. Weber, University of Texas at Austin, Austin, TX, USA J.G. Zornberg, University of Texas at Austin, Austin, TX, USA ABSTRACT A numerical simulation was performed to characterize the effects of leakage through defects on the performance of dams with an upstream face lined with a geomembrane. The objective of this study was to determine how leakage through a lining system would affect the design of blanket toe drains in an earth dam. Toe drains decrease the pore pressure at the downstream face and keep the seepage line (or phreatic surface) below the downstream boundary. Simulations were conducted to determine the location of the phreatic surface in a homogeneous dam due to the presence of defects in the liner. Numerical simulations were also conducted to determine the length of the toe drain needed to prevent discharge from occurring on the downstream face of the dam. In addition, the effect of the elevation of the phreatic surface within the dam on the stability of the downstream face of the dam was analyzed. This study provides evidence on the benefits of using a geomembrane liner regarding the stability and toe drain in earth dams. 1. INTRODUCTION Geomembranes have been used as a solution to dam seepage problems since 1959, beginning in Europe (Sembenelli and Rodriguez 1996) and Canada (Lacroix 1984). These thin sheets of polymer have been used to make the upstream face watertight in roller-compacted concrete dams, to retrofit masonry and concrete dams, and as the main impervious layer in fill dams. By reducing the amount of water passing through a dam, the service life of a dam can be lengthened since the degradation process is slowed down. The most pertinent issue regarding the use of geomembranes in dams is the material’s vulnerability to damage during installation and throughout the service life. The damage impacts the effectiveness of a geomembrane as an infiltration barrier, especially under high hydraulic heads, resulting in leakage through the geomembrane liner and into the body of the dam. Nosko and Touze-Foltz (2000) used an electrical damage detection system to evaluate the size, location and cause of damage during installation of geomembrane liners for over 300 landfill sites (more than 3,250,000 m2). The damage occurring on the side slopes of the landfills can be considered analogous to the upstream face of an earth dam. The most common form of damage to the side slope was punctures caused by the underlying stone layer but imperfect welds and equipment damage also caused a good portion of the damage to the geomembrane. The majority of the defects ranged in size from 0.5 to 10 cm2 (equivalent to defect diameters of 0.008 to 0.036 m). Overall, there were 4,194 defects detected, which translates to approximately one defect per 800 m2. Of course, this approximation of defect frequency is before construction quality assurance measures are undertaken, which minimizes the presence of defects but may not eliminate them completely. Defects can also occur after construction is complete. Using the frequency of one defect per 800 m2 to determine the expected leakage rate through a geomembrane liner would yield highly conservative results. Giroud and Bonaparte (1989) recommended using one defect per 4000 m2 in the design of landfill liners. The phreatic surface, also referred to as the line of seepage, is the line of zero pore pressure in an earth dam. Basically, it indicates the change in the water table due the head loss across the soil in an earth dam. The placement of a drainage blanket at the downstream toe is a method that is used to control, or eliminate, the exit point of the phreatic surface on the downstream face. The exit point, where the phreatic surface intersects the downstream face, would be the location below which seepage, or discharge, would occur on the downstream face. A geomembrane liner placed on the upstream face of an earth dam would likely affect the shape and location of the phreatic surface, but to what extent would depend on the defect size, frequency and location. It is important to determine what conditions, with regard to the geomembrane liner, would lead to discharge on the downstream face of the dam. To assess the geomembrane defect characteristics and conditions that may lead to discharge on the downstream face, two-dimensional and three-dimensional finite element analyses were conducted for a simple homogeneous embankment dam with and without a toe drain. The length of the drain was varied to determine the critical length needed to keep the line of seepage within the dam body. A schematic of the dam that was used for this analysis is shown in Figure 1.
1728
Weber, C.T., and Zornberg, J.G. (2008). “Numerical Analysis of Leakage through Geomembrane Lining Systems for Dams.” Proceedings of GeoAmericas 2008, the First PanAmerican Geosynthetics Conference and Exhibition, Cancún, Mexico, 2-5 March, pp. 1728-1734.
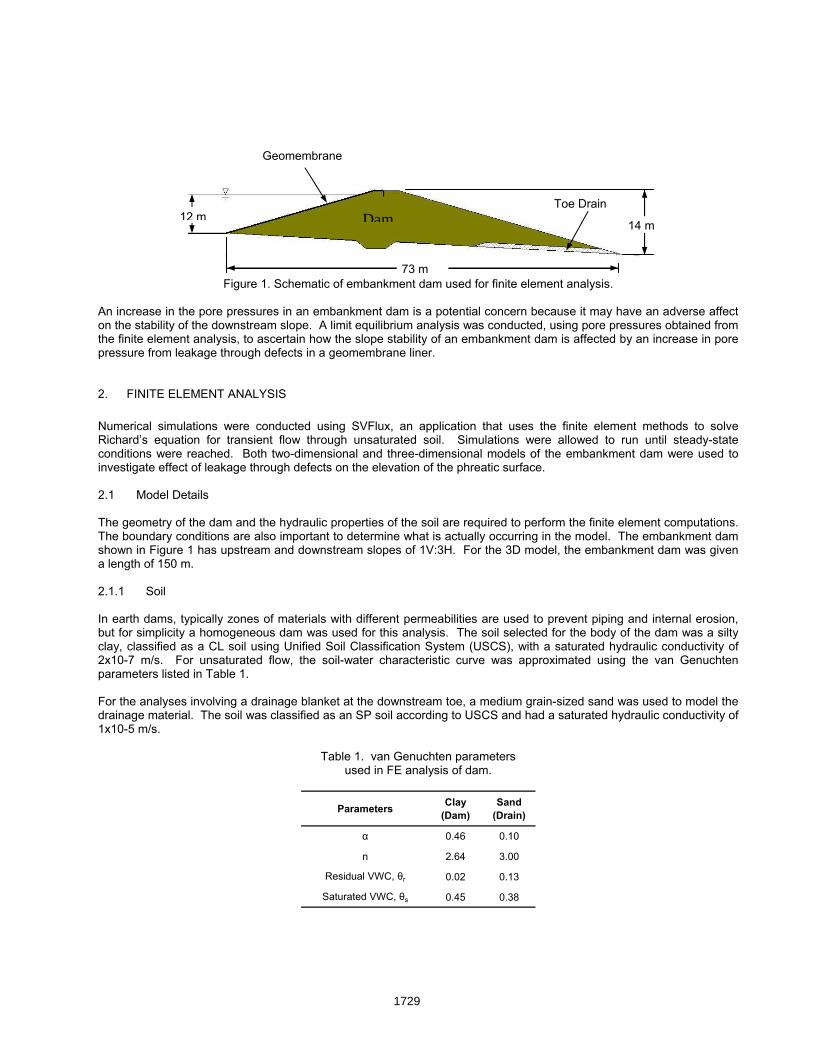
Figure 1. Schematic of embankment dam used for finite element analysis.
DamToe Drain
73 m
14 m12 m
Geomembrane
An increase in the pore pressures in an embankment dam is a potential concern because it may have an adverse affect on the stability of the downstream slope. A limit equilibrium analysis was conducted, using pore pressures obtained from the finite element analysis, to ascertain how the slope stability of an embankment dam is affected by an increase in pore pressure from leakage through defects in a geomembrane liner.
2. FINITE ELEMENT ANALYSIS Numerical simulations were conducted using SVFlux, an application that uses the finite element methods to solve Richard’s equation for transient flow through unsaturated soil. Simulations were allowed to run until steady-state conditions were reached. Both two-dimensional and three-dimensional models of the embankment dam were used to investigate effect of leakage through defects on the elevation of the phreatic surface. 2.1 Model Details The geometry of the dam and the hydraulic properties of the soil are required to perform the finite element computations. The boundary conditions are also important to determine what is actually occurring in the model. The embankment dam shown in Figure 1 has upstream and downstream slopes of 1V:3H. For the 3D model, the embankment dam was given a length of 150 m. 2.1.1 Soil In earth dams, typically zones of materials with different permeabilities are used to prevent piping and internal erosion, but for simplicity a homogeneous dam was used for this analysis. The soil selected for the body of the dam was a silty clay, classified as a CL soil using Unified Soil Classification System (USCS), with a saturated hydraulic conductivity of 2x10⁻⁷ m/s. For unsaturated flow, the soil-water characteristic curve was approximated using the van Genuchten parameters listed in Table 1. For the analyses involving a drainage blanket at the downstream toe, a medium grain-sized sand was used to model the drainage material. The soil was classified as an SP soil according to USCS and had a saturated hydraulic conductivity of 1x10⁻⁵ m/s.
Table 1. van Genuchten parameters used in FE analysis of dam.
Parameters Clay (Dam)
Sand (Drain)
α 0.46 0.10
n 2.64 3.00
Residual VWC, θr 0.02 0.13
Saturated VWC, θs 0.45 0.38
1729
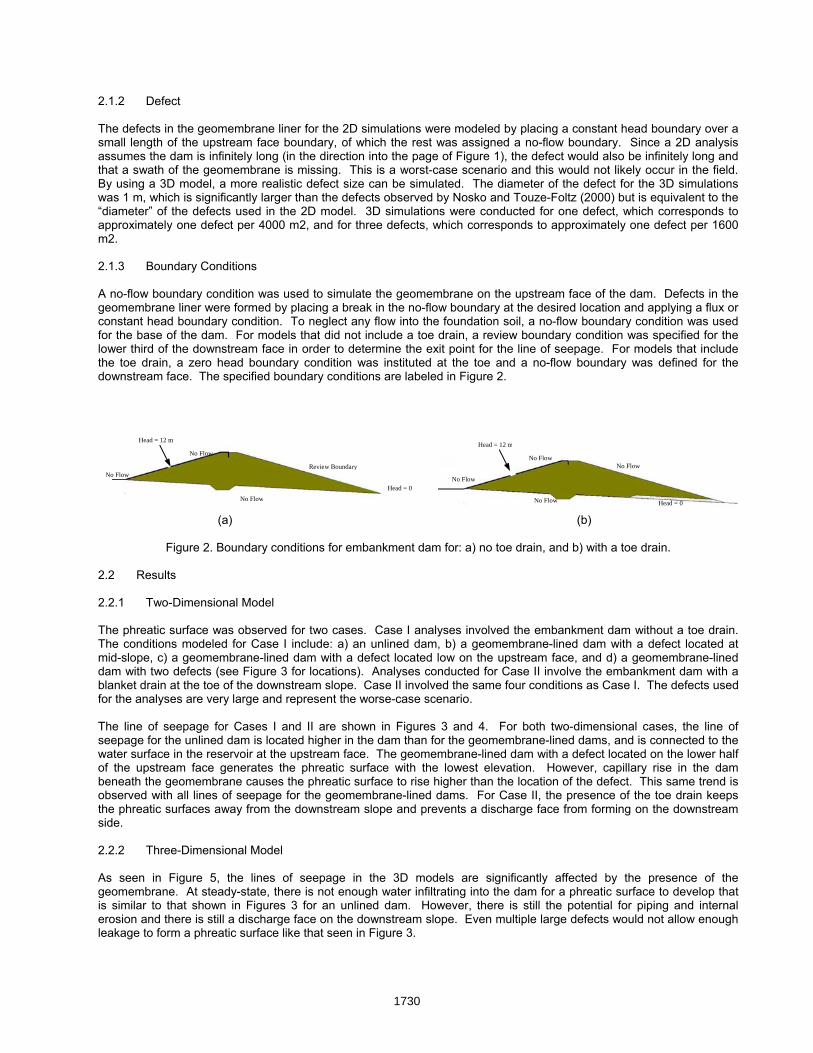
2.1.2 Defect The defects in the geomembrane liner for the 2D simulations were modeled by placing a constant head boundary over a small length of the upstream face boundary, of which the rest was assigned a no-flow boundary. Since a 2D analysis assumes the dam is infinitely long (in the direction into the page of Figure 1), the defect would also be infinitely long and that a swath of the geomembrane is missing. This is a worst-case scenario and this would not likely occur in the field. By using a 3D model, a more realistic defect size can be simulated. The diameter of the defect for the 3D simulations was 1 m, which is significantly larger than the defects observed by Nosko and Touze-Foltz (2000) but is equivalent to the “diameter” of the defects used in the 2D model. 3D simulations were conducted for one defect, which corresponds to approximately one defect per 4000 m2, and for three defects, which corresponds to approximately one defect per 1600 m2. 2.1.3 Boundary Conditions A no-flow boundary condition was used to simulate the geomembrane on the upstream face of the dam. Defects in the geomembrane liner were formed by placing a break in the no-flow boundary at the desired location and applying a flux or constant head boundary condition. To neglect any flow into the foundation soil, a no-flow boundary condition was used for the base of the dam. For models that did not include a toe drain, a review boundary condition was specified for the lower third of the downstream face in order to determine the exit point for the line of seepage. For models that include the toe drain, a zero head boundary condition was instituted at the toe and a no-flow boundary was defined for the downstream face. The specified boundary conditions are labeled in Figure 2.
(a) (b)
Figure 2. Boundar b) with a toe drain. 2.2 Results
he phreatic a toe drain. he conditio t located at
ane-lined dam with a defect located low on the upstream face, and d) a geomembrane-lined ts (see Figure 3 for locations). Analyses conducted for Case II involve the embankment dam with a
eam slope. Case II involved the same four conditions as Case I. The defects used ent the worse-case scenario.
or Case II, the presence of the toe drain keeps
n and there is still a discharge face on the downstream slope. Even multiple large defects would not allow enough akage to form a phreatic surface like that seen in Figure 3.
y conditions for embankment dam for: a) no toe drain, and
Head = 0
Head = 12 m
2.2.1 Two-Dimensional Model T surface was observed for two cases. Case I analyses involved the embankment dam without
ns modeled for Case I include: a) an unlined dam, b) a geomembrane-lined dam with a defecTmid-slope, c) a geomembram with two defecd
blanket drain at the toe of the downstror the analyses are very large and represf The line of seepage for Cases I and II are shown in Figures 3 and 4. For both two-dimensional cases, the line of seepage for the unlined dam is located higher in the dam than for the geomembrane-lined dams, and is connected to the water surface in the reservoir at the upstream face. The geomembrane-lined dam with a defect located on the lower half of the upstream face generates the phreatic surface with the lowest elevation. However, capillary rise in the dam beneath the geomembrane causes the phreatic surface to rise higher than the location of the defect. This same trend is
bserved with all lines of seepage for the geomembrane-lined dams. Fothe phreatic surfaces away from the downstream slope and prevents a discharge face from forming on the downstream side. 2.2.2 Three-Dimensional Model As seen in Figure 5, the lines of seepage in the 3D models are significantly affected by the presence of the geomembrane. At steady-state, there is not enough water infiltrating into the dam for a phreatic surface to develop that is similar to that shown in Figures 3 for an unlined dam. However, there is still the potential for piping and internal rosioe
le
Head = 0
Head = 12 mNo Flow
Review Boundar
No Flow
No Flow
No FlowNo Flow y
No Flow
No Flow
1730
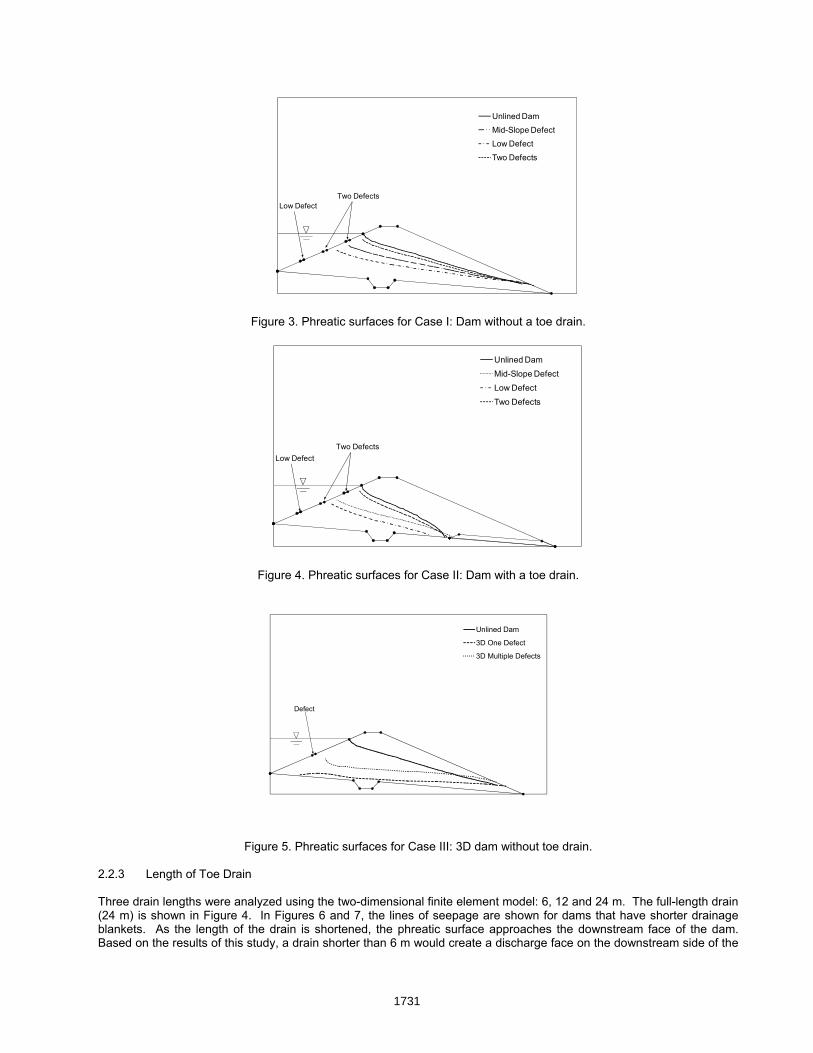
Unlined DamMid-Slope DefectLow Defect
Two Defects
Two DefectsLow Defect
Figure 3. Phreatic surfaces for Case I: Dam without a toe drain.
Unlined DamMid-Slope DefectLow Defect
Two Defects
Two DefectsLow Defect
Figure 4. Phreatic surfaces for Case II: Dam with a toe drain.
Unlined Dam
3D One Defect
3D Multiple Defects
Defect
Figure 5. Phreatic surfaces for Case III: 3D dam without toe drain.
2.2.3 Length of Toe Drain Three drain lengths were analyzed using the two-dimensional finite element model: 6, 12 and 24 m. The full-length drain (24 m) is shown in Figure 4. In Figures 6 and 7, the lines of seepage are shown for dams that have shorter drainage blankets. As the length of the drain is shortened, the phreatic surface approaches the downstream face of the dam. Based on the results of this study, a drain shorter than 6 m would create a discharge face on the downstream side of the
1731
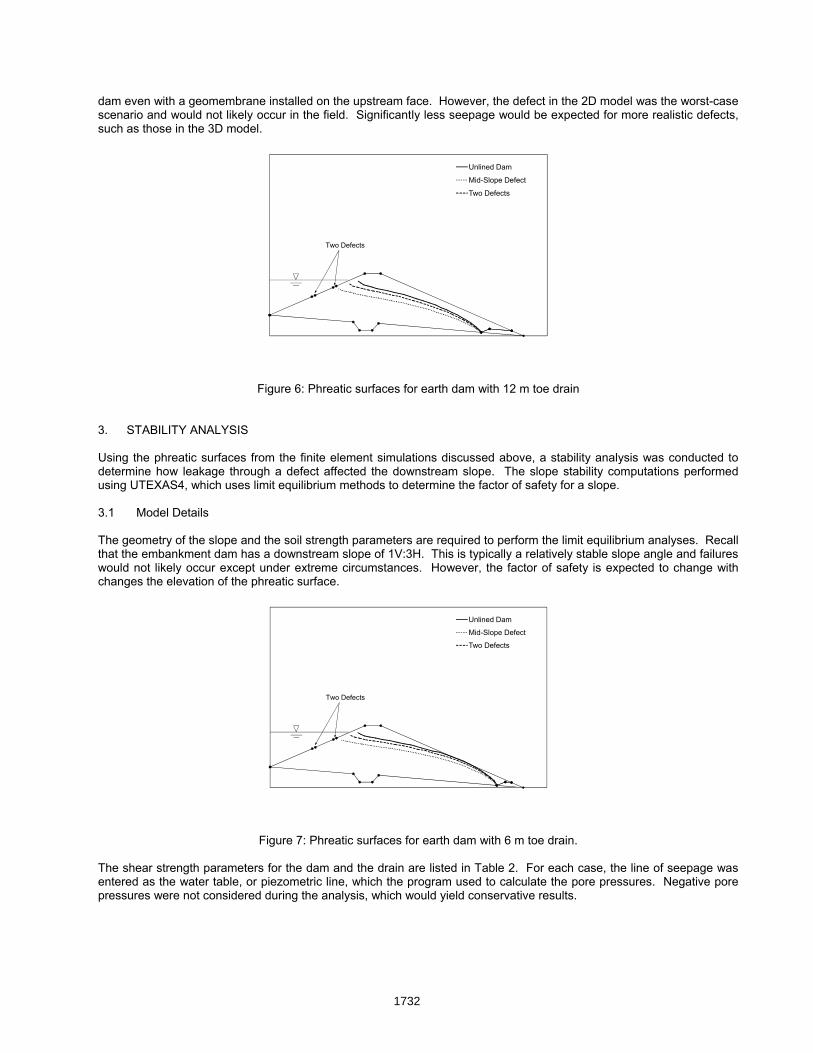
dam even with a geomembr model was the worst-case cenario and would not likely occur in the field. Significantly less seepage would be expected for more realistic defects,
.
ane installed on the upstream face. However, the defect in the 2D ssuch as those in the 3D model
Unlined Dam
Mid-Slope Defect
Two Defects
Two Defects
Figure 6: Phreatic surfaces for earth dam with 12 m toe drain
3. STABILITY ANALYSIS Using the phreatic surfaces from the finite element simulations discussed above, a stability analysis was conducted to determine how leakage through a defect affected the downstream slope. The slope stability computations performed using UTEXAS4, which uses limit equilibrium methods to determine the factor of safety for a slope. .1 Model Details
e soil strength parameters are required to perform the limit equilibrium analyses. Recall at the embankment dam has a downstream slope of 1V:3H. This is typically a relatively stable slope angle and failures
3 The geometry of the slope and ththwould not likely occur except under extreme circumstances. However, the factor of safety is expected to change with changes the elevation of the phreatic surface.
Unlined Dam
Mid-Slope Defect
Two Defects
Two Defects
Figure 7: Phreatic surfaces for earth dam with 6 m toe drain.
The shear strength parameters for the dam and the drain are listed in Table 2. For each case, the line of seepage was entered as the water table, or piezometric line, which the program used to calculate the pore pressures. Negative pore pressures were not considered during the analysis, which would yield conservative results.
1732
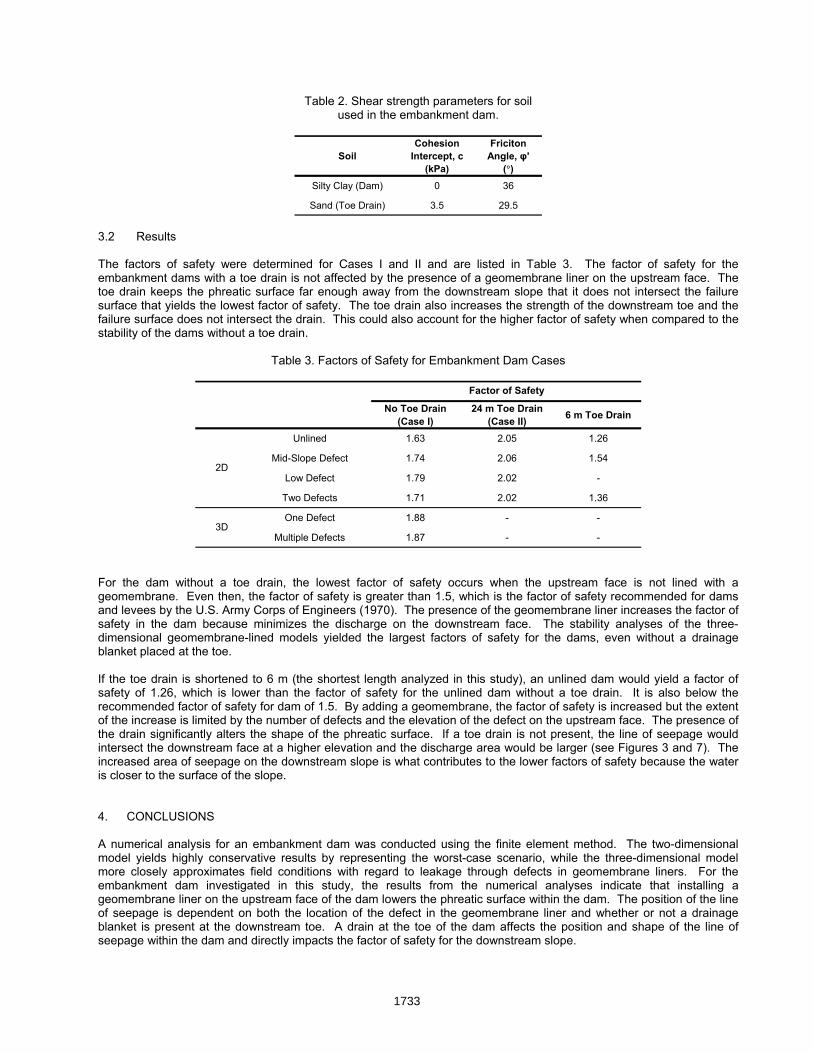
Table 2. Shear strength parameters for soil used in the embankment dam.
Cohesion Friciton
Soil Intercept, c (kPa)
Angle, φ' (°)
Silty Clay (Dam) 0 36
Sand (Toe Drain) 3.5 29.5 3.2 Results The factors of safety were determined for Cases I and II and are listed in Table 3. The factor of safety for the embankment dams with a toe drain is not affected by the presence of a geomembrane liner on the upstream face. The toe drain keeps the phreatic surface far enough away from the downstream slope that it does not intersect the failure surface that yields the lowest factor of safety. The toe drain also increases the strength of the downstream toe and the failure surface does not intersect the drain. This could also account for the higher factor of safety when compared to the tability of the dams without a toe drain.
Table 3. Factors of Safety for Embankment Dam Cases
s
No Toe Drain (Case I)
24 m Toe Drain (Case II) 6 m Toe Drain
Unlined 1.63 2.05 1.26
Factor of Safety
Mid-Slope Defect 1.74 2.06 1.54
-
Two Defects 1.71 2.02 1.36
One Defect 1.88 - -
Multiple Defects 1.87 - -3D
2DLow Defect 1.79 2.02
For the dam without a toe drain, the lowest factor of safety occurs when the upstream face is not lined with a geomembrane. Even then, the factor of safety is greater than 1.5, which is the factor of safety recommended for dams and levees by the U.S. Army Corps of Engineers (1970). The presence of the geomembrane liner increases the factor of safety in the dam because minimizes the discharge on the downstream face. The stability analyses of the three-dimensional geomembrane-lined models yielded the largest factors of safety for the dams, even without a drainage blanket placed at the toe.
the toe drain is shortened to 6 m (the shortest length analyzed in this study), an unlined dam would yield a factor of
n the downstream slope is what contributes to the lower factors of safety because the water closer to the surface of the slope.
this study, the results from the numerical analyses indicate that installing a eomembrane liner on the upstream face of the dam lowers the phreatic surface within the dam. The position of the line f seepage is dependent on both the location of the defect in the geomembrane liner and whether or not a drainage
ownstream toe. A drain at the toe of the dam affects the position and shape of the line of eepage within the dam and directly impacts the factor of safety for the downstream slope.
Ifsafety of 1.26, which is lower than the factor of safety for the unlined dam without a toe drain. It is also below the recommended factor of safety for dam of 1.5. By adding a geomembrane, the factor of safety is increased but the extent of the increase is limited by the number of defects and the elevation of the defect on the upstream face. The presence of the drain significantly alters the shape of the phreatic surface. If a toe drain is not present, the line of seepage would intersect the downstream face at a higher elevation and the discharge area would be larger (see Figures 3 and 7). The increased area of seepage ois 4. CONCLUSIONS A numerical analysis for an embankment dam was conducted using the finite element method. The two-dimensional model yields highly conservative results by representing the worst-case scenario, while the three-dimensional model more closely approximates field conditions with regard to leakage through defects in geomembrane liners. For the embankment dam investigated in goblanket is present at the ds
1733

eomembrane liners significantly reduce the amount of water infiltrating into the dam and largely affect the elevation of
CKNOWLEDGEMENTS
EFERENCES
iroud, J.P. and Bonaparte, R. (1989). “Leakage through liners constructed with geomembranes – Parts I and II.”
osko, V. and Touze-Foltz, N. (2000). Geomembrane liner failure: Modeling of its influence on contaminant transfer. Proc. 2nd European Conf. on Geosynthetics, Bologna, Italy, 2: 557-560.
nd Rodriguez, E.A. (1996). Geomembranes for earth and rock dams: State of the art report. Proc. Geosynthetics: Applications, Design and Construction: 1st European Geosynthetics Conf., Balkema, Maastricht, The
U.S Earth and Rock-Fill Dams. Engineer Manual
For this study, placing a geomembrane liner on the upstream face of the dam generally increases the factor of safety on the downstream face although the increase may not be substantial. According to the stability analysis, the downstream slope is sufficiently stable even if the dam is unlined and does not have a toe drain. By installing a toe drain, the factor of safety for the downstream slope is increased. However, if the drain is too short, it can adversely affect the factor of safety. The factor of safety can be increased if a geomembrane is placed on the upstream face of the dam but the increase is not significant. Based on this study, the length of the drain is an important design consideration. Gthe phreatic surface, even if multiple defects are present. The leakage through defects in geomembrane liners may not be enough to cause stability issues in the downstream slope but seepage near the downstream toe will still occur. Measures should be taken to protect the lower portion of the downstream slope. Leakage through defects could still cause piping and internal erosion so the design of the dam with a geomembrane liner should take this into consideration. A This research is being conducted as part of an initiative by the Geosynthetic Institute’s Center for Polymers in Hydraulic Structures (CPHyS). Also, we would like to thank Dr. Stephen G. Wright at the University of Texas at Austin for allowing us to use UTEXAS4 for this study. R G
Geotextiles and Geomembranes, 8(1) and 8(2), pp. 27-67 and 71-111. Lacroix, Yves (1984). “The geomembrane liner at Terzaghi Dam.” Proc. Int. Conf. on Geomembranes, Denver, CO, pp.
9-14. N
Sembenelli, P. a
Netherlands: 877-888. . Army Corps of Engineers (1970). Engineering and Design: Stability ofEM 1110-2-1902, Dept. of the Army, Corps of Engineers, Office of the Chief of Engineers, Washington, D.C.
1734