NUMERICAL ANALYSIS OF FATIGUE BEHAVIOR OF … · In the CFCHS arch truss bridges, circular hollow...
22
Advanced Steel Construction Vol. 10, No. 4, pp. 476-497 (2014) 476 NUMERICAL ANALYSIS OF FATIGUE BEHAVIOR OF WELDED CFCHS T-JOINTS Min Gu 1 , Le-Wei Tong 2,* , Xiao-Ling Zhao 3 and Yun-Feng Zhang 4 1, 2 State key laboratory for Disaster Reduction in Civil Engineering, Tongji University and College of Civil Engineering, Tongji University, Shanghai 200092, China 3 Department of Civil Engineering, Monash University, Clayton, VIC 3800, Australia 4 Department of Civil & Environmental Engineering, University of Maryland, College Park, MD 20742, USA and Guang-Hua Education Foundation Scholar, College of Civil Engineering, Tongji University, Shanghai 200092, China *(Corresponding author: E-mail: [email protected]) Received: 21 February 2014; Revised: 29 April 2014; Accepted: 2 May 2014 ABSTRACT: Fatigue life assessment of welded joints made of circular hollow sections (CHS) with concrete filled (CF) chord member subject to vehicle load is vital in designing of CFCHS arch truss bridge. A key issue in fatigue life assessment of such joints is how to accurately estimate the stress intensity factor. This paper describes a methodology for calculating the stress intensity factor of the hot spot region in the welded CFCHS T-joints based on a finite element analysis which considers weld modeling, crack modeling and nonlinear interface element between steel and concrete. A procedure for fatigue life estimation of welded CFCHS T-joints is also established. Discussions are made on the effect of the initial crack size and concrete strength on fatigue life and hot spot stresses. The majority of crack propagation life is found to be associated with the shallow crack stage. The proposed method gives reasonable estimation of fatigue life of welded CFCHS T-joints. Keywords: Concrete-filled circular hollow section, Welded joints, Fatigue life prediction, Fracture mechanics, Finite element analysis 1. INTRODUCTION Concrete-filled steel tubes have been widely used in civil engineering structures [1, 2]. Recently in China, concrete-filled circular hollow sections (CFCHS) have been increasingly used in large-span arch truss bridges. One example is the Wuxia Bridge located in Chongqing City, China, which has a 460 m main span. In the CFCHS arch truss bridges, circular hollow section (CHS) chord members and the brace members are welded together and the main chords are filled with concrete while the braces are unfilled. The motivation for using such CFCHS structures comes from the fact that the concrete infill can substantially improve the stability of the compressive chords as well as the stiffness near the intersection of the chords and braces. However, it is well known that cyclic loads may cause fatigue failure at the weld toe of the CHS joints due to high stress concentration and welding defects. The welded CFCHS joints in these arch truss bridges are therefore susceptible to fatigue cracking since they are subject to cyclic loads induced by daily traffic. Fatigue is an important issue in designing welded CFCHS joints. Extensive research has been conducted on fatigue of welded tubular joints without infill of concrete (e.g. [3-7]). The hot spot stress method has been widely adopted in designing such welded tubular joints [3], where SCF (stress concentration factor) formulae and S-N (hot spot stress range - fatigue strength) curves are required. The existing design rules for unfilled tubular joints cannot be applied to welded CFCHS joints because different SCF values and S-N curves are expected. There are
Transcript of NUMERICAL ANALYSIS OF FATIGUE BEHAVIOR OF … · In the CFCHS arch truss bridges, circular hollow...

Advanced Steel Construction Vol. 10, No. 4, pp. 476-497 (2014) 476
NUMERICAL ANALYSIS OF FATIGUE BEHAVIOR OF WELDED CFCHS T-JOINTS
Min Gu1, Le-Wei Tong2,*, Xiao-Ling Zhao3 and Yun-Feng Zhang4
1, 2 State key laboratory for Disaster Reduction in Civil Engineering, Tongji University and College of Civil Engineering, Tongji University, Shanghai 200092, China
3 Department of Civil Engineering, Monash University, Clayton, VIC 3800, Australia 4 Department of Civil & Environmental Engineering, University of Maryland,
College Park, MD 20742, USA and Guang-Hua Education Foundation Scholar, College of Civil Engineering, Tongji University, Shanghai 200092, China
*(Corresponding author: E-mail: [email protected])
Received: 21 February 2014; Revised: 29 April 2014; Accepted: 2 May 2014
ABSTRACT: Fatigue life assessment of welded joints made of circular hollow sections (CHS) with concrete filled (CF) chord member subject to vehicle load is vital in designing of CFCHS arch truss bridge. A key issue in fatigue life assessment of such joints is how to accurately estimate the stress intensity factor. This paper describes a methodology for calculating the stress intensity factor of the hot spot region in the welded CFCHS T-joints based on a finite element analysis which considers weld modeling, crack modeling and nonlinear interface element between steel and concrete. A procedure for fatigue life estimation of welded CFCHS T-joints is also established. Discussions are made on the effect of the initial crack size and concrete strength on fatigue life and hot spot stresses. The majority of crack propagation life is found to be associated with the shallow crack stage. The proposed method gives reasonable estimation of fatigue life of welded CFCHS T-joints. Keywords: Concrete-filled circular hollow section, Welded joints, Fatigue life prediction, Fracture mechanics, Finite element analysis
1. INTRODUCTION Concrete-filled steel tubes have been widely used in civil engineering structures [1, 2]. Recently in China, concrete-filled circular hollow sections (CFCHS) have been increasingly used in large-span arch truss bridges. One example is the Wuxia Bridge located in Chongqing City, China, which has a 460 m main span. In the CFCHS arch truss bridges, circular hollow section (CHS) chord members and the brace members are welded together and the main chords are filled with concrete while the braces are unfilled. The motivation for using such CFCHS structures comes from the fact that the concrete infill can substantially improve the stability of the compressive chords as well as the stiffness near the intersection of the chords and braces. However, it is well known that cyclic loads may cause fatigue failure at the weld toe of the CHS joints due to high stress concentration and welding defects. The welded CFCHS joints in these arch truss bridges are therefore susceptible to fatigue cracking since they are subject to cyclic loads induced by daily traffic. Fatigue is an important issue in designing welded CFCHS joints. Extensive research has been conducted on fatigue of welded tubular joints without infill of concrete (e.g. [3-7]). The hot spot stress method has been widely adopted in designing such welded tubular joints [3], where SCF (stress concentration factor) formulae and S-N (hot spot stress range - fatigue strength) curves are required. The existing design rules for unfilled tubular joints cannot be applied to welded CFCHS joints because different SCF values and S-N curves are expected. There are
477 Numerical Analysis of Fatigue Behavior of Welded CFCHS T-Joints
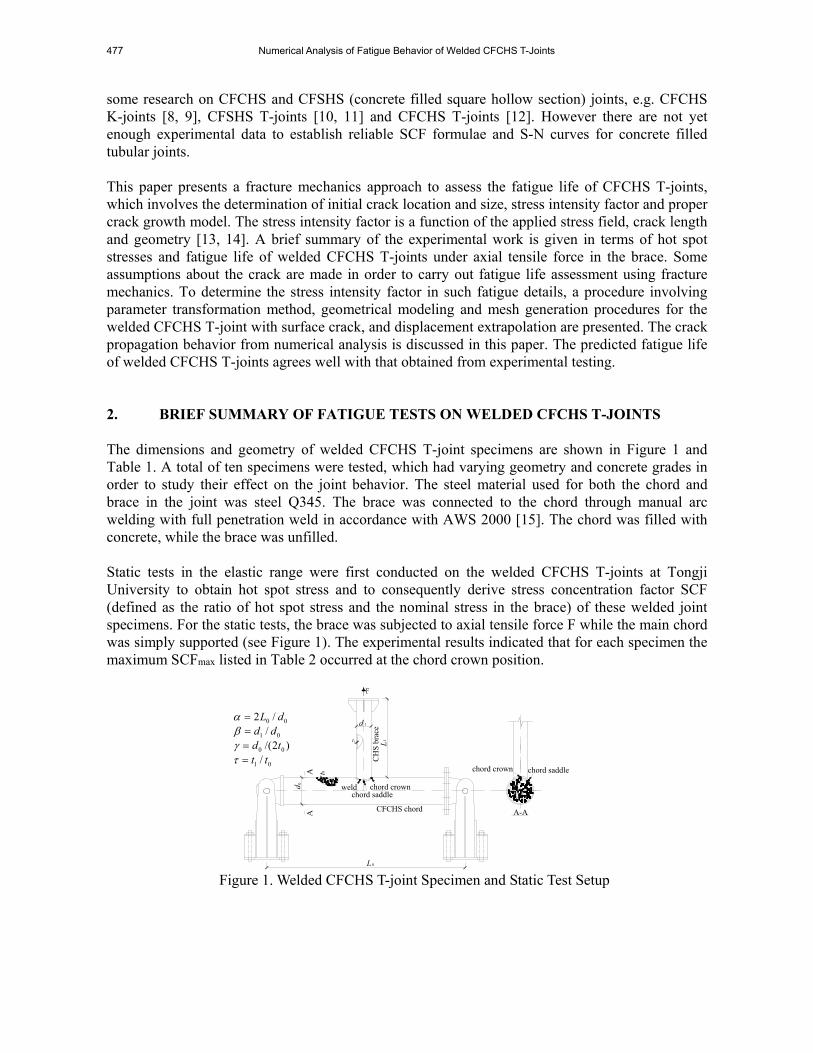
some research on CFCHS and CFSHS (concrete filled square hollow section) joints, e.g. CFCHS K-joints [8, 9], CFSHS T-joints [10, 11] and CFCHS T-joints [12]. However there are not yet enough experimental data to establish reliable SCF formulae and S-N curves for concrete filled tubular joints. This paper presents a fracture mechanics approach to assess the fatigue life of CFCHS T-joints, which involves the determination of initial crack location and size, stress intensity factor and proper crack growth model. The stress intensity factor is a function of the applied stress field, crack length and geometry [13, 14]. A brief summary of the experimental work is given in terms of hot spot stresses and fatigue life of welded CFCHS T-joints under axial tensile force in the brace. Some assumptions about the crack are made in order to carry out fatigue life assessment using fracture mechanics. To determine the stress intensity factor in such fatigue details, a procedure involving parameter transformation method, geometrical modeling and mesh generation procedures for the welded CFCHS T-joint with surface crack, and displacement extrapolation are presented. The crack propagation behavior from numerical analysis is discussed in this paper. The predicted fatigue life of welded CFCHS T-joints agrees well with that obtained from experimental testing. 2. BRIEF SUMMARY OF FATIGUE TESTS ON WELDED CFCHS T-JOINTS The dimensions and geometry of welded CFCHS T-joint specimens are shown in Figure 1 and Table 1. A total of ten specimens were tested, which had varying geometry and concrete grades in order to study their effect on the joint behavior. The steel material used for both the chord and brace in the joint was steel Q345. The brace was connected to the chord through manual arc welding with full penetration weld in accordance with AWS 2000 [15]. The chord was filled with concrete, while the brace was unfilled. Static tests in the elastic range were first conducted on the welded CFCHS T-joints at Tongji University to obtain hot spot stress and to consequently derive stress concentration factor SCF (defined as the ratio of hot spot stress and the nominal stress in the brace) of these welded joint specimens. For the static tests, the brace was subjected to axial tensile force F while the main chord was simply supported (see Figure 1). The experimental results indicated that for each specimen the maximum SCFmax listed in Table 2 occurred at the chord crown position.
weld
CH
S b
race
0A t
chord crown
chord crown chord saddle
CFCHS chord
0d
chord saddle
L 0
A
1L1t
1d
A-A
Figure 1. Welded CFCHS T-joint Specimen and Static Test Setup
0 02 /L d
1 0/ d d
0 0/(2 ) d t
1 0/ t t
Min Gu, Le-Wei Tong, Xiao-Ling Zhao and Yun-Feng Zhang 478
Table 1. Details of Test Specimens
Joint d0×t0
(mm×mm) d1×t1
(mm×mm)
Nondimensional geometrical parameter Steel
Grade Concrete
Grade β=d1/d0 2γ=d0/t0 τ=t1/t0
CFCHS-1 245×8 133×8 0.54 30.62 1.00 Q345 C50
CFCHS-2 180×6 133×6 0.74 30.00 1.00 Q345 C50
CFCHS-3 133×4.5 133×4.5 1.00 29.56 1.00 Q345 C50
CFCHS-4 245×8 133×6 0.54 30.62 0.75 Q345 C50
CFCHS-5 245×8 133×4.5 0.54 30.62 0.56 Q345 C50
CFCHS-6 245×8 133×8 0.54 30.62 1.00 Q345 C20
CFCHS-7 245×8 133×8 0.54 30.62 1.00 Q345 C70
CFCHS-8 203×8 140×8 0.69 25.38 1.00 Q345 C50
CFCHS-9 203×10 140×10 0.69 20.30 1.00 Q345 C50
CFCHS-10 203×12 140×12 0.69 16.92 1.00 Q345 C50
Note : Both the yield strength and the impact toughness at 20 of Steel Q345 are 345 MPa and over 34 Joules respectively. The cubic compressive strength of Concrete C20, C50 and C70 is 20, 50 and 70 MPa respectively.
Table 2. Experimental SCF and Fatigue Life of Test Specimens
Joint Maximum
SCF Axial force
range Fr (kN)Fatigue life
N
CFCHS-1 6.79 80 1133000
CFCHS-2 8.86 60 410994
CFCHS-3 12.50 60 20295
CFCHS-4 3.98 100 844800
CFCHS-5 4.08 80 737706
CFCHS-6 7.42 90 394800
CFCHS-7 6.54 80 1351350
CFCHS-8 7.98 80 881280
CFCHS-9 8.77 110 599720
CFCHS-10 8.65 65 4013272
Constant-amplitude fatigue loading tests were conducted after the static elastic tests of these welded CFCHS T-joints. The brace of each T-joint was subjected to an axial cyclic force with a frequency of 4 Hz. The stress ratio, defined as the ratio of the minimum force to maximum force, was from 0.23 to 0.35. Seeing that the actuator of the fatigue testing machine could only push out, the brace was reversed and a loading frame between the actuator and the brace end was installed so that a “push” from the fatigue testing machine was transformed into a “pull” to the brace, as shown in Figure 2. The applied axial force range Fr for each joint is given in Table 2.
A typical damage pattern with fatigue crack initiating at the weld toe of chord crown for the welded CFCHS T-joints is shown in Figure 3. The fatigue test results showed that fatigue crack usually initiated at or near the chord crown location which was exactly the position of maximum hot spot stress (i.e. the position of maximum stress concentration factor) indicated by static tests. The crack propagated along the weld toe intersecting the chord and brace and finally along the chord circumference. The fatigue life N of each CFCHS T-joint obtained from the fatigue tests is listed in

479 Numerical Analysis of Fatigue Behavior of Welded CFCHS T-Joints
Table 2, which will be used to check the fatigue life predicted using numerical analysis based on the theory of fracture mechanics. In this paper N is defined as the number of load cycle when the fatigue induced crack fully penetrates the wall thickness of the steel tubular chord, which is a commonly accepted fatigue failure criterion [3]. The details of the fatigue test results have been reported in the reference [12].
Figure 2. Fatigue Test Setup Figure 3. Typical Fatigue Crack 3. NUMERICAL SIMULATION STUDY This section presents the numerical analysis procedure for the welded CFCHS T-joints, which includes assumptions for fatigue crack location and shape, as well as features of finite element model. This numerical analysis model will be used later for calculating the stress intensity factors of CFCHS T-joints. 3.1 Assumptions for Fatigue Crack Location and Shape In order to facilitate numerical analysis, assumptions was made about the initial crack location, size and crack shape of the welded CFCHS T-joint based on the experimental data of hot spot stress, fatigue strength and observed fatigue behavior. 3.1.1 Initial crack location and size The surface crack is assumed to initiate at the chord crown position which has the maximum stress concentration factor. This is also verified through extensive finite element based parametric study of the CFCHS T-joints’ chord subject to cyclic load transmitted from axially loaded brace. It is assumed that the deepest point of the semi-elliptical fatigue crack is located at the two crowns of the chord, as shown in Figure 4.
Figure 4. Schematics of Semi-elliptical Surface Crack Model
K K
K
c c
a
2c
a
Z
t
X
Z
aK
Y
Fr
Test specimen
Loading frame
Fatigue loading
Simply supported
Fatigue crack
Min Gu, Le-Wei Tong, Xiao-Ling Zhao and Yun-Feng Zhang 480
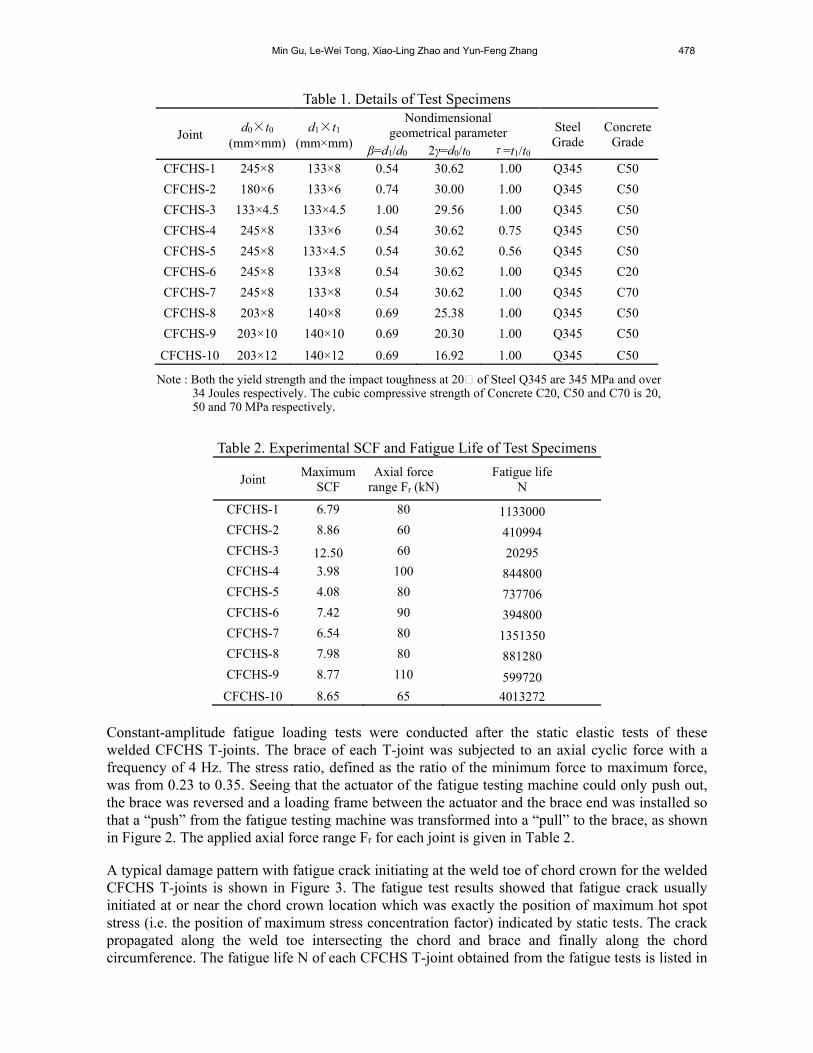
In the HSE document [16], slag intrusions are specified to range from 0.15 to 0.4 mm in depth and typical sizes at the weld toe are set as ai = ci = 0.25mm. In this study, the initial crack sizes are also assumed as ai = ci = 0.25mm for the semi-elliptical crack shape. 3.1.2 Crack shape Based on the knowledge of linear elastic fracture mechanics and observed typical damage pattern for the welded CFCHS T-joints (e.g., Figure 3), the surface crack is assumed to exhibit a semi-elliptical shape with a depth of a and length of 2c around the weld toe. When unwrapped and projected into a plane, the elliptical equation of (x/c)2 + (z/a)2 = 1 can be used to describe the crack shape, as shown in Figure 4. The crack growth in the thickness direction is assumed to be perpendicular to the surface of the chord because it requires the least amount of energy for crack propagation. In this study two stress intensity factors Ka and Kc (associated with the deepest point and the crack ends respectively) are calculated because they govern the crack growth. 3.2 Finite Element Analysis The major challenges encountered in the process of establishing the numerical model for the welded CFCHS T-joints with surface crack defect at the chord crown positions include: weld modeling, crack modeling, nonlinear interface element between steel tube and concrete infill. To accomplish this using the general computational software ANSYS [17], the APDL (ANSYS Parametric Design Language) was employed in this study to implement a geometric transformation scheme as well as constructing a new crack-tip singular element. Through geometric transformation, the complex problem of modeling welded CFCHS T-joints with surface crack defect is converted into a relatively simple model of welded T-butt plate with surface crack at weld toe. 3.2.1 Modeling procedure In this study, the mesh of the welded T-butt plate with surface crack at weld toe was generated using the APDL code for a good balance between refined mesh near the crack tip, good transition and compatibility of the mesh and computing time. A depiction of the finite element modeling procedure is given in Figure 5, and details of each step in this procedure are described as follows,
16171819202122 1314
15
16171819202122
(a) T-butt with surface crack (b) Quarter of CHS brace (c) CHS brace with the unfolded
surface of a quarter of chord
XYZ
XYZ
(d) Quarter CHS joint (e) Quarter CHS joint with concrete infill in chord
Figure 5. Illustration of Finite Element Modelling Procedure
481 Numerical Analysis of Fatigue Behavior of Welded CFCHS T-Joints
STEP 1: The first step in the modeling process is to build a welded T-butt plate with a semi-elliptical crack defined by two dimensionless parameters, a/t0 and a/c where t0 is the chord wall thickness. Crack tip singular elements are included. This plate is only for a quarter of the brace member in the T-joint. STEP 2: The T-butt plate is then built into a quarter of the round brace tube because of the symmetry of the T-joint and applied load. STEP 3: A flat plate model for the chord is generated and then connected to the quarter brace model from STEP 2 by merging the common nodes of both the chord plate and the brace. STEP 4: The chord plate model is built into the half hollow circular tube with the parameters α, β, γ, τ, t0 of the joint defined. STEP 5: Concrete elements are added to the chord member. Caution is exercised here to match the interface mesh of the concrete and steel chord for which contact elements are used at the interface of these two materials.
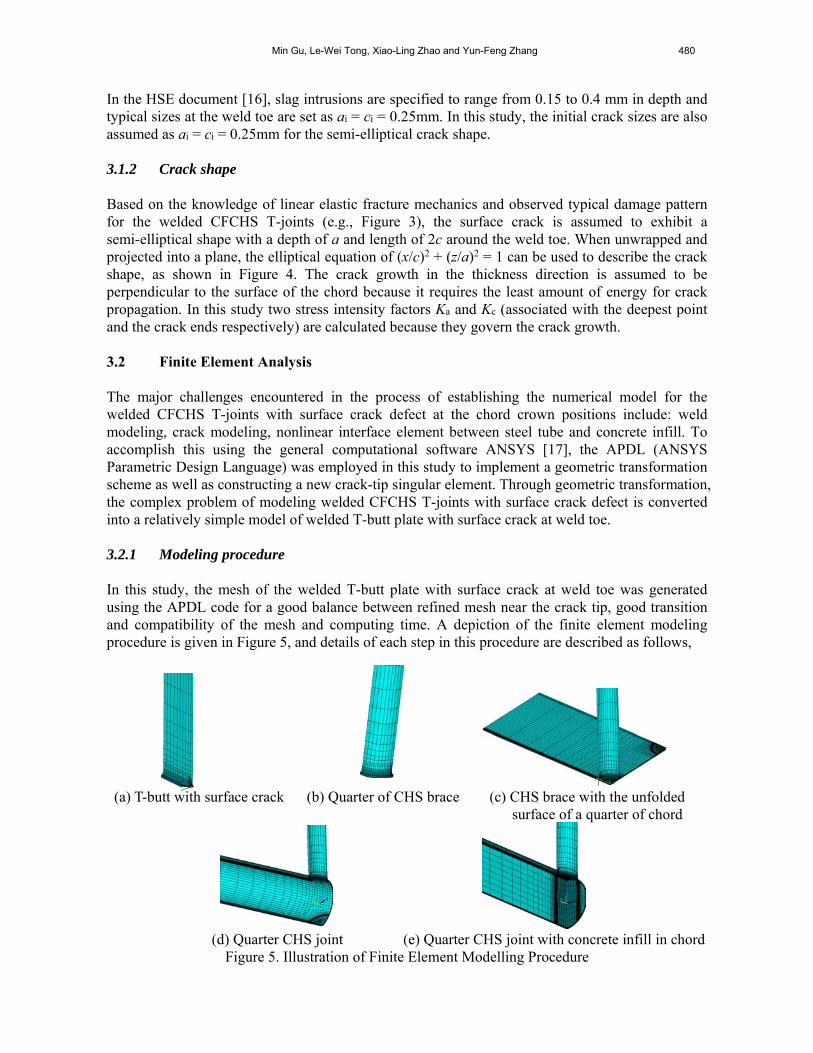
3.2.2 Geometric transformation Geometric transformation is employed here to map nodes on a flat plane to circular surface while maintaining their topological relationships for the same elements. Geometric transformation formulas have been derived and implemented into the ANSYS model using the APDL commands in this study. Crack tip singular element has been developed which is previously not available in the ANSYS element library. In order to simulate the crack propagation path, both the crack and joint sizes have been chosen as the varying parameters. Additionally, nonlinear contact elements between the steel chord member and the concrete infill are also employed. For high-quality mesh generation, the unfolded surface of a quarter of chord was divided into four regions as shown in Figure 6. In Region I and II, a series of concentric circles with different radius (ri) have been drawn, where ri = 0.5d1-t1 represents the brace inner wall projection, ri = 0.5d1+ hf1 represents the chord weld toe projection, and ri = 0.5d1+ hf1+Tr represents the border line where different transformation formulas will be used for the inner nodes and outer nodes on its two sides. hf1 is the weld toe height on the chord side. hf2 is the weld toe height on the brace side. The mesh for both Region I and II needs to be symmetrical.
d /2-t1
d /2+h1 f1
1d /2+ h +Tr
ri
I
II
III IV
1
f1
Figure 6. Four Regions for Finite Element Mesh on the Unfolded Surface of a Quarter of Chord
It is noteworthy that the nodes on the interior surface of the steel tube and the nodes on the external surface of the concrete coincide with each other while they cannot be merged together. Otherwise, it may lead to non-convergence or erroneous results in the finite element simulation based on the ANSYS model due to the initial gap or penetration between the two contact materials. The following formulas are derived to make the geometric transformation easier.

Min Gu, Le-Wei Tong, Xiao-Ling Zhao and Yun-Feng Zhang 482
3.2.2.1 Geometric transformation for chord An unfolded plane surface mesh of a quarter of chord at T-joint in Figure 7 is transformed into its curved surface mesh using Eqs. 1, 2 and 3.
/20d/2
0L / 2
d 0t01 1
1
Y
XZZ
XY0t
1c /2
ri ir
Figure 7. Geometric Transformation for Chord Mesh
For 1 / 2X d +hf1+Tr and 1 / 2r d +hf1+Tr (see Figure 7),
(1)
Where c1 is the outer circumference of a chord, and c2 is the inner circumference of a chord. For 1 1/ 2 ( / 2X c d +hf1+ Tr)and 1 / 2r d +hf1+ Tr,
(2) For others,
(3)
0 1 2 00
0 0 1 01
1
0 1 2 00
0 0 1 01
( / 2 )( )2 2arcsin arcsin
sin[ ]2
( / 2 )( )2 2arcsin arcsin )
cos[ ]2
d Z c c dX Xd
d t c dX Z
ZY Y
d Z c c dX Xd
d t c dZ Z
Z
0 1 21 11 0 1 0
0 0 1 01
1
0 1 21 11 0 1 0
0 0 1 01
( / 2 )( )2 2( arcsin ) ( arcsin )
sin[ ]2
( / 2 )( )2 2( arcsin ) ( arcsin )
cos[ ]2
d Z c cc X c Xc d c d
d t c dX Z
ZY Y
d Z c cc X c Xc d c d
d t c dZ Z
Z
0 1 2
0 11
1
0 1 2
0 11
( / 2 )( )
sin[ ]
( / 2 )( )
cos[ ]
d Z c cX X
t cX Z
ZY Y
d Z c cX X
t cZ Z
Z
483 Numerical Analysis of Fatigue Behavior of Welded CFCHS T-Joints
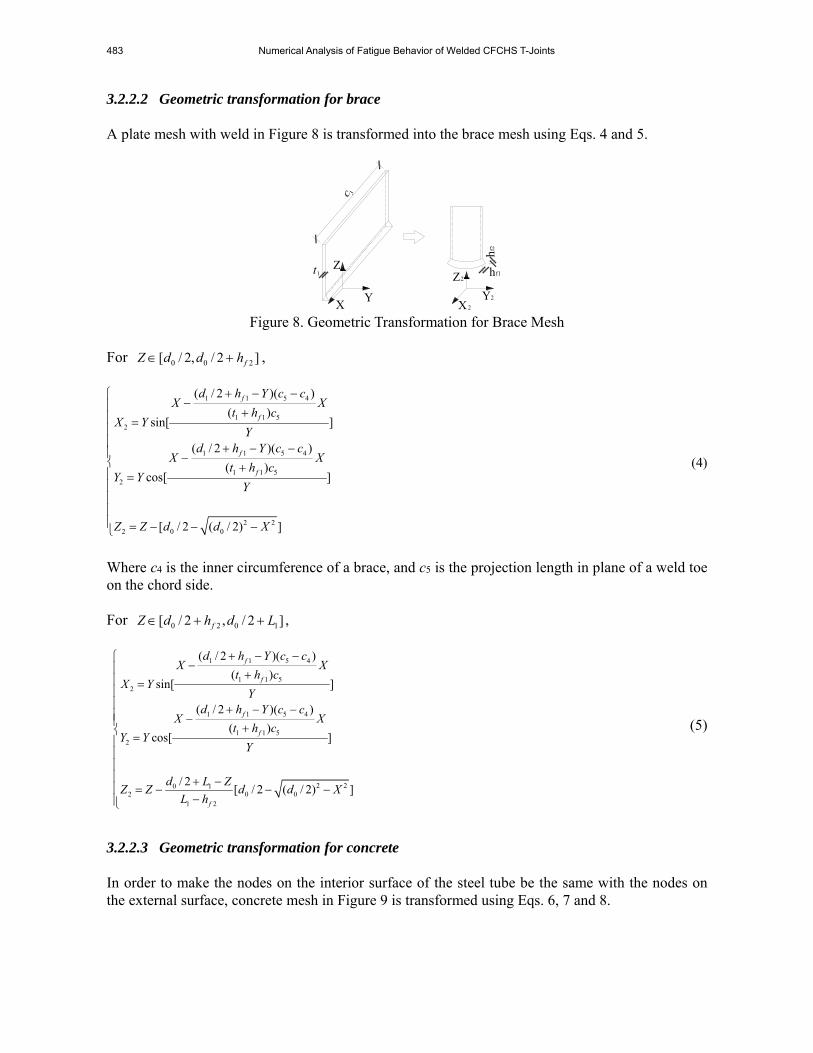
3.2.2.2 Geometric transformation for brace A plate mesh with weld in Figure 8 is transformed into the brace mesh using Eqs. 4 and 5.
YX
Zt1
c 3
Z
XY
2
2
2hf1
f2 h
Figure 8. Geometric Transformation for Brace Mesh
For 0 0 2[ / 2, / 2 ]fZ d d h ,
(4)
Where c4 is the inner circumference of a brace, and c5 is the projection length in plane of a weld toe on the chord side. For 0 2 0 1[ / 2 , / 2 ]fZ d h d L ,
(5)
3.2.2.3 Geometric transformation for concrete In order to make the nodes on the interior surface of the steel tube be the same with the nodes on the external surface, concrete mesh in Figure 9 is transformed using Eqs. 6, 7 and 8.
1 1 5 4
1 1 52
1 1 5 4
1 1 52
2 22 0 0
( / 2 )( )
( )sin[ ]
( / 2 )( )
( )cos[ ]
[ / 2 ( / 2) ]
f
f
f
f
d h Y c cX X
t h cX Y
Yd h Y c c
X Xt h c
Y YY
Z Z d d X
1 1 5 4
1 1 52
1 1 5 4
1 1 52
2 20 12 0 0
1 2
( / 2 )( )
( )sin[ ]
( / 2 )( )
( )cos[ ]
/ 2[ / 2 ( / 2) ]
f
f
f
f
f
d h Y c cX X
t h cX Y
Yd h Y c c
X Xt h c
Y YY
d L ZZ Z d d X
L h

Min Gu, Le-Wei Tong, Xiao-Ling Zhao and Yun-Feng Zhang 484
c /2
-
0L / 2
d 0
3 3
3
YX
ZZX
Y
2
r r
2t0
02t
0d-
Figure 9. Geometric Transformation for Concrete Mesh
For 1 / 2X d +hf1+Tr and 1 / 2r d + hf1+ Tr,
(6)
For 1 1/ 2 ( / 2X c d +hf1+ Tr) and 1 / 2r d +hf1+ Tr,
(7) For others,
(8) 3.2.3 Material property and element type
In the finite element analysis, most part of the steel tube is simulated using the SOLID45 element in the ANSYS software except for the crack tip singular element. The modulus of elasticity and Poisson’s ratio are set 206 GPa and 0.3 [12], respectively. Particular attention was given to understand the behavior of the concrete inside the chord under fatigue load as this is important to the fatigue failure mode and thus fatigue strength. After each fatigue test was completed, steel tube near the intersection of the brace and the chord was cut to expose the concrete for a close examination. As shown in Figure 10 for a typical specimen, no
12 1 0
03 0 0
1 0 0
3
2 20 0 3
30 0
2( sin )
( / 2 )sin[ ]( 2 )
( / 2 )
/ 2
c Xc c d arc
dX d t
c d t
Y Y
Z d t XZ
d t
2 00
3 0 01 0 0
3
2 20 0 3
30 0
2arcsin
( / 2 )sin[ ]( 2 )
( / 2 )
/ 2
Xc d
dX d t
c d t
Y Y
Z d t XZ
d t
23 0 0
1 0 0
3
2 20 0 3
30 0
2( / 2 )sin[ ]
( 2 )
( / 2 )
/ 2
c XX d t
c d t
Y Y
Z d t XZ
d t

485 Numerical Analysis of Fatigue Behavior of Welded CFCHS T-Joints
visual sign of concrete crushing was seen in any specimen. It is found from subsequent finite element analysis that the concrete infill changes the hot spot stress distribution at the intersection of a CHS brace and a CHS chord and thus affects the fatigue strength of a welded joint. However, when concrete strength grade changes, the hot spot stresses remain almost the same. Although the effect of concrete strength grade is insignificant, the fatigue property of the concrete itself cannot be neglected. The fatigue deformation modulus for concrete can be found in the Chinese Code for the Design of Concrete Structures (GB 50010-2010). They are summarized in Table 3. The Poisson’s ratio of concrete is taken as 0.2. In the ANSYS finite element model, concrete is simulated using the SOLID65 element.
(a) Concrete extreme fiber in tension (b) Concrete extreme fiber in compression
Figure 10. View of Concrete Infill Damages
Table 3. Concrete Fatigue Deformation Modulus Concrete grade C20 C30 C40 C50 C60 C70 C80
(MPa) 11000 13000 15000 16000 17000 18000 19000
The weld is modeled using SOLID45 element in the ANSYS with its geometry configuration defined according to the AWS (2000) recommendations and its material properties were assumed to be the same as the parent steel metal. The contact elements (TARGE 170 and CONTA 174 in the ANSYS software) at the interface of concrete infill and steel chord tube were employed to simulate the contact mechanism between the steel and concrete. The friction coefficient for the interface was set as 0.4. The crack tip singular element (see Figure 11) is based on Basroum’s research [18] where the middle nodes in the wedge-shaped elements are moved to the quarter points of the element side in order to model the 1/ r singularity. Since this type of element is unavailable in ANSYS, the wedge-shaped singular element was constructed from the SOLID95 element using the APDL programming language.
Figure 11. Crack Tip Singular Element
In order to accurately simulate the bending stresses and stress concentrations in the intersection region, more than four layers of finite elements were used along the chord wall thickness direction and three layers along the brace wall thickness direction, which poses a challenge for the transition between the fine mesh near the intersection and the outer coarse mesh. The crack tip is surrounded
crack

Min Gu, Le-Wei Tong, Xiao-Ling Zhao and Yun-Feng Zhang 486
by four rings of elements and each ring contains eight elements. Figure 12 shows a close up of the finite element mesh at the chord crown position.
Figure 12. Close-up View of Finite Element Mesh near the T-joint Crown position
4. STRESS INTENSITY FACTOR CALCULATION
4.1 General Methodology From the knowledge of linear elastic fracture mechanics, displacements near the crack tip and stress intensity factors can be expressed as follows.
I
II
I
II
III
3= [(2k -1)cos - cos ] -
4G 2π 2 2
3 - [(2k + 3)sin + sin ] + o( )
4G 2π 2 2
3= [(2k +1)sin - sin ] -
4G 2π 2 2
3 - [(2k + 3)cos + cos ] + o( )
4G 2π 2 2
2sin o( )
G 2π 2
K r θ θu
K r θ θr
K r θ θv
K r θ θr
K r θw = + r
(9)
where In Eq. 9, u, v, w denotes the local radial, normal and tangential displacement (see Figure 13). KI, KII, KIII are the mode I, II, III stress intensity factors respectively. G is the shear modulus and denotes the Poisson’s ratio.
Weld
Crack
Steel tube
Concret
Brace
3 4k
plane strain
3 plane stress
1+

487 Numerical Analysis of Fatigue Behavior of Welded CFCHS T-Joints
crack tip
z,w
θ
rx,u
y,v
Figure 13. Crack Tip Coordinate System
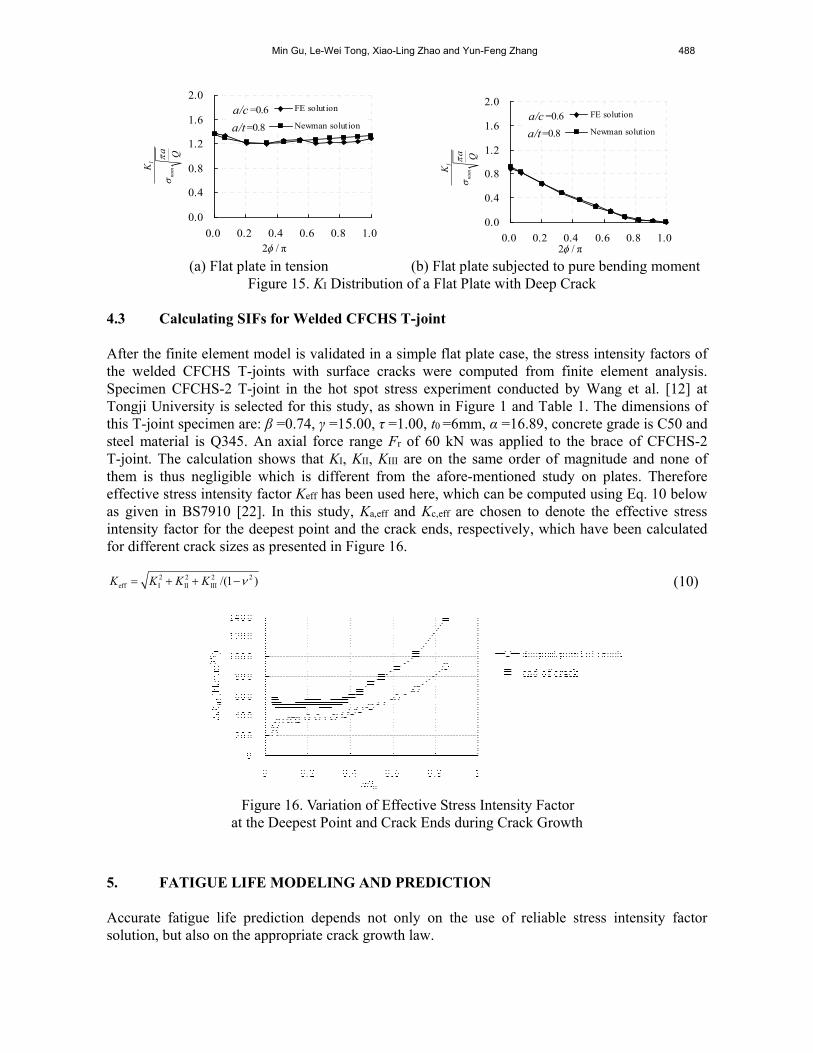
Based on these equations, displacement extrapolation method [19, 20] was employed to calculate the stress intensity factors because the J-integral is no longer path independent near the crack when the crack meets the weld. A comparative study reveals that the KI and KII values for the plane stress state are greater than those values from the plane strain state by 9.8 percent while KIII has the same value. Plane strain state was assumed by Bowness and Lee [20]. For the sake of conservativeness and simplicity, plane strain assumption is adopted in this study. 4.2 Verification with Flat Plate To validate the APDL programs and the crack tip singular elements, solutions of the stress intensity factors for a simple case – flat plate with different crack sizes are computed and compared with the widely accepted results given by Newman and Raju’s work [21]. The mesh plan for the flat plate model is consistent with the welded CFCHS T-joints at the crack front. The plate has a length, width and thickness of 200 mm, 500 mm and 8 mm respectively. The following two load cases were considered: the first one is tensile load resulting in a nominal membrane stress of 100 MPa, the other one is bending moment resulting in a nominal stress of 100 MPa in the extreme fiber. The following crack sizes are considered in the validation study: a/c = 0.4 or 0.6, a/t = 0.2, 0.4, 0.6, 0.8. The computation results show that KII and KIII are less than one percentage of KI. Thus KII and KIII can be neglected. The values of I nom/( π )K a/Q at the crack tip from the finite element analysis are compared with the Newman-Raju’s solution for both shallow cracks (see Figure 14) and deep cracks (see Figure 15). It can be seen from Figures 14 and 15 that the trends agree well with each other, where nom is the nominal stress of the flat plate and Q is a function of a/c in the Newman-Raju’s solution. The maximum discrepancy between the two results is 9% occurring at the deepest point and 12% at the crack ends. Clearly, the finite element model can produce reliable SIF results in the case of a flat plate with surface crack.
(a) Flat plate in tension (b) Flat plate subjected to pure bending moment
Figure 14. KI Distribution of a Flat Plate with Shallow Crack
2 / π
I
nomK
a Q
0.0
0.4
0.8
1.2
1.6
2.0
0.0 0.2 0.4 0.6 0.8 1.0
FE solution
Newman solution
a/c =0.4
a/t =0.2
2 / π
I
nomK
a Q
0.0
0.4
0.8
1.2
1.6
2.0
0.0 0.2 0.4 0.6 0.8 1.0
FE solution
Newman solution
a/c =0.4
a/t =0.2
Min Gu, Le-Wei Tong, Xiao-Ling Zhao and Yun-Feng Zhang 488
(a) Flat plate in tension (b) Flat plate subjected to pure bending moment
Figure 15. KI Distribution of a Flat Plate with Deep Crack
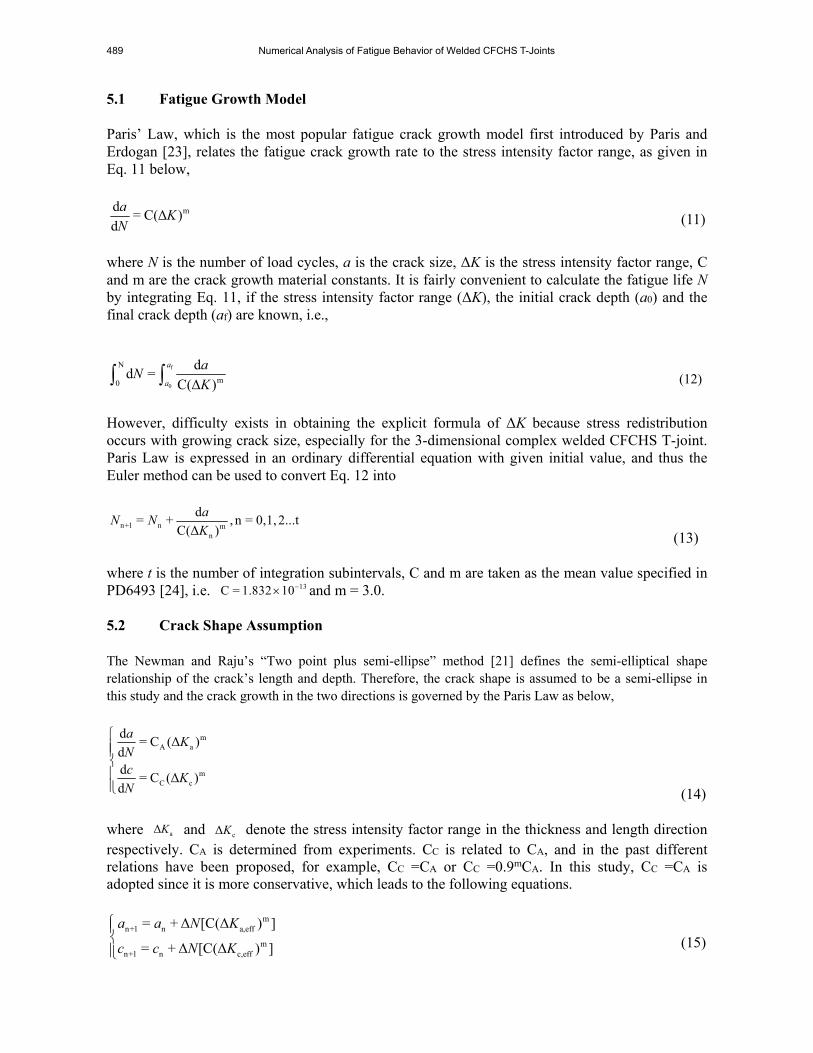
4.3 Calculating SIFs for Welded CFCHS T-joint After the finite element model is validated in a simple flat plate case, the stress intensity factors of the welded CFCHS T-joints with surface cracks were computed from finite element analysis. Specimen CFCHS-2 T-joint in the hot spot stress experiment conducted by Wang et al. [12] at Tongji University is selected for this study, as shown in Figure 1 and Table 1. The dimensions of this T-joint specimen are: β =0.74, γ =15.00, τ =1.00, t0 =6mm, α =16.89, concrete grade is C50 and steel material is Q345. An axial force range Fr of 60 kN was applied to the brace of CFCHS-2 T-joint. The calculation shows that KI, KII, KIII are on the same order of magnitude and none of them is thus negligible which is different from the afore-mentioned study on plates. Therefore effective stress intensity factor Keff has been used here, which can be computed using Eq. 10 below as given in BS7910 [22]. In this study, Ka,eff and Kc,eff are chosen to denote the effective stress intensity factor for the deepest point and the crack ends, respectively, which have been calculated for different crack sizes as presented in Figure 16.
2 2 2eff I II III /(1 )K K K K (10)
Figure 16. Variation of Effective Stress Intensity Factor
at the Deepest Point and Crack Ends during Crack Growth
5. FATIGUE LIFE MODELING AND PREDICTION Accurate fatigue life prediction depends not only on the use of reliable stress intensity factor solution, but also on the appropriate crack growth law.
2 / π
I
nomK
a Q
0.0
0.4
0.8
1.2
1.6
2.0
0.0 0.2 0.4 0.6 0.8 1.0
FE solution
Newman solution
a/c =0.6
a/t =0.8
2 / π
I
nomK
a Q
0.0
0.4
0.8
1.2
1.6
2.0
0.0 0.2 0.4 0.6 0.8 1.0
FE solution
Newman solution
a/c =0.6
a/t =0.8
489 Numerical Analysis of Fatigue Behavior of Welded CFCHS T-Joints
5.1 Fatigue Growth Model Paris’ Law, which is the most popular fatigue crack growth model first introduced by Paris and Erdogan [23], relates the fatigue crack growth rate to the stress intensity factor range, as given in Eq. 11 below,
md= C(Δ )
d
aK
N (11)
where N is the number of load cycles, a is the crack size, ΔK is the stress intensity factor range, C and m are the crack growth material constants. It is fairly convenient to calculate the fatigue life N by integrating Eq. 11, if the stress intensity factor range (ΔK), the initial crack depth (a0) and the final crack depth (af) are known, i.e.,
f
0
N
m0
dd =
C(Δ )
a
a
aN
K (12)
However, difficulty exists in obtaining the explicit formula of ΔK because stress redistribution occurs with growing crack size, especially for the 3-dimensional complex welded CFCHS T-joint. Paris Law is expressed in an ordinary differential equation with given initial value, and thus the Euler method can be used to convert Eq. 12 into
n+1 n mn
d= + , n = 0,1, 2...t
C(Δ )
aN N
K (13) where t is the number of integration subintervals, C and m are taken as the mean value specified in PD6493 [24], i.e. 13C = 1.832 10 and m = 3.0. 5.2 Crack Shape Assumption The Newman and Raju’s “Two point plus semi-ellipse” method [21] defines the semi-elliptical shape relationship of the crack’s length and depth. Therefore, the crack shape is assumed to be a semi-ellipse in this study and the crack growth in the two directions is governed by the Paris Law as below,
mA a
mC c
d= C (Δ )
dd
= C (Δ )d
aK
Nc
KN
(14) where aΔK and cΔK denote the stress intensity factor range in the thickness and length direction respectively. CA is determined from experiments. CC is related to CA, and in the past different relations have been proposed, for example, CC =CA or CC =0.9mCA. In this study, CC =CA is adopted since it is more conservative, which leads to the following equations.
mn+1 n a,eff
mn+1 n c,eff
= + Δ [C(Δ ) ]
= + Δ [C(Δ ) ]
a a N K
c c N K
(15)

Min Gu, Le-Wei Tong, Xiao-Ling Zhao and Yun-Feng Zhang 490
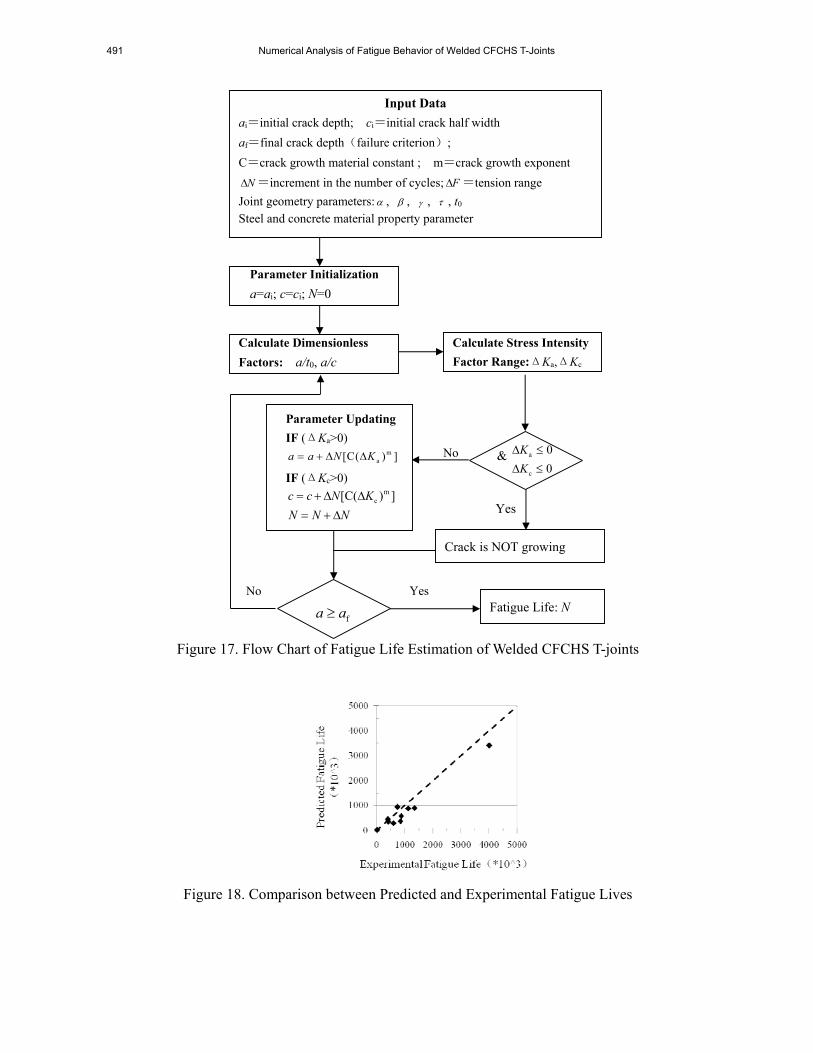
5.3 Failure Criterion and Fatigue Life Estimation The critical crack size is defined as the crack size above which the fatigue limit state (i.e., failure) is assumed to occur. For the fatigue life estimation of circular hollow section joints, it can be determined either as a critical length or as a critical crack depth. Since very few results are available for welded CFCHS joints, the following critical crack size criteria reported for circular hollow section joints might provide insight on how to choose the fatigue failure criterion for welded CFCHS T-joints in terms of critical crack size: (i) half wall thickness as critical crack size used by Schumacher et al. [25]. (ii) 90% wall thickness as critical crack size used Borges and Nussbaumer [26], and Nussbaumer and Haldimann-Sturm [27]. (iii) full wall thickness is more commonly accepted as the critical crack size because crack grows extensively in the length direction when the crack penetrate the full wall thickness. Small variation has little influence on the fatigue life as the majority of the life is spent at small crack depth. To avoid unexpected failure, people usually take the relatively conservative value which is from serviceability criterion as the critical crack size. In this study, the full thickness of the chord tube is taken as the critical crack size. The fatigue test results of the welded CFCHS T-joints subjected to axial tension load on its brace show that the load cycles corresponding to the first visually identified crack, crack penetrating through the wall thickness of the steel tubular chord and the specimen’s loss of load bearing capacity differ from each other by less than 12%. Therefore, in this study, the simulation is terminated when the crack depth reaches the chord wall thickness, as indicated in Figure 17. 5.4 Results and Discussions Following the aforementioned procedure, fatigue life of the welded CFCHS T-joint subjected to cyclic tension load in its brace can be calculated and APDL program was developed by the authors to implement this procedure in the ANSYS software. As an example, CFCHS-2 T-joint specimen in Table 1 with L0 = 1520 mm and L1 = 753 mm was listed to illustrate the approach. The process is divided into a total of 25 steps to determine the fatigue life, as shown in Table 4. To evaluate the validity of the fatigue life modeling method, the fatigue life of all welded CFCHS T-joints were predicted and compared with available experimental data, as given in Table 5 and Figure 18. It can be seen from Figure 18 that the FE predicted fatigue lives reasonably agree with the experimental data. The following factors are likely to contribute to the discrepancy between the FE results and experimental results: (i) the mean value of the initial crack sizes given by HSE [16] was used here, which might be different from the actual crack size; (ii) the mean values of the C and m parameters set by the PD6493 [24] as well as Paris Law are only empirical model that is used to approximate the fatigue growth of welded CFCHS T-joints; (iii) residual stress due to the welding process was not taken into account in the finite element model; (iv) Experimentally determined fatigue life might not correspond to the exact time instant when fatigue crack reached the full chord tube thickness due to difficulty in monitoring fatigue crack growth in the thickness direction.
491 Numerical Analysis of Fatigue Behavior of Welded CFCHS T-Joints
Figure 17. Flow Chart of Fatigue Life Estimation of Welded CFCHS T-joints
Figure 18. Comparison between Predicted and Experimental Fatigue Lives
fa aYes No
Input Data
ai=initial crack depth; ci=initial crack half width
af=final crack depth(failure criterion);
C=crack growth material constant ; m=crack growth exponent
N =increment in the number of cycles; F =tension range
Joint geometry parameters: , , , , t0
Steel and concrete material property parameter
Parameter Initialization
a=ai; c=ci; N=0
Calculate Dimensionless
Factors: a/t0, a/c
Calculate Stress Intensity
Factor Range:ΔKa,ΔKc
Fatigue Life: N
Crack is NOT growing
No
Yes
Parameter Updating
IF (ΔKa>0) m
a[C( ) ]a a N K
IF (ΔKc>0) m
c[C( ) ]c c N K
N N N
a
c
0
0
K
K
&
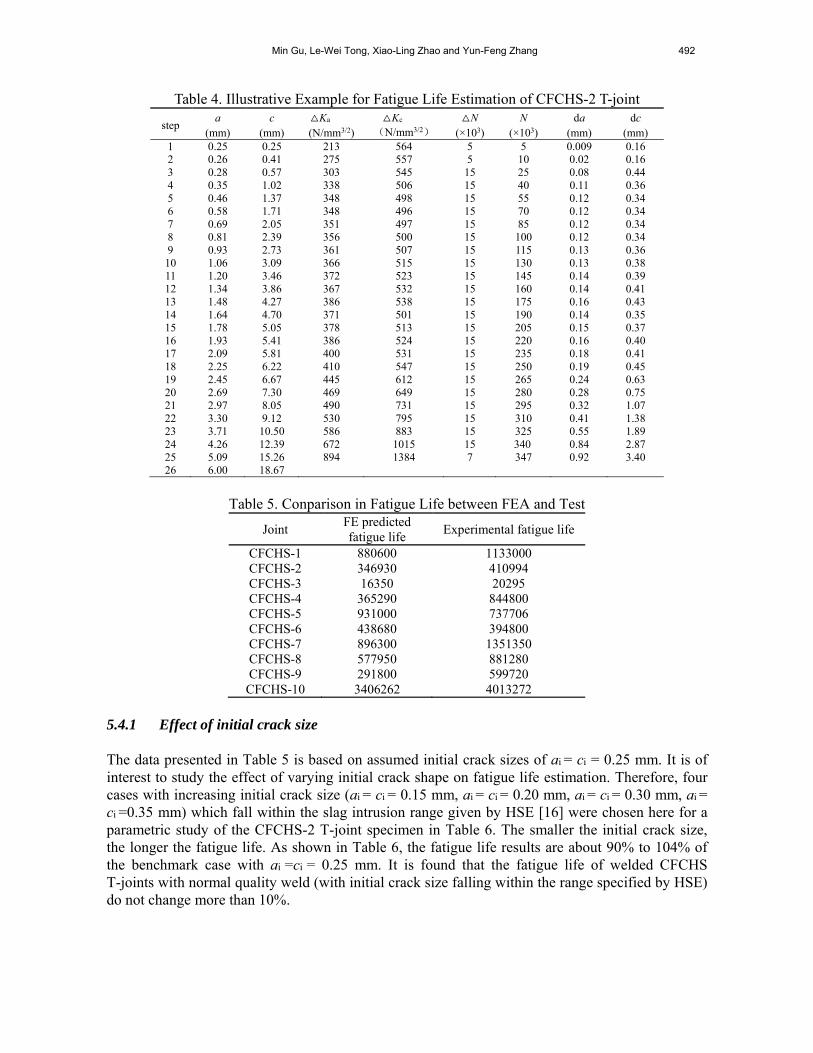
Min Gu, Le-Wei Tong, Xiao-Ling Zhao and Yun-Feng Zhang 492
Table 4. Illustrative Example for Fatigue Life Estimation of CFCHS-2 T-joint
step a
(mm) c
(mm) △Ka
(N/mm3/2) △Kc
(N/mm3/2) △N
(×103) N
(×103) da
(mm) dc
(mm) 1 0.25 0.25 213 564 5 5 0.009 0.16 2 0.26 0.41 275 557 5 10 0.02 0.16 3 0.28 0.57 303 545 15 25 0.08 0.44 4 0.35 1.02 338 506 15 40 0.11 0.36 5 0.46 1.37 348 498 15 55 0.12 0.34 6 0.58 1.71 348 496 15 70 0.12 0.34 7 0.69 2.05 351 497 15 85 0.12 0.34 8 0.81 2.39 356 500 15 100 0.12 0.34 9 0.93 2.73 361 507 15 115 0.13 0.36 10 1.06 3.09 366 515 15 130 0.13 0.38 11 1.20 3.46 372 523 15 145 0.14 0.39 12 1.34 3.86 367 532 15 160 0.14 0.41 13 1.48 4.27 386 538 15 175 0.16 0.43 14 1.64 4.70 371 501 15 190 0.14 0.35 15 1.78 5.05 378 513 15 205 0.15 0.37 16 1.93 5.41 386 524 15 220 0.16 0.40 17 2.09 5.81 400 531 15 235 0.18 0.41 18 2.25 6.22 410 547 15 250 0.19 0.45 19 2.45 6.67 445 612 15 265 0.24 0.63 20 2.69 7.30 469 649 15 280 0.28 0.75 21 2.97 8.05 490 731 15 295 0.32 1.07 22 3.30 9.12 530 795 15 310 0.41 1.38 23 3.71 10.50 586 883 15 325 0.55 1.89 24 4.26 12.39 672 1015 15 340 0.84 2.87 25 5.09 15.26 894 1384 7 347 0.92 3.40 26 6.00 18.67
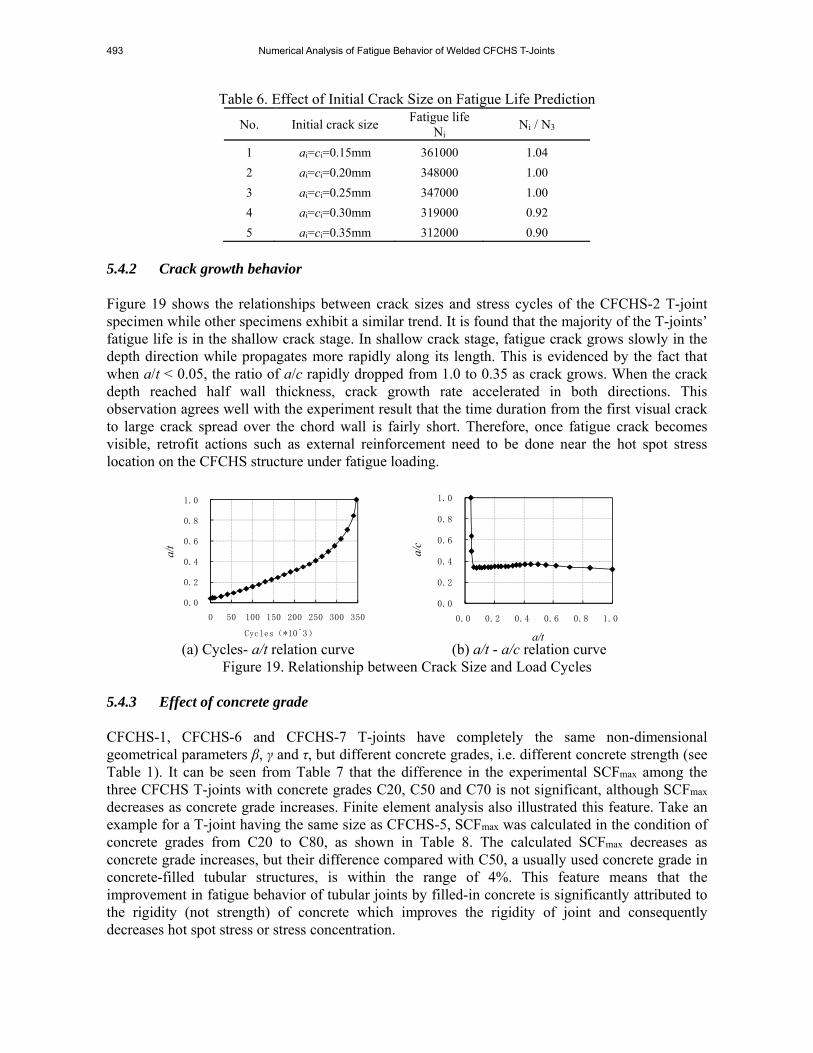
Table 5. Conparison in Fatigue Life between FEA and Test
Joint FE predicted fatigue life
Experimental fatigue life
CFCHS-1 880600 1133000 CFCHS-2 346930 410994 CFCHS-3 16350 20295 CFCHS-4 365290 844800 CFCHS-5 931000 737706 CFCHS-6 438680 394800 CFCHS-7 896300 1351350 CFCHS-8 577950 881280 CFCHS-9 291800 599720 CFCHS-10 3406262 4013272
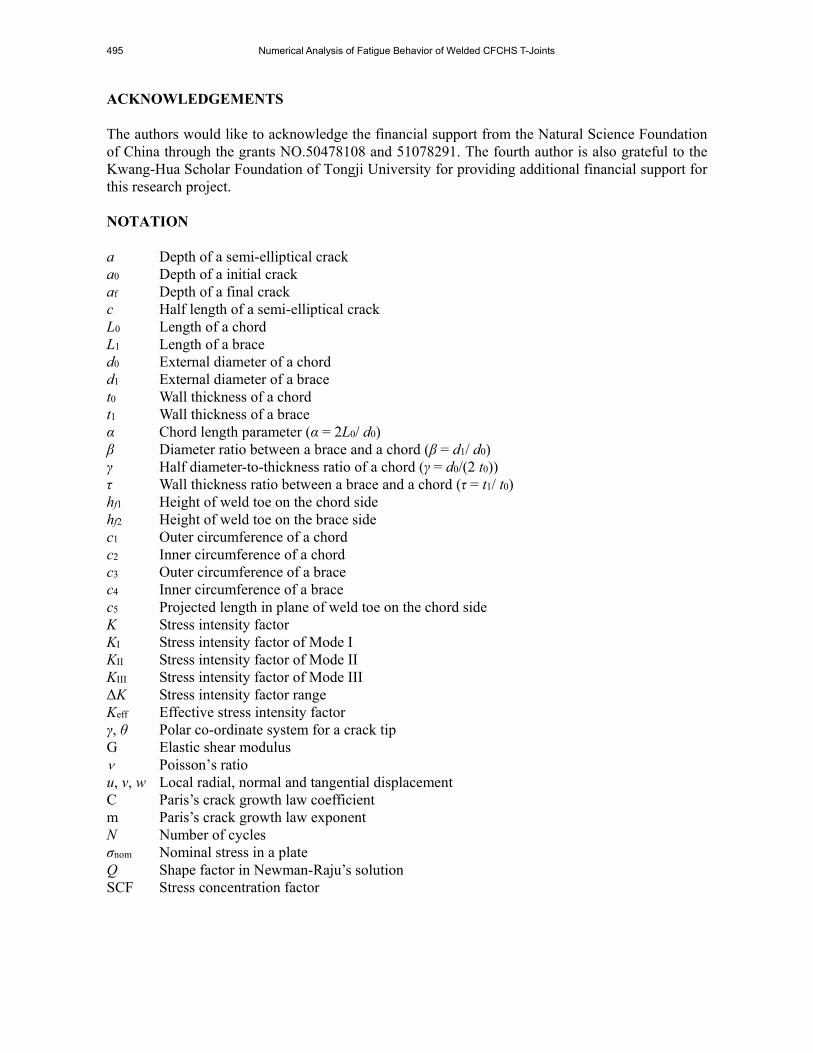
5.4.1 Effect of initial crack size The data presented in Table 5 is based on assumed initial crack sizes of ai = ci = 0.25 mm. It is of interest to study the effect of varying initial crack shape on fatigue life estimation. Therefore, four cases with increasing initial crack size (ai = ci = 0.15 mm, ai = ci = 0.20 mm, ai = ci = 0.30 mm, ai = ci =0.35 mm) which fall within the slag intrusion range given by HSE [16] were chosen here for a parametric study of the CFCHS-2 T-joint specimen in Table 6. The smaller the initial crack size, the longer the fatigue life. As shown in Table 6, the fatigue life results are about 90% to 104% of the benchmark case with ai =ci = 0.25 mm. It is found that the fatigue life of welded CFCHS T-joints with normal quality weld (with initial crack size falling within the range specified by HSE) do not change more than 10%.
493 Numerical Analysis of Fatigue Behavior of Welded CFCHS T-Joints
Table 6. Effect of Initial Crack Size on Fatigue Life Prediction
No. Initial crack size Fatigue life
Ni Ni / N3
1 ai=ci=0.15mm 361000 1.04
2 ai=ci=0.20mm 348000 1.00
3 ai=ci=0.25mm 347000 1.00
4 ai=ci=0.30mm 319000 0.92
5 ai=ci=0.35mm 312000 0.90
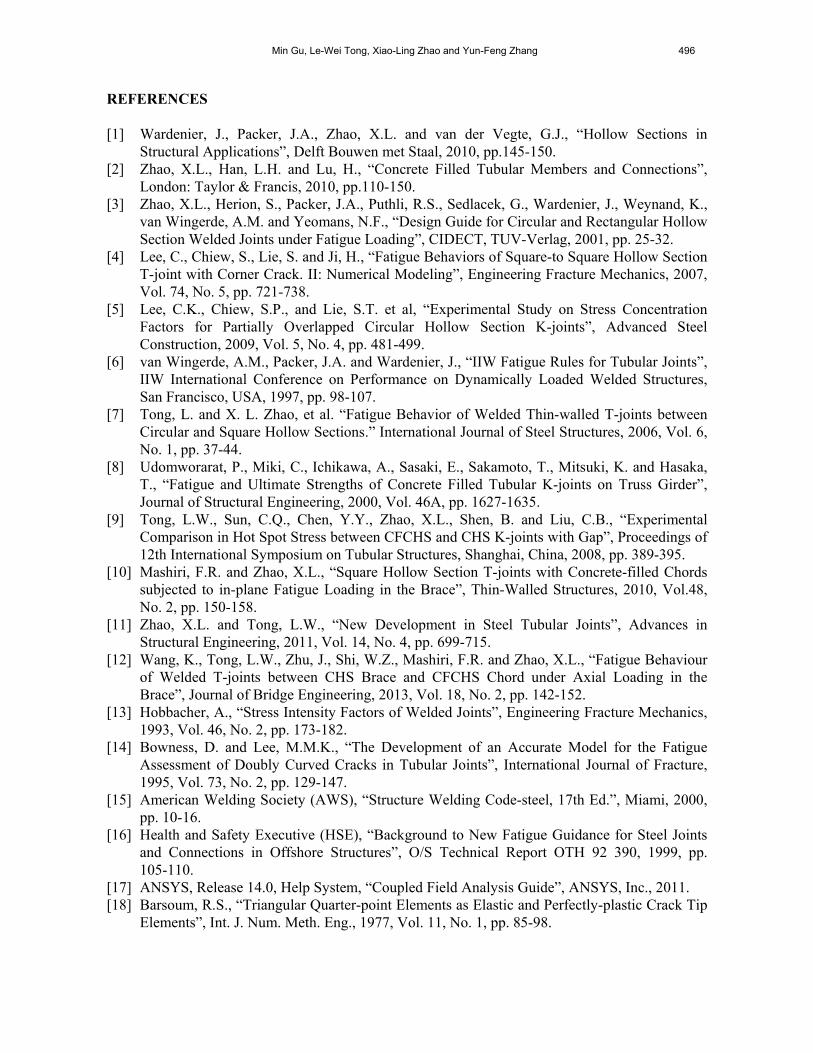
5.4.2 Crack growth behavior Figure 19 shows the relationships between crack sizes and stress cycles of the CFCHS-2 T-joint specimen while other specimens exhibit a similar trend. It is found that the majority of the T-joints’ fatigue life is in the shallow crack stage. In shallow crack stage, fatigue crack grows slowly in the depth direction while propagates more rapidly along its length. This is evidenced by the fact that when a/t < 0.05, the ratio of a/c rapidly dropped from 1.0 to 0.35 as crack grows. When the crack depth reached half wall thickness, crack growth rate accelerated in both directions. This observation agrees well with the experiment result that the time duration from the first visual crack to large crack spread over the chord wall is fairly short. Therefore, once fatigue crack becomes visible, retrofit actions such as external reinforcement need to be done near the hot spot stress location on the CFCHS structure under fatigue loading.
(a) Cycles- a/t relation curve (b) a/t - a/c relation curve
Figure 19. Relationship between Crack Size and Load Cycles 5.4.3 Effect of concrete grade CFCHS-1, CFCHS-6 and CFCHS-7 T-joints have completely the same non-dimensional geometrical parameters β, γ and τ, but different concrete grades, i.e. different concrete strength (see Table 1). It can be seen from Table 7 that the difference in the experimental SCFmax among the three CFCHS T-joints with concrete grades C20, C50 and C70 is not significant, although SCFmax decreases as concrete grade increases. Finite element analysis also illustrated this feature. Take an example for a T-joint having the same size as CFCHS-5, SCFmax was calculated in the condition of concrete grades from C20 to C80, as shown in Table 8. The calculated SCFmax decreases as concrete grade increases, but their difference compared with C50, a usually used concrete grade in concrete-filled tubular structures, is within the range of 4%. This feature means that the improvement in fatigue behavior of tubular joints by filled-in concrete is significantly attributed to the rigidity (not strength) of concrete which improves the rigidity of joint and consequently decreases hot spot stress or stress concentration.
0.0
0.2
0.4
0.6
0.8
1.0
0 50 100 150 200 250 300 350
a/t
Cycles(*10^3)
0.0
0.2
0.4
0.6
0.8
1.0
0.0 0.2 0.4 0.6 0.8 1.0
a/c
a/t

Min Gu, Le-Wei Tong, Xiao-Ling Zhao and Yun-Feng Zhang 494
Table 7. Effect of Concrete Grade on SCFmax from Test Joint CFCHS-6 CFCHS-1 CFCHS-7
Concrete grade C20 C50 C70
SCFmax 7.42 6.79 6.54
SCFmax ratio to C50 1.09 1.00 0.96
Table 8. Effect of Concrete Grade on SCFmax from FEA Concrete grade C20 C30 C40 C50 C60 C70 C80
SCFmax 4.39 4.31 4.24 4.21 4.18 4.12 4.12
SCFmax ratio to C50 1.04 1.02 1.01 1.00 0.99 0.98 0.98
6. CONCLUSIONS This paper outlines a fatigue life assessment procedure for welded concrete filled circular hollow section (CFCHS) T-joint subjected to cyclic axial load in its brace. Finite element analysis was first performed to compute the stress intensity factors for the welded CFCHS T-joints. Special APDL programs were developed in the ANSYS software to simulate the T-joint with surface crack. Crack tip singular element is constructed. Experimental data from ten CFCHS T-joint specimens are also presented and compared with the analysis results. The comparison shows the validity of the analysis approach for fatigue life estimation of welded CFCHS T-joints. Specifically, the following conclusions can be drawn based on the findings of this research:
(1) Based on experimental data of hot spot stresses and fatigue crack growth, a computational model for calculating the stress intensity factors of welded CFCHS T-joints has been established.
(2) In order to obtain converged results, the interface nodes located on the interior surface of the steel tube and the external surface of the concrete of welded CFCHS T-joints should be separated even though they are at the same location. Contact elements were added between the interface nodes to simulation friction and bonding effect.
(3) A fatigue life estimation procedure is proposed for welded CFCHS T-joints. The fatigue life estimated from finite element analysis is generally in agreement with the experimental results. The effect of the initial crack size on the joint fatigue life was studied. The change in fatigue life of welded CFCHS T-joints with normal quality weld (with initial crack size falling within the range specified by HSE) was within 10%.
(4) Relationship between the crack size and load cycles is established for the welded CFCHS T-joints. The most part of the T-joints’ fatigue life is associated with the shallow crack stage. In shallow crack stage, fatigue crack grows slowly in the depth direction while propagates more rapidly along its length. When the crack depth reached half wall thickness, crack growth rate accelerated in both directions. Thus repair actions (e.g., external reinforcing) need to be taken when the crack becomes visible near the hot spot region of the CFCHS structure subjected to cyclic loading.
(5) The filled-in concrete can effectively increase fatigue strength or fatigue life of a tubular joint. This behavior benefits from the effect of rigidity of concrete which improves the rigidity distribution of the whole joint and then decreases hot spot stress or stress concentration at the weld toe of tubular chord. The concrete grade or concrete strength itself has no significant influence on stress concentration.
495 Numerical Analysis of Fatigue Behavior of Welded CFCHS T-Joints
ACKNOWLEDGEMENTS The authors would like to acknowledge the financial support from the Natural Science Foundation of China through the grants NO.50478108 and 51078291. The fourth author is also grateful to the Kwang-Hua Scholar Foundation of Tongji University for providing additional financial support for this research project. NOTATION a Depth of a semi-elliptical crack a0 Depth of a initial crack af Depth of a final crack c Half length of a semi-elliptical crack L0 Length of a chord L1 Length of a brace d0 External diameter of a chord d1 External diameter of a brace t0 Wall thickness of a chord t1 Wall thickness of a brace α Chord length parameter (α = 2L0/ d0) β Diameter ratio between a brace and a chord (β = d1/ d0) γ Half diameter-to-thickness ratio of a chord (γ = d0/(2 t0)) τ Wall thickness ratio between a brace and a chord (τ = t1/ t0) hf1 Height of weld toe on the chord side hf2 Height of weld toe on the brace side c1 Outer circumference of a chord c2 Inner circumference of a chord c3 Outer circumference of a brace c4 Inner circumference of a brace c5 Projected length in plane of weld toe on the chord side K Stress intensity factor KI Stress intensity factor of Mode I KII Stress intensity factor of Mode II KIII Stress intensity factor of Mode III ΔK Stress intensity factor range Keff Effective stress intensity factor γ, θ Polar co-ordinate system for a crack tip G Elastic shear modulus Poisson’s ratio u, v, w Local radial, normal and tangential displacement C Paris’s crack growth law coefficient m Paris’s crack growth law exponent N Number of cycles σnom Nominal stress in a plate Q Shape factor in Newman-Raju’s solution SCF Stress concentration factor
Min Gu, Le-Wei Tong, Xiao-Ling Zhao and Yun-Feng Zhang 496
REFERENCES [1] Wardenier, J., Packer, J.A., Zhao, X.L. and van der Vegte, G.J., “Hollow Sections in
Structural Applications”, Delft Bouwen met Staal, 2010, pp.145-150. [2] Zhao, X.L., Han, L.H. and Lu, H., “Concrete Filled Tubular Members and Connections”,
London: Taylor & Francis, 2010, pp.110-150. [3] Zhao, X.L., Herion, S., Packer, J.A., Puthli, R.S., Sedlacek, G., Wardenier, J., Weynand, K.,
van Wingerde, A.M. and Yeomans, N.F., “Design Guide for Circular and Rectangular Hollow Section Welded Joints under Fatigue Loading”, CIDECT, TUV-Verlag, 2001, pp. 25-32.
[4] Lee, C., Chiew, S., Lie, S. and Ji, H., “Fatigue Behaviors of Square-to Square Hollow Section T-joint with Corner Crack. II: Numerical Modeling”, Engineering Fracture Mechanics, 2007, Vol. 74, No. 5, pp. 721-738.
[5] Lee, C.K., Chiew, S.P., and Lie, S.T. et al, “Experimental Study on Stress Concentration Factors for Partially Overlapped Circular Hollow Section K-joints”, Advanced Steel Construction, 2009, Vol. 5, No. 4, pp. 481-499.
[6] van Wingerde, A.M., Packer, J.A. and Wardenier, J., “IIW Fatigue Rules for Tubular Joints”, IIW International Conference on Performance on Dynamically Loaded Welded Structures, San Francisco, USA, 1997, pp. 98-107.
[7] Tong, L. and X. L. Zhao, et al. “Fatigue Behavior of Welded Thin-walled T-joints between Circular and Square Hollow Sections.” International Journal of Steel Structures, 2006, Vol. 6, No. 1, pp. 37-44.
[8] Udomworarat, P., Miki, C., Ichikawa, A., Sasaki, E., Sakamoto, T., Mitsuki, K. and Hasaka, T., “Fatigue and Ultimate Strengths of Concrete Filled Tubular K-joints on Truss Girder”, Journal of Structural Engineering, 2000, Vol. 46A, pp. 1627-1635.
[9] Tong, L.W., Sun, C.Q., Chen, Y.Y., Zhao, X.L., Shen, B. and Liu, C.B., “Experimental Comparison in Hot Spot Stress between CFCHS and CHS K-joints with Gap”, Proceedings of 12th International Symposium on Tubular Structures, Shanghai, China, 2008, pp. 389-395.
[10] Mashiri, F.R. and Zhao, X.L., “Square Hollow Section T-joints with Concrete-filled Chords subjected to in-plane Fatigue Loading in the Brace”, Thin-Walled Structures, 2010, Vol.48, No. 2, pp. 150-158.
[11] Zhao, X.L. and Tong, L.W., “New Development in Steel Tubular Joints”, Advances in Structural Engineering, 2011, Vol. 14, No. 4, pp. 699-715.
[12] Wang, K., Tong, L.W., Zhu, J., Shi, W.Z., Mashiri, F.R. and Zhao, X.L., “Fatigue Behaviour of Welded T-joints between CHS Brace and CFCHS Chord under Axial Loading in the Brace”, Journal of Bridge Engineering, 2013, Vol. 18, No. 2, pp. 142-152.
[13] Hobbacher, A., “Stress Intensity Factors of Welded Joints”, Engineering Fracture Mechanics, 1993, Vol. 46, No. 2, pp. 173-182.
[14] Bowness, D. and Lee, M.M.K., “The Development of an Accurate Model for the Fatigue Assessment of Doubly Curved Cracks in Tubular Joints”, International Journal of Fracture, 1995, Vol. 73, No. 2, pp. 129-147.
[15] American Welding Society (AWS), “Structure Welding Code-steel, 17th Ed.”, Miami, 2000, pp. 10-16.
[16] Health and Safety Executive (HSE), “Background to New Fatigue Guidance for Steel Joints and Connections in Offshore Structures”, O/S Technical Report OTH 92 390, 1999, pp. 105-110.
[17] ANSYS, Release 14.0, Help System, “Coupled Field Analysis Guide”, ANSYS, Inc., 2011. [18] Barsoum, R.S., “Triangular Quarter-point Elements as Elastic and Perfectly-plastic Crack Tip
Elements”, Int. J. Num. Meth. Eng., 1977, Vol. 11, No. 1, pp. 85-98.

497 Numerical Analysis of Fatigue Behavior of Welded CFCHS T-Joints
[19] Chiew, S.P., Lie, S.T., Lee, C.K., and Huang, Z.W., “Stress Intensity Factors for a Surface Crack in a Tubular T-joint”, International Journal of Pressure Vessels and Piping, 2001, Vol. 78, No. 10, pp. 677-685.
[20] Bowness, D., Lee, M.M.K., “A Finite Element Study of Stress Fields and Stress Intensity Factors in Tubular Joints”, Journal of Strain Analysis, 1995, Vol. 30, No. 2, pp. 135-142.
[21] Newman, J.C. and Raju, I.S., “An Empirical Stress Intensity Factor Equation for the Surface Crack”, Engineering Fracture Mechanics, 1981, Vol. 15, No. 1-2, pp. 185-192.
[22] British Standards Institution BS7910, “Guide on Methods for Assessing the Acceptability of Flaws in Metallic Structures”, London, UK, 2005, pp.168-185.
[23] Paris, P.C., Edorgan, F., “Critical Analysis of Crack Propagation Laws”, ASME Journal of Basic Engineering, 1963, Vol. 85, No. 4, pp. 528-534.
[24] British Standards Institution PD6493, “Guidance on Methods for Assessing the Acceptability of Flaws in Fusion Welded Structures”, London, UK, 1991, pp. 35-45.
[25] Schumacher, A. and Nussbaumer, A., “Experimental Study on the Fatigue Behavior of Welded Tubular K-joints for Bridges”, Engineering Structures, 2006, Vol. 28, pp. 745-755.
[26] Borges, L. and Nussbaumer, A., “Advanced Numerical Modeling of Fatigue Size Effects in Welded CHS K-joints”, Proceedings of 12th International Symposium on Tubular Structures, China, 2008, pp. 135-144.
[27] Nussbaumer, A. and Haldimann-Sturm, S.C., “Fatigue of Bridge Joints using Welded Tubes or Cast Steel Node Solutions”, Proceedings of the 11th International Symposium on Tubular Structures, London, 2006, pp. 61-68.