
Number The Strategic & Governance Challenges of Enterprise Risk Management Thomas C. Wilson Managing...
19
Number The Strategic & Governance Challenges of Enterprise Risk Management Thomas C. Wilson Managing Director, Head of Finance & Risk Practice Mercer Oliver Wyman Chicago, April 27 th , 2004
-
date post
18-Dec-2015 -
Category
Documents
-
view
215 -
download
0
Transcript of Number The Strategic & Governance Challenges of Enterprise Risk Management Thomas C. Wilson Managing...

Number
The Strategic & Governance Challenges of Enterprise Risk Management
Thomas C. WilsonManaging Director, Head of Finance & Risk Practice Mercer Oliver Wyman
Chicago, April 27th, 2004

Copyright © 2004 Mercer Oliver Wyman 2
Number
Enterprise Risk Management – Objectives & Complexity
Institution
U/WInvestment Etc.
SecuritiesDerivatives
CreditFinancialOperational
P&C, Specialty Life & Health
Mortality & LongevityProperty & CasualtyClaims DevelopmentFrequency & Severity, ParameterOperational
Across All RisksAt All Levels
• Economic capital, Risk Adjusted Return on Capital, EVA• Comprehensive, Comparable & in financial terms• Supporting cross-risk decisions, e.g.
- Risk appetite & strategy, - Solvency & capital management- Economic performance measurement- Asset/Liability Management- Reinsurance optimization
• Consistent with corporate governance

Copyright © 2004 Mercer Oliver Wyman 3
Number
Risk & Risk Capital Measurement Becoming the Norm
No Overall Programme
Planned
Programme in Development
ProgrammePiloted
Mature Internal Programme
Comprehensive Internal Programme (+ external reporting)
Level of Sophistication
ECAP Survey 2000: Classification of participating institutions
2003 “norm”
2 1 5 3 3
2000 ‘norm’
0 2 5 8 4
ECAP Survey 2003
14 participants
19participants
Source: Economic Capital Survey 2003, Mercer Oliver Wyman

Copyright © 2004 Mercer Oliver Wyman 4
Number
Risk Capital Potentially at Centre of Business Impact
Risk and Economic
Capital Measurement
2. Performance Measurement &
Management
1. Business Portfolio
Management
3. ALM and
Investment
Strategy
4. Pricing
5. Reinsurance Optimisation
6. Limit Setting
• Common measurement standard leading to common language
• Common risk ‘currency’, interpretation as capital

Copyright © 2004 Mercer Oliver Wyman 5
Number
Facilitating Business Unit Performance Evaluation on a ‘Apples-to-apples’ Basis
RAROC Versus Economic CapitalRAROC
Economic Capital
AB
C
D
E
F
G
H
Hurdle Rate
Grow/invest more aggressively in these businesses
Restructure/sell/downsizethese businesses

Copyright © 2004 Mercer Oliver Wyman 6
Number
Rating downgrade
P/E re-rating Increased
cost of capital
Possible Consequences
Disconnect
0
2
4
6
8
10
12
14
mid2002
end2005
end2005
mid2002
BU 2
BU 1
20% Asset Growth
Current
Solvency IIRequirements
RatingAgencies
StrategicBuffer
Current
ShareBuyback
DividendsPaid Out
RetainedEarnings
Cap
ital
US
$ B
N
CyclicalityPremium
Required Capital Available Capital
Capital Planning Implications

Copyright © 2004 Mercer Oliver Wyman 7
Number
Five Components of a Group Risk Framework
5. IT Infrastructure
Data architecture: risk, performance, etc. Application architecture Technical architecture
1. Strategic Objectives
Communication& Confidence
Risk Underwriting
Risk Controlling
Risk Strategy
Line, staff and committee structures Policies & procedures Roles & responsibilities Limits & authorities
2. Structure & Organization
Committees
4. Methods, Information & Reports
Methods for risk, capital and economic performance Standardized reports for control & decision making Underlying reporting processes
3. Management Processes
Corporate Calendar Jan Apr Jul Oct Ad Hoc
Risk target setting X
EVA & Ecap plans X
Limit setting and capital allocations X
Balance sheet capital, funding & liquidity plans X X X X X X X X X X X X
Accounting parameters X
Reserving standards, parameter selection X
New products and lines of business X X X X X
Underwriting guidelines X X X X
Large transactions X X X X X X X X X X X X X
TAA X X X X
Internal/external audit recommendations X X

Copyright © 2004 Mercer Oliver Wyman 8
Number
Formulating Risk Strategy and Objectives: Key Questions
Communication &Confidence
Risk Underwriting
Risk Controlling
Risk Strategy
• Disclosure, risk and risk management?• Guidance and potential scenario impact
• Insurance company’s risk appetite and solvency? • What products/markets create economic value? • Allocation of finite capital and risk limits?
• Risk profile and exposures understood ? • Risk profile within delegated limits? • Authorities delegated?
• Risks structured, underwritten and priced? • All other risks identified, analysed and mitigated?• Pervasive ‘risk culture’? • Incentives aligned?• Policies, guidelines, control mechanisms?
Copyright © 2004 Mercer Oliver Wyman 9
Number
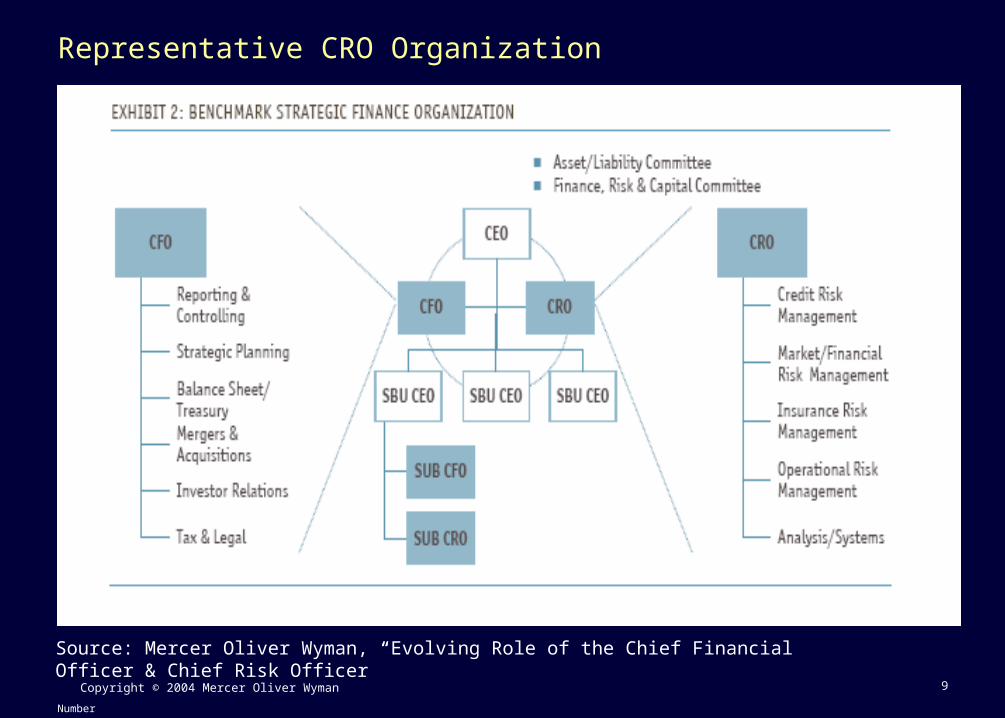
Representative CRO Organization
Source: Mercer Oliver Wyman, “Evolving Role of the Chief Financial Officer & Chief Risk Officer”

Copyright © 2004 Mercer Oliver Wyman 10
Number
Reporting Lines
Source: Mercer Oliver Wyman, “Evolving Role of the Chief Financial Officer & Chief Risk Officer”
BY SECTOR
REPORTING LINES OVERALL BANKING INSURANCE
CEO/CHAIRMAN 40% 55% 22%
VICE CHAIRMAN 15% 27% 0%
CFO 35% 18% 56%
OTHER 15% 0% 33%
~66% have CRO ~25% to create CRO within next 18 months ~60%+ of CROs have enterprise mandate

Copyright © 2004 Mercer Oliver Wyman 11
Number
Roles & Responsibilities
WHAT RISK MANAGEMENT FUNCTIONS ARE YOU RESPONSIBLE FOR?
0% 20% 40% 60% 80% 100%
Activity
Percentage
Limit Monitoring
Limit Setting
Risk Reporting
Portfolio Measurement
Transaction Measurement and
Underwriting
Economic Capital
Policies and Procedures
MITIGATION
STRATEGIC
EXPOSURE & LIMITCONTROLLING
TRANSACTIONLEVEL

Copyright © 2004 Mercer Oliver Wyman 12
Number
Illustrative Organisational Structure: Issues
BU CIO
BU CRO
BU CFO Local Committees Finance/ALCO Committee Risk & Capital Committee Etc
CEO
Board
Group Committees Finance/ALCO Committee Risk & Capital Committee Underwriting Committee Reserving Committee Etc.
Group Risk Group Finance
Group Investments
BU CEO BU CEO
Insurance
A/LM
Credit
Operational
Reporting
BU CIO
BU CRO
BU CFO
Reporting LinesNetworks
Risk Finance Actuarial

Copyright © 2004 Mercer Oliver Wyman 13
Number
Group Risk Committee
Chief Risk Officer, Chair CFO, CIO, CUO Business representation Group Risk Management,
Process Owner
Composition & Staffing
Roles & Responsibility
Ensure risk management capabilities, controls and culture throughout the organisation
Monitor Group and BU exposure, risk and solvency against delegated authorities
Ensure alignment of corporate business and risk strategy
Define & execute external communication guidelines
Authorities
Approval of
– Risk Management Minimum Standards
– Underwriting authorities, policies and guidelines
– Limit structures Risk measurement methodologies Risk mitigation, e.g. reinsurance, asset
sales, etc.
- DISGUISED CLIENT EXAMPLE -
Performance Metrics Loss realization, e.g. combined ratio,
asset writedowns, credit defaults Loss ‘surprises’ Loss performance relative to peers 360 degree feedback Expense management

Copyright © 2004 Mercer Oliver Wyman 14
Number
Management Processes: Designing Corporate Calendar
: Standing Agenda
Decisions Jan Apr Jul Oct Ad hoc
Capital & Risk Committee – Risk Strategy & Control
Review/approve EVA & Ecap plans X
Review/approve Ecap/risk resource allocations (e.g. NatCat) X
Review/approve internal/external retrocession strategies X
Review current risk profile against strategy and limits X X X X
Finance Committee – Risk & Financial Solvency
Review/approve balance sheet capital, funding & liquidity plans X X
Review/approve internal/external retrocession implementation X X
Review/approve accounting 'judgement' parameters X
Review/approve reserving standards, parameter selection X
A/L Committees – Focus on SAA/TAA
Review/approve strategic asset allocation X X X
Review/approve tactical asset allocation X X X X
Product Management Committee
Review/approve new products and lines of business X X X X X
Review/approve underwriting guidelines X X X X
Underwriting Committee
Approve large transactions above LE authorities X X X X X
Audit Committee
Review internal & external audit & op risk recommendations X X
– Illustration –

Copyright © 2004 Mercer Oliver Wyman 15
Number
Integration into Strategic Planning Process
Long-term Group strategiesEVA/ROE targets (TDIs) for next year
at Group and BUs
BU three-year plan based on TDIs
S-chart for Group and BUs(incl. medium-term BU EVA
targets)
P-chart for Group and BUs (approved budget for next
year)
Jan. Feb. March April May June July Aug. Sept. Oct. Nov. Dec.
BU Planning
Board
GFC
BUs
BUTarget Setting
Top-down Targets
Strategic Survey
GroupStrategic
Plan
KeyPlanningFigures
Aggre-gation
Communi-cation of
TDIs
Source: GFC; Mercer Oliver Wyman Analysis
Disagg-regation of targets
BU dialogue
Aggregation Gap analysis
target vs. plan
Revenue EVA RoE Grow/
stable/shrink capital
Revenues per LoB/ product line P&L Balance sheet Funding Capital needs
Strategic self -assess-ment of business models
Market share
Revenues Costs
EVA ROI IAS net
income
1. Strategic Analysis 2. Strategic Dialogue
Group Strategy
Prepare offsite
Deter-mine top-down indicators (TDIs)
– Current Management Dialogue –
3. Planning Dialogue
- DISGUISED CLIENT EXAMPLE -

Copyright © 2004 Mercer Oliver Wyman 16
Number
Measurement Challenges for Integrating Into Strategic Decision Making Processes
Source: CFO/CRO Survey 2002
Which three measures are most used by your institution for
strategic planning and decision making*
1. Earnings and earnings growth
2. Revenue and revenue growth
3. Cost or cost/income ratios
4. Return on book capital
5. Return on risk capital
6. Market share
7. Other
8. Market valueEmbedded valueShareholder value
How satisfied are you with the following aspects of your current
performance measurement framework?
Accurately reflects shareholder
perspectives
90%
83%
67%
58%
27%
58%
Accepted with organization
Level of detail
Transparency with respect to value drivers
Accurate reflection of business economics
Link between internal metrics (e.g. RAROC, ECAP) and
shareholder value
What are the most important pieces of financial information
that you communicate externally?
Revenue and growth
83%
58%
58%
58%
42%
42%
33%
33%
17%
Earnings guidance
Return on equity
Cost/income ratio
Exposure/risk information
Earnings and growth
Return on risk capital
Capital ratio
Line of business information

Copyright © 2004 Mercer Oliver Wyman 17
Number
Measurement Challenges (continued)
Source: CFO/CRO Survey 2002
What prevents economic capital from being as important as it could?
Complexity 82%
82%
45%
45%
36%
36%
36%
27%
27%
ECAP is not a constraint
Management acceptance
Not understood internally/ externally
Reconciliation with financials
Accuracy
Instability
Not as important as earnings or growth
Reconciliation with shareholder valuation
Which areas of performance measurement could be most
improved?
Revenue recognition
75%
42%
42%
25%
17%
Cost recognition
Credit loss estimates
Capital measurement
Cost of capital
Copyright © 2004 Mercer Oliver Wyman 18
Number
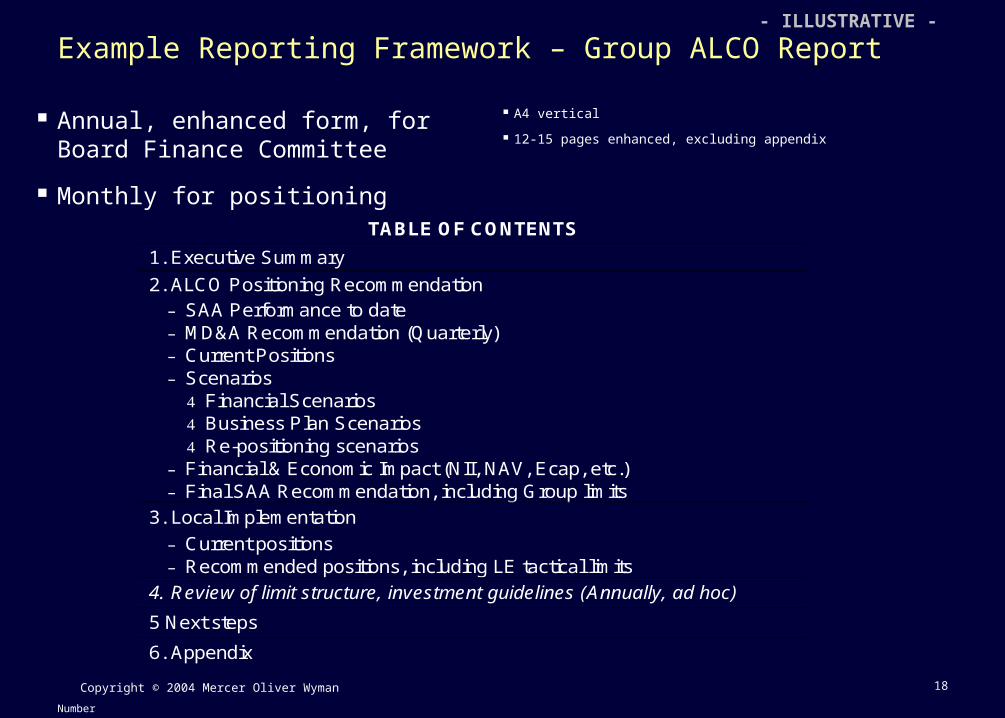
Example Reporting Framework – Group ALCO Report
A4 vertical
12-15 pages enhanced, excluding appendix
Annual, enhanced form, for Board Finance Committee
Monthly for positioningTABLE OF CONTENTS
1. Executive Summary
2. ALCO Positioning Recommendation – SAA Performance to date – MD&A Recommendation (Quarterly) – Current Positions – Scenarios
Financial Scenarios Business Plan Scenarios Re-positioning scenarios
– Financial & Economic Impact (NII, NAV, Ecap, etc.) – Final SAA Recommendation, including Group limits
3. Local Implementation
– Current positions – Recommended positions, including LE tactical limits
4. Review of limit structure, investment guidelines (Annually, ad hoc)
5 Next steps
6. Appendix
- ILLUSTRATIVE -

Copyright © 2004 Mercer Oliver Wyman 19
Number
Example Risk Reporting Templates – Group Risk Dashboard
I. Group Overview- Risk & exposures- Scenario analysis
II. Exposure, risk & limits– Credit Risk– Market/ALM Risk– Insurance Risk– Operational Risk– Liquidity Risk
III. Watchlist
IV. Recommendations
IV. Appendix
Contents Screen Shots
Liquidity Exposure under "Panic" & "Nightmare" ScenariosEntity: GroupAs of: Q4, 2002Currency: €MM
Group Liquidity – Panic Scenario
Group Liquidity – Nightmare Scenario & Impaired Capital Markets
10,989
25,024
52,246
80,077
130,289
161,294
177,570
0
20,000
40,000
60,000
80,000
100,000
120,000
140,000
160,000
180,000
200,000
Current 1mo 3mo 6mo 1yr 2yr 3yr
Euro MM
0.0
1.0
2.0
3.0
4.0
5.0
6.0Excess 2003 Q1
Excess 2003 Q2Ratio 2003 Q2
5,76013,925
33,260
60,300
110,505
149,835
166,000
0
20,000
40,000
60,000
80,000
100,000
120,000
140,000
160,000
180,000
200,000
Current 1mo 3mo 6mo 1yr 2yr 3yr
Euro MM
0.0
1.0
2.0
3.0
4.0
5.0
6.0Excess 2003 Q1Excess 2003 Q2Ratio 2003 Q2
Recent Performance: Event Losses & Cases OutstandingEntity: OEsAs of: Q4, 2002Currency: €MM
Recent Operational Failures OE Size of Loss Date Comment
E.g. US IT System failure A 30-50 Oct-02 Cause investigated & solvedE.g. D Internal fraud B 8 2002 Fictitious benefit paymentsE.g. Delays to F policy processing
C 5-10 2002 Problems will be resolved by Q2 2003
E.g. UK product withdrawn C 3 May-02Poor sales documentation – has now been corrected
… … … … …
Major Legal/Compliance Cases Outstanding OE
Magniture of Remaining Exposure
(€MM) Likelihood Comment
E.g. US Discrimination Class Action
A 1,000 L Case pending
E.g. UK Asset Mismanagement Case
B 400 L Risk of further pay-outs
E.g. I Misleading Marketing Case etc.
C 50 M/H Awaiting regulator's decision
… … … … …
Market Risk – Current ExposuresEntity: GroupAs of: Q4, 2002Currency: €BN
A B C D E F G H I J K L M N O P Other
Equity Total
Traded Shares
Equity FundsPrivate Equity
Real Estate TotalPrivate
Commercial
Funds
Fixed Income Total
SovereignCommercial BondsCDO/CBOs/ABSHigh Yield
LoansMortgagesOtherTotal
Assets at Market Value in €MM
Credit Risk Contribution by OEEntity: All Red lightAs of: Q4, 2002 Yellow lightCurrency: €BN
OE EL EL LimitUL
(C-VaR) UL Limit
ABCDEF
Group
HIJKLMNOtherPOtherGroupComments:
Risk Contribution


![captiveinsurancetimes · order to expand the capabilities of Guy Carpenter’s [MSA] initiative,” said David Lightfoot, head of GC Analytics ... Mercer and Oliver Wyman—to deliver](https://static.fdocuments.in/doc/165x107/60133679d5b6c77fc679e058/capt-order-to-expand-the-capabilities-of-guy-carpenteras-msa-initiativea.jpg)
