Nugget effect, artificial or natural? J r n a - SciELO · Function variograma 1.80 1.60 1.40 1.20...
7
J o u r n a l P a p e r Introduction In practice is very important to estimate the origin of the behaviour at the origin of the variogram function. The understanding of the nature of the nugget effect can provide important information on the phenomenon under study. It also has profound implications in ore resource estimation strategies, in the selection of a mining method, and in the process control strategies. Causes of the nugget effect The causes of the nugget can be: ➤ A microstructure or ‘process noise’, namely a component of the phenomenon with a range shorter than the sample support (true nugget effect). 1,2,3,8 ➤ A structure with a range shorter than the sampling interval ➤ Measurement errors. Sampling and/or assaying errors can create an artificial nugget effect or the so called ‘human nugget effect’. 2 . The components of the variogram function if sampling and/or assaying errors exist are (see Appendix 1): [1] Z = True value Z* = Estimated value e = Random error γ = Semivariogram h = Distance or time γ z*,e = Cross variogram between Z* and e ➤ If the errors have no temporal or spatial correlation ➤ If the grade and the errors are not temporally or spatially correlated. [2] [3] Therefore the sampling and/or the assaying error variance add to the true variogram function as a constant. Observation scale The observation scale—sampling density and sample support—are very important in understanding the nature and magnitude of the nugget effect. As an example consider Figure 1. When the sample support is smaller than the range of the phenomenon under study, in this case the average size of the red spots, and the sampling pattern is dense enough to intersect the nuggets, the variogram function is spherical with zero nugget effect. In contrast,, if the range is shorter than the sample support and the sampling pattern is dense, the variogram function would be flat. According to the central limit theorem there are a very strong relation between the magnitude of the nugget effect and the sample support (see Appendix 2) 1,2,3,8 [4] V,v = Sample supports C 0v = Nugget effect at sample support v C 0V = Nugget effect at sample support V Nugget effect, artificial or natural? by P.C. Carrasco* Synopsis Knowing the origin of the relevant and irrelevant components of the nugget effect is essential to optimize the process under study. This paper describes the causes of the nugget effect and, its dependency on the sample support, sampling density, and on the QA/QC procedures. Several examples of natural and ‘human’ nugget effect are given. A method to estimate the magnitude of the relevant and irrelevant components is suggested. Finally, the economic consequences of misunderstanding the nugget effect are analysed. * Technical Group, Codelco,Chile. © The Southern African Institute of Mining and Metallurgy, 2010. SA ISSN 0038–223X/3.00 + 0.00. This paper was first published at the SAIMM Conference, Fourth World Conference on Sampling & Blending, 21–23 October 2009. 299 The Journal of The Southern African Institute of Mining and Metallurgy VOLUME 110 JUNE 2010 ▲
-
Upload
nguyenthuy -
Category
Documents
-
view
212 -
download
0
Transcript of Nugget effect, artificial or natural? J r n a - SciELO · Function variograma 1.80 1.60 1.40 1.20...

Journal
Paper
Introduction
In practice is very important to estimate theorigin of the behaviour at the origin of thevariogram function. The understanding of thenature of the nugget effect can provideimportant information on the phenomenonunder study. It also has profound implicationsin ore resource estimation strategies, in theselection of a mining method, and in theprocess control strategies.
Causes of the nugget effect
The causes of the nugget can be:
➤ A microstructure or ‘process noise’,namely a component of the phenomenonwith a range shorter than the samplesupport (true nugget effect).1,2,3,8
➤ A structure with a range shorter than thesampling interval
➤ Measurement errors. Sampling and/orassaying errors can create an artificialnugget effect or the so called ‘humannugget effect’.2.
The components of the variogram functionif sampling and/or assaying errors exist are(see Appendix 1):
[1]
Z = True valueZ* = Estimated valuee = Random errorγ = Semivariogram
h = Distance or timeγz*,e = Cross variogram between Z* and e
➤ If the errors have no temporal or spatialcorrelation
➤ If the grade and the errors are nottemporally or spatially correlated.
[2]
[3]
Therefore the sampling and/or theassaying error variance add to the truevariogram function as a constant.
Observation scale
The observation scale—sampling density andsample support—are very important inunderstanding the nature and magnitude ofthe nugget effect.
As an example consider Figure 1.When the sample support is smaller than
the range of the phenomenon under study, inthis case the average size of the red spots, andthe sampling pattern is dense enough tointersect the nuggets, the variogram functionis spherical with zero nugget effect. Incontrast,, if the range is shorter than thesample support and the sampling pattern isdense, the variogram function would be flat.
According to the central limit theoremthere are a very strong relation between themagnitude of the nugget effect and the samplesupport (see Appendix 2)1,2,3,8
[4]
V,v = Sample supportsC0v = Nugget effect at sample support vC0V = Nugget effect at sample support V
Nugget effect, artificial or natural?by P.C. Carrasco*
SynopsisKnowing the origin of the relevant and irrelevant components of thenugget effect is essential to optimize the process under study. Thispaper describes the causes of the nugget effect and, its dependencyon the sample support, sampling density, and on the QA/QCprocedures. Several examples of natural and ‘human’ nugget effectare given. A method to estimate the magnitude of the relevant andirrelevant components is suggested. Finally, the economicconsequences of misunderstanding the nugget effect are analysed.
* Technical Group, Codelco,Chile.© The Southern African Institute of Mining and
Metallurgy, 2010. SA ISSN 0038–223X/3.00 +0.00. This paper was first published at the SAIMMConference, Fourth World Conference on Sampling& Blending, 21–23 October 2009.
299The Journal of The Southern African Institute of Mining and Metallurgy VOLUME 110 JUNE 2010 ▲

Nugget effect, artificial or natural?
Equation [4] is very important when sampling oredeposits by different types of drilling techniques.
As shown by Figure 2 the support differences betweensmall diameter diamond drill holes and reverse circulation orblast holes can be huge.
Sometimes small diameter diamond drill holes are uselessin the assessment of natural variability. Table I shows anexperiment done in an Australian gold deposit.
After studying the AQ/QC procedures for sampling,sample preparation, and assaying, the conclusions were:
➤ Total sampling and sample preparation errors are low➤ Assaying error is low.
Then, Table I suggests
➤ When kriging the same ore zone, blast holes’ goldmean grade and variance are bigger than gold meangrade and variance given by the f diamond drill holesamples. The variance difference is a contradictionbecause the sample support of the blast holes samplesis much bigger than the support of the diamond drillsamples.
➤ The sampling grid of the blast holes is very densecompared with the diamond drill sampling grid. Apossible explanation could be the so-called informationeffect1,2,3,8. In order to test the hypothesis, a nearneighbour comparison between the diamond drill andthe blast holes was done to equalize the samplingdensity.
➤ The contradiction stays intact. Actually the variancedifference is higher than before, and therefore theinformation effect (see Appendix 3) is not the cause ofthe difference. The difference in gold mean grade staysas well. Maybe a more realistic hypothesis is theincapacity of the diamond drill samples to detect short-range variability gold structures (nuggets) due to theirsmall support.
➤ From the theoretical viewpoint the hypothesis ispossible. The spatial distribution of gold particles ofdifferent size was simulated according to a Poissonprocess. Figure 3 shows the probability of intersectingno gold particles as a function of the sample support.
The simulation suggests:
➤ As the sample support increases, the probability ofselecting gold nuggets increases.
➤ As the size of the nuggets increases and the number ofnuggets decreases, the probability of missing the goldnuggets increases in a significant way. In this casesmall sample supports do not have a chance torepresent the natural variability properly.
➤ In this case even the selection of more abundant smallparticles is difficult when the sample support is small.
▲
300 JUNE 2010 VOLUME 110 The Journal of The Southern African Institute of Mining and Metallurgy
Figure 1—Short-range nugget effect. Stationary gaussian randomfunction
Figure 2—Drill diameter vs. sample support
Table I
Sample support and assessment of gold variability
Method and support Mean (g/t) Variance (g/t)2
Kriging BH 1.27 0.77Kriging DDH 0.94 0.41Near neighbour (<2 m) BH 1.37 15.5Near neighbour (<2 m) DDH 1.04 3.5
Figure 3—Probability of selecting zero gold particles vs. sample support
Sample support
Pro
babi
lity
Drill diametre (cm)
Rat
io (
drill
vol
ume/
pt v
olum
e)

Some examples of natural nugget effect A fundamental step in the understanding of the nature of thenugget effect is a good knowledge of the phenomenon understudy. Figure 4 shows a pure natural nugget effect.
In this case QA/QC for sampling, sample preparation, andassaying were excellent, therefore the contribution ofsampling plus assaying errors to the nugget effect is notimportant. The explanation for the natural component of thenugget effect is that the gold rhodochrosite veins have beenunder high stress. As a consequence they have been brokeninto small pieces all over the space, losing the original spatialcorrelation.
Figure 5 shows a natural nugget effect for themolybdenum grade in a Chilean porphyry deposit.
In this case the origin of the nugget effect is the existenceof a set of very high molybdenum blue veins. In between theveins the molybdenum grade is low.
Some examples of ‘human’ nugget effect When the sampling procedures are divorced from theTOS4,5,6,7 and the analytical practices are away from theprinciples of analytical chemistry, irrelevant variability isadded to the process under study. (See Appendix 1.) Figure 6shows the variograms for two sectors of El Hueso gold minein Chile.
In this case there are three facts which allowunderstanding of the origin of the pure nugget effect:
➤ Coarse gold particles are very scarce in the deposit. Thegold is disseminated as in Carlin-type ore deposits;therefore the constitution heterogeneity is low.
➤ The sampling protocol for the blast holes was very bad.The sample was selected by hand, taking one single250 gram increment at a top size of 1.3 cm. Thisincorrect sampling procedure generated fundamental,delimitation, and extraction errors of great magnitude.
➤ The diamond drill variograms did not show such a bignugget component.
Figure 7 shows the variogram for the silica grade of theslag of a Chilean smelter.
Because the sampling of the hot slag is difficult, it islogical to assign the origin of the pure nugget effect to theincorrect sampling procedures. Small sample, non-constantsupport, and the presence of some copper nuggets can play arole as well.
A suggested method to estimate the humancomponent of the nugget effect
The main steps of the method are:
➤ Duplicate the sampling and assaying procedures.Duplicates must represent the spatial/temporalvariability of the phenomenon under study. When onstudies nature, the geological controls must be fully
Nugget effect, artificial or natural?Journal
Paper
301The Journal of The Southern African Institute of Mining and Metallurgy VOLUME 110 JUNE 2010 ▲
Figure 4—Relative gold variograms. Natural nugget effect. Shatteredgold veins. Papua New Guinea
Figure 5—High grade Mo veins. Chuquicamata Mine
Figure 6—‘Human’ nugget effect at El Hueso Gold Mine. Blast holesamples
Figure7—SiO2 Variogram. Hot smelter slag sampling procedures
0 10 20 30 40 50 60 70 80Distancia MTS
Fu
nct
ion
var
iog
ram
a
1.80
1.60
1.40
1.20
1.00
0.80
0.60
0.40
0.20
0.00
Maricunga Sector
Pajonales Sector
0 10 20 30 40 50h (metres)
0
5
10
15

Nugget effect, artificial or natural?
respected. When on studies metallurgical processes’ thenature of the feed and the special characteristics of theprocess must be taken into account.
➤ Record the spatial and/or temporal location of theduplicates.
➤ Estimate the variogram of the original value.➤ Estimate the variogram of the differences.➤ Estimate the cross variogram between the differences
and the original values.➤ Test the hypothesis of spatial/temporal independence of
the differences and the independence between thedifferences and the original values.
➤ Estimate the contribution of sampling and assayingerrors to the nugget component by the ratio of the sillof the differences variogram to the sill of the originalvalues variogram.
Figure 8 shows an example based on blast hole samplesat the Andina Chilean porphyry mine.
Figure 8 suggests:
➤ The differences between the original grade and theduplicate grade are spatially independent.
➤ The copper grade is spatially independent of theduplicate grade.
➤ The ‘human’ component of the nugget effect is small. Itis 22% of the total nugget effect and just 6% of thetotal variability. Then the geological nature of thedeposit accounts for most of the nugget component.
➤ As a conclusion, the sampling, sample preparation,sampling for analytical purposes, and chemical analysisare very precise.
Sometimes the results are not so encouraging, particularlywhen sampling trace elements in cathodes. Table II showssome examples.
Economic consequences of the misunderstanding ofthe nugget effect origin
From the estimation viewpoint it is essential to understandthe nature of the nugget effect. This will enable a correctdecision making process, otherwise the decisions could bevery misleading and unfortunate.
Figure 9 shows the evolution of the kriging weights as afunction of the nugget effect magnitude.
Figure 9 suggests:
➤ As the nugget effect increases, all the samples assumethe same importance, and the arithmetic mean is theoptimal estimator.
➤ Under these circumstances, selective mining is anexercise in futility. All the blocks belonging to the samehigh nugget stationary geological unit will have a gradevery similar to the mean.
➤ From the economic viewpoint, the only intelligentaction will be to clearly define the boundaries of the
▲
302 JUNE 2010 VOLUME 110 The Journal of The Southern African Institute of Mining and Metallurgy
Figure 8—Direct and cross-variograms of cut and duplicates differences
Table II
Proportion of ‘human’ nugget effect
Description ‘Human’ nugget Observations
S cathodes 60 Incorrect test portion
O cathodes 100 Incorrect test portion
Cl cathodes 58 Incorrect test portion
Pb cathodes 40 Incorrect test portion
Ag cathodes 20 Incorrect test portion
Cut DDH 40 Incorrect half core selectionIncorrect chemical analysis practices
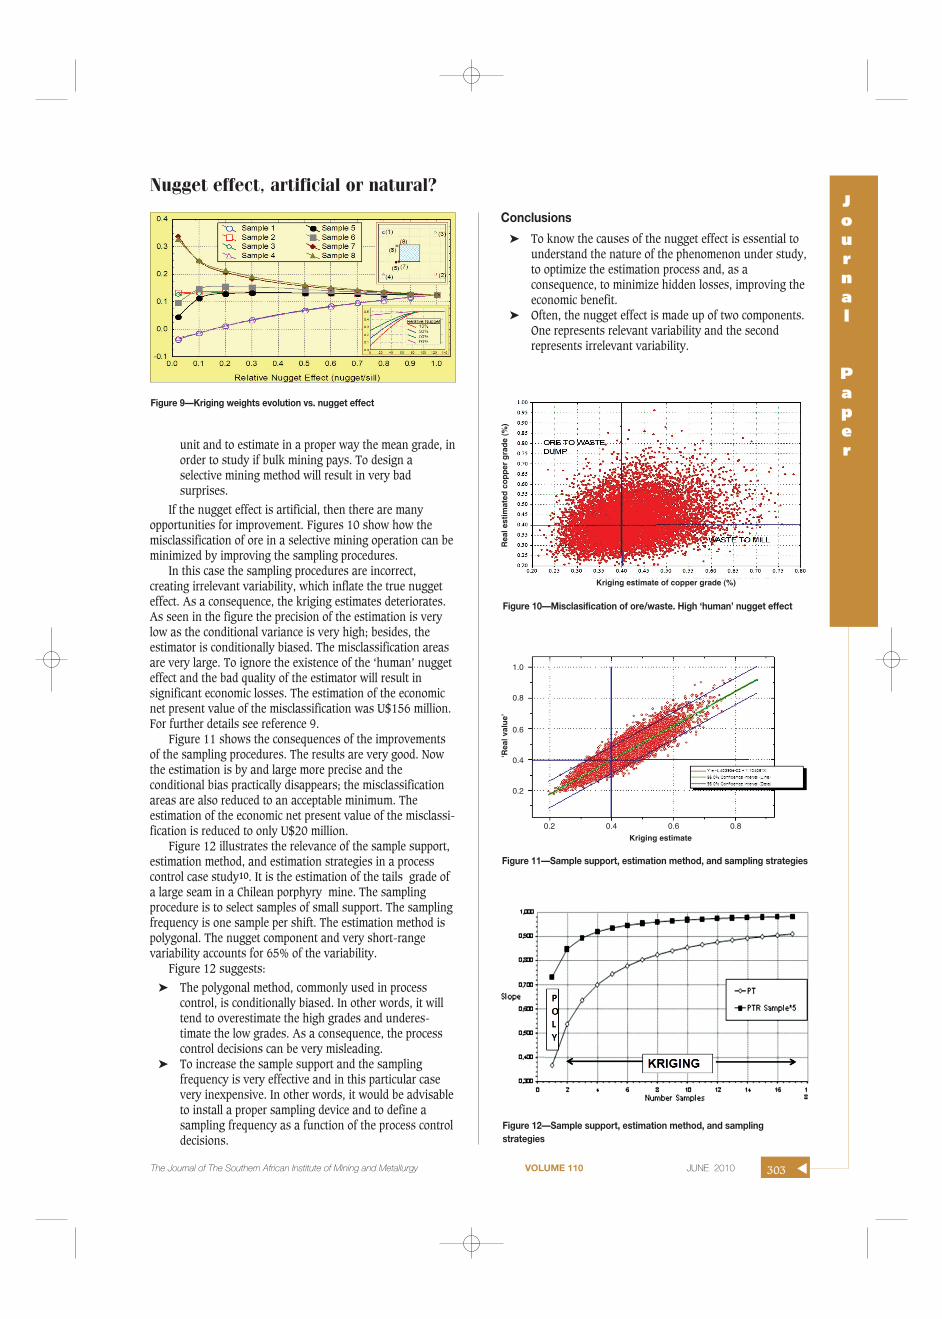
unit and to estimate in a proper way the mean grade, inorder to study if bulk mining pays. To design aselective mining method will result in very badsurprises.
If the nugget effect is artificial, then there are manyopportunities for improvement. Figures 10 show how themisclassification of ore in a selective mining operation can beminimized by improving the sampling procedures.
In this case the sampling procedures are incorrect,creating irrelevant variability, which inflate the true nuggeteffect. As a consequence, the kriging estimates deteriorates.As seen in the figure the precision of the estimation is verylow as the conditional variance is very high; besides, theestimator is conditionally biased. The misclassification areasare very large. To ignore the existence of the ‘human’ nuggeteffect and the bad quality of the estimator will result insignificant economic losses. The estimation of the economicnet present value of the misclassification was U$156 million.For further details see reference 9.
Figure 11 shows the consequences of the improvementsof the sampling procedures. The results are very good. Nowthe estimation is by and large more precise and theconditional bias practically disappears; the misclassificationareas are also reduced to an acceptable minimum. Theestimation of the economic net present value of the misclassi-fication is reduced to only U$20 million.
Figure 12 illustrates the relevance of the sample support,estimation method, and estimation strategies in a processcontrol case study10. It is the estimation of the tails grade ofa large seam in a Chilean porphyry mine. The samplingprocedure is to select samples of small support. The samplingfrequency is one sample per shift. The estimation method ispolygonal. The nugget component and very short-rangevariability accounts for 65% of the variability.
Figure 12 suggests:
➤ The polygonal method, commonly used in processcontrol, is conditionally biased. In other words, it willtend to overestimate the high grades and underes-timate the low grades. As a consequence, the processcontrol decisions can be very misleading.
➤ To increase the sample support and the samplingfrequency is very effective and in this particular casevery inexpensive. In other words, it would be advisableto install a proper sampling device and to define asampling frequency as a function of the process controldecisions.
Conclusions
➤ To know the causes of the nugget effect is essential tounderstand the nature of the phenomenon under study,to optimize the estimation process and, as aconsequence, to minimize hidden losses, improving theeconomic benefit.
➤ Often, the nugget effect is made up of two components.One represents relevant variability and the secondrepresents irrelevant variability.
Nugget effect, artificial or natural?Journal
Paper
The Journal of The Southern African Institute of Mining and Metallurgy VOLUME 110 JUNE 2010 303 ▲
Figure 9—Kriging weights evolution vs. nugget effect
Figure 11—Sample support, estimation method, and sampling strategies
Figure 12—Sample support, estimation method, and samplingstrategies
0.2 0.4 0.6 0.8
Kriging estimate
‘Rea
l val
ue’
1.0
0.8
0.6
0.4
0.2
Figure 10—Misclasification of ore/waste. High ‘human’ nugget effect
Kriging estimate of copper grade (%)
Rea
l est
imat
ed c
op
per
gra
de
(%)

Nugget effect, artificial or natural?
➤ A relevant nugget effect represents short-rangestructures which actually belong to the process understudy. They irrelevant nugget effect does not belong tothe process; it is induced by incorrect sampling, samplepreparation, and chemical analysis.
➤ To optimize the process under study it is essential toknow the nature of the phenomenon, the AQ/QCprocedures for sampling, sample preparation andchemical analysis, and an estimation of the magnitudeof the relevant and irrelevant components.
➤ The estimation of both components is possible if theerrors are spatially independent and, spatiallyindependent of the variable under study, and aduplication of the sampling and chemical analysisprocedures is available.
➤ The magnitude of the nugget effect is very dependenton sample support, sampling density, sampling quality,assaying procedures, and the nature of thephenomenon under study.
➤ Polygonal estimators, often used in process controls inplants, are generally conditionally biased andimprecise. Estimators taking into account the varyingstructure of the variables, the geometry of the samplingpattern, the geometry of the estimated support, and therelation between both, is more advisable.
Acknowledgements
The author wishes to thank Mr Fernando Vivanco, CorporateProjects Vice President and Mr. Julio Beniscelli, Manager ofTechnical Services, Codelco Chile, for their strong support inthe implementation of good sampling, assaying and geosta-tistical practices along the copper business value chain.
References1. CHILES, J. P. and DELFINER, P. Geostatistics: Modeling Spatial Uncertainty.
Wiley Series in Probability and Statistics. John Wiley & Sons, Inc. 1999. p. 695.
2. DAVID, M. Geostatistical ore reserve estimation. Elsevier Science Ltd,Developments in Geomathematics, vol. 2. 1977. p. 384.
3. MATHERON, G. La Théorie Des Variables Régionalisées et Ses Applications.Les Cahiers du Centre de Morphologie Mathématique De Fontainebleu.Fascicule 5. Ecole Nationale Supérieur des Mines de Paris. France. 1970.
4. PITARD, F. Pierre Gy’s Sampling Theory and Sampling Practice.Heterogeneity, Sampling Correctness, and Statistical Process Control. CRCPress, 1993. p. 488.
5. GY PIERRE, L’Echantillonnage des minerais en Vrac. vol. 1. Revue de lIndustrie Minérale, St Etienne, France. Numéro Spécial. 15 Janvier 1967.
6. GY PIERRE, L’Echantillonnage des minerais en Vrac. vol. 2. Revue de lIndustrie Minérale, St Etienne, France. Numéro Spécial. 15 Septembre1971.
7. GY, PIERRE. Sampling of Particulate Materials Theory and Practice. Firstedition (1979) second revised edition (1982). Elsevier, Amsterdam xvii.1979. p. 431.
8. JOURNEL, A.G. and HUIJBREGTS, C.J. Mining Geostatistics. Academic Press,New York, 1978. p. 600.
9. CARRASCO, P., CARRASCO, P., and JARA, E. The economic impact of correctsampling and analysis practices in the copper industry. Chemometrics andIntelligent Laboratory Systems, vol. 74, 2004. Elsevier ScientificPublications. pp. 209–213.
10. CARRASCO, P., WILKE, A., JARA, E., and SUAREZ, E. Some applications ofstatistics and geostatistics to the sampling of a big cooper tail stream.Third world conference on sampling and blending. Porto Alegre, Brazil.2007. p. 352-366
Appendix 1
Variogram function and sampling/assaying errors
If the errors have no temporal or spatial correlation.If the grade and the errors are not temporal or spatially
correlated:
Therefore, under the previous assumptions, sampling +assay errors add like a nugget effect to the true variogram.‘Human’ nugget effect.
Note that a sampling bias also contributes to the nuggeteffect, because there is no such thing as a constant samplingbias.
Legend:Z* = Estimated valueh = Distance/timeZ = True valueγ = SemivariogramE ( ) = Expected valuee = Random errorγz*,e = Cross variogram between Z* and e.
Appendix 2Sample support and Nugget Effect
▲
304 JUNE 2010 VOLUME 110 The Journal of The Southern African Institute of Mining and Metallurgy

V,v = Sample supportsC0v = Nugget effect at sample support vC0v = Nugget effect at sample support VC0 =Very small range covarianceC0(v, v) = Mean covariance between v and v
As the distance (x-y) is greater than the range:
Appendix 3
Information effect
The perception of natural variability changes as the drillingdensity increases. (Graphs 1 and 2).
Notice the increase in variability, the increase in the
oxides proportions, and the increase in the complexity of the
contacts between both ore facies.
Appendix 4
Variance of the sampling error from duplicatesampling and assaying
o = Original valued = Duplicate value
As the sampling and assaying procedures are the same,the stochastic nature of the error is the same:
As the duplication process is blind and done in a differenttime:
Then:
Therefore the error plus the assay error variance is thesemi variance of the difference between the original valueand the duplicate value. In other words, it is the sill of thevariogram function of the differences. ◆
Nugget effect, artificial or natural?Journal
Paper
The Journal of The Southern African Institute of Mining and Metallurgy VOLUME 110 JUNE 2010 305 ▲
Graph 1—Grade spatial variability. DDH Holes at a 100*100 m drillinggrid
Graph 2—Cooper grade spatial variability. BH Holes at a 10*5 drillinggrid