Nucleosome repositioning underlies dynamic gene...
14
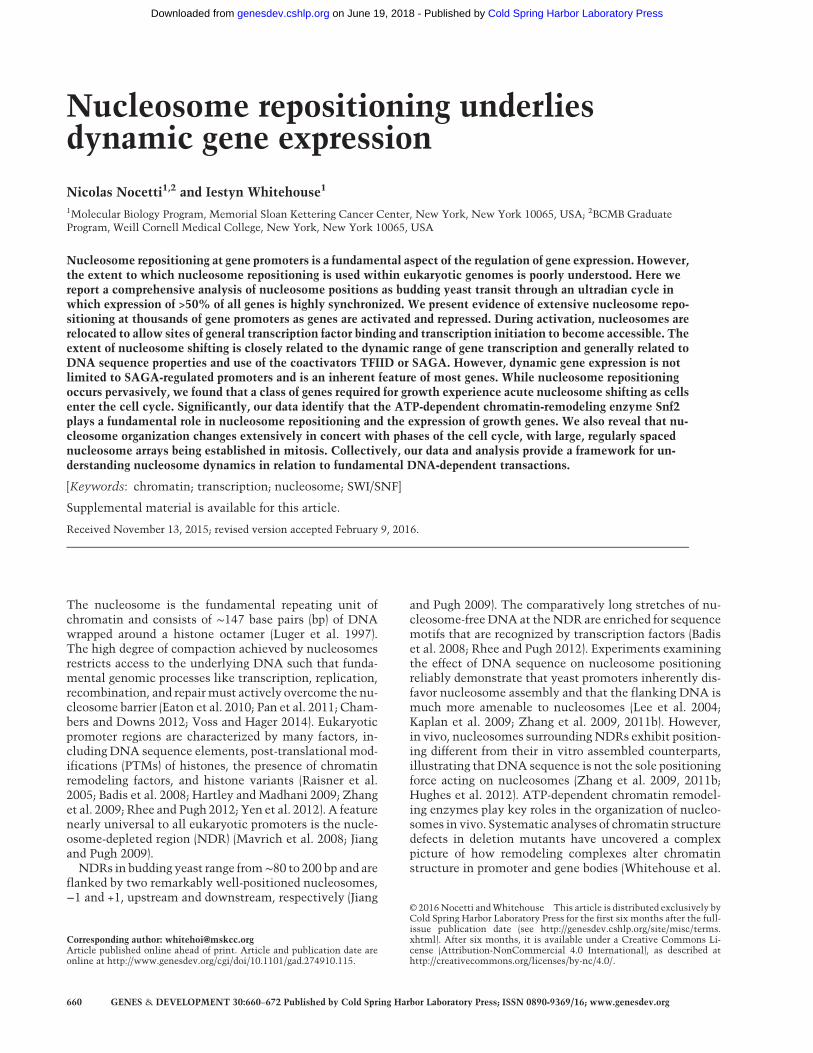
Nucleosome repositioning underlies dynamic gene expression Nicolas Nocetti 1,2 and Iestyn Whitehouse 1 1 Molecular Biology Program, Memorial Sloan Kettering Cancer Center, New York, New York 10065, USA; 2 BCMB Graduate Program, Weill Cornell Medical College, New York, New York 10065, USA Nucleosome repositioning at gene promoters is a fundamental aspect of the regulation of gene expression. However, the extent to which nucleosome repositioning is used within eukaryotic genomes is poorly understood. Here we report a comprehensive analysis of nucleosome positions as budding yeast transit through an ultradian cycle in which expression of >50% of all genes is highly synchronized. We present evidence of extensive nucleosome repo- sitioning at thousands of gene promoters as genes are activated and repressed. During activation, nucleosomes are relocated to allow sites of general transcription factor binding and transcription initiation to become accessible. The extent of nucleosome shifting is closely related to the dynamic range of gene transcription and generally related to DNA sequence properties and use of the coactivators TFIID or SAGA. However, dynamic gene expression is not limited to SAGA-regulated promoters and is an inherent feature of most genes. While nucleosome repositioning occurs pervasively, we found that a class of genes required for growth experience acute nucleosome shifting as cells enter the cell cycle. Significantly, our data identify that the ATP-dependent chromatin-remodeling enzyme Snf2 plays a fundamental role in nucleosome repositioning and the expression of growth genes. We also reveal that nu- cleosome organization changes extensively in concert with phases of the cell cycle, with large, regularly spaced nucleosome arrays being established in mitosis. Collectively, our data and analysis provide a framework for un- derstanding nucleosome dynamics in relation to fundamental DNA-dependent transactions. [Keywords: chromatin; transcription; nucleosome; SWI/SNF] Supplemental material is available for this article. Received November 13, 2015; revised version accepted February 9, 2016. The nucleosome is the fundamental repeating unit of chromatin and consists of ∼147 base pairs (bp) of DNA wrapped around a histone octamer (Luger et al. 1997). The high degree of compaction achieved by nucleosomes restricts access to the underlying DNA such that funda- mental genomic processes like transcription, replication, recombination, and repair must actively overcome the nu- cleosome barrier (Eaton et al. 2010; Pan et al. 2011; Cham- bers and Downs 2012; Voss and Hager 2014). Eukaryotic promoter regions are characterized by many factors, in- cluding DNA sequence elements, post-translational mod- ifications (PTMs) of histones, the presence of chromatin remodeling factors, and histone variants (Raisner et al. 2005; Badis et al. 2008; Hartley and Madhani 2009; Zhang et al. 2009; Rhee and Pugh 2012; Yen et al. 2012). A feature nearly universal to all eukaryotic promoters is the nucle- osome-depleted region (NDR) (Mavrich et al. 2008; Jiang and Pugh 2009). NDRs in budding yeast range from ∼80 to 200 bp and are flanked by two remarkably well-positioned nucleosomes, −1 and +1, upstream and downstream, respectively (Jiang and Pugh 2009). The comparatively long stretches of nu- cleosome-free DNA at the NDR are enriched for sequence motifs that are recognized by transcription factors (Badis et al. 2008; Rhee and Pugh 2012). Experiments examining the effect of DNA sequence on nucleosome positioning reliably demonstrate that yeast promoters inherently dis- favor nucleosome assembly and that the flanking DNA is much more amenable to nucleosomes (Lee et al. 2004; Kaplan et al. 2009; Zhang et al. 2009, 2011b). However, in vivo, nucleosomes surrounding NDRs exhibit position- ing different from their in vitro assembled counterparts, illustrating that DNA sequence is not the sole positioning force acting on nucleosomes (Zhang et al. 2009, 2011b; Hughes et al. 2012). ATP-dependent chromatin remodel- ing enzymes play key roles in the organization of nucleo- somes in vivo. Systematic analyses of chromatin structure defects in deletion mutants have uncovered a complex picture of how remodeling complexes alter chromatin structure in promoter and gene bodies (Whitehouse et al. Corresponding author: [email protected] Article published online ahead of print. Article and publication date are online at http://www.genesdev.org/cgi/doi/10.1101/gad.274910.115. © 2016 Nocetti and Whitehouse This article is distributed exclusively by Cold Spring Harbor Laboratory Press for the first six months after the full- issue publication date (see http://genesdev.cshlp.org/site/misc/terms. xhtml). After six months, it is available under a Creative Commons Li- cense (Attribution-NonCommercial 4.0 International), as described at http://creativecommons.org/licenses/by-nc/4.0/. 660 GENES & DEVELOPMENT 30:660–672 Published by Cold Spring Harbor Laboratory Press; ISSN 0890-9369/16; www.genesdev.org Cold Spring Harbor Laboratory Press on June 19, 2018 - Published by genesdev.cshlp.org Downloaded from
Transcript of Nucleosome repositioning underlies dynamic gene...
Nucleosome repositioning underliesdynamic gene expressionNicolas Nocetti1,2 and Iestyn Whitehouse1
1Molecular Biology Program, Memorial Sloan Kettering Cancer Center, New York, New York 10065, USA; 2BCMB GraduateProgram, Weill Cornell Medical College, New York, New York 10065, USA
Nucleosome repositioning at gene promoters is a fundamental aspect of the regulation of gene expression. However,the extent to which nucleosome repositioning is used within eukaryotic genomes is poorly understood. Here wereport a comprehensive analysis of nucleosome positions as budding yeast transit through an ultradian cycle inwhich expression of >50% of all genes is highly synchronized. We present evidence of extensive nucleosome repo-sitioning at thousands of gene promoters as genes are activated and repressed. During activation, nucleosomes arerelocated to allow sites of general transcription factor binding and transcription initiation to become accessible. Theextent of nucleosome shifting is closely related to the dynamic range of gene transcription and generally related toDNA sequence properties and use of the coactivators TFIID or SAGA. However, dynamic gene expression is notlimited to SAGA-regulated promoters and is an inherent feature of most genes. While nucleosome repositioningoccurs pervasively, we found that a class of genes required for growth experience acute nucleosome shifting as cellsenter the cell cycle. Significantly, our data identify that the ATP-dependent chromatin-remodeling enzyme Snf2plays a fundamental role in nucleosome repositioning and the expression of growth genes. We also reveal that nu-cleosome organization changes extensively in concert with phases of the cell cycle, with large, regularly spacednucleosome arrays being established in mitosis. Collectively, our data and analysis provide a framework for un-derstanding nucleosome dynamics in relation to fundamental DNA-dependent transactions.
[Keywords: chromatin; transcription; nucleosome; SWI/SNF]
Supplemental material is available for this article.
Received November 13, 2015; revised version accepted February 9, 2016.
The nucleosome is the fundamental repeating unit ofchromatin and consists of ∼147 base pairs (bp) of DNAwrapped around a histone octamer (Luger et al. 1997).The high degree of compaction achieved by nucleosomesrestricts access to the underlying DNA such that funda-mental genomic processes like transcription, replication,recombination, and repairmust actively overcome the nu-cleosome barrier (Eaton et al. 2010; Pan et al. 2011; Cham-bers and Downs 2012; Voss and Hager 2014). Eukaryoticpromoter regions are characterized by many factors, in-cluding DNA sequence elements, post-translational mod-ifications (PTMs) of histones, the presence of chromatinremodeling factors, and histone variants (Raisner et al.2005; Badis et al. 2008; Hartley andMadhani 2009; Zhanget al. 2009; Rhee and Pugh 2012; Yen et al. 2012). A featurenearly universal to all eukaryotic promoters is the nucle-osome-depleted region (NDR) (Mavrich et al. 2008; Jiangand Pugh 2009).
NDRs in budding yeast range from∼80 to 200 bp and areflanked by two remarkably well-positioned nucleosomes,−1 and +1, upstream and downstream, respectively (Jiang
and Pugh 2009). The comparatively long stretches of nu-cleosome-free DNA at theNDR are enriched for sequencemotifs that are recognized by transcription factors (Badiset al. 2008; Rhee and Pugh 2012). Experiments examiningthe effect of DNA sequence on nucleosome positioningreliably demonstrate that yeast promoters inherently dis-favor nucleosome assembly and that the flanking DNA ismuch more amenable to nucleosomes (Lee et al. 2004;Kaplan et al. 2009; Zhang et al. 2009, 2011b). However,in vivo, nucleosomes surroundingNDRs exhibit position-ing different from their in vitro assembled counterparts,illustrating that DNA sequence is not the sole positioningforce acting on nucleosomes (Zhang et al. 2009, 2011b;Hughes et al. 2012). ATP-dependent chromatin remodel-ing enzymes play key roles in the organization of nucleo-somes in vivo. Systematic analyses of chromatin structuredefects in deletion mutants have uncovered a complexpicture of how remodeling complexes alter chromatinstructure in promoter and gene bodies (Whitehouse et al.
Corresponding author: [email protected] published online ahead of print. Article and publication date areonline at http://www.genesdev.org/cgi/doi/10.1101/gad.274910.115.
© 2016Nocetti andWhitehouse This article is distributed exclusively byCold Spring Harbor Laboratory Press for the first six months after the full-issue publication date (see http://genesdev.cshlp.org/site/misc/terms.xhtml). After six months, it is available under a Creative Commons Li-cense (Attribution-NonCommercial 4.0 International), as described athttp://creativecommons.org/licenses/by-nc/4.0/.
660 GENES & DEVELOPMENT 30:660–672 Published by Cold Spring Harbor Laboratory Press; ISSN 0890-9369/16; www.genesdev.org
Cold Spring Harbor Laboratory Press on June 19, 2018 - Published by genesdev.cshlp.orgDownloaded from
2007; Hartley and Madhani 2009; Tirosh et al. 2010; Gki-kopoulos et al. 2011; Yen et al. 2012; Ganguli et al. 2014).While the general principles of chromatin reconfigurationby ATP-dependent remodeling activities are gradually be-ing defined, it is far from clear why so many remodelingactivities are needed and how each of the respective enzy-matic activities is integrated into coherent pathways forgene activation or repression. Indeed, the study of manychromatin-associated factors is typically confounded bythe seemingly pleotropic nature of the transcriptional de-fects in mutant strains.Chromatin reconfiguration at inducible genes has re-
vealed the roles played by chromatin structure duringgene activation. Classic model systems demonstrateclear roles for histone acetylation and/or ATP-dependentchromatin remodeling enzymes (Wu and Winston 1997;Reinke et al. 2001; Moreau et al. 2003; Steger et al.2003). More recently, chromatin state changes havebeen mapped genome-wide as cells synchronously re-spond to different carbon sources (Tolkunov et al. 2011),stress (Gasch et al. 2000; Shivaswamy et al. 2008; Weineret al. 2015), and meiosis (Zhang et al. 2011a) or passthrough an ultradian metabolic cycle (Kuang et al. 2014).Such approaches are especially powerful, as they allowthe intricacies of gene expression to be documented asthousands of loci are activated or repressed. However,much of our understanding of how chromatin is globallyreconfigured during gene activation is derived from exper-imental systems that use acute stress. Genes have beenbroadly categorized as either “stress” genes, which aredynamically expressed and regulated by SAGA, or “house-keeping” genes, which are constitutively expressed andregulated by TFIID. However, designation into such cate-gories is inherently dependent on growth conditions andtypically represents only a limited set of genes. Thus, itis vital to understand whether general principles fromsuch studies are applicable in all cases.To broadly examine in vivo nucleosome dynamics as
thousands of genes are synchronously activated and re-pressed, we focused on the yeast metabolic cycle (YMC),which offers a highly robust system in which over halfof the coding transcripts exhibit periodic expression (Kle-vecz et al. 2004; Tu et al. 2005; Kuang et al. 2014). Oscil-lation is achieved in a chemostat by first growing aculture to saturation in limited nutrient conditions (Nov-ick and Szilard 1950). Starved of a carbon source, the cellsare maintained at saturation for several hours, allowingthe culture to synchronize in a nonrespiratory metabolicstate. Upon the readdition of glucose, the cells begin torespire synchronously, and this is monitored by the con-centration of dissolved oxygen (DO) available to theculture. Initial studies of the YMC described three tempo-rally segregated phases: oxidative (Ox), reductive building(R/B), and reductive charging (R/C) (Tu et al. 2005).Ox genes are maximally expressed as the culture con-sumes O2, while R/B and R/C genes are transcribed asO2 re-enters the culture and subsequently plateaus, re-spectively. Within each category, the genes transcribedreflect the demands facing the culture. For instance,the Ox phase is characterized by a burst of ribosome and
amino acid biogenesis; genes expressed during Ox arelargely involved in growth. Subsequently, in the R/Bphase, within which S phase takes place, genes involvedin DNA synthesis, DNA repair, and chromatin assemblyexhibit peak expression. Following R/B, the cells enter a“quiescent”-like state in which levels of the storage car-bohydrate trehalose peak and trigger the expression of fac-tors involved in autophagy (Tu et al. 2005; Cai and Tu2012).Our analysis reveals that nucleosome repositioning is
used pervasively in the regulation of gene transcription.Nucleosome remodeling generally occurs at SAGA pro-moters, while chromatin at TFIID-dominated promoterslargely remains static; however, there are broad excep-tions to this principle. Indeed, our analysis reveals thatmany TFIID-regulated promoters exhibit highly dynamicexpression patterns. Importantly, when maximally ex-pressed, nucleosomes at SAGA promoters closely resem-ble the nucleosome organization observed at TFIIDpromoters, suggesting that all actively transcribed genesadopt a common chromatin architecture. We show thatthemajority of nucleosome repositioning at promoters oc-curs during a narrowwindow, which is correlatedwith in-duction of genes responsible for growth; moreover, ourdata clearly implicate the SWI/SNF complex in this funda-mental process. Finally, we observed global changes in nu-cleosome organization as cells progress through the YMC;intriguingly, these changes appear coupled with the onsetof mitosis, in which nucleosome arrays become highlyorganized.
Results
+1 nucleosome dynamics correlate with transcriptionaloutput
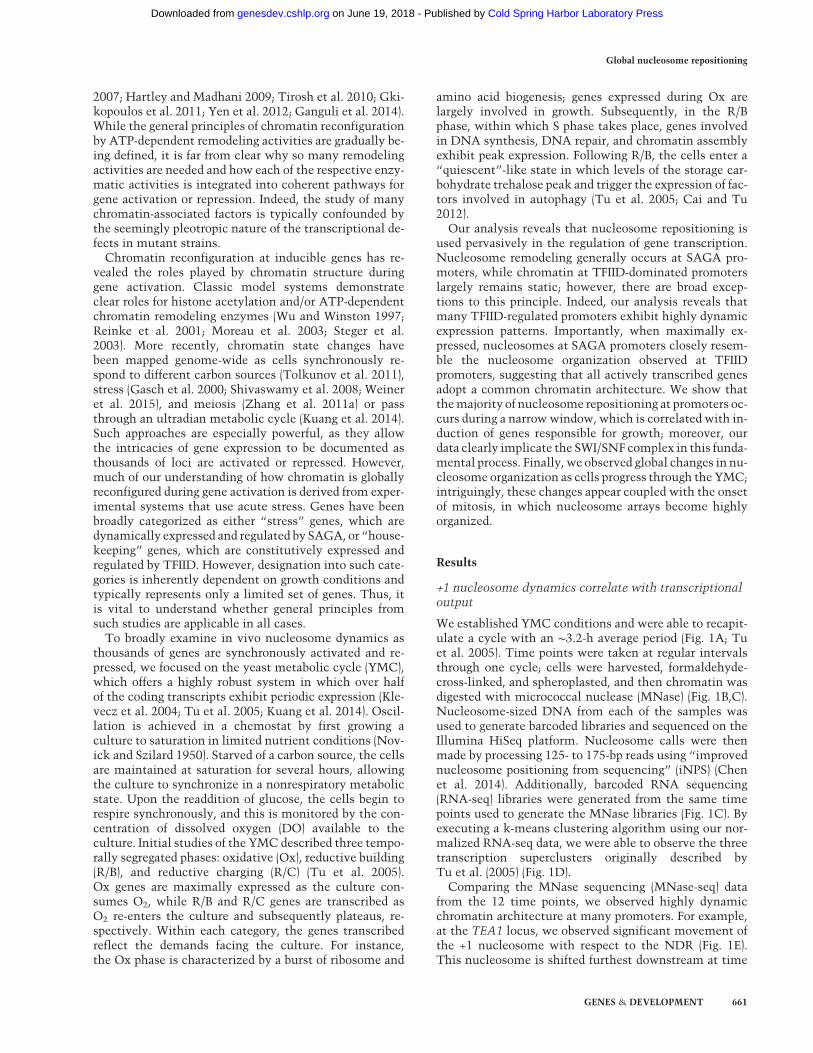
We established YMC conditions and were able to recapit-ulate a cycle with an ∼3.2-h average period (Fig. 1A; Tuet al. 2005). Time points were taken at regular intervalsthrough one cycle; cells were harvested, formaldehyde-cross-linked, and spheroplasted, and then chromatin wasdigested with micrococcal nuclease (MNase) (Fig. 1B,C).Nucleosome-sized DNA from each of the samples wasused to generate barcoded libraries and sequenced on theIllumina HiSeq platform. Nucleosome calls were thenmade by processing 125- to 175-bp reads using “improvednucleosome positioning from sequencing” (iNPS) (Chenet al. 2014). Additionally, barcoded RNA sequencing(RNA-seq) libraries were generated from the same timepoints used to generate the MNase libraries (Fig. 1C). Byexecuting a k-means clustering algorithm using our nor-malized RNA-seq data, we were able to observe the threetranscription superclusters originally described byTu et al. (2005) (Fig. 1D).Comparing the MNase sequencing (MNase-seq) data
from the 12 time points, we observed highly dynamicchromatin architecture at many promoters. For example,at the TEA1 locus, we observed significant movement ofthe +1 nucleosome with respect to the NDR (Fig. 1E).This nucleosome is shifted furthest downstream at time
Global nucleosome repositioning
GENES & DEVELOPMENT 661
Cold Spring Harbor Laboratory Press on June 19, 2018 - Published by genesdev.cshlp.orgDownloaded from
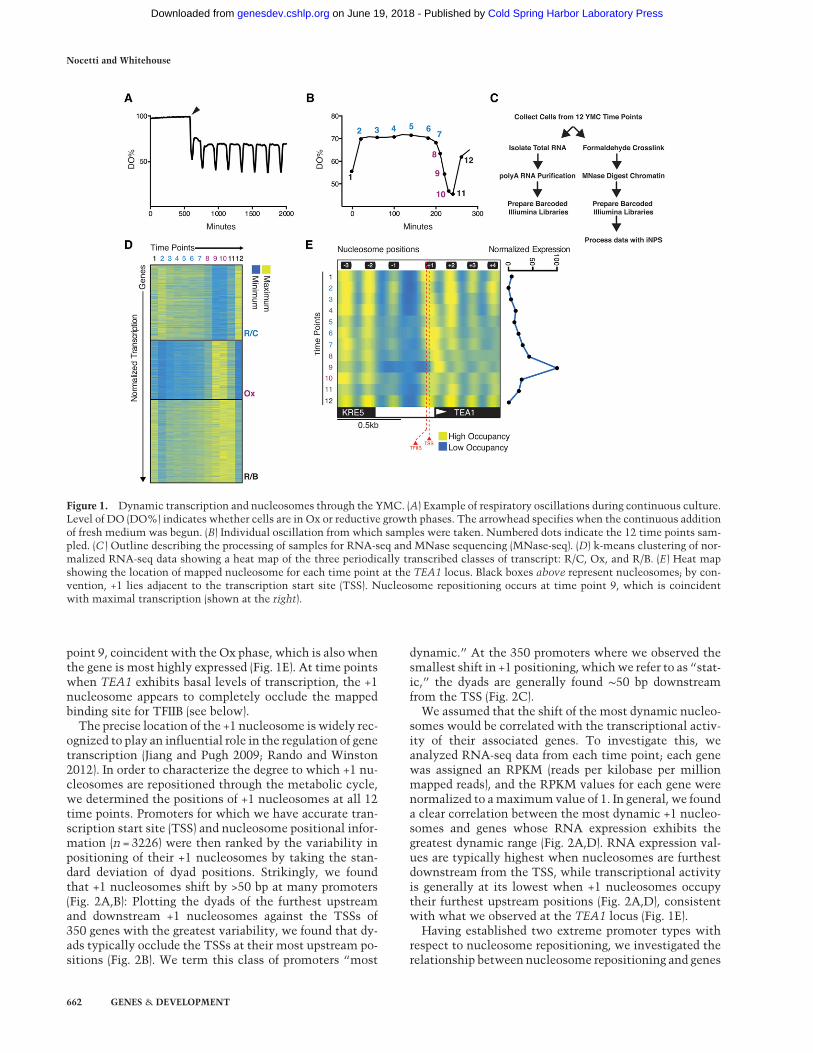
point 9, coincident with the Ox phase, which is also whenthe gene is most highly expressed (Fig. 1E). At time pointswhen TEA1 exhibits basal levels of transcription, the +1nucleosome appears to completely occlude the mappedbinding site for TFIIB (see below).
The precise location of the +1 nucleosome is widely rec-ognized to play an influential role in the regulation of genetranscription (Jiang and Pugh 2009; Rando and Winston2012). In order to characterize the degree to which +1 nu-cleosomes are repositioned through the metabolic cycle,we determined the positions of +1 nucleosomes at all 12time points. Promoters for which we have accurate tran-scription start site (TSS) and nucleosome positional infor-mation (n = 3226) were then ranked by the variability inpositioning of their +1 nucleosomes by taking the stan-dard deviation of dyad positions. Strikingly, we foundthat +1 nucleosomes shift by >50 bp at many promoters(Fig. 2A,B): Plotting the dyads of the furthest upstreamand downstream +1 nucleosomes against the TSSs of350 genes with the greatest variability, we found that dy-ads typically occlude the TSSs at their most upstream po-sitions (Fig. 2B). We term this class of promoters “most
dynamic.” At the 350 promoters where we observed thesmallest shift in +1 positioning, whichwe refer to as “stat-ic,” the dyads are generally found ∼50 bp downstreamfrom the TSS (Fig. 2C).
We assumed that the shift of the most dynamic nucleo-somes would be correlated with the transcriptional activ-ity of their associated genes. To investigate this, weanalyzed RNA-seq data from each time point; each genewas assigned an RPKM (reads per kilobase per millionmapped reads), and the RPKM values for each gene werenormalized to amaximumvalue of 1. In general, we founda clear correlation between the most dynamic +1 nucleo-somes and genes whose RNA expression exhibits thegreatest dynamic range (Fig. 2A,D). RNA expression val-ues are typically highest when nucleosomes are furthestdownstream from the TSS, while transcriptional activityis generally at its lowest when +1 nucleosomes occupytheir furthest upstream positions (Fig. 2A,D), consistentwith what we observed at the TEA1 locus (Fig. 1E).
Having established two extreme promoter types withrespect to nucleosome repositioning, we investigated therelationship between nucleosome repositioning and genes
Figure 1. Dynamic transcription and nucleosomes through the YMC. (A) Example of respiratory oscillations during continuous culture.Level of DO (DO%) indicates whether cells are in Ox or reductive growth phases. The arrowhead specifies when the continuous additionof fresh medium was begun. (B) Individual oscillation from which samples were taken. Numbered dots indicate the 12 time points sam-pled. (C ) Outline describing the processing of samples for RNA-seq and MNase sequencing (MNase-seq). (D) k-means clustering of nor-malized RNA-seq data showing a heat map of the three periodically transcribed classes of transcript: R/C, Ox, and R/B. (E) Heat mapshowing the location of mapped nucleosome for each time point at the TEA1 locus. Black boxes above represent nucleosomes; by con-vention, +1 lies adjacent to the transcription start site (TSS). Nucleosome repositioning occurs at time point 9, which is coincidentwith maximal transcription (shown at the right).
Nocetti and Whitehouse
662 GENES & DEVELOPMENT
Cold Spring Harbor Laboratory Press on June 19, 2018 - Published by genesdev.cshlp.orgDownloaded from
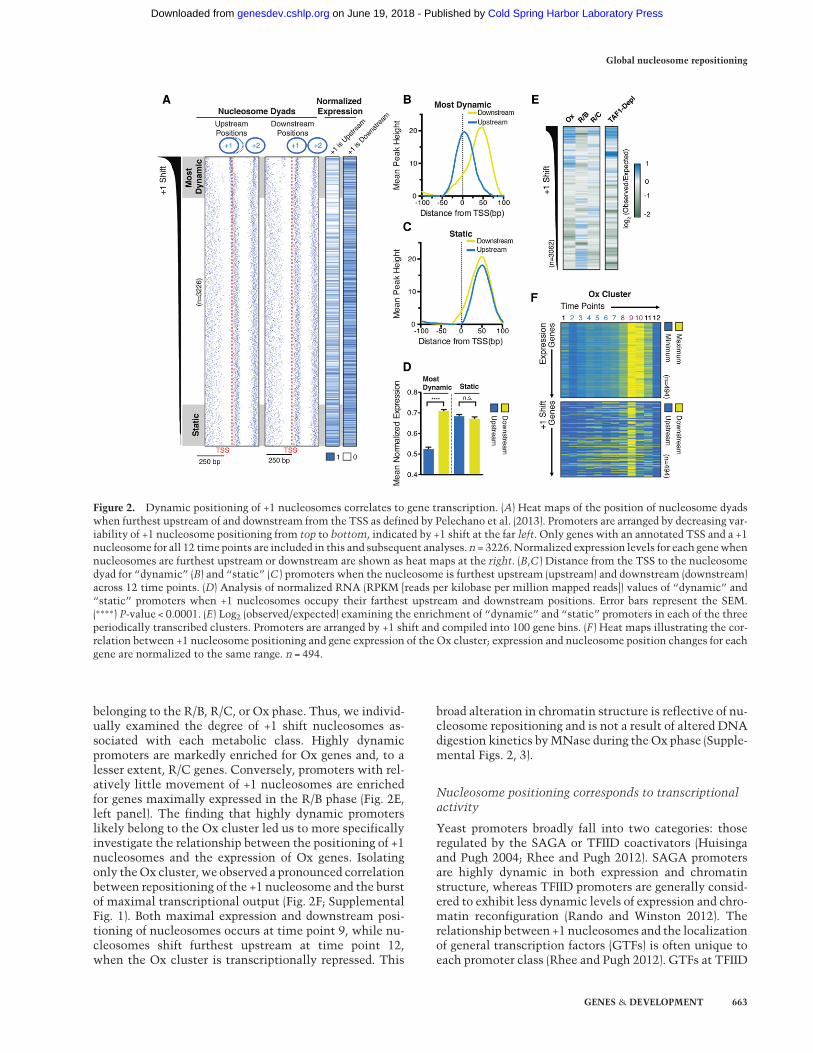
belonging to the R/B, R/C, or Ox phase. Thus, we individ-ually examined the degree of +1 shift nucleosomes as-sociated with each metabolic class. Highly dynamicpromoters are markedly enriched for Ox genes and, to alesser extent, R/C genes. Conversely, promoters with rel-atively little movement of +1 nucleosomes are enrichedfor genes maximally expressed in the R/B phase (Fig. 2E,left panel). The finding that highly dynamic promoterslikely belong to the Ox cluster led us to more specificallyinvestigate the relationship between the positioning of +1nucleosomes and the expression of Ox genes. Isolatingonly theOx cluster, we observed a pronounced correlationbetween repositioning of the +1 nucleosome and the burstof maximal transcriptional output (Fig. 2F; SupplementalFig. 1). Both maximal expression and downstream posi-tioning of nucleosomes occurs at time point 9, while nu-cleosomes shift furthest upstream at time point 12,when the Ox cluster is transcriptionally repressed. This
broad alteration in chromatin structure is reflective of nu-cleosome repositioning and is not a result of altered DNAdigestion kinetics byMNase during the Ox phase (Supple-mental Figs. 2, 3).
Nucleosome positioning corresponds to transcriptionalactivity
Yeast promoters broadly fall into two categories: thoseregulated by the SAGA or TFIID coactivators (Huisingaand Pugh 2004; Rhee and Pugh 2012). SAGA promotersare highly dynamic in both expression and chromatinstructure, whereas TFIID promoters are generally consid-ered to exhibit less dynamic levels of expression and chro-matin reconfiguration (Rando and Winston 2012). Therelationship between +1 nucleosomes and the localizationof general transcription factors (GTFs) is often unique toeach promoter class (Rhee and Pugh 2012). GTFs at TFIID
Figure 2. Dynamic positioning of +1 nucleosomes correlates to gene transcription. (A) Heat maps of the position of nucleosome dyadswhen furthest upstream of and downstream from the TSS as defined by Pelechano et al. (2013). Promoters are arranged by decreasing var-iability of +1 nucleosome positioning from top to bottom, indicated by +1 shift at the far left. Only genes with an annotated TSS and a +1nucleosome for all 12 time points are included in this and subsequent analyses. n = 3226.Normalized expression levels for each genewhennucleosomes are furthest upstream or downstream are shown as heat maps at the right. (B,C ) Distance from the TSS to the nucleosomedyad for “dynamic” (B) and “static” (C ) promoters when the nucleosome is furthest upstream (upstream) and downstream (downstream)across 12 time points. (D) Analysis of normalized RNA (RPKM [reads per kilobase per million mapped reads]) values of “dynamic” and“static” promoters when +1 nucleosomes occupy their farthest upstream and downstream positions. Error bars represent the SEM.(∗∗∗∗) P-value < 0.0001. (E) Log2 (observed/expected) examining the enrichment of “dynamic” and “static” promoters in each of the threeperiodically transcribed clusters. Promoters are arranged by +1 shift and compiled into 100 gene bins. (F ) Heat maps illustrating the cor-relation between +1 nucleosome positioning and gene expression of the Ox cluster; expression and nucleosome position changes for eachgene are normalized to the same range. n = 494.
Global nucleosome repositioning
GENES & DEVELOPMENT 663
Cold Spring Harbor Laboratory Press on June 19, 2018 - Published by genesdev.cshlp.orgDownloaded from
promoters are found a fixed distance upstream of the+1 nucleosome; in contrast, the same GTFs are typicallybound throughout the body of the +1 nucleosome atSAGA promoters, and it was hypothesized that this couldbe the result of competition between nucleosomes andGTFs for binding at these promoters (Rhee and Pugh2012).
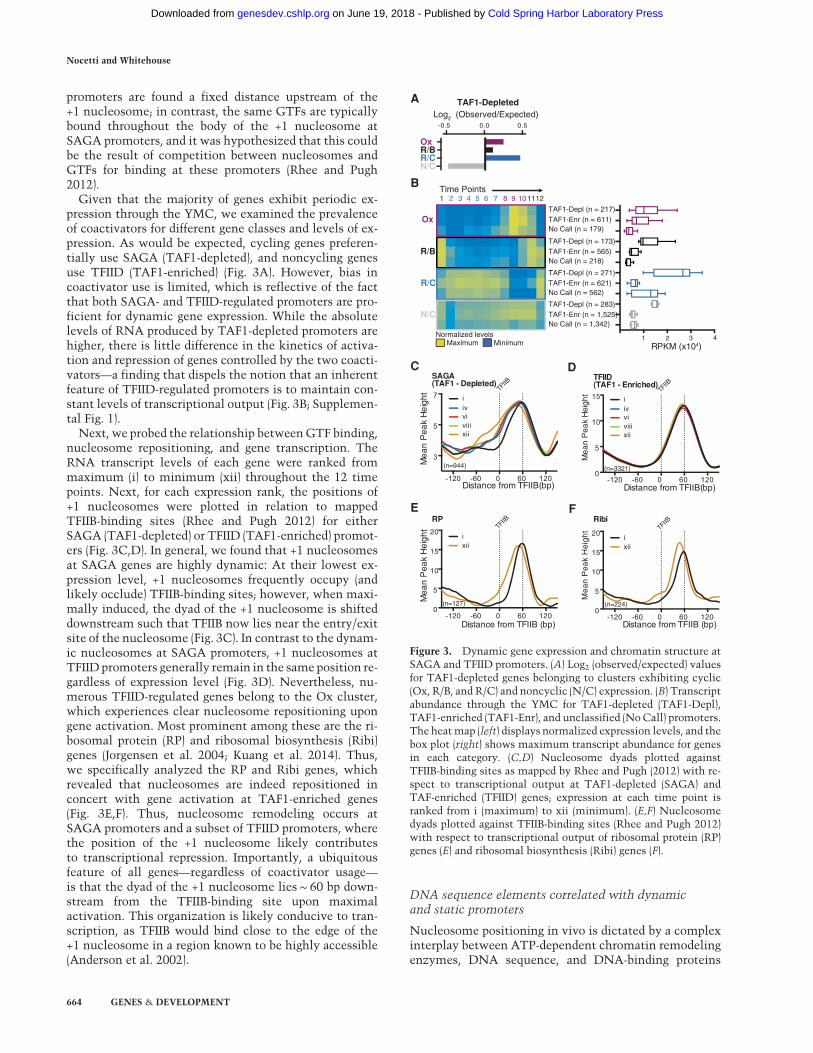
Given that the majority of genes exhibit periodic ex-pression through the YMC, we examined the prevalenceof coactivators for different gene classes and levels of ex-pression. As would be expected, cycling genes preferen-tially use SAGA (TAF1-depleted), and noncycling genesuse TFIID (TAF1-enriched) (Fig. 3A). However, bias incoactivator use is limited, which is reflective of the factthat both SAGA- and TFIID-regulated promoters are pro-ficient for dynamic gene expression. While the absolutelevels of RNA produced by TAF1-depleted promoters arehigher, there is little difference in the kinetics of activa-tion and repression of genes controlled by the two coacti-vators—a finding that dispels the notion that an inherentfeature of TFIID-regulated promoters is to maintain con-stant levels of transcriptional output (Fig. 3B; Supplemen-tal Fig. 1).
Next, we probed the relationship betweenGTF binding,nucleosome repositioning, and gene transcription. TheRNA transcript levels of each gene were ranked frommaximum (i) to minimum (xii) throughout the 12 timepoints. Next, for each expression rank, the positions of+1 nucleosomes were plotted in relation to mappedTFIIB-binding sites (Rhee and Pugh 2012) for eitherSAGA (TAF1-depleted) or TFIID (TAF1-enriched) promot-ers (Fig. 3C,D). In general, we found that +1 nucleosomesat SAGA genes are highly dynamic: At their lowest ex-pression level, +1 nucleosomes frequently occupy (andlikely occlude) TFIIB-binding sites; however, when maxi-mally induced, the dyad of the +1 nucleosome is shifteddownstream such that TFIIB now lies near the entry/exitsite of the nucleosome (Fig. 3C). In contrast to the dynam-ic nucleosomes at SAGA promoters, +1 nucleosomes atTFIID promoters generally remain in the same position re-gardless of expression level (Fig. 3D). Nevertheless, nu-merous TFIID-regulated genes belong to the Ox cluster,which experiences clear nucleosome repositioning upongene activation. Most prominent among these are the ri-bosomal protein (RP) and ribosomal biosynthesis (Ribi)genes (Jorgensen et al. 2004; Kuang et al. 2014). Thus,we specifically analyzed the RP and Ribi genes, whichrevealed that nucleosomes are indeed repositioned inconcert with gene activation at TAF1-enriched genes(Fig. 3E,F). Thus, nucleosome remodeling occurs atSAGA promoters and a subset of TFIID promoters, wherethe position of the +1 nucleosome likely contributesto transcriptional repression. Importantly, a ubiquitousfeature of all genes—regardless of coactivator usage—is that the dyad of the +1 nucleosome lies∼ 60 bp down-stream from the TFIIB-binding site upon maximalactivation. This organization is likely conducive to tran-scription, as TFIIB would bind close to the edge of the+1 nucleosome in a region known to be highly accessible(Anderson et al. 2002).
DNA sequence elements correlated with dynamicand static promoters
Nucleosome positioning in vivo is dictated by a complexinterplay between ATP-dependent chromatin remodelingenzymes, DNA sequence, and DNA-binding proteins
A
B
Ox
R/B
R/C
N/C
1 2 3 4 5 6 7 8 9 101112
OxR/BR/CN/C
RPKM (x104)1 2 3 4
-0 .5 0.0 0.5
Log2 (Observed/Expected)
MinimumMaximumNormalized levels
TAF1-Depl (n = 217)TAF1-Enr (n = 611)No Call (n = 179)
TAF1-Depl (n = 173)TAF1-Enr (n = 565)No Call (n = 218)
TAF1-Depl (n = 271)TAF1-Enr (n = 621)No Call (n = 562)
TAF1-Depl (n = 283)TAF1-Enr (n = 1,525)No Call (n = 1,342)
-120 -60 0 60 120
3
5
7
Distance from TFIIB(bp)
Me
an
Pe
ak
He
igh
t
iiv
TFIIB
vi
xiiviii
SAGA(TAF1 - Depleted)
-120 -60 0 60 1200
5
10
15
Distance from TFIIB(bp)
Me
an
Pe
ak
He
igh
t
i
vi
xii
TFIIB
iv
viii
TFIID(TAF1 - Enriched)
-120 -60 0 60 1200
5
10
15
20
Distance from TFIIB (bp)
Me
an
Pe
ak
He
igh
t
ixii
TFIIBRP
-120 -60 0 60 1200
5
10
15
20
Distance from TFIIB (bp)
Me
an
Pe
ak
He
igh
t
ixii
TFIIBRibi
C D
E F
TAF1-Depleted
(n=944) (n=3321)
(n=224)(n=127)
Time Points
Figure 3. Dynamic gene expression and chromatin structure atSAGA and TFIID promoters. (A) Log2 (observed/expected) valuesfor TAF1-depleted genes belonging to clusters exhibiting cyclic(Ox, R/B, and R/C) and noncyclic (N/C) expression. (B) Transcriptabundance through the YMC for TAF1-depleted (TAF1-Depl),TAF1-enriched (TAF1-Enr), and unclassified (NoCall) promoters.The heatmap (left) displays normalized expression levels, and thebox plot (right) shows maximum transcript abundance for genesin each category. (C,D) Nucleosome dyads plotted againstTFIIB-binding sites as mapped by Rhee and Pugh (2012) with re-spect to transcriptional output at TAF1-depleted (SAGA) andTAF-enriched (TFIID) genes; expression at each time point isranked from i (maximum) to xii (minimum). (E,F) Nucleosomedyads plotted against TFIIB-binding sites (Rhee and Pugh 2012)with respect to transcriptional output of ribosomal protein (RP)genes (E) and ribosomal biosynthesis (Ribi) genes (F).
Nocetti and Whitehouse
664 GENES & DEVELOPMENT
Cold Spring Harbor Laboratory Press on June 19, 2018 - Published by genesdev.cshlp.orgDownloaded from
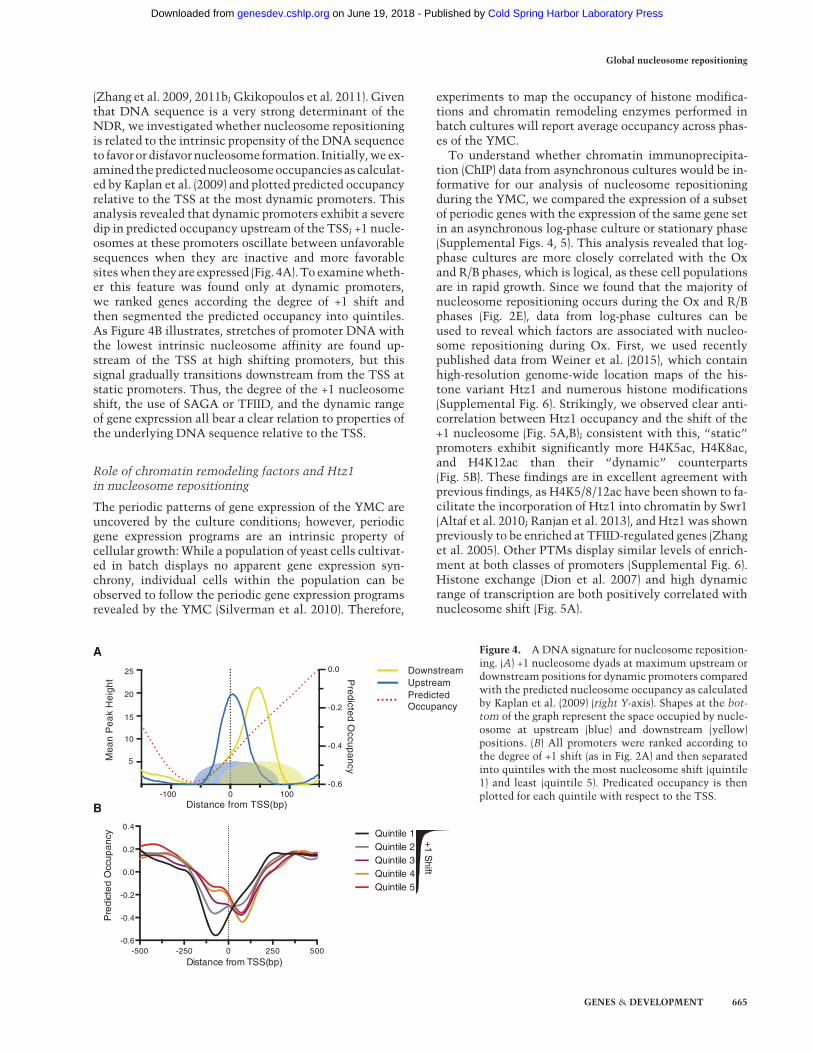
(Zhang et al. 2009, 2011b; Gkikopoulos et al. 2011). Giventhat DNA sequence is a very strong determinant of theNDR, we investigated whether nucleosome repositioningis related to the intrinsic propensity of the DNA sequenceto favor or disfavor nucleosome formation. Initially,we ex-amined thepredictednucleosomeoccupancies as calculat-ed by Kaplan et al. (2009) and plotted predicted occupancyrelative to the TSS at the most dynamic promoters. Thisanalysis revealed that dynamic promoters exhibit a severedip in predicted occupancy upstream of the TSS; +1 nucle-osomes at these promoters oscillate between unfavorablesequences when they are inactive and more favorablesiteswhen theyare expressed (Fig. 4A).To examinewheth-er this feature was found only at dynamic promoters,we ranked genes according the degree of +1 shift andthen segmented the predicted occupancy into quintiles.As Figure 4B illustrates, stretches of promoter DNA withthe lowest intrinsic nucleosome affinity are found up-stream of the TSS at high shifting promoters, but thissignal gradually transitions downstream from the TSS atstatic promoters. Thus, the degree of the +1 nucleosomeshift, the use of SAGA or TFIID, and the dynamic rangeof gene expression all bear a clear relation to properties ofthe underlying DNA sequence relative to the TSS.
Role of chromatin remodeling factors and Htz1in nucleosome repositioning
The periodic patterns of gene expression of the YMC areuncovered by the culture conditions; however, periodicgene expression programs are an intrinsic property ofcellular growth:While a population of yeast cells cultivat-ed in batch displays no apparent gene expression syn-chrony, individual cells within the population can beobserved to follow the periodic gene expression programsrevealed by the YMC (Silverman et al. 2010). Therefore,
experiments to map the occupancy of histone modifica-tions and chromatin remodeling enzymes performed inbatch cultures will report average occupancy across phas-es of the YMC.To understand whether chromatin immunoprecipita-
tion (ChIP) data from asynchronous cultures would be in-formative for our analysis of nucleosome repositioningduring the YMC, we compared the expression of a subsetof periodic genes with the expression of the same gene setin an asynchronous log-phase culture or stationary phase(Supplemental Figs. 4, 5). This analysis revealed that log-phase cultures are more closely correlated with the Oxand R/B phases, which is logical, as these cell populationsare in rapid growth. Since we found that the majority ofnucleosome repositioning occurs during the Ox and R/Bphases (Fig. 2E), data from log-phase cultures can beused to reveal which factors are associated with nucleo-some repositioning during Ox. First, we used recentlypublished data from Weiner et al. (2015), which containhigh-resolution genome-wide location maps of the his-tone variant Htz1 and numerous histone modifications(Supplemental Fig. 6). Strikingly, we observed clear anti-correlation between Htz1 occupancy and the shift of the+1 nucleosome (Fig. 5A,B); consistent with this, “static”promoters exhibit significantly more H4K5ac, H4K8ac,and H4K12ac than their “dynamic” counterparts(Fig. 5B). These findings are in excellent agreement withprevious findings, as H4K5/8/12ac have been shown to fa-cilitate the incorporation of Htz1 into chromatin by Swr1(Altaf et al. 2010; Ranjan et al. 2013), and Htz1 was shownpreviously to be enriched at TFIID-regulated genes (Zhanget al. 2005). Other PTMs display similar levels of enrich-ment at both classes of promoters (Supplemental Fig. 6).Histone exchange (Dion et al. 2007) and high dynamicrange of transcription are both positively correlated withnucleosome shift (Fig. 5A).
B
-500 -250 0 250 500-0.6
-0.4
-0.2
0.0
0.2
0.4
Distance from TSS(bp)
Pre
dic
ted
Occ
up
an
cy Quintile 1Quintile 2Quintile 3Quintile 4Quintile 5
+1 S
hift
A
-100 0 100
5
10
15
20
25
-0.6
-0.4
-0.2
0.0
Distance from TSS(bp)
Mea
n P
eak
Hei
ght P
redicted Occupancy
UpstreamDownstream
PredictedOccupancy
Figure 4. ADNA signature for nucleosome reposition-ing. (A) +1 nucleosome dyads at maximum upstream ordownstream positions for dynamic promoters comparedwith the predicted nucleosome occupancy as calculatedby Kaplan et al. (2009) (right Y-axis). Shapes at the bot-tom of the graph represent the space occupied by nucle-osome at upstream (blue) and downstream (yellow)positions. (B) All promoters were ranked according tothe degree of +1 shift (as in Fig. 2A) and then separatedinto quintiles with the most nucleosome shift (quintile1) and least (quintile 5). Predicated occupancy is thenplotted for each quintile with respect to the TSS.
Global nucleosome repositioning
GENES & DEVELOPMENT 665
Cold Spring Harbor Laboratory Press on June 19, 2018 - Published by genesdev.cshlp.orgDownloaded from
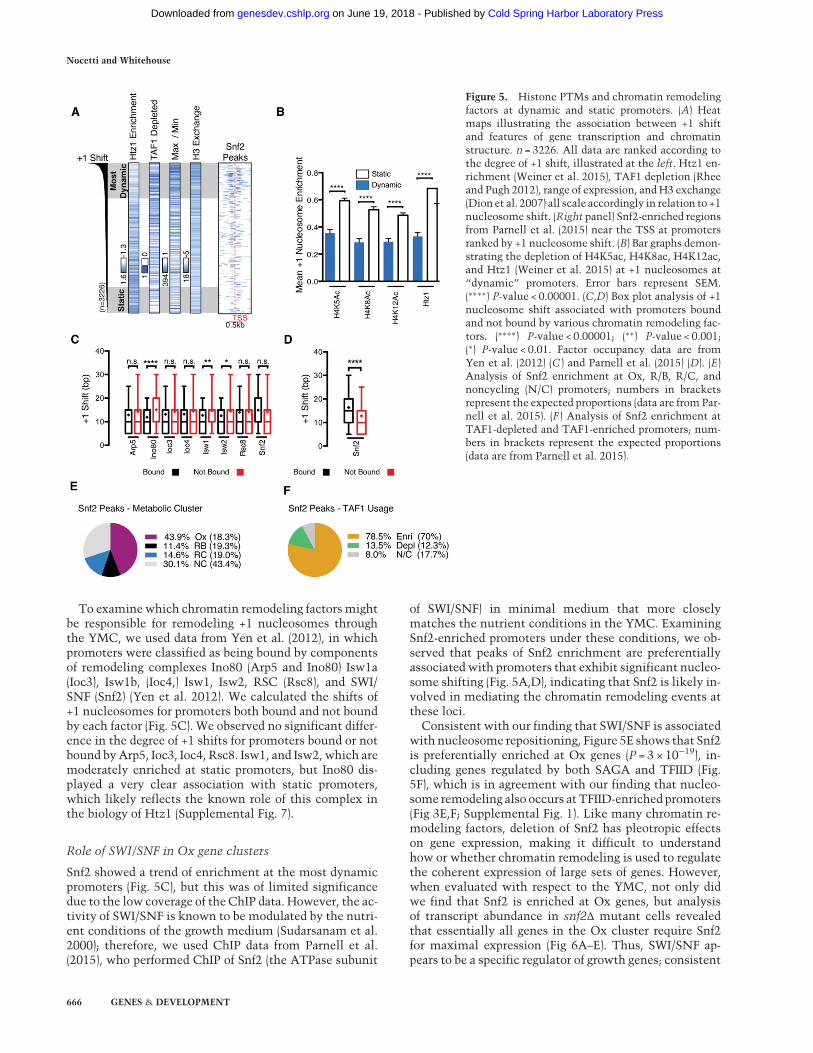
To examinewhich chromatin remodeling factors mightbe responsible for remodeling +1 nucleosomes throughthe YMC, we used data from Yen et al. (2012), in whichpromoters were classified as being bound by componentsof remodeling complexes Ino80 (Arp5 and Ino80) Isw1a(Ioc3), Isw1b, (Ioc4,) Isw1, Isw2, RSC (Rsc8), and SWI/SNF (Snf2) (Yen et al. 2012). We calculated the shifts of+1 nucleosomes for promoters both bound and not boundby each factor (Fig. 5C). We observed no significant differ-ence in the degree of +1 shifts for promoters bound or notbound byArp5, Ioc3, Ioc4, Rsc8. Isw1, and Isw2, which aremoderately enriched at static promoters, but Ino80 dis-played a very clear association with static promoters,which likely reflects the known role of this complex inthe biology of Htz1 (Supplemental Fig. 7).
Role of SWI/SNF in Ox gene clusters
Snf2 showed a trend of enrichment at the most dynamicpromoters (Fig. 5C), but this was of limited significancedue to the low coverage of the ChIP data. However, the ac-tivity of SWI/SNF is known to be modulated by the nutri-ent conditions of the growth medium (Sudarsanam et al.2000); therefore, we used ChIP data from Parnell et al.(2015), who performed ChIP of Snf2 (the ATPase subunit
of SWI/SNF) in minimal medium that more closelymatches the nutrient conditions in the YMC. ExaminingSnf2-enriched promoters under these conditions, we ob-served that peaks of Snf2 enrichment are preferentiallyassociated with promoters that exhibit significant nucleo-some shifting (Fig. 5A,D), indicating that Snf2 is likely in-volved in mediating the chromatin remodeling events atthese loci.
Consistent with our finding that SWI/SNF is associatedwith nucleosome repositioning, Figure 5E shows that Snf2is preferentially enriched at Ox genes (P = 3 × 10⁻¹⁹), in-cluding genes regulated by both SAGA and TFIID (Fig.5F), which is in agreement with our finding that nucleo-some remodeling also occurs at TFIID-enriched promoters(Fig 3E,F; Supplemental Fig. 1). Like many chromatin re-modeling factors, deletion of Snf2 has pleotropic effectson gene expression, making it difficult to understandhow or whether chromatin remodeling is used to regulatethe coherent expression of large sets of genes. However,when evaluated with respect to the YMC, not only didwe find that Snf2 is enriched at Ox genes, but analysisof transcript abundance in snf2Δ mutant cells revealedthat essentially all genes in the Ox cluster require Snf2for maximal expression (Fig 6A–E). Thus, SWI/SNF ap-pears to be a specific regulator of growth genes; consistent
Figure 5. Histone PTMs and chromatin remodelingfactors at dynamic and static promoters. (A) Heatmaps illustrating the association between +1 shiftand features of gene transcription and chromatinstructure. n = 3226. All data are ranked according tothe degree of +1 shift, illustrated at the left. Htz1 en-richment (Weiner et al. 2015), TAF1 depletion (Rheeand Pugh 2012), range of expression, andH3 exchange(Dion et al. 2007) all scale accordingly in relation to +1nucleosome shift. (Right panel) Snf2-enriched regionsfrom Parnell et al. (2015) near the TSS at promotersranked by +1 nucleosome shift. (B) Bar graphs demon-strating the depletion of H4K5ac, H4K8ac, H4K12ac,and Htz1 (Weiner et al. 2015) at +1 nucleosomes at“dynamic” promoters. Error bars represent SEM.(∗∗∗∗) P-value < 0.00001. (C,D) Box plot analysis of +1nucleosome shift associated with promoters boundand not bound by various chromatin remodeling fac-tors. (∗∗∗∗) P-value < 0.00001; (∗∗) P-value < 0.001;(∗) P-value < 0.01. Factor occupancy data are fromYen et al. (2012) (C ) and Parnell et al. (2015) (D). (E)Analysis of Snf2 enrichment at Ox, R/B, R/C, andnoncycling (N/C) promoters; numbers in bracketsrepresent the expected proportions (data are from Par-nell et al. 2015). (F ) Analysis of Snf2 enrichment atTAF1-depleted and TAF1-enriched promoters; num-bers in brackets represent the expected proportions(data are from Parnell et al. 2015).
Nocetti and Whitehouse
666 GENES & DEVELOPMENT
Cold Spring Harbor Laboratory Press on June 19, 2018 - Published by genesdev.cshlp.orgDownloaded from
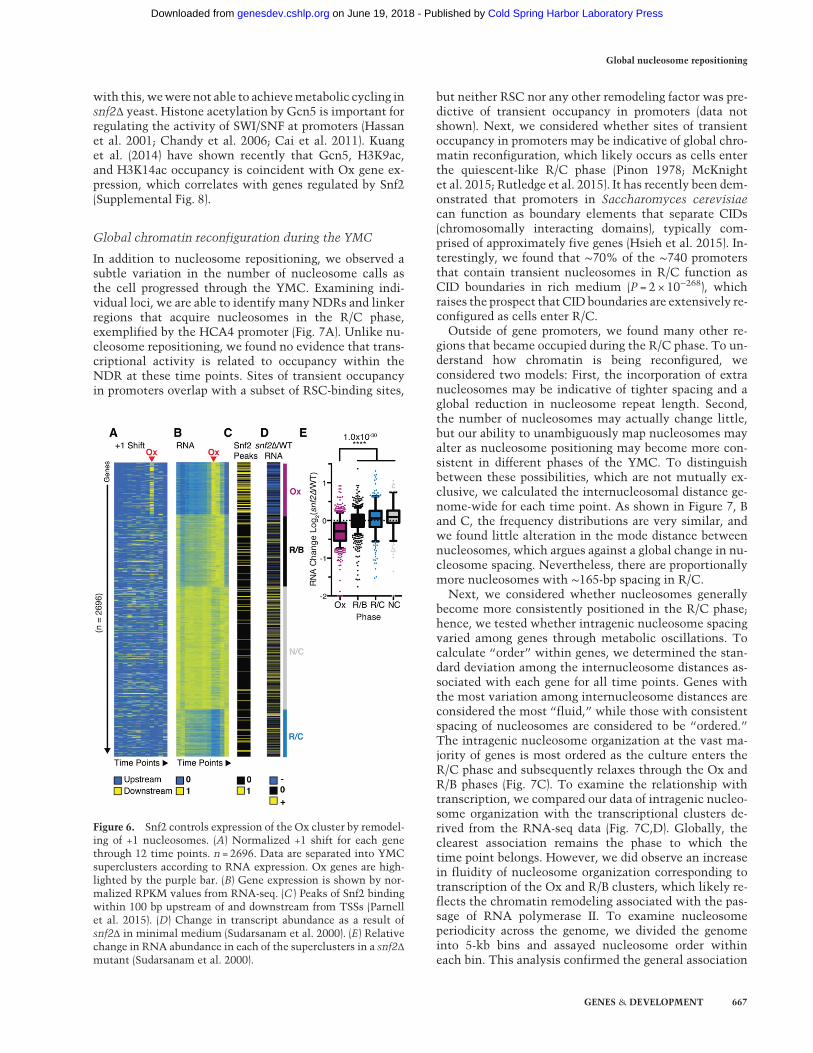
with this, wewere not able to achievemetabolic cycling insnf2Δ yeast. Histone acetylation by Gcn5 is important forregulating the activity of SWI/SNF at promoters (Hassanet al. 2001; Chandy et al. 2006; Cai et al. 2011). Kuanget al. (2014) have shown recently that Gcn5, H3K9ac,and H3K14ac occupancy is coincident with Ox gene ex-pression, which correlates with genes regulated by Snf2(Supplemental Fig. 8).
Global chromatin reconfiguration during the YMC
In addition to nucleosome repositioning, we observed asubtle variation in the number of nucleosome calls asthe cell progressed through the YMC. Examining indi-vidual loci, we are able to identify many NDRs and linkerregions that acquire nucleosomes in the R/C phase,exemplified by the HCA4 promoter (Fig. 7A). Unlike nu-cleosome repositioning, we found no evidence that trans-criptional activity is related to occupancy within theNDR at these time points. Sites of transient occupancyin promoters overlap with a subset of RSC-binding sites,
but neither RSC nor any other remodeling factor was pre-dictive of transient occupancy in promoters (data notshown). Next, we considered whether sites of transientoccupancy in promoters may be indicative of global chro-matin reconfiguration, which likely occurs as cells enterthe quiescent-like R/C phase (Pinon 1978; McKnightet al. 2015; Rutledge et al. 2015). It has recently been dem-onstrated that promoters in Saccharomyces cerevisiaecan function as boundary elements that separate CIDs(chromosomally interacting domains), typically com-prised of approximately five genes (Hsieh et al. 2015). In-terestingly, we found that ∼70% of the ∼740 promotersthat contain transient nucleosomes in R/C function asCID boundaries in rich medium (P = 2 × 10−268), whichraises the prospect that CID boundaries are extensively re-configured as cells enter R/C.Outside of gene promoters, we found many other re-
gions that became occupied during the R/C phase. To un-derstand how chromatin is being reconfigured, weconsidered two models: First, the incorporation of extranucleosomes may be indicative of tighter spacing and aglobal reduction in nucleosome repeat length. Second,the number of nucleosomes may actually change little,but our ability to unambiguously map nucleosomes mayalter as nucleosome positioning may become more con-sistent in different phases of the YMC. To distinguishbetween these possibilities, which are not mutually ex-clusive, we calculated the internucleosomal distance ge-nome-wide for each time point. As shown in Figure 7, Band C, the frequency distributions are very similar, andwe found little alteration in the mode distance betweennucleosomes, which argues against a global change in nu-cleosome spacing. Nevertheless, there are proportionallymore nucleosomes with ∼165-bp spacing in R/C.Next, we considered whether nucleosomes generally
become more consistently positioned in the R/C phase;hence, we tested whether intragenic nucleosome spacingvaried among genes through metabolic oscillations. Tocalculate “order” within genes, we determined the stan-dard deviation among the internucleosome distances as-sociated with each gene for all time points. Genes withthe most variation among internucleosome distances areconsidered the most “fluid,” while those with consistentspacing of nucleosomes are considered to be “ordered.”The intragenic nucleosome organization at the vast ma-jority of genes is most ordered as the culture enters theR/C phase and subsequently relaxes through the Ox andR/B phases (Fig. 7C). To examine the relationship withtranscription, we compared our data of intragenic nucleo-some organization with the transcriptional clusters de-rived from the RNA-seq data (Fig. 7C,D). Globally, theclearest association remains the phase to which thetime point belongs. However, we did observe an increasein fluidity of nucleosome organization corresponding totranscription of the Ox and R/B clusters, which likely re-flects the chromatin remodeling associated with the pas-sage of RNA polymerase II. To examine nucleosomeperiodicity across the genome, we divided the genomeinto 5-kb bins and assayed nucleosome order withineach bin. This analysis confirmed the general association
Figure 6. Snf2 controls expression of the Ox cluster by remodel-ing of +1 nucleosomes. (A) Normalized +1 shift for each genethrough 12 time points. n = 2696. Data are separated into YMCsuperclusters according to RNA expression. Ox genes are high-lighted by the purple bar. (B) Gene expression is shown by nor-malized RPKM values from RNA-seq. (C ) Peaks of Snf2 bindingwithin 100 bp upstream of and downstream from TSSs (Parnellet al. 2015). (D) Change in transcript abundance as a result ofsnf2Δ in minimal medium (Sudarsanam et al. 2000). (E) Relativechange in RNA abundance in each of the superclusters in a snf2Δmutant (Sudarsanam et al. 2000).
Global nucleosome repositioning
GENES & DEVELOPMENT 667
Cold Spring Harbor Laboratory Press on June 19, 2018 - Published by genesdev.cshlp.orgDownloaded from
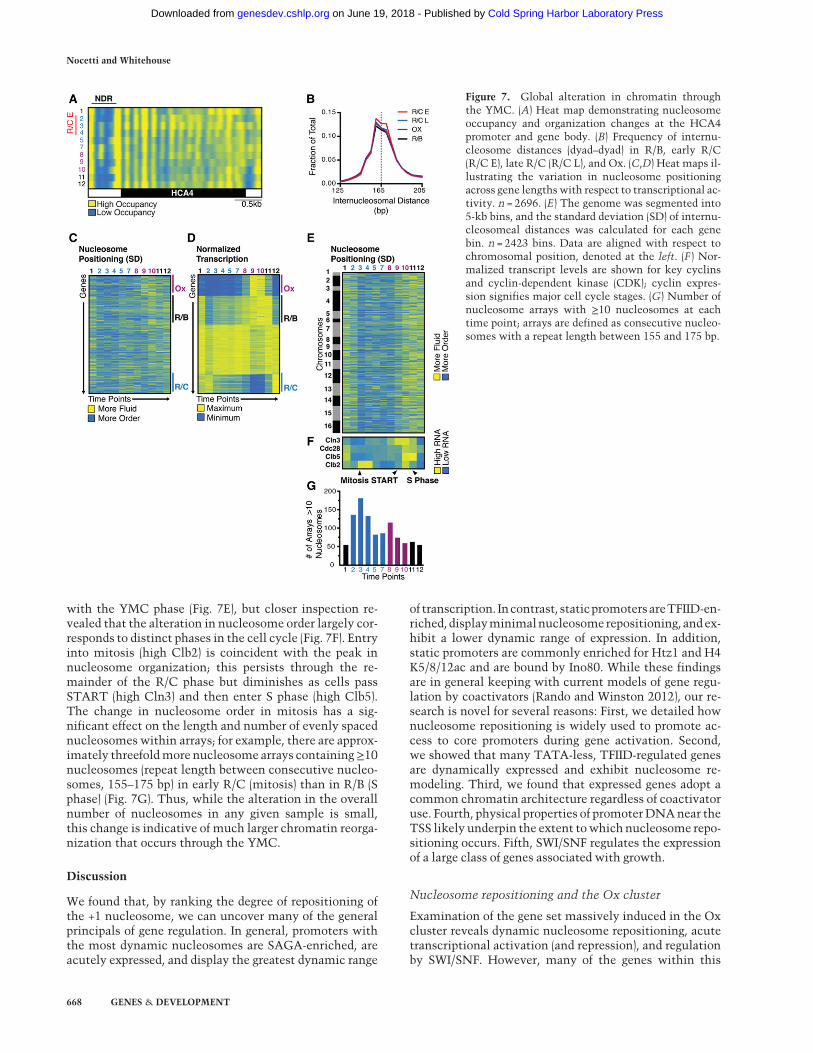
with the YMC phase (Fig. 7E), but closer inspection re-vealed that the alteration in nucleosome order largely cor-responds to distinct phases in the cell cycle (Fig. 7F). Entryinto mitosis (high Clb2) is coincident with the peak innucleosome organization; this persists through the re-mainder of the R/C phase but diminishes as cells passSTART (high Cln3) and then enter S phase (high Clb5).The change in nucleosome order in mitosis has a sig-nificant effect on the length and number of evenly spacednucleosomes within arrays; for example, there are approx-imately threefoldmore nucleosome arrays containing≥10nucleosomes (repeat length between consecutive nucleo-somes, 155–175 bp) in early R/C (mitosis) than in R/B (Sphase) (Fig. 7G). Thus, while the alteration in the overallnumber of nucleosomes in any given sample is small,this change is indicative of much larger chromatin reorga-nization that occurs through the YMC.
Discussion
We found that, by ranking the degree of repositioning ofthe +1 nucleosome, we can uncover many of the generalprincipals of gene regulation. In general, promoters withthe most dynamic nucleosomes are SAGA-enriched, areacutely expressed, and display the greatest dynamic range
of transcription. Incontrast, staticpromotersareTFIID-en-riched,displayminimalnucleosomerepositioning, andex-hibit a lower dynamic range of expression. In addition,static promoters are commonly enriched for Htz1 and H4K5/8/12ac and are bound by Ino80. While these findingsare in general keeping with current models of gene regu-lation by coactivators (Rando and Winston 2012), our re-search is novel for several reasons: First, we detailed hownucleosome repositioning is widely used to promote ac-cess to core promoters during gene activation. Second,we showed that many TATA-less, TFIID-regulated genesare dynamically expressed and exhibit nucleosome re-modeling. Third, we found that expressed genes adopt acommon chromatin architecture regardless of coactivatoruse. Fourth, physical properties of promoterDNAnear theTSS likely underpin the extent towhich nucleosome repo-sitioning occurs. Fifth, SWI/SNF regulates the expressionof a large class of genes associated with growth.
Nucleosome repositioning and the Ox cluster
Examination of the gene set massively induced in the Oxcluster reveals dynamic nucleosome repositioning, acutetranscriptional activation (and repression), and regulationby SWI/SNF. However, many of the genes within this
Figure 7. Global alteration in chromatin throughthe YMC. (A) Heat map demonstrating nucleosomeoccupancy and organization changes at the HCA4promoter and gene body. (B) Frequency of internu-cleosome distances (dyad–dyad) in R/B, early R/C(R/C E), late R/C (R/C L), and Ox. (C,D) Heat maps il-lustrating the variation in nucleosome positioningacross gene lengths with respect to transcriptional ac-tivity. n = 2696. (E) The genome was segmented into5-kb bins, and the standard deviation (SD) of internu-cleosomeal distances was calculated for each genebin. n = 2423 bins. Data are aligned with respect tochromosomal position, denoted at the left. (F ) Nor-malized transcript levels are shown for key cyclinsand cyclin-dependent kinase (CDK); cyclin expres-sion signifies major cell cycle stages. (G) Number ofnucleosome arrays with ≥10 nucleosomes at eachtime point; arrays are defined as consecutive nucleo-somes with a repeat length between 155 and 175 bp.
Nocetti and Whitehouse
668 GENES & DEVELOPMENT
Cold Spring Harbor Laboratory Press on June 19, 2018 - Published by genesdev.cshlp.orgDownloaded from

cluster (i.e., RP genes and other genes associated withgrowth) are classically described as TFIID-dependenthousekeeping genes, which are generally considered tobe constitutively expressed (Huisinga and Pugh 2004).This apparent discrepancy can be explained in two ways:First, dynamic gene expression events are typicallymasked by growing cells in batches, which is the predom-inantmeans of cell cultivation. Second, the duration of ex-pression of a given gene will be influenced by factors suchas growth conditions and availability of nutrients. Further-more, coactivator use at a promoter may be somewhatplastic and may vary depending on the nature of the tran-scriptional response required. Indeed, coactivator use isnot absolute: SAGA and TFIID have been shown to actsequentially (Ghosh and Pugh 2011), and many gene pro-moters, including RP genes, are enriched for both SAGAand TFIID (Ohtsuki et al. 2010). Moreover, expression ofa large fraction of all yeast genes was found to be regulatedby either complex (Lee et al. 2000; Huisinga and Pugh2004). Thus, in order to achieve acute control of gene ex-pression during the YMC, Ox genes may initially useSAGA- and Gcn5-mediated histone acetylation for rapidactivation (Supplemental Fig. 8), followed by TFIID for aperiod of consistent expression.The requirement for SWI/SNF for the activation of
growth genes in the Ox cluster may be particularly neces-sary when cells are cultivated in medium that is limitingin nutrients. Interestingly, we show that Snf2 is enrichedat growth genes when cells are cultured in minimal medi-um but found that this enrichment is less apparent whendata from rich medium are used. In the case of the YMC,cells transition through distinct phases in sequence. Im-portantly, the acute Ox phase is preceded by a compara-tively lengthy R/C phase. Here, gene transcription islimited; this phase displays many hallmarks of quies-cence, and the transcriptional landscape most closely re-sembles that of a saturated culture (Supplemental Fig. 2;Shi et al. 2010). The rapid conversion from R/C to growthhas been shown to be triggered by acetyl CoA levels (Caiet al. 2011; Kuang et al. 2014), and we found that genes ac-tivated at this stage experience significant remodeling ofpromoter nucleosomes by SWI/SNF. Thus, under YMCgrowth conditions, SAGA and SWI/SNF may be requiredfor the rapid conversion of a “quiescent” chromatin orga-nization into a state conducive to gene expression. Cellscultured in rich medium presumably only transiently in-activate the Ox cluster and therefore may be less relianton SWI/SNF and SAGA. Such a mechanism is in keepingwith previous findings that SWI/SNF and Gcn5 are re-quired for activation of the GAL1 and PHO5 genes in mi-tosis (when chromatin structure is likely more repressive)but not in G1 (Krebs et al. 2000; Neef and Kladde 2003).Histone acetylation, nucleosome remodeling, and gene
transcription of the Ox cluster occur within a short timeframe, which shows that robust mechanisms for activa-tion and repression are used. Our data are consistentwith SWI/SNF acting as a nucleosome-sliding machineto reposition nucleosomes away from the core promoter;such a mechanism agrees very well with biochemicalcharacterization of SWI/SNF (Whitehouse et al. 1999).
Gcn5 appears intimately involved in the regulation of Oxgenes (Cai et al. 2011; Kuang et al. 2014), and it is note-worthy thathistone acetylationbyGcn5 stimulatesnucle-osome binding and remodeling by SWI/SNF (Chandy et al.2006; Chatterjee et al. 2011); moreover, Snf2 and Gcn5show pronounced synthetic interactions (Roberts andWinston 1997). SWI/SNF is also known to be recruited byacidic transcriptional activators,which interactwithmul-tiple subunits, including Snf2 (Yudkovsky et al. 1999;Neely et al. 2002; Prochasson et al. 2003). While the iden-tity of the transcription activators for many Ox clustergenes is unknown, RP genes, at which Snf2 is strongly en-riched (Shivaswamy and Iyer 2008; Parnell et al. 2015), areactivated by Ifh1, which contains a potent acidic tran-scriptional activation domain (Schawalder et al. 2004). In-terestingly, the functions of both SWI/SNF and Ifh1 arenegatively regulated by acetylation mediated by Gcn5(Kim et al. 2010; Downey et al. 2013); thus, protein acety-lation likely has a complex role in regulating chromatinremodeling during expression of Ox genes.
The YMC and global chromatin organization
Chromatin is globally altered as cells progress through theYMC: First, we found that manyNDRs become occupied.Second, we show that nucleosomes become more consis-tently spaced during R/C. The increased occupancy ofNDRs appears to occur predominantly at previously de-scribed boundary elements, which is likely indicative ofglobal chromosome and transcriptional restructuringthat occurs in R/C. While our data are most consistentwith extra nucleosomes being deposited within theNDRs, it is evident that these are highly labile entities,and it remains entirely possible that protein complexesother than nucleosomes occupy and protect these regions.We also found that nucleosome positioning becomesmore consistent during the length of R/C, which we spec-ulate is conducive to the generation of compact chromatinstructures. Interestingly, entry into R/C is coordinatedwith mitosis, at which time chromosomes are highlycompact. Thus, the ordered nucleosome arrays thatwe de-tected may promote internucleosomal interactions to in-duce chromosomal condensation (Wilkins et al. 2014).Given the recent finding that a decision to enter quies-cence is made at mitotic exit (Spencer et al. 2013), it isnoteworthy that mitosis coincides with entry into thequiescent-like R/C phase. Moreover, the chromosome re-configuration that occurs during quiescence (Rutledgeet al. 2015) is broadly similar to that which occurs in mi-tosis (Naumova et al. 2013). Thus, cells entering quies-cence may maintain a form of the condensed “mitotic”chromosomes rather than establish the complex decon-densed organization found in G1.
Materials and methods
Metabolic cycling of CEN.PK
The S. cerevisiae strain CEN.PK was used for these studies(MATa; URA3; TRP1; LEU2; HIS3; MAL2-8C; SUC2). YMC me-diumwas prepared in batches of 10 L according to the recipe pub-lished by Tu et al. (2005). First, 9 L of medium containing all
Global nucleosome repositioning
GENES & DEVELOPMENT 669
Cold Spring Harbor Laboratory Press on June 19, 2018 - Published by genesdev.cshlp.orgDownloaded from
components except glucose was sterilized by autoclaving for 1 h.Subsequently, 1 L of 10% glucose (filter sterilized) was added tobring the volume to 10 L. Additionally, 5 mL of Antifoam 204(Sigma) was added to a final concentration of 0.5 ml/L. YMCme-dium (1.5 L) was added to the sterile fermenter (Labfors 5), andthepHof themediumwasbrought topH3.4withNaOH.Mediuminside the fermenter was brought to 30°C, and a saturated starterculture of 15 mL of CEN.PK yeast grown in YPD was spundown, washed with sterile ddH20, and added to the medium inthe fermenter. Air was pumped into the culture at a rate of 1.5 Lper minute, the stirrer was set to 600 rpm, and the culture was al-lowed togrowto saturation. Starvationconditionswereallowedtopersist for a minimum of 6 h before the addition of freshmedium.To initiate theoscillations, freshmediumwasadded to thecultureat a rate of 150 mL per hour. Simultaneously, medium waspumped out of the culture tomaintain a constant volume of 1.5 L.
Digestion of chromatin with MNase
At each time point, 5 mL of YMC culture was added to 45 mL of1× PBS and cross-linked with a final concentration of 1% formal-dehyde for 10 min. The cross-linking was quenched with 5 mL of2.5 M glycine for 5 min. Cells were subsequently spun down in50-mL tubes and washed with 50 mL of sterile ddH20.Cell pellets were resuspended in 950 µL of zymolyase digestion
buffer (ZDB: 50mMTris Cl at pH 7.5, 1M sorbitol, 10mMb-mer-captoethanol). Fiftymicroliters of freshly prepared zymolyase sol-ution (10 mg/mL in ZDB) was then added to each sample, anddigestion proceeded for 45 min at 37°C. Spheroplasts were thenpelleted in the microcentrifuge and washed with 1 mL of ZDB.Pellets were then gently resuspended in 1 mL of spheroplastdigestion buffer (SDB: 1 M sorbitol, 50 mM NaCl, 10 mM Trisat pH 8, 5 mM MgCl2, 1 mM CaCl2, 1 mM b-mercaptoethanol,0.075%NP40) and again pelleted in themicrocentrifuge. The pel-lets were then gently resuspended in 0.5 mL of SDB with 50 U ofMNase (Worthington) and gently agitated for 3 min at room tem-perature. Nuclease digestionwas stopped by the addition of 50 µLof 0.5 M EGTA. To remove RNA from each sample, 10 µL of10mg/mLRNase I was added, and RNA degradation was allowedto proceed for at least 30 min at 37°C. Subsequently, 10 µL of 10mg/mL proteinase K was added to each sample and incubated for>3 h at 42°C. To reverse the formaldehyde cross-links, the sam-ples were incubated for >6 h at 65°C. Samples were then phe-nol-extracted and ethanol-precipitated with 1250 µL of ethanoland 10 µL of 3 M sodium acetate. Pellets were precipitated byspinning the samples at high speed in the tabletop centrifugefor 1 h at 4°C. Pellets were then washed with 70% ethanol andspun down for 5 min at room temperature. Residual ethanolwas removed, and the pellets were resuspended in 100 µL of TEbuffer (pH 8.0) and incubated for 1 h at 37°C.
Preparation of DNA sequencing libraries
Five-hundred nanograms of MNase-digested DNA from eachsample was incubated with 10 U of PNK in a reaction containing1× T4 ligase buffer and 1 mM dNTPs for 30 min at 37°C. Threeunits of T4 DNA polymerase was then added to each sample to“repair” the ends, and incubation was allowed to proceed for 15min at 12°C. Subsequently, 1 µL of 0.5 M EDTA was added, andthe reactionwas killed by incubation for 20min at 75°C. Ampurebeads (1.8 vol) were added to each reaction to purify the nucleoso-mal DNA. DNAwas resuspended in 15 µL of TE (pH 8.0) and dAtailed with Taq polymerase. Libraries were prepared with theNEBNext Multiplex kit with oligos for Illumina (E7335S).Barcoded samples were then submitted for sequencing on the
Illumina HiSeq platform by the Sloan Kettering Integrated Geno-mics Operations Core facility.
Mapping and processing of MNase-seq reads
The raw FASTQ paired-end reads were mapped to the S. cerevi-siae genome (version R64-2-1 2014_11_18) using Bowtie2 (Lang-mead and Salzberg 2012) to generate files in the SAM format.SAM files were then converted into BAM files with SAMtools(Li et al. 2009), and the resulting BAM files were then processedwith BEDtools (Quinlan and Hall 2010) to generate files in theBED format. The BED files containing the paired-end read datawere then processed with the iNPS algorithm (Chen et al. 2014)with nomodifications to the standard parameters of the software.
RNA-seq library preparation
RNA from each time point was extracted by using the hot phenolmethod, and libraries were generated with the NEBNext UltraRNA library preparation kit for Illumina (catalog no. E7530L) asper manufacturer’s instructions (Schmitt et al. 1990). Data weremapped and processed using Bowtie, SAMtools, and customPerl scripts.
Definition of +1 nucleosomes
+1 nucleosomeswere defined by their proximity to previously an-notated TSSs (Pelechano et al. 2013). A window of 100 bp was es-tablished around each TSS, ranging from 20 bp upstream of theTSS to 80 bp downstream from the TSS. Nucleosomeswith dyadswithin this window were classified as being +1.
Quantification of +1 shift for heat maps
The range of +1 shift was defined for each promoter by determin-ing the distance in base pairs between the furthest upstream anddownstream positions. The distance of the furthest upstream nu-cleosome from the TSSwas assigned a value of 1, and the distancefrom the TSS of all other +1 positions associated with a promoterwas accordingly assigned a fractional value.
Accession numbers
Sequencing data are available at the Gene Expression Omnibus(http://www.ncbi.nlm.nih.gov/geo) under accession numberGSE77631.
Acknowledgments
We thank Toshi Tsukiyama (Fred Hutchinson Cancer ResearchCenter, Seattle) and members of the Molecular Biology Programand Whitehouse laboratory for discussions and comments onthe manuscript. This work was supported by institutional fundsawarded to I.W., and National Institutes of Health grant P30CA008748 (Memorial Sloan Kettering Cancer Center). N.N. andI.W. designed the experiments, N.N. performed the experiments,and N.N. and I.W. analyzed the data and wrote the paper.
References
AltafM, Auger A,Monnet-Saksouk J, Brodeur J, Piquet S, CrametM, Bouchard N, Lacoste N, Utley RT, Gaudreau L, et al. 2010.NuA4-dependent acetylation of nucleosomal histones H4 andH2A directly stimulates incorporation of H2A.Z by the SWR1complex. J Biol Chem 285: 15966–15977.
Anderson JD, ThastromA,Widom J. 2002. Spontaneous access ofproteins to buried nucleosomal DNA target sites occurs via amechanism that is distinct from nucleosome translocation.Mol Cell Biol 22: 7147–7157.
Nocetti and Whitehouse
670 GENES & DEVELOPMENT
Cold Spring Harbor Laboratory Press on June 19, 2018 - Published by genesdev.cshlp.orgDownloaded from
Badis G, Chan ET, van Bakel H, Pena-Castillo L, Tillo D, Tsui K,Carlson CD, Gossett AJ, Hasinoff MJ, Warren CL, et al. 2008.A library of yeast transcription factor motifs reveals a wide-spread function for Rsc3 in targeting nucleosome exclusionat promoters. Mol Cell 32: 878–887.
Cai L, Tu BP. 2012. Driving the cell cycle through metabolism.Annu Rev Cell Dev Biol 28: 59–87.
Cai L, Sutter BM, Li B, Tu BP. 2011. Acetyl-CoA induces cellgrowth and proliferation by promoting the acetylation of his-tones at growth genes. Mol Cell 42: 426–437.
Chambers AL, Downs JA. 2012. The RSC and INO80 chromatin-remodeling complexes in DNA double-strand break repair.Prog Mol Biol Transl Sci 110: 229–261.
Chandy M, Gutierrez JL, Prochasson P, Workman JL. 2006. SWI/SNF displaces SAGA-acetylated nucleosomes. Eukaryot Cell5: 1738–1747.
Chatterjee N, Sinha D, Lemma-Dechassa M, Tan S, Shogren-KnaakMA, Bartholomew B. 2011. Histone H3 tail acetylationmodulates ATP-dependent remodeling through multiplemechanisms. Nucleic Acids Res 39: 8378–8391.
ChenW, Liu Y, Zhu S, GreenCD,Wei G, Han JD. 2014. Improvednucleosome-positioning algorithm iNPS for accurate nucleo-some positioning from sequencing data. Nat Commun 5:4909.
Dion MF, Kaplan T, Kim M, Buratowski S, Friedman N, RandoOJ. 2007. Dynamics of replication-independent histone turn-over in budding yeast. Science 315: 1405–1408.
Downey M, Knight B, Vashisht AA, Seller CA, Wohlschlegel JA,Shore D, Toczyski DP. 2013. Gcn5 and sirtuins regulate acet-ylation of the ribosomal protein transcription factor Ifh1.CurrBiol 23: 1638–1648.
Eaton ML, Galani K, Kang S, Bell SP, MacAlpine DM. 2010. Con-served nucleosome positioning defines replication origins.Genes Dev 24: 748–753.
GanguliD, Chereji RV, Iben JR, ColeHA,ClarkDJ. 2014. RSC-de-pendent constructive and destructive interference betweenopposing arrays of phased nucleosomes in yeast. GenomeRes 24: 1637–1649.
Gasch AP, Spellman PT, Kao CM, Carmel-Harel O, Eisen MB,Storz G, Botstein D, Brown PO. 2000. Genomic expressionprograms in the response of yeast cells to environmentalchanges. Mol Biol Cell 11: 4241–4257.
Ghosh S, Pugh BF. 2011. Sequential recruitment of SAGA andTFIID in a genomic response to DNA damage in Saccharomy-ces cerevisiae. Mol Cell Biol 31: 190–202.
Gkikopoulos T, Schofield P, Singh V, Pinskaya M, Mellor J,Smolle M, Workman JL, Barton GJ, Owen-Hughes T.2011. A role for Snf2-related nucleosome-spacing enzymesin genome-wide nucleosome organization. Science 333:1758–1760.
Hartley PD, Madhani HD. 2009. Mechanisms that specify pro-moter nucleosome location and identity. Cell 137: 445–458.
Hassan AH, Neely KE, Workman JL. 2001. Histone acetyltrans-ferase complexes stabilize swi/snf binding to promoter nucle-osomes. Cell 104: 817–827.
Hsieh TH, Weiner A, Lajoie B, Dekker J, Friedman N, Rando OJ.2015.Mapping nucleosome resolution chromosome folding inyeast by Micro-C. Cell 162: 108–119.
Hughes AL, Jin Y, Rando OJ, Struhl K. 2012. A functional evolu-tionary approach to identify determinants of nucleosome po-sitioning: a unifying model for establishing the genome-widepattern. Mol Cell 48: 5–15.
Huisinga KL, Pugh BF. 2004. A genome-wide housekeeping rolefor TFIID and a highly regulated stress-related role for SAGAin Saccharomyces cerevisiae. Mol Cell 13: 573–585.
Jiang C, Pugh BF. 2009. A compiled and systematic referencemapof nucleosome positions across the Saccharomyces cerevisiaegenome. Genome Biol 10: R109.
Jorgensen P, Rupes I, Sharom JR, Schneper L, Broach JR, TyersM.2004. A dynamic transcriptional network communicatesgrowth potential to ribosome synthesis and critical cell size.Genes Dev 18: 2491–2505.
Kaplan N, Moore IK, Fondufe-Mittendorf Y, Gossett AJ, Tillo D,Field Y, LeProust EM, Hughes TR, Lieb JD, Widom J, et al.2009. The DNA-encoded nucleosome organization of a eu-karyotic genome. Nature 458: 362–366.
Kim JH, Saraf A, Florens L, Washburn M, Workman JL. 2010.Gcn5 regulates the dissociation of SWI/SNF from chromatinby acetylation of Swi2/Snf2. Genes Dev 24: 2766–2771.
Klevecz RR, Bolen J, Forrest G, Murray DB. 2004. A genomewideoscillation in transcription gates DNA replication and cell cy-cle. Proc Natl Acad Sci 101: 1200–1205.
Krebs JE, Fry CJ, Samuels ML, Peterson CL. 2000. Global role forchromatin remodeling enzymes in mitotic gene expression.Cell 102: 587–598.
Kuang Z, Cai L, Zhang X, Ji H, Tu BP, Boeke JD. 2014. High-tem-poral-resolution view of transcription and chromatin statesacross distinct metabolic states in budding yeast. Nat StructMol Biol 21: 854–863.
Langmead B, Salzberg SL. 2012. Fast gapped-read alignment withBowtie 2. Nat Methods 9: 357–359.
Lee TI, CaustonHC,Holstege FC, ShenWC,HannettN, JenningsEG, Winston F, Green MR, Young RA. 2000. Redundant rolesfor the TFIID and SAGA complexes in global transcription.Nature 405: 701–704.
Lee CK, Shibata Y, Rao B, Strahl BD, Lieb JD. 2004. Evidence fornucleosome depletion at active regulatory regions genome-wide. Nat Genet 36: 900–905.
Li H, Handsaker B, Wysoker A, Fennell T, Ruan J, Homer N,Marth G, Abecasis G, Durbin R, 1000 Genome Project DataProcessing Subgroup. 2009. The Sequence Alignment/Mapformat and SAMtools. Bioinformatics 25: 2078–2079.
Luger K, Mader AW, Richmond RK, Sargent DF, Richmond TJ.1997. Crystal structure of the nucleosome core particle at2.8 A resolution. Nature 389: 251–260.
Mavrich TN, Ioshikhes IP, Venters BJ, Jiang C, Tomsho LP, Qi J,Schuster SC, Albert I, Pugh BF. 2008. A barrier nucleosomemodel for statistical positioning of nucleosomes throughoutthe yeast genome. Genome Res 18: 1073–1083.
McKnight JN, Boerma JW, Breeden LL, Tsukiyama T. 2015. Glob-al promoter targeting of a conserved lysine deacetylase fortranscriptional shutoff during quiescence entry. Mol Cell 59:732–743.
Moreau JL, Lee M, Mahachi N, Vary J, Mellor J, Tsukiyama T,Goding CR. 2003. Regulated displacement of TBP from thePHO8 promoter in vivo requires Cbf1 and the Isw1 chromatinremodeling complex. Mol Cell 11: 1609–1620.
NaumovaN, ImakaevM, FudenbergG, Zhan Y, Lajoie BR,MirnyLA, Dekker J. 2013. Organization of themitotic chromosome.Science 342: 948–953.
Neef DW, Kladde MP. 2003. Polyphosphate loss promotes SNF/SWI- and Gcn5-dependent mitotic induction of PHO5. MolCell Biol 23: 3788–3797.
Neely KE, Hassan AH, Brown CE, Howe L, Workman JL. 2002.Transcription activator interactions with multiple SWI/SNFsubunits. Mol Cell Biol 22: 1615–1625.
Novick A, Szilard L. 1950. Description of the chemostat. Science112: 715–716.
Ohtsuki K, Kasahara K, Shirahige K, Kokubo T. 2010. Genome-wide localization analysis of a complete set of Tafs reveals a
Global nucleosome repositioning
GENES & DEVELOPMENT 671
Cold Spring Harbor Laboratory Press on June 19, 2018 - Published by genesdev.cshlp.orgDownloaded from
specific effect of the taf1mutation onTaf2 occupancy and pro-vides indirect evidence for different TFIID conformations atdifferent promoters. Nucleic Acids Res 38: 1805–1820.
Pan J, Sasaki M, Kniewel R, Murakami H, Blitzblau HG, Tisch-field SE, Zhu X, Neale MJ, Jasin M, Socci ND, et al. 2011. Ahierarchical combination of factors shapes the genome-widetopography of yeast meiotic recombination initiation. Cell144: 719–731.
Parnell TJ, Schlichter A, Wilson BG, Cairns BR. 2015. The chro-matin remodelers RSC and ISW1 display functional and chro-matin-based promoter antagonism. Elife 4: e06073.
Pelechano V, Wei W, Steinmetz LM. 2013. Extensive transcrip-tional heterogeneity revealed by isoform profiling. Nature497: 127–131.
Pinon R. 1978. Folded chromosomes in non-cycling yeast cells:evidence for a characteristic g0 form. Chromosoma 67:263–274.
Prochasson P, Neely KE, Hassan AH, Li B, Workman JL. 2003.Targeting activity is required for SWI/SNF function in vivoand is accomplished through two partially redundant activa-tor-interaction domains. Mol Cell 12: 983–990.
Quinlan AR, Hall IM. 2010. BEDTools: a flexible suite of utilitiesfor comparing genomic features. Bioinformatics 26: 841–842.
Raisner RM, Hartley PD, Meneghini MD, Bao MZ, Liu CL,Schreiber SL, Rando OJ, Madhani HD. 2005. Histone variantH2A.Z marks the 5′ ends of both active and inactive genesin euchromatin. Cell 123: 233–248.
RandoOJ,Winston F. 2012.Chromatin and transcription in yeast.Genetics 190: 351–387.
Ranjan A,Mizuguchi G, FitzGerald PC,Wei D,Wang F, Huang Y,Luk E, Woodcock CL, Wu C. 2013. Nucleosome-free regiondominates histone acetylation in targeting SWR1 to promot-ers for H2A.Z replacement. Cell 154: 1232–1245.
Reinke H, Gregory PD, Horz W. 2001. A transient histone hyper-acetylation signal marks nucleosomes for remodeling at thePHO8 promoter in vivo. Mol Cell 7: 529–538.
Rhee HS, Pugh BF. 2012. Genome-wide structure and organiza-tion of eukaryotic pre-initiation complexes. Nature 483:295–301.
Roberts SM,Winston F. 1997. Essential functional interactions ofSAGA, a Saccharomyces cerevisiae complex of Spt, Ada, andGcn5 proteins, with the Snf/Swi and Srb/mediator complexes.Genetics 147: 451–465.
Rutledge MT, Russo M, Belton JM, Dekker J, Broach JR. 2015.The yeast genome undergoes significant topological reorgani-zation in quiescence. Nucleic Acids Res 43: 8299–8313.
Schawalder SB, Kabani M, Howald I, Choudhury U, Werner M,Shore D. 2004. Growth-regulated recruitment of the essentialyeast ribosomal protein gene activator Ifh1. Nature 432:1058–1061.
SchmittME, BrownTA, Trumpower BL. 1990. A rapid and simplemethod for preparation of RNA from Saccharomyces cerevi-siae. Nucleic Acids Res 18: 3091–3092.
Shi L, Sutter BM, Ye X, Tu BP. 2010. Trehalose is a key determi-nant of the quiescent metabolic state that fuels cell cycleprogression upon return to growth. Mol Biol Cell 21:1982–1990.
ShivaswamyS, Iyer VR. 2008. Stress-dependent dynamics of glob-al chromatin remodeling in yeast: dual role for SWI/SNF in theheat shock stress response. Mol Cell Biol 28: 2221–2234.
Shivaswamy S, BhingeA, Zhao Y, Jones S, HirstM, Iyer VR. 2008.Dynamic remodeling of individual nucleosomes across a eu-karyotic genome in response to transcriptional perturbation.PLoS Biol 6: e65.
Silverman SJ, Petti AA, Slavov N, Parsons L, Briehof R, ThibergeSY, Zenklusen D, Gandhi SJ, Larson DR, Singer RH, et al.2010. Metabolic cycling in single yeast cells from unsynchro-nized steady-state populations limited on glucose or phos-phate. Proc Natl Acad Sci 107: 6946–6951.
Spencer SL, Cappell SD, Tsai FC, Overton KW, Wang CL, MeyerT. 2013. The proliferation-quiescence decision is controlledby a bifurcation in CDK2 activity at mitotic exit. Cell 155:369–383.
Steger DJ, Haswell ES, Miller AL, Wente SR, O’Shea EK. 2003.Regulation of chromatin remodeling by inositol polyphos-phates. Science 299: 114–116.
Sudarsanam P, Iyer VR, Brown PO, Winston F. 2000. Whole-ge-nome expression analysis of snf/swi mutants of Saccharomy-ces cerevisiae. Proc Natl Acad Sci 97: 3364–3369.
Tirosh I, Sigal N, Barkai N. 2010. Widespread remodeling of mid-coding sequence nucleosomes by Isw1.Genome Biol 11: R49.
Tolkunov D, Zawadzki KA, Singer C, Elfving N, Morozov AV,Broach JR. 2011. Chromatin remodelers clear nucleosomesfrom intrinsically unfavorable sites to establish nucleosome-depleted regions at promoters. Mol Biol Cell 22: 2106–2118.
Tu BP, Kudlicki A, Rowicka M, McKnight SL. 2005. Logic of theyeast metabolic cycle: temporal compartmentalization of cel-lular processes. Science 310: 1152–1158.
Voss TC, Hager GL. 2014. Dynamic regulation of transcriptionalstates by chromatin and transcription factors. Nat Rev Genet15: 69–81.
Weiner A, Hsieh TH, Appleboim A, Chen HV, Rahat A, Amit I,Rando OJ, Friedman N. 2015. High-resolution chromatin dy-namics during a yeast stress response. Mol Cell 58: 371–386.
Whitehouse I, Flaus A, Cairns BR, White MF, Workman JL,Owen-Hughes T. 1999. Nucleosome mobilization catalysedby the yeast SWI/SNF complex. Nature 400: 784–787.
Whitehouse I, Rando OJ, Delrow J, Tsukiyama T. 2007. Chroma-tin remodelling at promoters suppresses antisense transcrip-tion. Nature 450: 1031–1035.
Wilkins BJ, Rall NA, Ostwal Y, Kruitwagen T, Hiragami-HamadaK, Winkler M, Barral Y, Fischle W, Neumann H. 2014. A cas-cade of histone modifications induces chromatin condensa-tion in mitosis. Science 343: 77–80.
WuL,Winston F. 1997. Evidence that Snf-Swi controls chromatinstructure over both the TATA and UAS regions of the SUC2promoter in Saccharomyces cerevisiae. Nucleic Acids Res25: 4230–4234.
Yen K, Vinayachandran V, Batta K, Koerber RT, Pugh BF. 2012.Genome-wide nucleosome specificity and directionality ofchromatin remodelers. Cell 149: 1461–1473.
Yudkovsky N, Logie C, Hahn S, Peterson CL. 1999. Recruitmentof the SWI/SNF chromatin remodeling complex by transcrip-tional activators. Genes Dev 13: 2369–2374.
Zhang H, Roberts DN, Cairns BR. 2005. Genome-wide dynamicsof Htz1, a histone H2A variant that poises repressed/basalpromoters for activation through histone loss. Cell 123:219–231.
Zhang Y, Moqtaderi Z, Rattner BP, Euskirchen G, Snyder M,Kadonaga JT, Liu XS, Struhl K. 2009. Intrinsic histone-DNAinteractions are not the major determinant of nucleosome po-sitions in vivo. Nat Struct Mol Biol 16: 847–852.
Zhang L, Ma H, Pugh BF. 2011a. Stable and dynamic nucleosomestates during a meiotic developmental process. Genome Res21: 875–884.
Zhang Z, Wippo CJ, Wal M, Ward E, Korber P, Pugh BF. 2011b.A packing mechanism for nucleosome organization reconsti-tuted across a eukaryotic genome. Science 332: 977–980.
Nocetti and Whitehouse
672 GENES & DEVELOPMENT
Cold Spring Harbor Laboratory Press on June 19, 2018 - Published by genesdev.cshlp.orgDownloaded from
10.1101/gad.274910.115Access the most recent version at doi: originally published online March 10, 201630:2016, Genes Dev.
Nicolas Nocetti and Iestyn Whitehouse Nucleosome repositioning underlies dynamic gene expression
Material
Supplemental
http://genesdev.cshlp.org/content/suppl/2016/03/09/gad.274910.115.DC1
References
http://genesdev.cshlp.org/content/30/6/660.full.html#ref-list-1
This article cites 78 articles, 31 of which can be accessed free at:
License
Commons Creative
.http://creativecommons.org/licenses/by-nc/4.0/at Creative Commons License (Attribution-NonCommercial 4.0 International), as described
). After six months, it is available under ahttp://genesdev.cshlp.org/site/misc/terms.xhtmlsix months after the full-issue publication date (see This article is distributed exclusively by Cold Spring Harbor Laboratory Press for the first
ServiceEmail Alerting
click here.right corner of the article or
Receive free email alerts when new articles cite this article - sign up in the box at the top
© 2016 Nocetti and Whitehouse; Published by Cold Spring Harbor Laboratory Press
Cold Spring Harbor Laboratory Press on June 19, 2018 - Published by genesdev.cshlp.orgDownloaded from