Nucleoside reverse transcriptase inhibitors possess ... · Nucleoside reverse transcriptase...
38
1 Supplementary Materials for Nucleoside reverse transcriptase inhibitors possess intrinsic anti-inflammatory activity Benjamin J. Fowler, Bradley D. Gelfand, Younghee Kim, Nagaraj Kerur, Valeria Tarallo, Yoshio Hirano, Shoba Amarnath, Daniel H. Fowler, Marta Radwan, Mark T. Young, Keir Pittman, Paul Kubes, Hitesh K. Agarwal, Keykavous A. Parang, David R. Hinton, Ana Bastos-Carvalho, Shengjian Li, Tetsuhiro Yasuma, Takeshi Mizutani, Reo Yasuma, Charles Wright, Jayakrishna Ambati* * Corresponding author. Email: [email protected] This PDF file includes: Materials and Methods Supplementary Text Figs. S1 to S21
Transcript of Nucleoside reverse transcriptase inhibitors possess ... · Nucleoside reverse transcriptase...
1
Supplementary Materials for
Nucleoside reverse transcriptase inhibitors possess intrinsic anti-inflammatory
activity
Benjamin J. Fowler, Bradley D. Gelfand, Younghee Kim, Nagaraj Kerur, Valeria Tarallo,
Yoshio Hirano, Shoba Amarnath, Daniel H. Fowler, Marta Radwan, Mark T. Young,
Keir Pittman, Paul Kubes, Hitesh K. Agarwal, Keykavous A. Parang, David R. Hinton,
Ana Bastos-Carvalho, Shengjian Li, Tetsuhiro Yasuma, Takeshi Mizutani, Reo Yasuma,
Charles Wright, Jayakrishna Ambati*
* Corresponding author. Email: [email protected]
This PDF file includes:
Materials and Methods
Supplementary Text
Figs. S1 to S21
2
Materials and methods
Mice
Ocular animal experiments were in accordance with the Association for Research
in Vision and Ophthalmology Statement for the Use of Animals in Ophthalmic and
Visual Research. WT C57BL6/J mice were purchased from The Jackson Laboratory and
Pannexin-1-deficient mice were obtained from Genentech. For all procedures, anesthesia
was achieved by intraperitoneal injection of 100 mg/kg ketamine hydrochloride (Ft.
Dodge Animal Health) and 10 mg/kg xylazine (Phoenix Scientific), and pupils were
dilated with topical 1% tropicamide (Alcon Laboratories). Fundus imaging of dilated
mouse eyes was performed on a TRC-50 IX camera (Topcon) linked to a digital imaging
system (Sony). For GVHD experiments, adult female C57BL/6 (B6, H2Kb) and BALB/c
(H2Kd) mice 8- to 10- weeks old were obtained from Frederick Cancer Research Facility.
Mice were maintained in a specific pathogen-free facility, and treated according to an
approved animal protocol. Drinking water was supplemented with ciprofloxacin from day
–1 to day +14 after total body irradiation (TBI). For liver injury model, LysM-eGFP
knock-in mice were a gift from Dr. T. Graf (Albert Einstein University, NY). Animals
were maintained in a specific pathogen-free facility at the University of Calgary Animal
Resource Centre. Experimental animal protocols used in this study were approved by the
University of Calgary Animal Care Committee, and were in compliance with guidelines
from the Canadian Council for Animal Care.
3
Immunolabeling
Mouse RPE/choroid flat mounts were fixed with 4% paraformaldehyde or 100%
methanol, stained with antibodies against zonula occludens-1 (ZO-1) and visualized with
Alexa594 (Invitrogen). All images were obtained using the Leica SP-5 microscope.
Subretinal injection
Subretinal injections (SRI) (1 µL) in mice were performed using an Ito
microsyringe (Ito Corporation). In vivo transfection of plasmids coding for an Alu
sequence (pAlu) or empty control vector (pNull) was achieved using 10% Neuroporter
(Genlantis) as described in (3). For oral administration, d4T was mixed with
carboxymethylcellulose sodium salt (final 0.5%) delivered once daily by oral gavage at
50 or 150 mg/kg. CMC alone was used as vehicle control. For intraperitoneal injection
(subretinal Alu experiment), AZT was dissolved in UPS-grade 1x PBS (Gibco) was
administered twice daily (50 mg/kg/administration; vs. control PBS). Me-d4T was
dissolved in 100% DMSO and administered twice daily (25 mg/kg/administration; vs.
control DMSO). For both oral gavage and intraperitoneal administration, NRTIs (or
control) were delivered starting one day before SRI until six days after SRI.
In vitro transcribed Alu RNA
Alu RNA was synthesized from a linearized plasmid containing a consensus Alu
Y sequence with an adjacent 5’ T7 promoter, subjected to AmpliScribe T7 Flash
Transcription kit (Epicenter) according to the manufacturer’s instructions. Dnase-treated

4
RNA was purified using MEGAclear (Ambion) and integrity monitored by gel
electrophoresis.
Reagents
3TC, AZT, LPS, ATP, and bzATP, were purchased from Sigma. D4T was
purchased from Sigma and Selleckchem. MSU, flagellin, and poly dA:dT were purchased
from Invivogen.
Western blot
Protein samples were run on 4-20% or 4-12% tris-glycine SDS-PAGE gels,
transferred to PVDF membrane (0.2 or 0.45 µm), and blotted with antibodies against
Caspase-1 (1:250, Santa Cruz (sc-514) for mouse BMDM and mouse RPE in vivo
experiments; 1:500, Invitrogen or 1:1000, Abcam for all other experiments); pIRAK4
(1:500, Cell Signaling); Vinculin (1:1,000, Sigma-Aldrich), P2RX7 (1: 1000, Abcam);
IL1B (1: 500, Cell Signaling), IL-18 (1:250, Biovision), or Tubulin (1:1000, Sigma).
Cells were homogenized in RIPA buffer (Sigma) with protease and phosphatase
inhibitors (Roche) or lysed directly in Laemmli buffer (2). For RIPA extraction, protein
concentrations were determined using a Bradford assay kit (Bio-Rad) with bovine serum
albumin as a standard. For analysis of cell culture supernatants, media was collected and
centrifuged for 10 minutes at 1500 rpm. The supernatant was concentrated through a
10,000 MWCO column (Sartorius Biotech), or precipitated with 20% TCA at -20 C,
washed twice with acetone and dried pellet was resuspended in Laemmli buffer and
boiled. Proteins were run on a Novex Tris-glycine 4-20% gel (Invitrogen) and transferred
5
to Immun-Blot PVDF membranes (Bio-Rad) or Immobilon FL PVDF (Millipore).
Primary antibody incubation was performed overnight at 4 °C. Protein loading was
assessed by immunoblotting using an anti-Vinculin antibody. Secondary antibodies
(Santa Cruz, 1:5000; or LICOR, 680/800 nm IRdyes, 1:20000) were used for 1 hour at
room temperature. The signal was visualized using a luminol detection kit (Santa Cruz)
and captured on UltraCruz ultraradiography film (Santa Cruz) or using the LICOR
Odyssey Imager. Densitometry was performed using ImageJ software (NIH).
Quantitative real-time qPCR
Total DNA was extracted from cells and amplified by real-time quantitative PCR
(Applied Biosystems 7900 HT Fast Real-Time PCR system) with Power SYBR green
Master Mix. Oligonucleotide primers specific for mouse mtDNA COX1 (F 5’ TTC GGA
GCC TGA GCG GGA AT 3’; R 5’ ATG CCT GCG GCT AGC ACT GG 3’) were used
and normalized to a genomic DNA exon-intron junction (F 5’ GTG AGG CGG GCT
CCC TGC TG 3’; R 5’ CTT CGA ACG CGG AAC GGG ACC 3’). The qPCR cycling
conditions were 50 °C for 2 min, 95 °C for 10 min followed by 40 cycles of a two-step
amplification program (95 °C for 15 s and 58 °C for 1 min). At the end of the
amplification, melting curve analysis was applied using the dissociation protocol from the
Sequence Detection system to exclude contamination with unspecific PCR products.
Relative expressions of target genes were determined by the 2–ΔΔCt method.
6
Primary human RPE cell isolation and culture
RPE cells were isolated from human fetal eyes of 18–20 weeks gestation
(Novogenixlabs, Los Angeles CA) by soaking the eyes in PBS containing 5%
penicillin/streptomycin, cleaning off excess connective tissue, and removing the cornea,
lens, vitreous, and retina. The RPE choroidal/scleral tissue was placed in a 2% Dispase
solution (Life Technologies, Grand Island, NY) in PBS for 20 min at 37 °C, mixed by
pipetting up and down for 30 sec, and filtered by passing through a 70 µm, then a 40 µm
filter. RPE cells were recovered by centrifugation and resuspended in Dulbecco’s
minimum essential medium (DMEM) supplemented with 2 mM L-glutamine, 100 U/mL
penicillin, 100 µg/mL streptomycin (VWR International, West Chester, PA) containing at
least 25% heat-inactivated fetal bovine serum (FBS; Irvine Scientific, Santa Ana, CA).
The cells were first plated on laminin-coated plates until ready to be divided; no further
coating was necessary and cells were grown in 10% DMEM. The cells were confirmed to
be RPE cells by immunocytochemical positivity for cytokeratin (>95%) and the lack of
immunoreactivity for endothelial-cell–specific von Willebrand factor (Dako, Carpinteria,
CA) and glial fibrillary acidic protein (Chemicon, Temecula, CA).
Cell culture and transfection experiments
Cell culture of primary human RPE cells was in DMEM with 10% fetal bovine
serum (FBS) or 20% FBS (primary mouse RPE cells) with 100 U/ml
Penicillin/Streptomycin and 2 mM L-Glutamine, or for ATP/potassium measurements in
DMEM without serum. Transfections were performed according to the manufacturers
instructions (Lipofectamine 2000, Invitrogen). NRTIs were administered 20 minutes
7
before Alu RNA transfection and added again upon replacement of P/S-containing media
at 8 hours. Similarly, 10Panx peptide (Tocris 3348) or scrambled 10Panx control (Tocris
3708) were administered at 240 µM. Primary bone marrow-derived macrophages were
isolated, and cultured as described previously (41) , and serum starved in 1% FBS-
containing Isocove’s DMEM overnight prior to LPS stimulation. NRTIs were added 30
minutes prior to LPS stimulation and again 30 minutes prior to activation signal (ATP,
nigericin, MSU, flagellin, poly dA:dT). LPS was added at 1000 ng/mL for 3–4 hours
prior to ATP/nigericin as previously described (42); 500 ng/mL to flagellin (15); 200
ng/mL to poly dA:dT (43); and 100 ng/mL to MSU (25). Cell lysates were collected at 30
minutes after activation signal for ATP (5 mM) and nigericin (20 µM); 6 hours for MSU
(250 µg/mL); 4 hours for Flagellin (20 µg/mL transfected with DOTAP) and poly dA:dT
(1.5 µg/mL transfected with Lipofectamine). Raji TK-/+ cells were cultured in RPMI with
10% FBS. For electrophysiology experiments, human embryonic kidney 293 (HEK293)
cells were maintained in Dulbecco’s Modified Eagle Medium: Nutrient Mixture F12
(DMEM/F12) supplemented with 10% FBS, 100 U/ml Penicillin/Streptomycin and 2 mM
L-Glutamine. Cells were co-transfected with 1 µg plasmid DNA expressing rP2X7 or
mP2X7 and 0.1 µg plasmid DNA expressing eGFP using Lipofectamine2000 (Invitrogen,
Paisley, UK) according to manufacturer’s protocol. 24 hrs after transfection cells were
trypsinised and transferred onto sterile poly-L-Lysine (Sigma-Aldrich, Gillingham, UK)
coated 13 mm coverslips and incubated overnight prior to the electrophysiology
recordings. For lentivirus-GFP experiments, 100 µM d4T or me-d4T was added to HeLa
cells two hours before addition of lentivirus-GFP at a MOI of 10. At 24 hours an
additional 100 µM d4T or me-d4T was added to cells, and at 48 hours cells were briefly
8
fixed in 4% PFA before imaging. For cell counting of GFP-positive cells, four fields were
chosen at random for each condition, images were processed at the same threshold, and
GFP-positive cells were counted using ImageJ.
Northern blot
Total RNA from biotin-UTP Alu RNA-transfected cells was extracted using
Trizol reagent (Invitrogen). RNA samples were run on 10% TBE-urea gels (BioRad)
according to the manufacturers instructions. Samples were transferred and UV cross-
linked to a HyBond N+ nylon membrane and blotted for u6 using a biotinylated
oligonucleotide probe synthesized by IDT (5’ CACGAATTTGCGTGTCATCCTT-Biotin
3’). Blots were developed with the Thermo Pierce chemiluminescent nucleic acid
detection kit.
Liquid chromatography and Mass spectrometry
HPLC was run using a 2 Varian ProStar model 210 HPLC solvent delivery
module and a Phenomenex Kinetix C-18 column (100 mm x 2.1 mm x 2.6 µM). Solvent
compositions were (A): 3 mM Ammonium formate and 10 mM N,N-dimethylhexylamine
in H20; (B): 1:1 acetonitrile:H2O with 3 mM Ammonium formate and 10 mM N,N-
dimethylhexylamine. HPLC mobile phase and flow rate were:

9
Time (min) A % B% Flow (mL/min)
0 95 5 0.2
3 95 5 0.2
25 40 60 0.2
26 0 100 0.2
29 0 100 0.2
30 95 5 0.2
40 95 5 0.2
Mass Spectrometry was performed on a Varian 1200 L quadrupole MS/MS. Analytes
were analyzed with electrospray ionization on negative mode. Cell extracts from Raji TK-
/+ cells were prepared by adding 40% acetonitrile/20% methanol/20% water to cell
pellets, incubation at –20 °C for 15 minutes followed by centrifugation at 4 °C for 5
minutes at 20,000 x g. Two sequential extractions were performed per cell pellet, pooled,
and stored at – 80 °C until analysis.
Methoxy-d4T synthesis
Depicted in Supplementary Figure 4.
10
MitoSOx assay
MitoSox dye was obtained from Invitrogen and used according to the
manufacturer’s instructions.
ATP assay
Cell culture supernatant was collected from cells and subjected to Enliten ATP
assay (Promega) according to manufacturer’s instructions.
YO-PRO-1 assay
YO-PRO-1 iodide was from Invitrogen. HEK293 cells stably expressing the
human P2X7 receptor were cultured in G418+ DMEM with 10% fetal bovine serum.
Cells were trypsinized, and pellets were washed twice in 1x HBSS (without calcium and
magnesium). Resuspended cells were plated at 1 x 10⁵ cells/well on a 96 well black-
walled cell culture plates spotted with A438079 or d4T to a concentration 64 µM. Cells
were incubated at 37 °C and 5% CO2 for 30 minutes before addition of bzATP (100 µM)
for 5 minutes, followed by YO-PRO-1 addition (2.5 µM) after which plates were read
immediately for fluorescence (485 ex/530 em) every 30 seconds for 5 minutes in a
BioTek Synergy 4 plate reader.
Electrophysiology
Whole-cell patch-clamp recordings were made at room temperature using
borosilicate glass pipettes (World Precision Instruments, Sarasota, FL, USA) which had
resistances of 3–5 MΩ when filled with a solution containing the following (in mM): 145
11
NaCl, 10 EGTA and 10 HEPES, with the pH adjusted to 7.3 with NaOH. The recording
chamber was continually perfused with extracellular saline solution (ECS) containing (in
mM): 147 NaCl, 2 KCl, 1 MgCl2, 2 CaCl2, 10 HEPES and 13 glucose, with the pH
adjusted to 7.3 with NaOH. To obtain larger whole-cell currents by relieving divalent
cation inhibition of P2X7 receptors (44) , 1 mM ATP, 100 µM d4T and 1 mM ATP + 100
µM d4T were made in ECS with low concentrations of divalent cations (ECS-LD)
containing (in mM): 147 NaCl, 2 KCl, 0.2 CaCl2, 10 HEPES and 13 glucose, with the pH
adjusted to 7.3 with NaOH . Current recordings were made at a holding potential of −60
mV using an Axon Instruments Axopatch Multiclamp 700A amplifier and Digidata
1322A A/D interface (Molecular Devices, Sunnyvale, CA, USA). Agonist applications
were made at 90-s intervals. Compounds were applied to patch-clamped cells by means
of a rapid perfusion system (RSC-160, Biologic, Claix, France), allowing solution
exchange times in the range 20–100 ms.
Bone Marrow Transplant
Bone marrow (BM) cells from B6 mice were harvested and T-cell depleted (T-
depleted; anti-CD90 [Thy1.2] microbeads (Miltenyi Biotec). Host allogeneic recipients
(BALB/c) were conditioned with TBI of 950 cGy. BALB/c mice were rescued with 10M
B6.T-depleted BM (TDBM) cells alone or together with 2.5M bulk T cells (CD4+) from
B6.WT mice. Murine recipients that were reconstituted with TDBM and CD4+ T cells
were additionally treated for 10 days with either saline or stavudine (twice daily 25
mg/kg/administration) via i.p injections; stavudine was initiated at either day –1 or day 0
12
of BMT, as indicated in figure legend. Survival and clinical manifestations of GVHD
were monitored.
Sterile liver inflammation model
Prior to each experiment, d4T (400 mg/kg) or control saline was administered via
jugular vein approximately 20 minutes prior to sterile liver injury. Mice were
anaesthetized with a solution containing ketamine hydrochloride (200 mg/kg) and
xylazine hydrochloride (10 mg/kg), via intraperitoneal injection, per the University of
Calgary Animal Use Protocol. The jugular vein was exposed and cannulated for
administration of additional anaesthetic and for administration of the compound or
vehicle. Following administration of compound or vehicle, a midline laparotomy was
performed and a ~2.5 centimeter diameter section of skin and peritoneum were removed
from the ventral surface of the abdomen, exposing the organs of the peritoneum. An
electro-cautery probe fitted with a 30 gauge needle bent at a 90° angle was used to induce
a single focal injury on the ventral surface of the left lobe of the liver. Two hour
recordings at 4x magnification were undertaken, using both green (LysMeGFP+ cells)
and red (autofluorescence) channels (exposure times of 400 ms respectively). Images
were analyzed using ImageJ software and the number of GFP+ objects per field of view
surrounding the sterile injury site was determined.
Laser-induced choroidal neovascularization
Laser photocoagulation (OcuLight GL, IRIDEX) was performed on both eyes of
mice to induce CNV as previously described (45). Drugs (d4T or me-d4T) were injected

13
into the vitreous humor of mice using a 33-gauge double-caliber needle (Ito Corporation)
once, immediately after laser injury as previously described. Choroidal angiogenesis
volumes were measured by scanning laser confocal microscopy (TCS SP5, Leica) 7 days
after injury as previously reported with 0.7% FITC-conjugated Isolectin B4 (Vector) in
masked fashion (45, 46).
Statistical analysis
Results are expressed as mean + standard error of the mean (SEM), with p values
< 0.05 considered statistically significant. Differences between groups were compared by
Mann-Whitney U test, Student’s t test, one-way ANOVA with Tukey’s post-hoc test, or
two-way ANOVA with Student-Newman-Keuls post-hoc test, as appropriate, and two-
tailed p values are reported. Survival analysis was performed according to the Kaplan-
Meier method and survival curves were compared using log-rank test. Fisher's exact test
(two-tailed) was performed for fundus photographs on pAlu vs. pAlu + NRTI groups.
Fundus photographs were de-identified and graded in a binary “yes” or “no” readout in
terms of RPE degeneration by a retina specialist. Typical induction of RPE degeneration
by Alu was about 25% of the visible area of the fundus photograph.
14
Supplementary Text
Author Contributions
B.J.F., B.D.G., Y.K., N.K., V.T., Y.H., S.A., M.R., M.T.Y., K. Pittman, A.B.C.,
T.Y., T.M., R.Y., and C.W. performed experiments. D.R.H. and K. Parang provided
reagents. J.A. and B.J.F. conceived and directed the project, and wrote the paper. All
authors had the opportunity to discuss the results and comment on the manuscript.
15
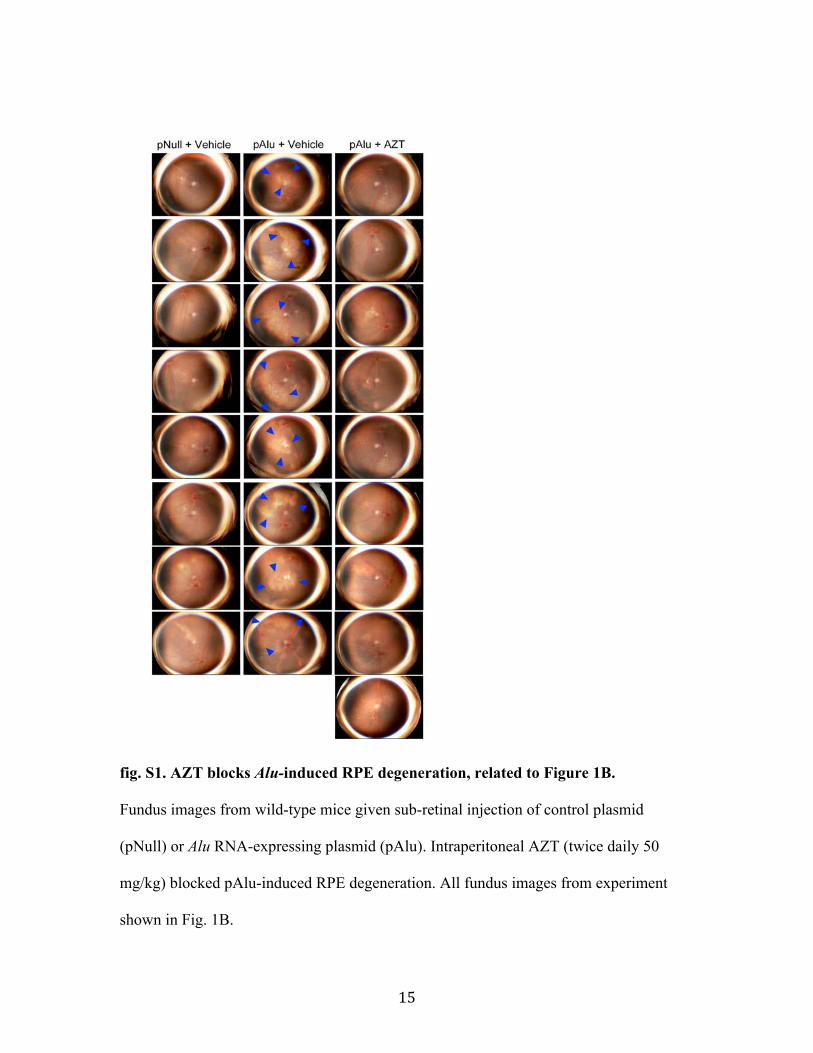
fig. S1. AZT blocks Alu-induced RPE degeneration, related to Figure 1B.
Fundus images from wild-type mice given sub-retinal injection of control plasmid
(pNull) or Alu RNA-expressing plasmid (pAlu). Intraperitoneal AZT (twice daily 50
mg/kg) blocked pAlu-induced RPE degeneration. All fundus images from experiment
shown in Fig. 1B.
16
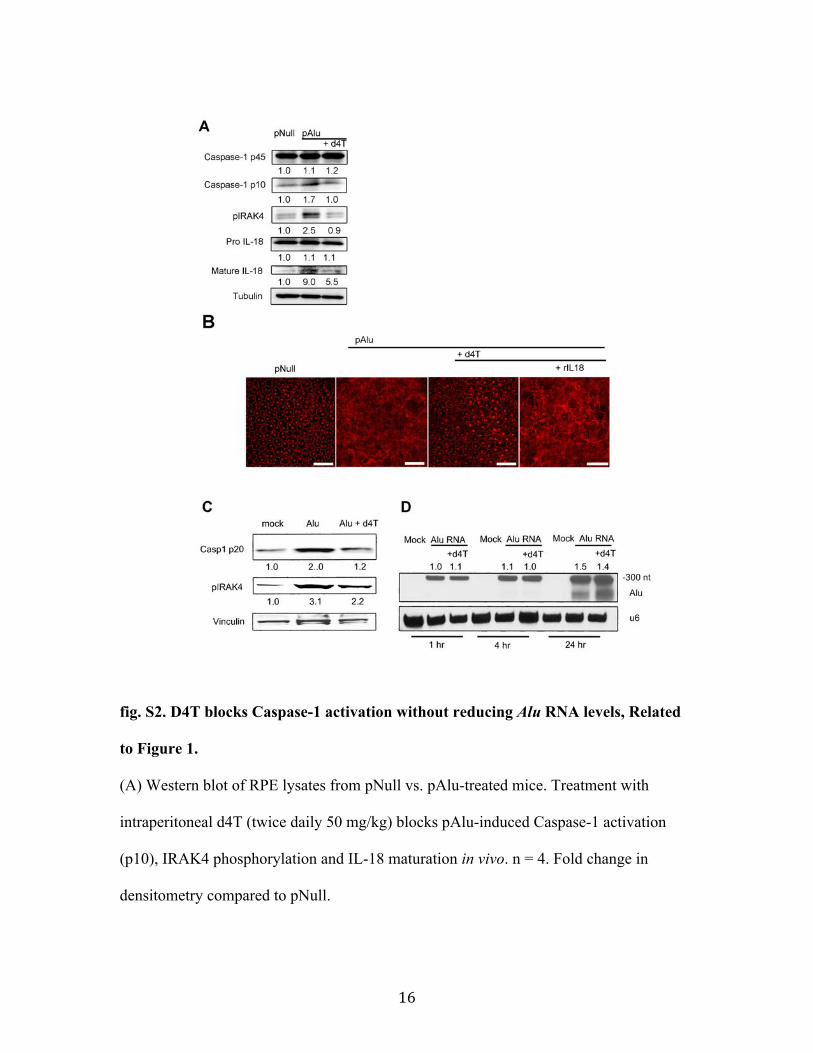
fig. S2. D4T blocks Caspase-1 activation without reducing Alu RNA levels, Related
to Figure 1.
(A) Western blot of RPE lysates from pNull vs. pAlu-treated mice. Treatment with
intraperitoneal d4T (twice daily 50 mg/kg) blocks pAlu-induced Caspase-1 activation
(p10), IRAK4 phosphorylation and IL-18 maturation in vivo. n = 4. Fold change in
densitometry compared to pNull.
17
(B) Representative RPE flat mounts stained for zonula occludens (ZO-1) showing that
intraperitoneal d4T (twice daily 50 mg/kg; related to fig. S2A) blocked pAlu-induced
RPE degeneration in 8/8 mice (vs. 1/8 in pAlu + vehicle; P = 0.001), which was reversed
with addition of subretinal recombinant mouse IL-18 (40 ng; RPE degeneration seen in
7/8 mice; P = 0.001). Scale bars 50 µm.
(C) Western blot of Caspase-1 activation (p20 subunit) and IRAK4 phosphorylation in
primary mouse RPE cells transfected with Alu RNA + d4T (100 µM). Image
representative of n = 4. Fold change in densitometry compared to mock.
(D) Northern blot of biotin-UTP-labeled Alu RNA-transfected primary human RPE cells.
D4T (100 µM) did not reduce Alu RNA levels (normalized to u6 RNA). Fold change in
densitometry compared to mock at 1 hr. Alu RNA-transfected cells in culture assayed at
24 hours for western blotting (Fig. 1, C and D, fig. S2A).

18
fig. S3. Chemical structure of me-d4T, related to Figure 2. A single substitution of the ribose 5’ hydroxyl group with a methoxy group (circled)
designed to prevent d4T phosphorylation. See figs. S4 and S5 for detailed synthesis
information.
19
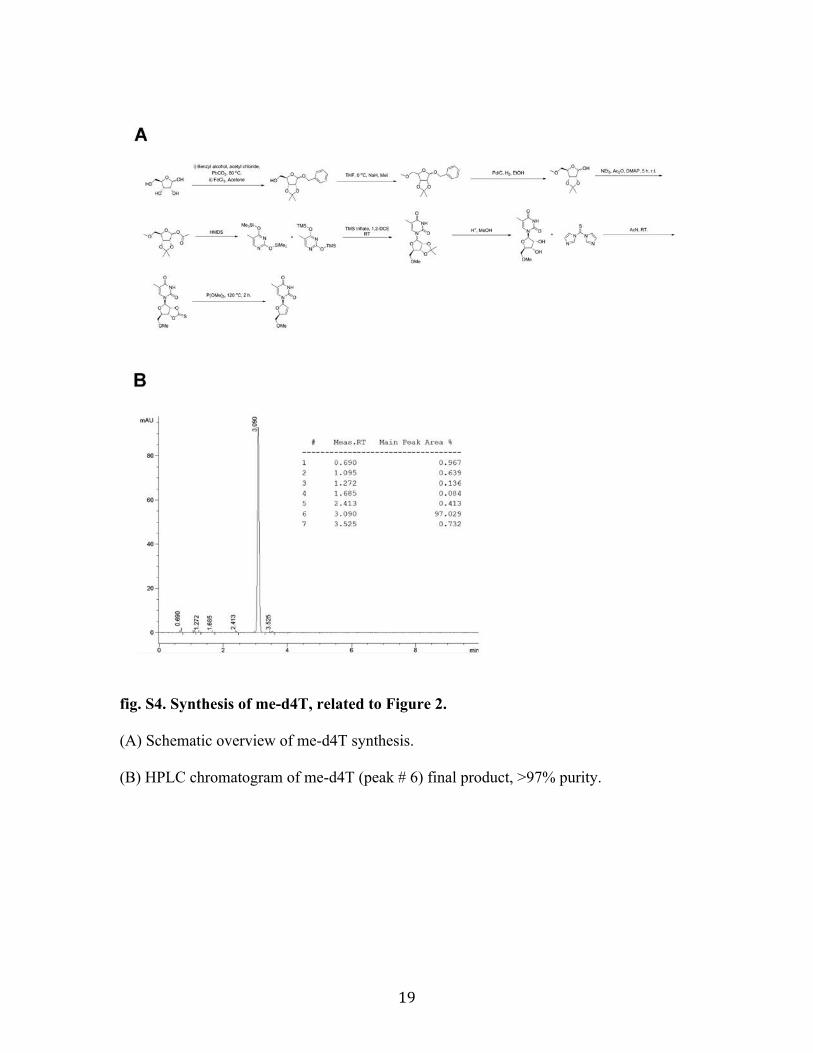
fig. S4. Synthesis of me-d4T, related to Figure 2.
(A) Schematic overview of me-d4T synthesis.
(B) HPLC chromatogram of me-d4T (peak # 6) final product, >97% purity.
20
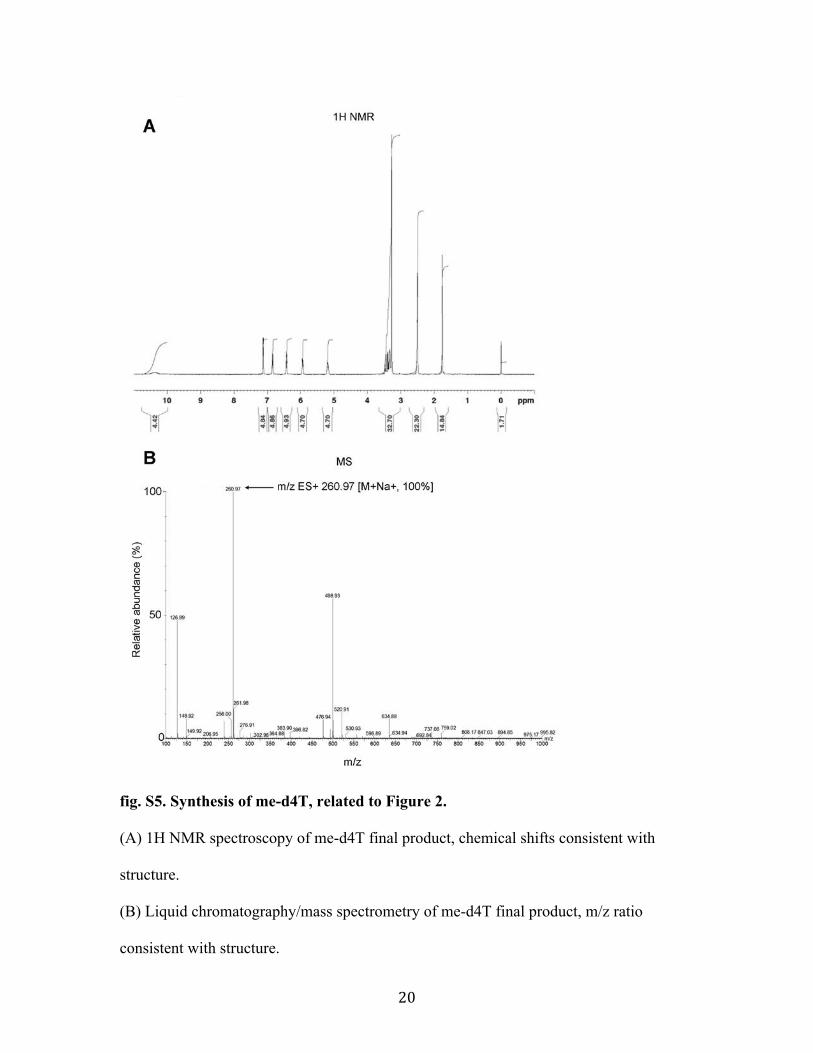
fig. S5. Synthesis of me-d4T, related to Figure 2.
(A) 1H NMR spectroscopy of me-d4T final product, chemical shifts consistent with
structure.
(B) Liquid chromatography/mass spectrometry of me-d4T final product, m/z ratio
consistent with structure.

21
fig. S6. Lentiviral vector transduction of GFP, related to Figure 2.
Lentiviral vector transduction of GFP in HeLa cells treated with unmodified d4T or me-
d4T (100 µM both drugs). (A) Quantification of GFP-positive cells per field of view, n =
4, * P < 0.05 by one-way ANOVA and Tukey’s post-hoc test. Error bars S.E.M. (B)
Representative images. Scale bars 200 µm.
22
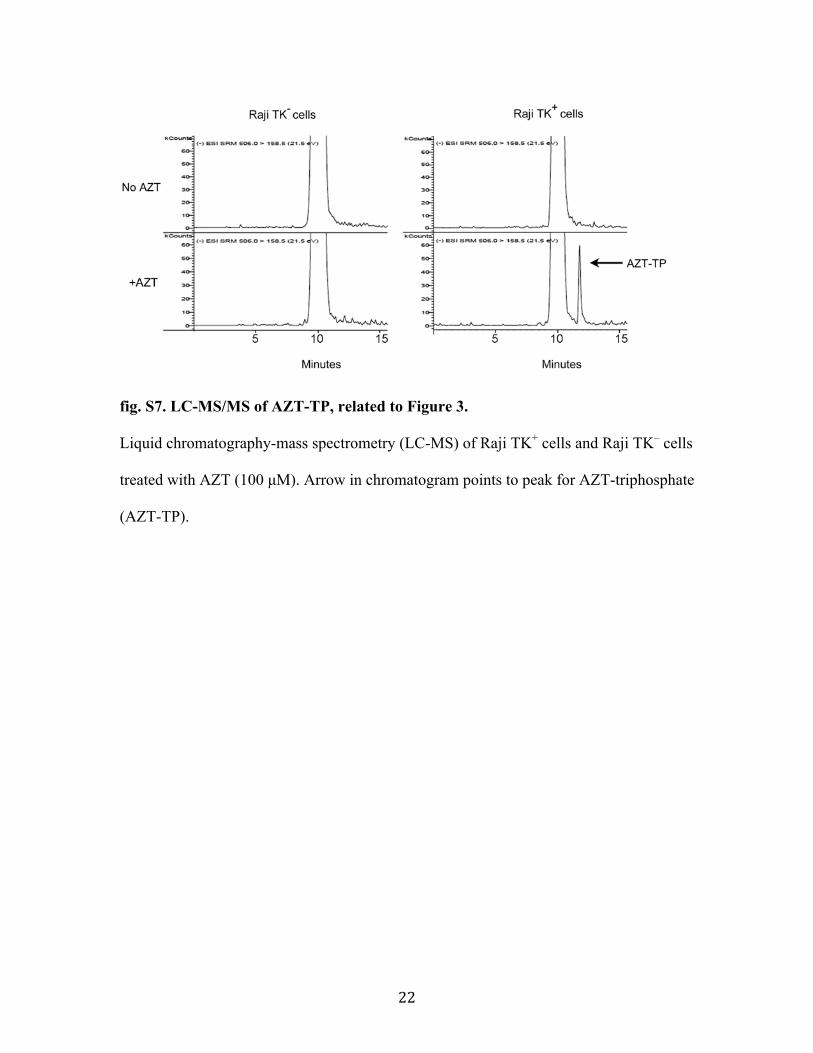
fig. S7. LC-MS/MS of AZT-TP, related to Figure 3.
Liquid chromatography-mass spectrometry (LC-MS) of Raji TK+ cells and Raji TK– cells
treated with AZT (100 µM). Arrow in chromatogram points to peak for AZT-triphosphate
(AZT-TP).
23
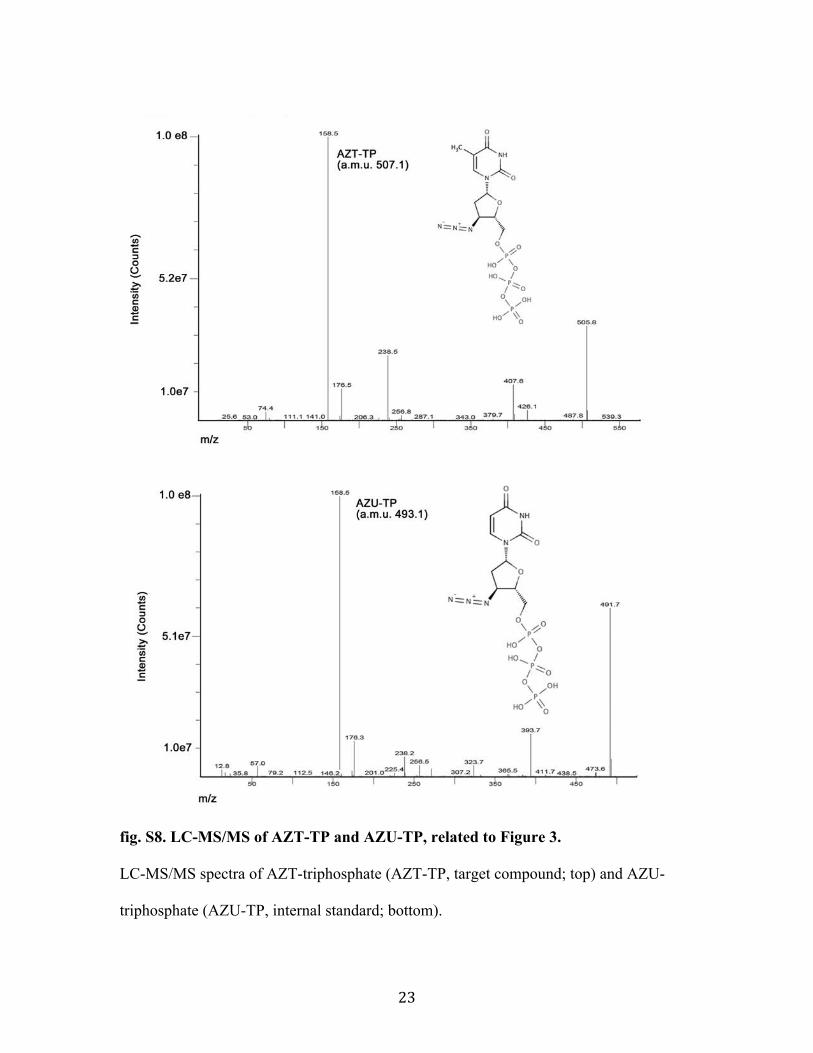
fig. S8. LC-MS/MS of AZT-TP and AZU-TP, related to Figure 3.
LC-MS/MS spectra of AZT-triphosphate (AZT-TP, target compound; top) and AZU-
triphosphate (AZU-TP, internal standard; bottom).
24
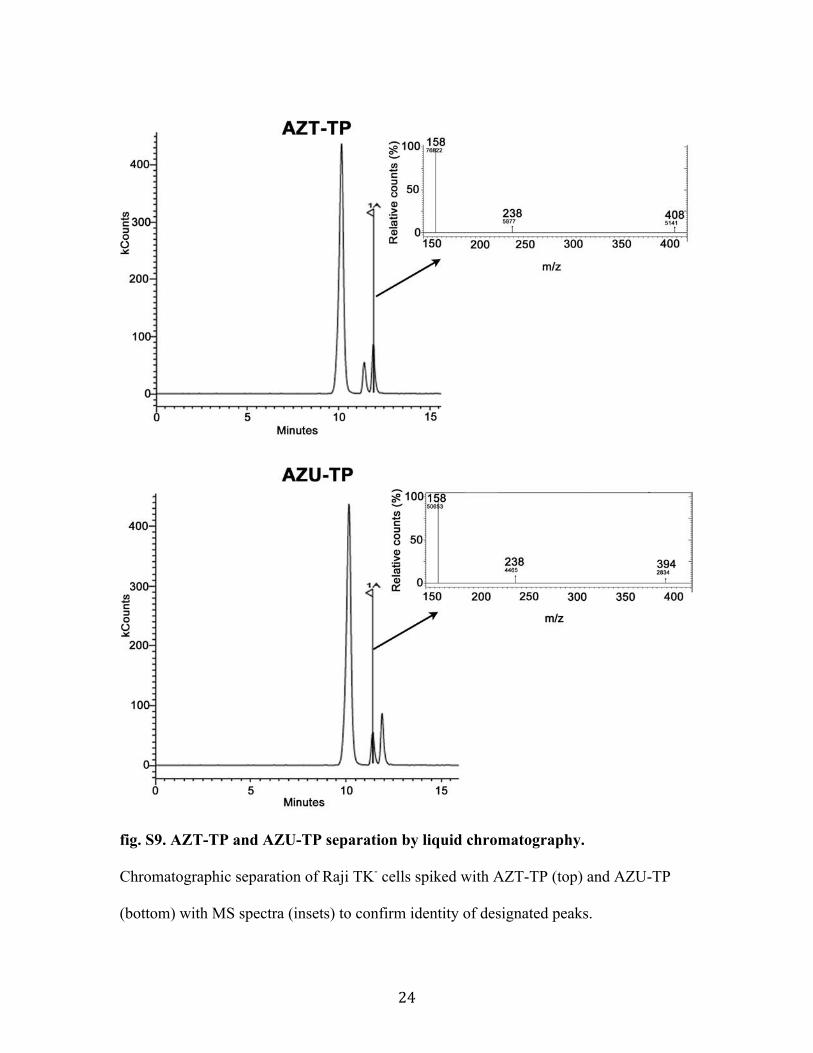
fig. S9. AZT-TP and AZU-TP separation by liquid chromatography.
Chromatographic separation of Raji TK- cells spiked with AZT-TP (top) and AZU-TP
(bottom) with MS spectra (insets) to confirm identity of designated peaks.
25
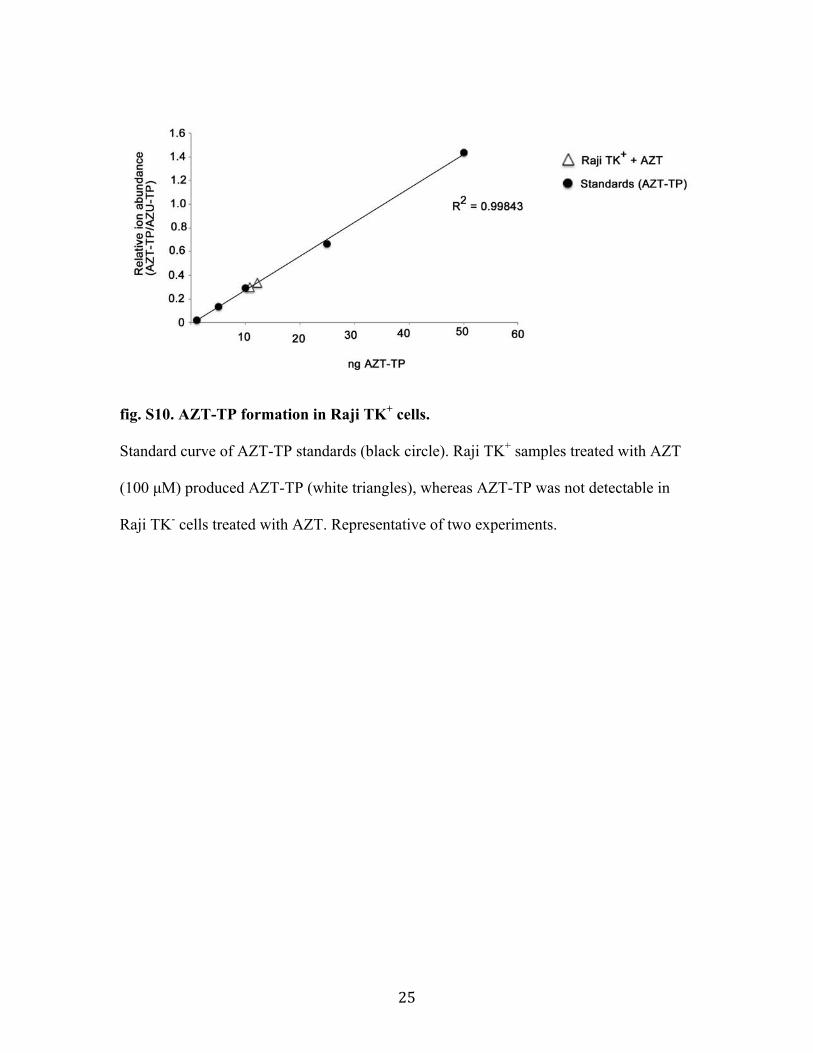
fig. S10. AZT-TP formation in Raji TK+ cells.
Standard curve of AZT-TP standards (black circle). Raji TK+ samples treated with AZT
(100 µM) produced AZT-TP (white triangles), whereas AZT-TP was not detectable in
Raji TK- cells treated with AZT. Representative of two experiments.
26
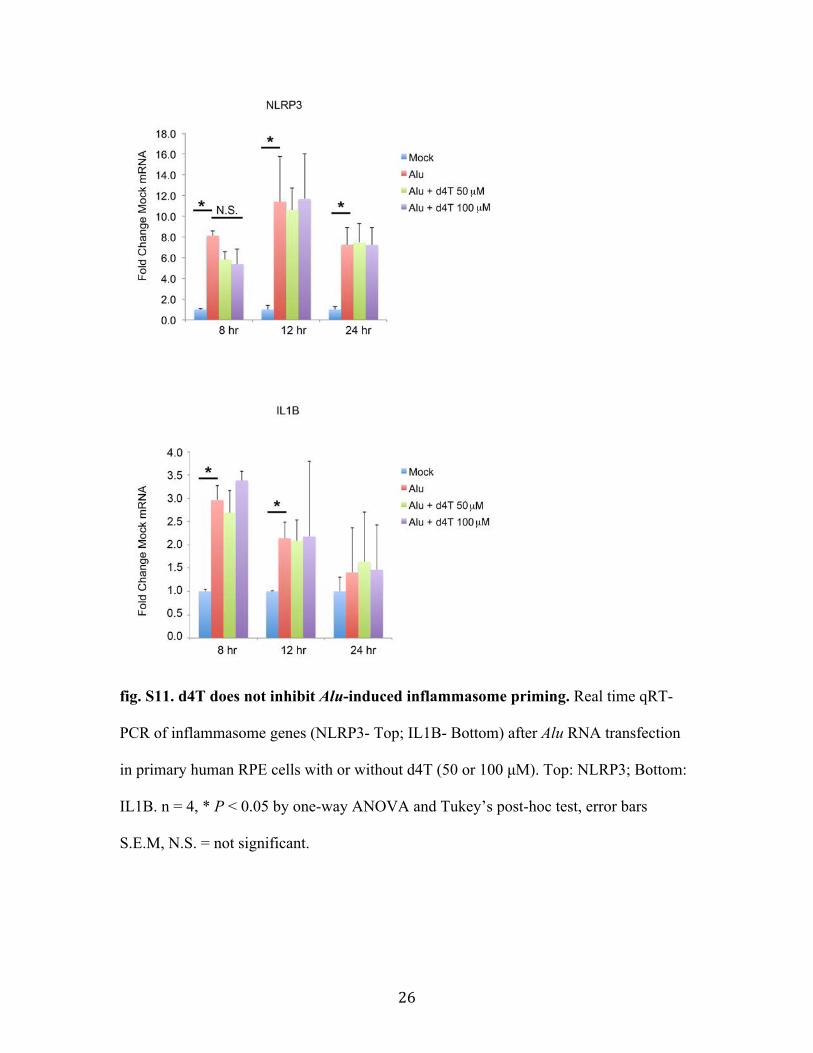
fig. S11. d4T does not inhibit Alu-induced inflammasome priming. Real time qRT-
PCR of inflammasome genes (NLRP3- Top; IL1B- Bottom) after Alu RNA transfection
in primary human RPE cells with or without d4T (50 or 100 µM). Top: NLRP3; Bottom:
IL1B. n = 4, * P < 0.05 by one-way ANOVA and Tukey’s post-hoc test, error bars
S.E.M, N.S. = not significant.
27
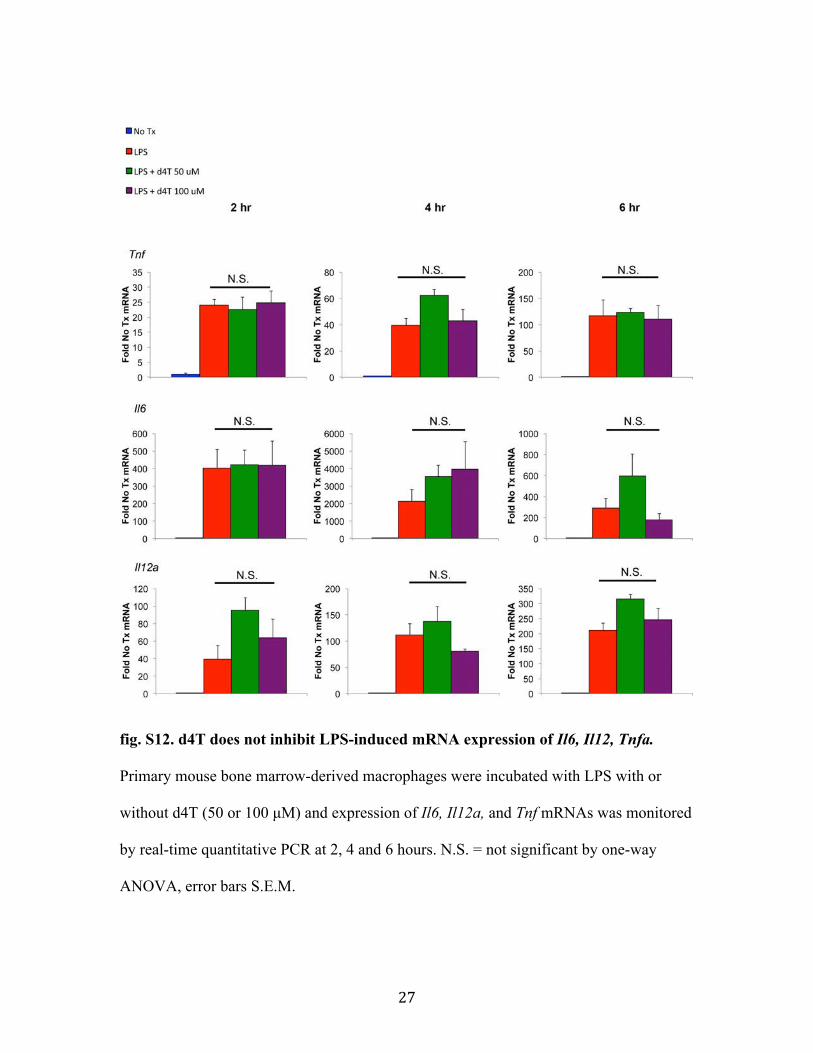
fig. S12. d4T does not inhibit LPS-induced mRNA expression of Il6, Il12, Tnfa.
Primary mouse bone marrow-derived macrophages were incubated with LPS with or
without d4T (50 or 100 µM) and expression of Il6, Il12a, and Tnf mRNAs was monitored
by real-time quantitative PCR at 2, 4 and 6 hours. N.S. = not significant by one-way
ANOVA, error bars S.E.M.
28
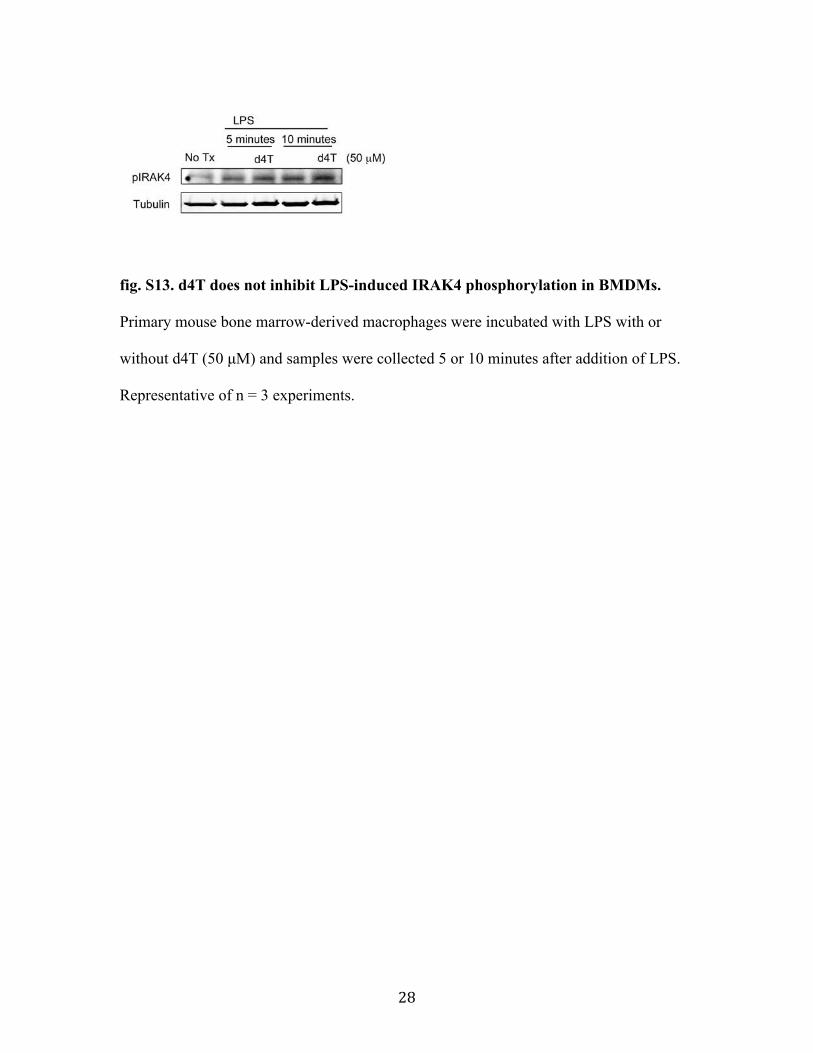
fig. S13. d4T does not inhibit LPS-induced IRAK4 phosphorylation in BMDMs.
Primary mouse bone marrow-derived macrophages were incubated with LPS with or
without d4T (50 µM) and samples were collected 5 or 10 minutes after addition of LPS.
Representative of n = 3 experiments.
29
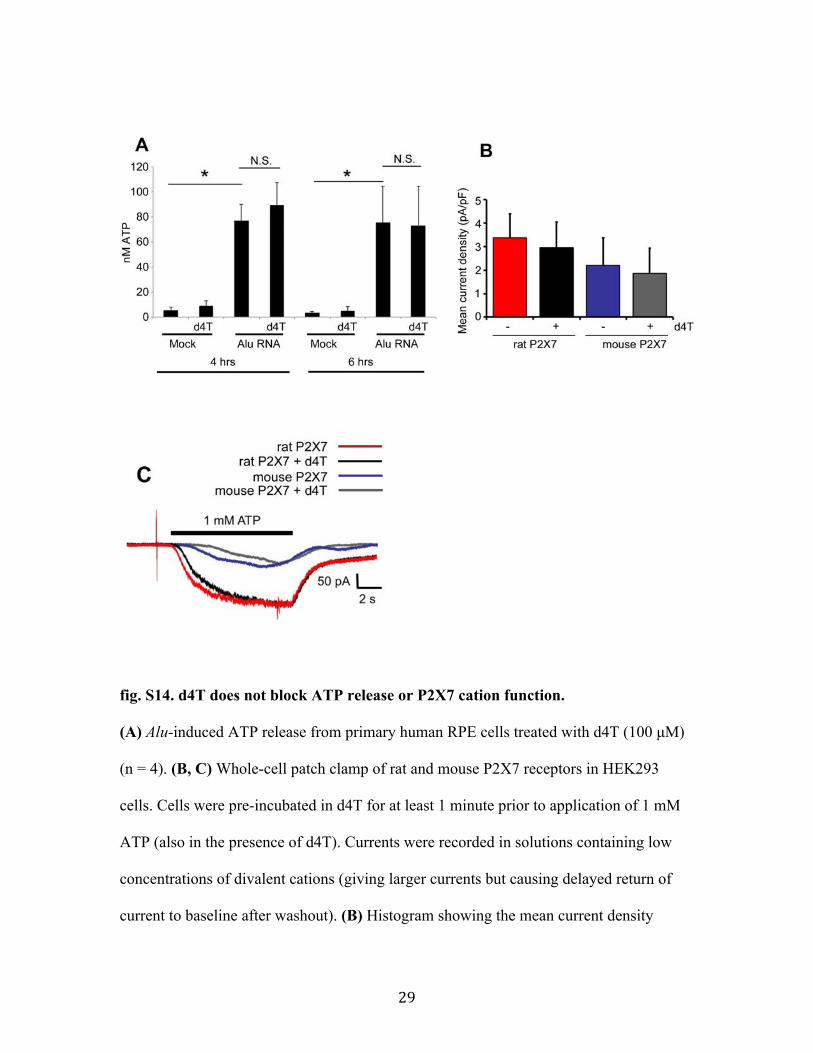
fig. S14. d4T does not block ATP release or P2X7 cation function. (A) Alu-induced ATP release from primary human RPE cells treated with d4T (100 µM)
(n = 4). (B, C) Whole-cell patch clamp of rat and mouse P2X7 receptors in HEK293
cells. Cells were pre-incubated in d4T for at least 1 minute prior to application of 1 mM
ATP (also in the presence of d4T). Currents were recorded in solutions containing low
concentrations of divalent cations (giving larger currents but causing delayed return of
current to baseline after washout). (B) Histogram showing the mean current density
30
recorded for rat P2X7 and mouse P2X7 in the absence (–) and presence (+) of 100 µM
d4T. Error bars represent standard error of the mean (n = 6 for rat P2X7 and n = 3 for
mouse P2X7). No significant difference to recorded currents was observed in the
presence of d4T. (C) Representative current traces from rat P2X7 in the absence (red)
and presence (black) and mouse P2X7 in the absence (blue) and presence (grey) of 100
µM d4T. (A) * p < 0.05 by one-way ANOVA and Tukey’s post-hoc test, N.S. not
significant. (A) and (B) error bars S.E.M.
31
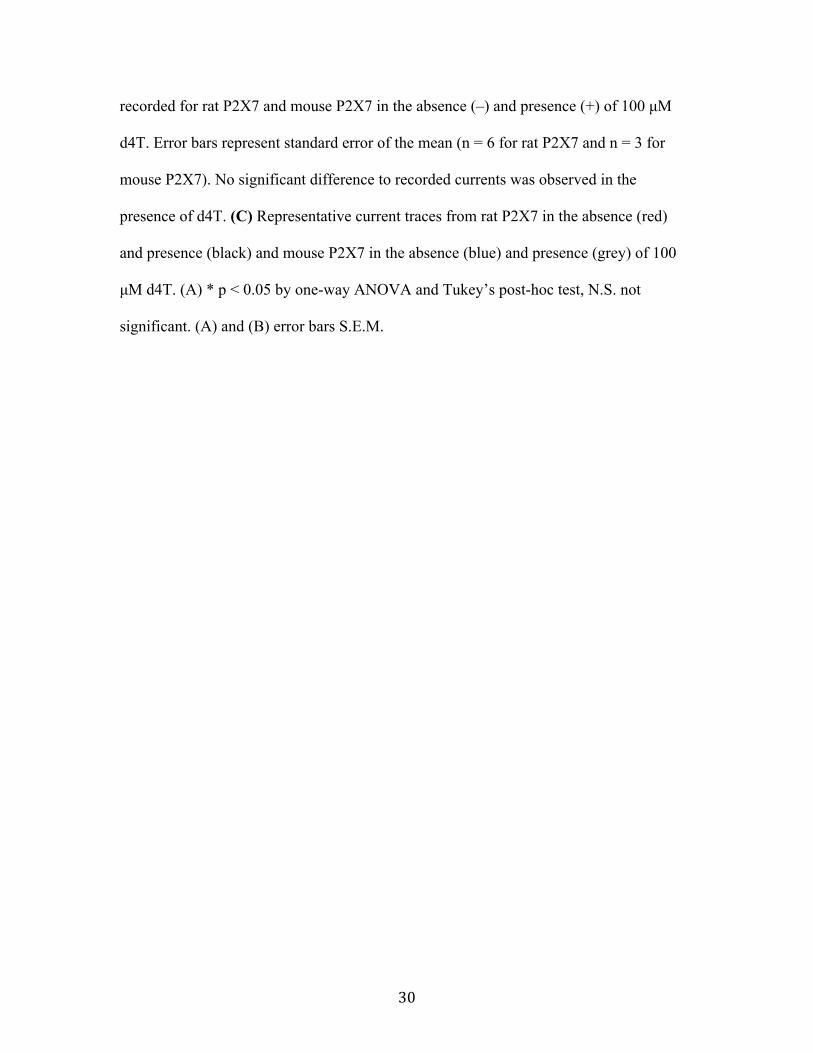
fig. S15. bzATP induces P2X7-dependent YO-PRO-1 uptake. (A) Western blot for
P2X7 in HEK293 cells vs. HEK293 cells stably expressing the human P2X7 receptor.
(B) YO-PRO-1 uptake (fluorescence) in P2X7-deficient HEK293 cells after addition of
bzATP. n= 3. Error bars S.E.M.
32
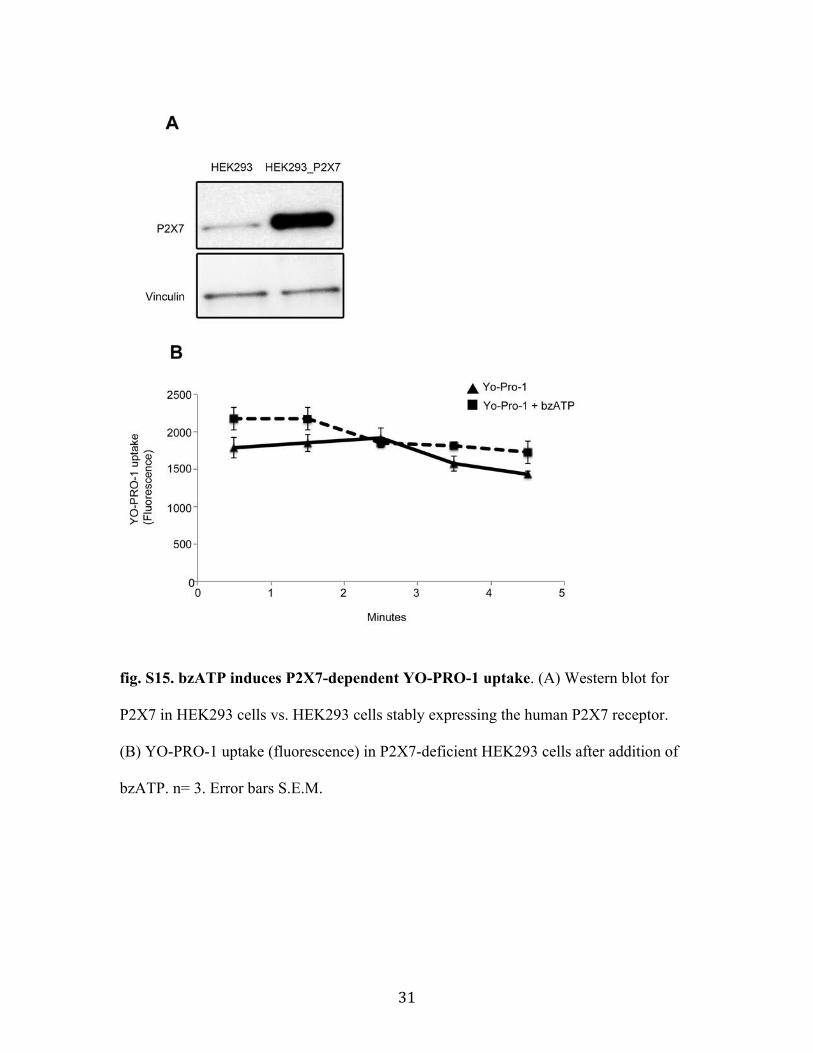
fig. S16. P2X7-dependent pore function mediates Alu-induced Caspase-1 activation.
33
(A) LDH levels in cell culture media of 10Panx-treated cells compared to mock-treated
cells + vehicle (samples from Fig. 4A experiment). Representative of n = 3 experiments.
N.S. not significant by Student’s t-test. Error bars S.E.M.
(B) Western blot showing that primary human RPE cells were still capable of
synthesizing IL-6 after treatment with 10Panx. Representative of n = 3 experiments.
(C) Western blot for Caspase-1 activation (p20) in primary mouse RPE cells from mice
lacking the Pannexin-1 gene (Panx1) or wild-type mice with mock or Alu RNA
transfection. Representative of n = 3 experiments. Fold change in densitometry compared
to mock.
(D) Western blot of Caspase-1 activation (p20) in primary human RPE cells treated with
Alu RNA + calmidazolium (5 or 50 nM), which blocks P2X7 cation flux but not pore
function. Representative of n = 3 experiments. Fold change in densitometry compared to
mock.
(E) Western blot of Caspase-1 activation (p20) in primary human RPE cells treated with
LPS/nigericin + calmidazolium (20 nM). Representative of n = 3 experiments. Fold
change in densitometry compared to LPS alone.
(F) Western blot of Caspase-1 activation (p20) in primary human RPE cells transfected
with Alu RNA + cell permeable (IC), unmodified (no tag) d4T, or cell-impermeable (EC)
d4T. All drugs administered at 100 µM. Representative of n = 3 experiments. Fold
change in densitometry compared to mock.
(G) Chemical structure of IC- and EC-d4T used in (F).
34
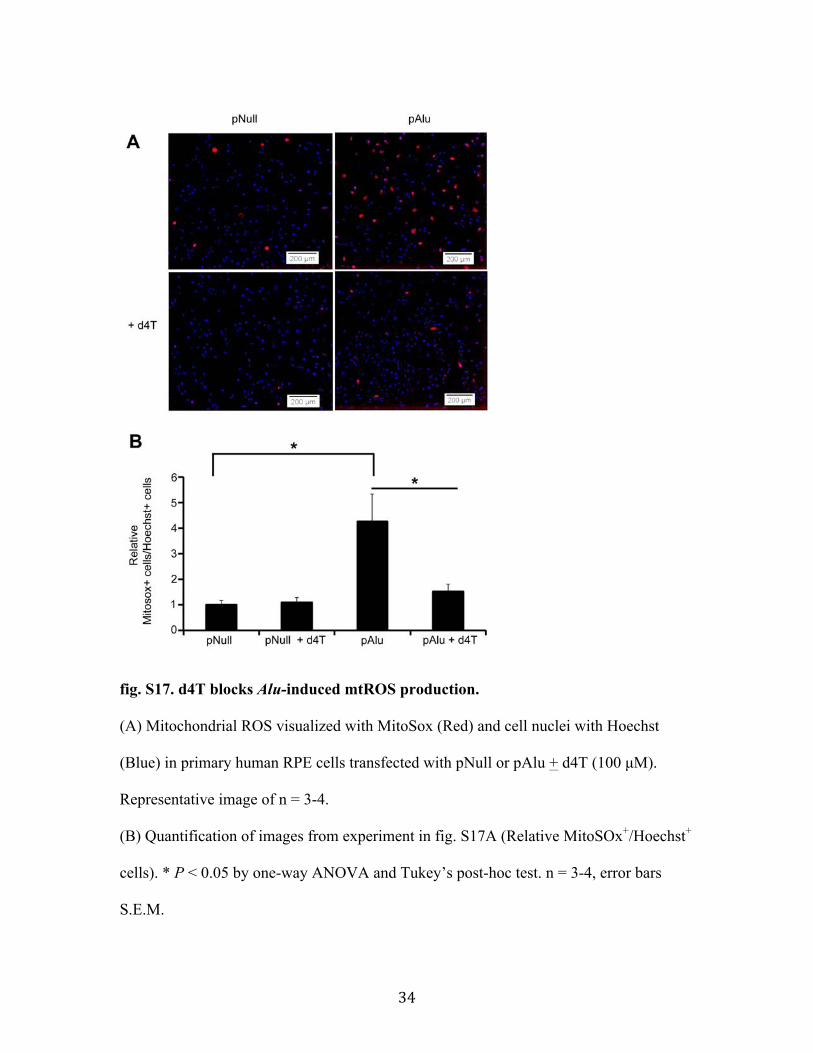
fig. S17. d4T blocks Alu-induced mtROS production.
(A) Mitochondrial ROS visualized with MitoSox (Red) and cell nuclei with Hoechst
(Blue) in primary human RPE cells transfected with pNull or pAlu + d4T (100 µM).
Representative image of n = 3-4.
(B) Quantification of images from experiment in fig. S17A (Relative MitoSOx+/Hoechst+
cells). * P < 0.05 by one-way ANOVA and Tukey’s post-hoc test. n = 3-4, error bars
S.E.M.
35
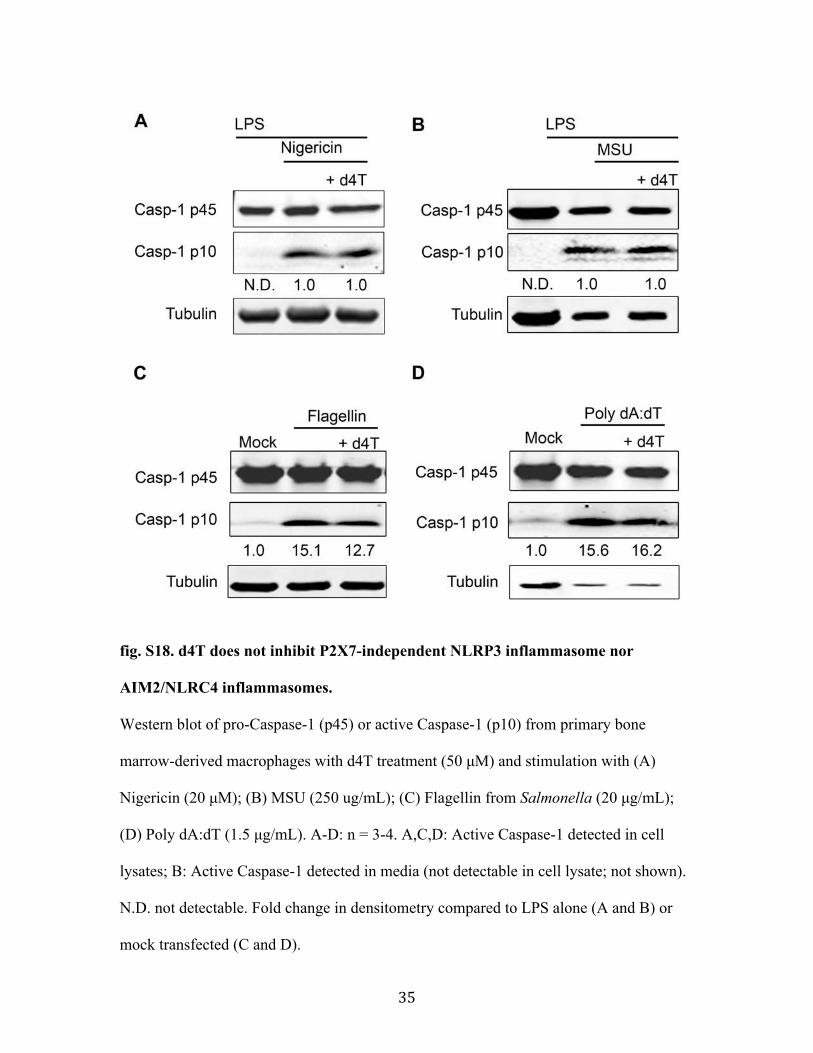
fig. S18. d4T does not inhibit P2X7-independent NLRP3 inflammasome nor
AIM2/NLRC4 inflammasomes.
Western blot of pro-Caspase-1 (p45) or active Caspase-1 (p10) from primary bone
marrow-derived macrophages with d4T treatment (50 µM) and stimulation with (A)
Nigericin (20 µM); (B) MSU (250 ug/mL); (C) Flagellin from Salmonella (20 µg/mL);
(D) Poly dA:dT (1.5 µg/mL). A-D: n = 3-4. A,C,D: Active Caspase-1 detected in cell
lysates; B: Active Caspase-1 detected in media (not detectable in cell lysate; not shown).
N.D. not detectable. Fold change in densitometry compared to LPS alone (A and B) or
mock transfected (C and D).
36
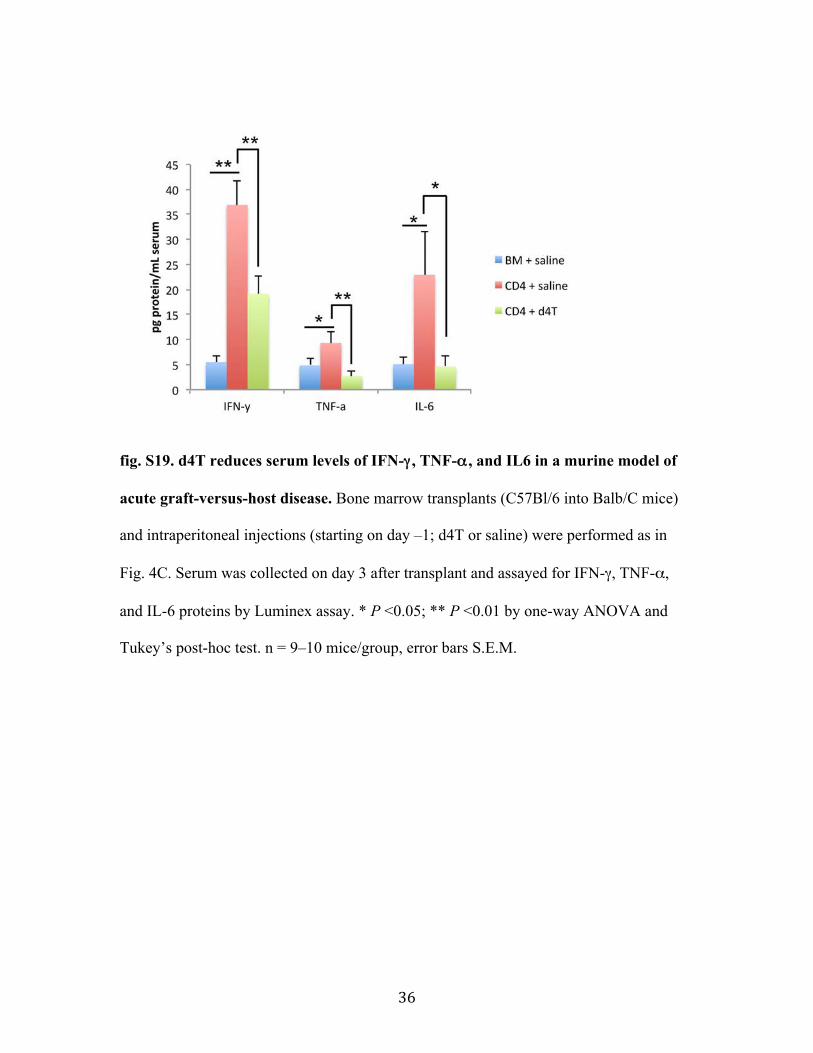
fig. S19. d4T reduces serum levels of IFN-γ , TNF-α , and IL6 in a murine model of
acute graft-versus-host disease. Bone marrow transplants (C57Bl/6 into Balb/C mice)
and intraperitoneal injections (starting on day –1; d4T or saline) were performed as in
Fig. 4C. Serum was collected on day 3 after transplant and assayed for IFN-γ, TNF-α,
and IL-6 proteins by Luminex assay. * P <0.05; ** P <0.01 by one-way ANOVA and
Tukey’s post-hoc test. n = 9–10 mice/group, error bars S.E.M.
37
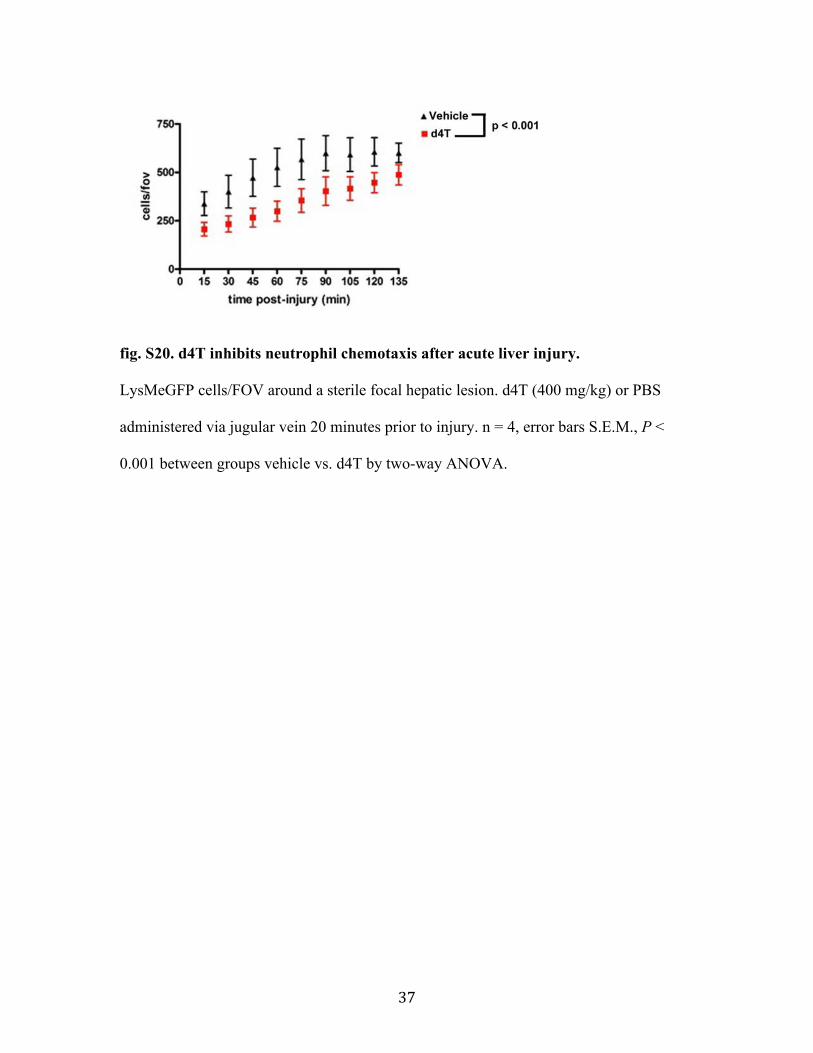
fig. S20. d4T inhibits neutrophil chemotaxis after acute liver injury.
LysMeGFP cells/FOV around a sterile focal hepatic lesion. d4T (400 mg/kg) or PBS
administered via jugular vein 20 minutes prior to injury. n = 4, error bars S.E.M., P <
0.001 between groups vehicle vs. d4T by two-way ANOVA.

38
fig. S21. d4T and me-d4T inhibit choroidal neovascularization.
Laser-induced choroidal neovascularization in (A) wild-type mice and (B) P2rx7–/– mice
treated with d4T (125 ng) and me-d4T (62.5 ng). Volumes normalized to vehicle
treatment and expressed as relative % angiogenesis. * P <0.05 by one-way ANOVA and
Tukey’s post-hoc test, n = 10-12, error bars S.E.M. N.S., not significant.