
Nuclear power in the UK - National Audit Office (NAO) · PDF file · 2016-07-13The...
48
Report by the Comptroller and Auditor General The Department of Energy & Climate Change Nuclear power in the UK HC 511 SESSION 2016-17 13 JULY 2016
Transcript of Nuclear power in the UK - National Audit Office (NAO) · PDF file · 2016-07-13The...

Reportby the Comptroller and Auditor General
The Department of Energy & Climate Change
Nuclear power in the UK
HC 511 SESSION 2016-17 13 JULY 2016

Our vision is to help the nation spend wisely.
Our public audit perspective helps Parliament hold government to account and improve public services.
The National Audit Office scrutinises public spending for Parliament and is independent of government. The Comptroller and Auditor General (C&AG), Sir Amyas Morse KCB, is an Officer of the House of Commons and leads the NAO, which employs some 785 people. The C&AG certifies the accounts of all government departments and many other public sector bodies. He has statutory authority to examine and report to Parliament on whether departments and the bodies they fund have used their resources efficiently, effectively, and with economy. Our studies evaluate the value for money of public spending, nationally and locally. Our recommendations and reports on good practice help government improve public services, and our work led to audited savings of £1.21 billion in 2015.

Report by the Comptroller and Auditor General
Ordered by the House of Commons to be printed on 13 July 2016
This report has been prepared under Section 6 of the National Audit Act 1983 for presentation to the House of Commons in accordance with Section 9 of the Act
Sir Amyas Morse KCB Comptroller and Auditor General National Audit Office
12 July 2016
HC 511 | £10.00
The Department of Energy & Climate Change
Nuclear power in the UK

This report sets out how the Department of Energy & Climate Change is encouraging investment in new generating capacity to meet the UK’s electricity system challenges, focusing on its measures for investment in nuclear power, and considers the value-for-money risks it needs to manage.
© National Audit Office 2016
The material featured in this document is subject to National Audit Office (NAO) copyright. The material may be copied or reproduced for non-commercial purposes only, namely reproduction for research, private study or for limited internal circulation within an organisation for the purpose of review.
Copying for non-commercial purposes is subject to the material being accompanied by a sufficient acknowledgement, reproduced accurately, and not being used in a misleading context. To reproduce NAO copyright material for any other use, you must contact [email protected]. Please tell us who you are, the organisation you represent (if any) and how and why you wish to use our material. Please include your full contact details: name, address, telephone number and email.
Please note that the material featured in this document may not be reproduced for commercial gain without the NAO’s express and direct permission and that the NAO reserves its right to pursue copyright infringement proceedings against individuals or companies who reproduce material for commercial gain without our permission.
Links to external websites were valid at the time of publication of this report. The National Audit Office is not responsible for the future validity of the links.
11201 07/16 NAO

The National Audit Office study team consisted of: Simon Bittlestone, Andrea Demurtas, Ken Foreman and Peter Kitson, under the direction of Michael Kell.
This report can be found on the National Audit Office website at www.nao.org.uk
For further information about the National Audit Office please contact:
National Audit Office Press Office 157–197 Buckingham Palace Road Victoria London SW1W 9SP
Tel: 020 7798 7400
Enquiries: www.nao.org.uk/contact-us
Website: www.nao.org.uk
Twitter: @NAOorguk
Contents
Overview 4
Part OneUK electricity system challenges 11
Part TwoThe Department’s policies for a secure, affordable and clean electricity supply 21
Part ThreeValue-for-money risks 36

4 Overview Nuclear power in the UK
Overview
Context
1 The Department of Energy & Climate Change (the Department) is responsible for maintaining a secure supply of electricity to power the UK. The UK’s policy and regulatory framework for electricity has created a system that has historically provided a secure and reliable supply. But the electricity generating sector is undergoing a major transition from old, polluting technologies, to cleaner low-carbon sources. Much of the UK’s existing electricity generation plant is set to close over the next two decades. At the same time, the government expects electricity demand will increase due to take-up of electricity-based technologies, particularly for transport and heating homes and buildings.
2 According to the Department’s strategic aims, as well as securing the supply of electricity the UK needs, new sources of electricity should support its ambitious greenhouse-gas emissions target and be affordable for bill payers. These three aims can be in tension; they are often described as the Department’s ‘trilemma’. For example, some low-carbon generation is intermittent and some is more expensive than traditional fossil-fuel power. Additionally, the cost of building new generating capacity is passed onto energy consumers, rather than being funded through general taxation. The UK also has an ambitious target to reduce greenhouse gas emissions by 80% from 1990 levels by 2050.
3 Since the UK’s electricity market was privatised in the late 1980s, the private sector has been responsible for financing and building the infrastructure to generate and transport electricity. The Department does not seek to determine the precise future mix of generating technologies. It oversees policies aimed at helping developers overcome barriers to investment to encourage competition, leading to a supply mix that supports its decarbonisation objectives.
4 The Department wants nuclear power to form an important part of a “balanced mix” of generating technologies, so it provides reliable, low-carbon and cost-competitive electricity. New nuclear investment faces particular challenges, including high upfront costs, which can make financing projects difficult. In the last 10 years, UK governments have developed measures to reduce these challenges for investors.

Nuclear power in the UK Overview 5
5 The Department has provisionally agreed terms on a deal to support construction of Hinkley Point C (HPC), a new nuclear power station that could generate around 7% of the UK’s electricity. The deal is with NNB Generation Company (NNBG), a subsidiary of French state-owned energy company EDF. China General Nuclear Power Corporation (CGN) will take 33.5% ownership of NNBG once the deal is finalised. The deal centres on a ‘contract for difference’ (CfD), whereby the Department has agreed that NNBG will receive an index-linked £92.50 per megawatt hour (MWh) (2012 prices) for the electricity HPC sells for 35 years.1 HM Treasury has also offered to guarantee up to £2 billion of bonds that NNBG may issue to finance its construction of HPC. The Department expects EDF to take its final investment decision to build HPC in the near future, and wants this to be the first in a series of similar deals for new nuclear power stations.
Scope
6 This report sets out:
• some of the main electricity system challenges that the UK faces in the next two decades, and the aims and responsibilities of the Department in meeting those challenges (Part One);
• the Department’s policies for encouraging investment in new generating capacity, including its specific measures for nuclear power stations (Part Two); and
• the value-for-money risks that the Department needs to manage (Part Three).
7 This report provides the background for any future National Audit Office reports on the government’s deal to support construction of HPC. Our intention is to report on the deal once EDF has taken its final investment decision to build HPC. The report is also intended to support Parliamentary scrutiny of the Department’s role.
Key points
Electricity system challenges
8 The Department’s central projection is that 95 Gigawatts (GW) of new generating capacity will be constructed by 2035 – equivalent to 90% of the grid’s current capacity (Figure 1 overleaf). Future electricity generation scenarios are subject to uncertainty, so the Department produces a range of projections. Its central projection is based on:
• a 20% increase in demand for electricity over the next two decades because of demographic changes, economic growth and the electrification of heat and transport;
• ageing coal and nuclear power stations worth nearly 30 GW of capacity shutting as they reach the end of their technical lives;
1 £92.50 is the strike price in 2012 prices. This will reduce to £89.50 if EDF builds another nuclear power station at Sizewell.

6 Overview Nuclear power in the UK
• new capacity replacing existing generating sources which, while not at the end of their technical life, are less efficient than new sources meaning they are priced out of the market; and
• an increasing proportion of generation coming from intermittent sources such as wind and solar power, meaning the total generating capacity needs to be higher to ensure there is sufficient capacity to meet demand.
There is, however, significant uncertainty over these factors, particularly future electricity demand (paragraphs 1.2 to 1.6; and Figures 1 to 4).
Figure 1The UK’s energy challenge up to 2035
Installed capacity (Gigawatts, GW)
The Department projects that electricity demand may increase at the same time that a large proportion of existing generating capacity retires
Notes
1 The Department projects a range of scenarios for the future of electricity generation. This figure uses the scenario based on its central estimate of economic growth and fossil-fuel prices and shows the generating capacity required to meet the Department’s security of electricity supply and decarbonisation objectives.
2 The figure shows total installed capacity – the maximum electrical output that power generators can produce unadjusted for plant availability and outages.
3 New generation sources includes 17 GW from European electricity interconnectors.
Source: National Audit Office analysis of Department of Energy & Climate Change energy and emissions projections data
Demand increase
New nuclear power stations
New generation sources
Plant retirements
Existing capacity
0
20
40
60
80
100
120
140
160
Currentgeneratingcapacity
Increasein capacity
needed
Minimum generatingcapacity required
in 2035
31
64
42 42
81
14

Nuclear power in the UK Overview 7
9 At the same time, the UK is committed to ambitious reductions of its greenhouse‑gas emissions. The Climate Change Act 2008 requires the UK to reduce greenhouse-gas emissions by 80% from 1990 levels by 2050. Existing power stations emit around 25% of the UK’s greenhouse gases. The Department wants new generating capacity to come mainly from lower-carbon sources, such as wind, solar, nuclear and gas, to help meet its decarbonisation goal (paragraphs 1.13 to 1.15; and Figures 7 and 8).
10 The costs of new generating capacity will largely be passed on to consumers through their electricity bills. The government predicts that investment in new generating capacity may cost around £140 billion to 2030. A further £40 billion of investment could be needed in electricity transmission and distribution. The impact of this and other energy policies on bills is uncertain. The Department estimates that by 2030 the total cost of its policies could add £230 to the average annual electricity bill. However the Department predicts that its policies for increasing energy efficiency, creating a more flexible energy system and other price effects of its policies could offset these increases. Taking these policies into account, the Department expects a net impact on annual bills of between a decrease of £26 and an increase of £117 by 2030 (paragraphs 1.11 and 1.12; and Figure 6).
11 Developers of many new generating sources face investment barriers given current and expected wholesale electricity prices as well as other long‑term risks. Wholesale electricity prices, which determine revenues, are uncertain and have reduced dramatically in recent years. ‘Levelised cost of electricity’ (LCOE) estimates lifetime costs on a comparable basis across technologies. LCOE forecasts for new generation sources in the 2020s are in the region of £60 to £100 per megawatt hour (MWh). While this cost is falling, it is still higher than the current wholesale electricity prices of around £45 per MWh. For large-scale projects, such as nuclear and offshore wind, the risks can be even greater due to construction risks and the potential for changes in government policy to affect their commercial viability. In these conditions, developers require financial support for their investment to be profitable (paragraph 1.7; and Figures 12 and 19).
The Department’s strategy and recent progress
12 The Department aims to overcome market failures so that there is a competitive market of private investment in new and existing generating capacity. The Department has agreed 35 CfDs for new low-carbon power sources. Through CfDs, the generator is paid the difference for electricity sold between a contractual ‘strike price’ and the ‘reference price’ – a measure of the average market price for electricity in the UK. If the strike price is higher than the reference price then the developer will receive a top-up. At times when the reference price exceeds the strike price, the generator is required to pay back the difference. Through the Capacity Market, the Department auctions capacity agreements whereby it commits to providing future revenue certainty to new or existing power generators. This is in return for guarantees that capacity will be available at a certain time in the future, even if it not actually called on to provide power. The Department expects this will ensure there is enough capacity to maintain security of supply while the wholesale market may not be sufficient to keep some plant in operation. The Department aims for these policies to encourage competition to drive down generators’ costs, which are passed onto consumers through their electricity bills (paragraphs 2.2 to 2.9; Figures 9 to 11; and Figures 13 and 14).

8 Overview Nuclear power in the UK
13 The government introduced the Levy Control Framework to manage spending on its consumer‑funded support for low‑carbon generation. The Levy Control Framework places a cap on the amount the Department can raise through levies on energy bills in each year. The cap in 2020-21 is £7.6 billion, equivalent to around £92 (7%) of the forecast average bill in 2020. However, the most recent forecasts suggest that the cap will be breached by around £1.1 billion a year (paragraphs 3.13 and 3.14).
New nuclear
14 The Department wants nuclear power to form an important part of a ‘balanced mix’ of generating technologies over the long term, as it could provide reliable, low‑carbon and cost‑competitive electricity. The Department projects that between now and 2035, around 14 GW of new nuclear generating capacity may be built. The government wants to support a renaissance of the UK nuclear industry – the last new nuclear power station in the UK was completed in 1995 (paragraph 2.10; and Figures 4 and 8).
15 There are specific barriers to investment in nuclear power. Nuclear power plants have high upfront costs and take a long time to build. EDF expects HPC to cost £18 billion to build over 10 years, excluding financing costs. There are also costs to deal with spent nuclear fuel, and decommissioning the facility once it has stopped generating power. The costs of new nuclear power plants are expected to be higher in the UK than other countries, in part because the UK has not built any nuclear plants since the 1990s. Nuclear power plants also have long payback periods, which increases investor exposure to changes in government policy that would reduce operating revenues. The risks associated with nuclear projects (including policy, technology and construction risks) make finance difficult to raise (paragraphs 2.11 and 2.12).
16 The government has introduced measures aimed at removing barriers to investment in new nuclear power stations. These include planning guidance, site licensing and a standard regulatory approvals process for new reactor designs. The HPC CfD will last 35 years, while most existing CfDs for other low-carbon technologies last 15 years. The government negotiated the contract bilaterally with EDF, rather than its preferred practice of relying on competition to minimise the strike price and so reduce the cost to consumers. It aims to mitigate this risk by negotiating ‘gainshare’ mechanisms as part of the CfD. These mean consumers benefit if construction costs are lower or returns on the project are higher than anticipated. The Department hopes that concluding the deal will generate wider investor confidence to pave the way for subsequent new nuclear projects (paragraph 2.13; and Figures 15 and 16).
17 Progress in encouraging investment in new nuclear power stations has been slower than for other low‑carbon technologies. The deal to build HPC is the most advanced nuclear project as it is the only one with development consent, a site licence and regulatory approval. However, EDF’s final investment decision has been subject to ongoing delays and it is still uncertain when EDF will begin constructing the facility (paragraphs 2.14 to 2.18; and Figure 17).

Nuclear power in the UK Overview 9
Value-for-money risks
18 The Department’s strategy is subject to value‑for‑money risks for consumers. In particular:
• Demand uncertainty: It is difficult to predict how much demand for electricity will increase, as it is subject to economic trends, technological developments and changes in consumer behaviour. If the Department overestimates demand, it could provide support and incentives for more projects than necessary, resulting in poor value for money. Equally, if the Department underestimates demand, it may need to take short-term remedial action in the future, which could be more expensive to consumers, or more polluting (paragraphs 3.3 to 3.9).
• Market conditions: The government relies on the private sector to build new capacity, which means it is exposed to market conditions that influence investor confidence. If investor confidence falls there could be less competitive pressure to minimise costs, resulting in consumers paying more. Political and regulatory risks can particularly impact on investor confidence. Some stakeholders have said that recent changes in the emphasis of government policy has had a negative effect on investors committing to building new generating capacity. The two Capacity Market auctions to date, although competitive for existing generators, resulted in relatively little investment in new generation sources. The Department expects this to change in future auctions when there are fewer existing sources able to bid for capacity agreements. There has been little competition for nuclear support. The Department negotiated the HPC contract for difference bilaterally with EDF as it considered this preferable to waiting for alternative nuclear options. The uncertainty following the EU Referendum could also impact investment decisions (paragraphs 3.10, 3.11 and 3.25; and Figure 18).
• Wholesale electricity prices: CfDs fix the cost to consumers of the electricity from new generating sources, regardless of the market price. Since 2012, the Department has revised downwards its projections of future wholesale electricity prices, mainly because of a global reduction in the prices of fossil-fuels. While CfDs reduce the risk to consumers of market price volatility, they also mean consumers benefit less from wholesale price falls, which are offset by increased top-up payments. The present value of future top-up payments through existing CfDs has increased by £5.6 billion in the 2015-16 financial year because of lower projected wholesale electricity prices. We estimate that future top-up payments through the HPC CfD have increased from £6.1 billion to £29.7 billion since the Department and EDF agreed the strike price in 2013 (paragraphs 3.15 to 3.17; and Figures 19 and 20).
• Total delivery costs: UK infrastructure costs have historically been higher than those overseas, including for energy infrastructure. Private finance is more expensive than if the government funded new generating sources, but can be value for money provided the benefits from risk transfer (such as construction risk) and commercial disciplines outweigh the costs (paragraphs 3.21 to 3.24; and Figure 21).

10 Overview Nuclear power in the UK
19 There are particular value‑for‑money considerations for nuclear power compared to other generating technologies. The government is offering longer-term CfDs for new nuclear investment than other low-carbon technologies, reflecting the longer payback periods for nuclear power stations. This adds to price certainty for consumers but increases the risk that they do not benefit as much from any long-term changes, such as technological advances that reduce the cost of other low-carbon sources. The greater complexity and risk of nuclear power projects also could lead investors to require a higher return than for other low-carbon technologies. This means careful consideration is needed of the allocation of risks between the government and investor, such as including gainshare mechanisms (paragraphs 3.18; and 3.23 to 3.25).
20 The government’s new nuclear strategy means there are also particular value‑for‑money risks to taxpayers (as distinct from consumers) compared with other technologies. With CfDs, taxpayers are not exposed to project risks such as cost overruns during construction. However, as part of the government’s deal for HPC, HM Treasury has provisionally agreed to guarantee up to £2 billion of bonds that NNBG will issue to finance HPC’s construction repayable by NNBG’s shareholders in 2020. If the shareholders fail to repay and the government’s guarantee is ever called, or if the developer manages to negotiate further guarantees that are called, the funds required would be drawn from government budgets. Additionally, the HPC deal includes a Funded Decommissioning Programme, whereby the Department stipulates an amount that NNBG must set aside to cover decommissioning costs. The government will be liable for any decommissioning costs above the amount NNBG sets aside. The Department calculates the risk of this happening is very low (paragraphs 3.19 and 3.20).

Nuclear power in the UK Part One 11
Part One
UK electricity system challenges
1.1 This part of the report describes some of the main challenges that the UK faces in securing electricity supply over the next two decades and the Department of Energy & Climate Change’s (the Department’s) responsibilities and objectives in that context.
The electricity supply challenge
1.2 Future electricity generation scenerios are subject to uncertainty, so the Department produces a range of projections. The Department’s central projection is around 95 gigawatts (GW) of new generating capacity will be built over the next two decades to meet the government’s decarbonisation objectives and ensure security of the electricity supply. It estimates that the UK may need almost 140 GW of electricity generating capacity to meet demand in 2035, an increase of nearly a third compared with 106 GW in 2015.2 The Department’s projection shows 64 GW of current generating capacity retiring by 2035 (Figure 1 on page 6). It estimates that less than half of these retirements will be due to plant reaching the end of their technical life. Economic retirements – where existing plants are out competed and displaced by new generating capacity – account for the remainder. If some of the expected new plant does not come forward then some of the projected closures may not happen.
Long-term demand for electricity
1.3 The Department’s projections show electricity demand increasing in the next two decades. The central scenario of its 2015 updated energy projections shows the UK’s electricity demand increasing by 20% by 2035 to 376 terawatt hours (TWh) a year (Figure 2 overleaf). The Department also looked at the effects of varying economic growth and assumptions about fossil-fuel price. This analysis shows growth in demand by 2035 ranges between 14% and 25%.
2 These capacity totals are not adjusted for availability, and outages for repair and maintenance, and include electricity interconnectors.

12 Part One Nuclear power in the UK
Fig
ure
2To
tal e
lect
ricity
con
sum
ptio
n pr
ojec
tions
for t
he U
K u
nder
alte
rnat
ive
foss
il-fu
el p
rice
and
grow
th
scen
ario
s, 2
015
to 2
035
Fina
l con
sum
ptio
n (T
Wh)
330
350
370
390
410
The
Dep
artm
ent’s
late
st d
eman
d p
roje
ctio
ns a
re s
igni
fican
tly lo
wer
tha
n th
ose
it m
ade
in 2
012
310
290
2015
2016
2017
2018
2019
2020
2021
2022
2023
2024
2025
2026
2027
2028
2029
2030
2031
2032
2033
2034
2035
No
tes
1 Th
e p
roje
ctio
ns s
how
fina
l ene
rgy
dem
and.
Con
vers
ion
to fi
nal d
eman
d in
volv
es s
ome
loss
of e
nerg
y us
ed in
the
gen
erat
ion
and
tran
smis
sion
of e
lect
ricity
.
2 Th
e 20
12 c
entr
al p
roje
ctio
n w
as m
odel
led
only
up
to 2
030.
3 Th
e ce
ntra
l pro
ject
ion
is b
ased
on
cent
ral e
stim
ates
of e
cono
mic
gro
wth
and
foss
il-fu
el p
rices
. It c
onta
ins
all a
gree
d an
d p
lann
ed e
nerg
y p
olic
ies
whe
re d
ecis
ions
on
polic
y d
esig
n ar
e su
ffici
ently
adv
ance
d to
allo
w r
obus
t est
imat
es o
f im
pact
.
4 Th
e un
cert
aint
y ra
nge
estim
ates
the
exp
ecte
d im
pact
of h
igh
and
low
eco
nom
ic g
row
th a
nd fo
ssil-
fuel
pric
e p
roje
ctio
ns o
n th
e ce
ntra
l pro
ject
ion.
Sou
rce:
Nat
iona
l Aud
it O
ffice
ana
lysi
s of
Dep
artm
ent o
f Ene
rgy
& C
limat
e C
hang
e en
ergy
and
em
issi
ons
pro
ject
ions
dat
a
Unc
erta
inty
rang
e
2015
cen
tral
pro
ject
ion
2012
cen
tral
pro
ject
ion

Nuclear power in the UK Part One 13
1.4 The Department expects demand to increase from 2020 because domestic heating will increasingly be generated by electricity rather than gas, and there will be more electric vehicles. The Department’s view is that annual demand from heat pumps to heat homes could be between 23 TWh and 50 TWh, with demand from electric vehicles between 5 TWh and 14 TWh by 2030.3
1.5 The Department’s latest projections of electricity demand after 2022 are significantly lower than those it made in 2012 (Figure 2). The change is due, among other factors, to lower household growth, higher ambient temperature projections and greater predicted impact of energy efficiency policies. The Department has also improved its underlying energy forecasting models as part of its work to improve the accuracy of its projections.
Existing supply retirements
1.6 A large amount of the UK’s electricity generation plant is set to close over the next two decades. In particular, the Department expects almost all existing nuclear and coal-fired power stations, which together generate almost half of the UK’s power, to close by the end of the 2020s.4 The government announced in November 2015 its intention to consult on plans to ensure that all UK unabated coal-fired facilities will be phased out by 2025, provided new lower-carbon capacity such as gas can fill the gap. All but one of Britain’s nuclear power stations are set to close by 2030 as they are reaching the end of their operational lifecycle (Figure 3 overleaf). The owners of these power stations will decide the precise timing of their closure. This creates some uncertainty in the Department’s projections, but also creates some flexibility in the electricity system’s capacity during the transition to low-carbon technologies (Figure 4 on page 15).
New generating capacity
1.7 It is the government’s policy that the private sector should finance and build new generating capacity, with the costs ultimately passed on to consumers through their energy bills. However, current market conditions mean that all low-carbon generating sources require government support to be viable for investors. Levelised cost of electricity (LCOE) estimates consider lifetime costs on a comparable basis across technologies. LCOE estimates for new generation sources in the 2020s are between £60 and £100 per megawatt hour (MWh). This compares with current wholesale prices, which will determine the revenues generators receive, at around £45 per MWh. Part Two sets out how the government is providing support to ensure there is sufficient new generating capacity.
3 Department of Energy & Climate Change, Electricity System: Assessment of Future Challenges – Annex, August 2012.4 While nuclear and coal power stations represent less than a third of the UK’s capacity, they generate electricity at a
high and almost continuous rate. They therefore represent a high proportion of the UK’s electricity supply.

14 Part One Nuclear power in the UK
2015
2016
2017
2018
2019
2020
2021
2022
2023
2024
2025
2026
2027
2028
2029
2030
2031
2032
2033
2034
2035
0 5 10
15
20
25
30
N
ucle
ar p
ower
9.
4 8.
9 8.
9 8.
9 8.
9 8.
9 8.
9 8.
9 8.
9 7.
0 4.
6 4.
6 4.
6 4.
6 3.
6 3.
6 1.
2 1.
2 1.
2 1.
2 1.
2
capa
city
C
oal-fi
red
pow
er
18.7
17
.7
12.9
12
.9
12.9
10
.9
7.3
6.3
2.4
1.9
1.9
0.6
0.6
– –
– –
– –
– –
ca
paci
ty
Fig
ure
3P
roje
cted
nuc
lear
and
coa
l-fire
d po
wer
cap
acity
, 201
5 to
203
5
Co
al-fi
red
po
wer
pla
nts
will
clo
se b
y 20
25. T
he li
fe o
f so
me
nucl
ear
pla
nts
has
bee
n ex
tend
ed t
o 2
030,
but
to
tal c
apac
ity is
due
to
fal
l sha
rply
by
2025
Inst
alle
d c
apac
ity (G
igaw
atts
, GW
)
No
tes
1 Th
e fig
ure
excl
udes
new
nuc
lear
bui
ld b
ut in
corp
orat
es E
DF’
s an
noun
cem
ent i
n Fe
bru
ary
2016
tha
t it w
ould
ext
end
the
oper
atin
g liv
es o
f fou
r of
its
nucl
ear
pow
er s
tatio
ns.
This
will
mak
e an
ad
diti
onal
cap
acity
of 4
.7 G
W a
vaila
ble
to 2
024,
2.4
GW
will
be
avai
lab
le u
ntil
2030
.
2 Th
e co
al p
ower
sta
tion
pro
ject
ions
do
not i
ncor
por
ate
the
gove
rnm
ent’s
Nov
emb
er 2
015
anno
unce
men
t tha
t coa
l-fire
d fa
cilit
ies
will
be
pha
sed
out b
y 20
25.
Sou
rce:
Nat
iona
l Aud
it O
ffice
ana
lysi
s of
Dep
artm
ent o
f Ene
rgy
& C
limat
e C
hang
e en
ergy
pro
ject
ions
dat
a

Nuclear power in the UK Part One 15
2010
2011
2012
2013
2006
2007
2008
2009
2014
2015
2016
2017
2018
2019
2020
2021
2022
2023
2024
2025
2026
2027
2028
2029
2030
050
100
150
200
250
300
350
400 O
ther
fuel
sN
ew n
ucle
ar
Coa
lN
ucle
ar c
urre
nt c
apac
ity
New
gas
New
rene
wab
les
Gas
cur
rent
cap
acity
All
rene
wab
les
curr
ent c
apac
ity
Fig
ure
4El
ectr
icity
gen
erat
ion
by fu
el ty
pe –
his
toric
and
pro
ject
ed a
s at
Nov
embe
r 201
5
Mo
st o
f th
e el
ectr
icity
pro
duc
ed in
203
5 w
ill b
e fr
om
new
so
urce
s
Ele
ctric
ity s
upp
ly, b
y fu
el t
ype
– an
nual
sup
ply
(TW
h)
No
tes
1 Th
e ch
art i
s an
ind
icat
ive
scen
ario
. Gen
erat
ion
from
new
sou
rces
incl
udes
ext
end
ing
the
life
of e
xist
ing
pla
nts.
2 P
roje
cted
gen
erat
ion
from
gas
incl
udes
una
bat
ed g
as a
nd c
arb
on c
aptu
re a
nd s
tora
ge p
lant
s.
3 Th
e p
roje
cted
fall
in g
ener
atio
n fr
om c
urre
ntly
inst
alle
d nu
clea
r, ga
s an
d re
new
able
s is
cal
cula
ted
usin
g d
iffer
ent a
ssum
ptio
ns. F
or n
ucle
ar, w
e as
sum
e th
at g
ener
atio
n w
ill fa
ll ac
cord
ing
to
pla
nned
pla
nt c
losu
res.
For
gas
, we
assu
me
that
gen
erat
ion
will
fall
by 3
% p
er y
ear
by 2
020
onw
ards
. For
ren
ewab
les
we
assu
me
that
gen
erat
ing
sour
ces
clos
e af
ter
20 y
ears
.
4 P
roje
cted
new
gen
erat
ing
cap
acity
is b
ased
on
the
Dep
artm
ent’s
Upd
ated
Ene
rgy
and
Em
issi
ons
Pro
ject
ions
min
us e
xist
ing
gene
ratio
n th
at w
ill st
ill b
e in
op
erat
ion
in 2
035.
Sou
rce:
Nat
iona
l Aud
it O
ffice
ana
lysi
s of
Dep
artm
ent o
f Ene
rgy
& C
limat
e C
hang
e d
ata
(Dig
est
of U
K E
nerg
y S
tatis
tics
and
Up
dat
ed E
nerg
y an
d E
mis
sion
s P
roje
ctio
ns)
His
toric
Pro
ject
ed

16 Part One Nuclear power in the UK
The Department’s responsibilities and objectives
Security of supply
1.8 The government’s highest priority in this Parliament is to ensure that the UK has a secure and resilient energy system. In a November 2015 speech, the Secretary of State for Energy and Climate Change signalled that the Department would prioritise security of supply. The Department’s Single Departmental Plan, published in February 2016, states that its priority during this Parliament would be to make the UK energy system more resilient.5
1.9 The Department has two additional objectives for the electricity system. These are to:
• keep energy bills as low as possible for households and businesses; and
• secure ambitious international action on climate change and reduce carbon emissions cost-effectively at home.
The Department’s three objectives for the electricity system are in tension with one another. They are often described as the Department’s ‘trilemma’ (Figure 5).
1.10 The Department is also responsible for managing the UK’s energy legacy safely and responsibly. This includes coal, oil and gas decommissioning and other liabilities. The largest share of the Department’s legacy costs are for decommissioning retired nuclear power stations and storing radioactive waste.
5 Department of Energy & Climate Change, Single departmental plan, 2016. Available at: www.gov.uk/government/publications/decc-single-departmental-plan-2015-to-2020/single-departmental-plan-2015-to-2020
Figure 5The Department’s ‘trilemma’
The three objectives are in tension with each other
Source: National Audit Offi ce
Security of supply requires a mix of complementary generation types. Fossil-fuelled power may be required to offset the intermittency and inflexibility of some low-carbon renewables
Cost of new generating capacity is borne by consumers. Ensuring higher levels of security requires more investment and higher costs
Some low- and zero-carbon technologies are still expensive compared to fossil-fuels, particularly under the low international price of oil and gas and low-cost penalties for emitting carbon dioxide
Decarbonisation
Security
Affordability

Nuclear power in the UK Part One 17
Affordable bills
1.11 The Department’s aim to maintain secure supply is in tension with keeping people’s bills affordable because consumers ultimately pay for the building and running of new generating capacity through their electricity bills. The government’s National Infrastructure Delivery Plan (2016) states that planned investment in new generating capacity could cost £138 billion to 2030. A further £40 billion of investment may be needed in electricity transmission and distribution.6 These costs will be added to consumers’ bills. The average UK electricity bill has increased 15% in real terms between 1996 and 2015. Bills have continued to increase in recent years at a time when real wages have been falling (Figure 6).7
6 HM Treasury and Infrastructure and Projects Authority, National Infrastructure Pipeline Spring 2016, March 2016.7 In 2013 real terms. Available at: www.gov.uk/government/statistical-data-sets/annual-domestic-energy-price-statistics
Figure 6Average domestic electricity bill
Note
1 Real 2015 prices.
Sources: Department of Energy & Climate Change, Average annual domestic electricity bills for UK countries (QEP 2.2.2), March 2016 and Office for National Statistics, Monthly Wages and Salaries Survey 2015
Since 2008 electricity bills have increased while real wages have fallen. In real terms, the annual electricity bill has increased £80 since 2004
£ per year Real wages (2000=100)
1996 1999 2002 2005 2008 2011 2014200
250
300
350
400
450
500
550
600
650 130
125
120
115
110
105
100
95
90
Annual electricity bill1 507 426 377 394 542 542 593
Real wages – – 106 114 119 113 110

18 Part One Nuclear power in the UK
1.12 The Department estimates that its support for low-carbon electricity generation accounted for around £41 (7%) of the average annual household electricity bill of £586 in 2014 (2014 prices). The Department estimates that its policies to ensure a secure, low-carbon supply of electricity will add a further £228 to the average electricity bill by 2030. This increase will be partly offset by the Department’s other policies, such as improving energy efficiency. According to the Department’s central scenario, its policies will result in a net increase of £40.8 This is uncertain: the Department says the impact could be between a reduction of £26 to an increase of £117. Moreover, these estimates are two years old and do not reflect recent developments, such as a fall in fossil-fuel prices, nor the future impact of smart technology, which could make the energy system more efficient.
Decarbonisation
1.13 The Department wants new generating capacity to contribute to the UK meeting its targets for reducing greenhouse-gas emissions. The Climate Change Act 2008 set a target for the UK to reduce its greenhouse-gas emissions by at least 80% from 1990 levels by 2050. The power sector accounted for around 25% of the UK’s greenhouse-gas emissions in 2014 (Figure 7).9
8 Department of Energy & Climate Change, Impacts of policies on the energy bills, 2014. Figures are in 2014 real terms.9 Department of Energy & Climate Change, Provisional estimates of UK Greenhouse Gas emissions for 2015,
Statistical release, March 2016.
Power, 122
Transport, 118
Industry, 109
Buildings, 85
Agriculture and Land Use,Land Use Change and Forestry, 47
Waste and fluorinated gases, 39
Figure 7UK emissions of greenhouse gases, million metric tons of carbon dixide equivalent (MtCO2e), 2014
Source: Committee on Climate Change, The fifth carbon budget – the next step towards a low-carbon economy, November 2015
The power sector accounts for nearly 25% of UK’s Greenhouse gas emissions

Nuclear power in the UK Part One 19
1.14 The Department wants new generating capacity to be mainly lower-carbon technologies, such as wind, solar, nuclear and gas. By 2035, the Department projects that renewable and nuclear power will account for 273 TWh of the UK’s electricity generation (75% of total generation compared with 46% in 2015) (Figure 8).
Figure 8Outturn and projected power generation by source –all power producers, 2015 and 2035
Generation (TWh)
Renewable sources and nuclear will replace coal-fired plants and a large part of gas generation
Other
Coal and natural gas CCS
Natural gas
Nuclear
Renewables
Coal
Note
1 The Department’s central projection assumes that coal and natural gas carbon capture and storage (CCS) begin generating on a small scale from 2019. By 2035, CCS is projected to produce almost 40 TWh of electricty (11% of total UK generation).
Source: National Audit Office analysis of Department of Energy & Climate Change energy trends and projections data
100
150
200
250
300
350
400
50
02015 2035
Renewables and nuclear power, 154 TWh
76
83
70121
152
100
8
9
39
44
Renewables and nuclear power, 273 TWh

20 Part One Nuclear power in the UK
1.15 The Department’s objective to decarbonise the power supply is in tension with its objectives to provide a secure supply while keeping bills affordable:
• security of supply: Most renewable sources can only generate electricity in the right conditions, such as when the wind is blowing or the sun is shining. Other generating sources, such as gas, may be needed to ensure sufficient supply at times of peak demand.
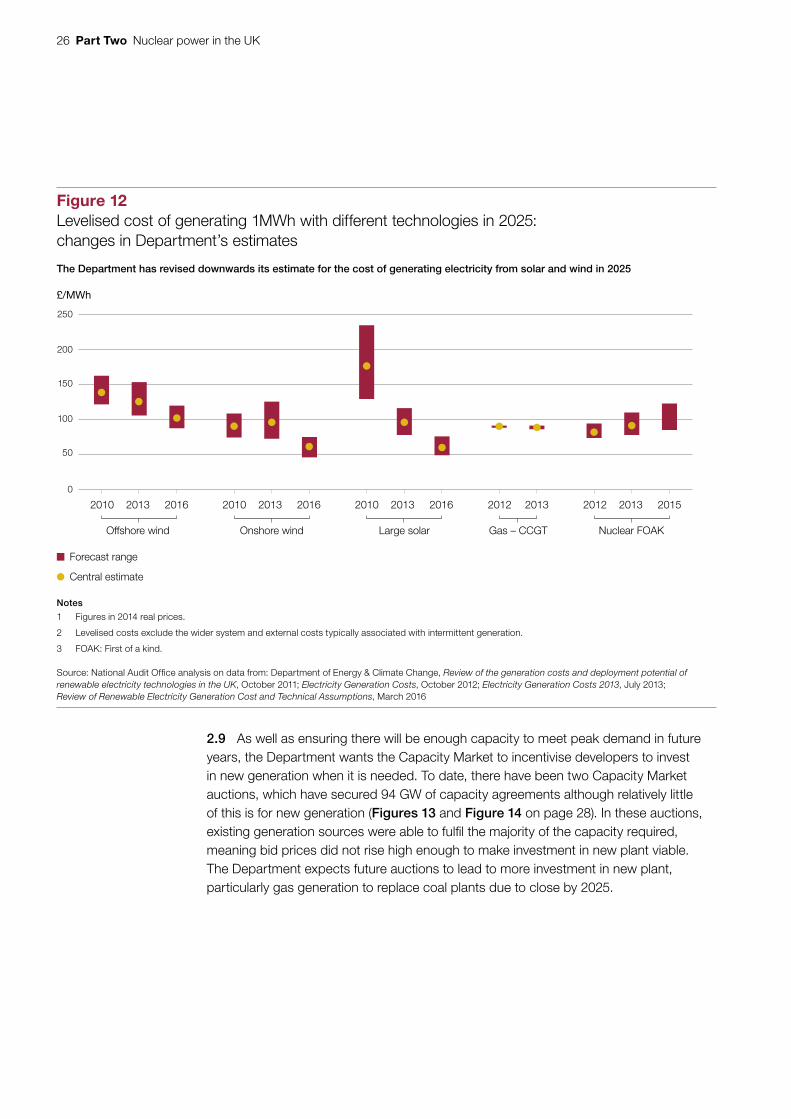
• affordability: The lifetime cost of renewable generation is generally higher than generating power with traditional, fossil-fuelled technologies (Figure 12 on page 26). Having a greater proportion of the supply from renewable sources is therefore likely to increase people’s bills. The government has created a ‘Carbon Price Floor’ requiring fossil-fuel generators to pay for their emissions to improve the cost competitiveness of renewable sources.

Nuclear power in the UK Part Two 21
Part Two
The Department’s policies for a secure, affordable and clean electricity supply
2.1 This part sets out the Department of Energy & Climate Change’s (the Department’s) strategy for supporting investors in new generating capacity that is mainly low-carbon and affordable for consumers.
Contracts for Difference (CfDs)
2.2 Through Contracts for Difference (CfDs) low-carbon generators are paid the difference between the ‘strike price’ they receive for electricity sold and the ‘reference price’ – a measure of the average market price for electricity in the UK market. If the reference price for electricity in the UK falls below this ‘strike price’, a government company, the Low Carbon Contracts Company (LCCC) will pay generators the difference between the reference price and the strike price. LCCC will then recover these costs through a levy on energy suppliers. If the reference price is above the strike price, generators will pay LCCC the difference, which it then passes on to suppliers. This means the costs or savings can ultimately impact on consumers’ bills (Figure 9 overleaf). Typically the contracts last for 15 years from when generation begins.
2.3 By using CfDs, the Department aims to make investments viable where market prices for electricity are lower than what developers require. The Department also wants CfDs to create competition between projects and technologies and intends to award contracts through competitive auctions. It expects this to bring down the cost of constructing and running new generating sources, minimising the impact on bills. We previously reported that CfDs should offer better value for money than the Renewables Obligation, which they replace, as guaranteeing the price of each unit of electricity sold should reduce financing costs.10
10 Comptroller and Auditor General, Early contracts for renewable electricity, Session 2014-15, HC 172, National Audit Office, June 2014.

22 Part Two Nuclear power in the UK
0
20406080
100
120
140
Yea
r 1Y
ear 2
Yea
r 3Y
ear 4
Yea
r 5Y
ear 6
Yea
r 7Y
ear 8
Yea
r 9Y
ear 1
0Y
ear 1
1Y
ear 1
2Y
ear 1
3Y
ear 1
4Y
ear 1
5
R
efer
ence
ele
ctric
ity p
rice
En
ergy
gen
erat
or p
ays
En
ergy
gen
erat
or re
ceiv
es p
aym
ents
S
trik
e pr
ice
Fig
ure
9H
ow C
ontr
acts
for
Diff
eren
ce w
ork
£ p
er M
Wh
No
te
1 Fo
r nu
clea
r C
fDs,
the
refe
renc
e p
rice
is b
ased
on
the
year
-ahe
ad a
vera
ge, m
eani
ng it
is fi
xed
and
spre
ad e
venl
y ac
ross
eac
h ye
ar.
Sou
rce:
Nat
iona
l Aud
it O
ffice
The
diff
eren
ce b
etw
een
refe
renc
e p
rice
and
who
lesa
le e
nerg
y p
rice
det
erm
ine
the
dire
ctio
n o
f p
aym
ents

Nuclear power in the UK Part Two 23
2.4 So far, the Department has awarded contracts to 35 projects. This has generated investment in up to 6.7 GW of new generating capacity (Figure 10). It awarded the first round of eight contracts in 2014 based on administratively set prices rather than a competitive basis to prevent a hiatus in investment in renewable electricity. These contracts enabled the developers to take final investment decisions before the full CfD regime began. We previously reported on the Department’s awarding of these contracts, and found that the strike prices may provide higher returns for investors than were needed to secure investment.11 Strike prices awarded through the competitive auctions were lower than those that the Department set for the early CfDs.
11 See footnote 10.
Figure 10Contracts for Difference awarded
Technology GW Number of projects
Strike price(£/MWh)
Delivery year
Negotiated contracts – May 20142
Offshore wind 3.18 5 144–154 2017–2021
Biomass conversion 1.07 2 103–108 2015-16
Biomass combined heat and power 0.30 1 129 2018
Total 4.55 8
Auction February 20153 Offshore wind 1.16 2 114–120 2017–2019
Onshore wind 0.75 15 79–83 2016–2019
Energy from waste with combined heat and power
0.10 2 80 2018-19
Energy from waste – advanced conversion technologies
0.06 3 114–120 2017–2019
Solar PV 0.07 5 50–794 2015–2017
Total 2.14 27
Total 6.65 35
Notes
1 Figures may not add up due to rounding
2 2013-14 real prices.
3 2012 real prices.
4 Following the Round 1 CfD allocation auction, two solar projects that had bid for CfDs with a strike price of £50 per MWh announced that they would not be proceeding to signature of the CfD with LCCC. A further solar project was terminated by LCCC as a result of the project’s failure to meet the milestone delivery requirements within the contracted delivery date. The remaining two solar projects both have a strike price of £79.23 per MWh (2012 prices).
Source: Comptroller and Auditor General, Early contracts for renewable electricity, Session 2014-15, HC 172, National Audit Offi ce, June 2014; Department of Energy & Climate Change, Contracts for Difference (CFD) Allocation Round One Outcome, February 2015

24 Part Two Nuclear power in the UK
Progress on renewables
2.5 Progress in deploying the low-carbon technologies that CfDs support is ahead of the Department’s previous expectations. The Department publishes annual projections of the amount of electricity generated by different sources, including renewables. The Department now projects that the share of electricity generated by renewable sources at its peak in 2026 will be eight percentage points higher than it thought in 2012 (Figure 11).
2.6 The costs of wind and solar are also falling. The Department estimates the total cost necessary to generate electricity for each technology, known as the levelised cost of energy (LCOE). The LCOE usually falls with time as new technologies become more established. This has been the case with wind and solar, which are now substantially cheaper than they were 10 years ago. However, investment decisions are taken many years in advance. The Department therefore estimates the LCOE of different technologies for future years, which allows it to understand which are likely to be more competitive. The Department’s forecasts for the LCOE of wind and solar in 2025 have decreased since 2010. The cost forecast for gas has not changed, while for nuclear it has increased (Figure 12 on page 26).
2.7 LCOE provides an incomplete picture. It does not reflect that wind and solar are intermittent, unlike more flexible sources such as gas-fired power stations. Intermittent sources, as well as inflexible sources like nuclear, could also require additional investment in new ways of distributing electricity to customers compared to traditional fossil-fuelled sources.
The Capacity Market
2.8 Through the Capacity Market, the Department commits to providing revenue certainty to power generators in return for guarantees that power will be available at a certain time in the future. Like CfDs, Capacity Market agreements are auctioned. The Secretary of State sets the amount of capacity required four years ahead of each auction, following technical recommendations from National Grid. Bidders then present their offer for an amount of capacity with a price, with the Department accepting bids from the cheapest upwards until the total capacity offered equals the auctioned amount. All successful bidders then receive the most expensive bid price required to reach the necessary capacity. Auctioned contracts are for between 1 and 15 years of capacity availability. Energy suppliers pay capacity operators and recover the cost through electricity bills. The Capacity Market is technology-neutral: plant characteristics such as carbon-dioxide emissions do not factor in whether a capacity agreement is awarded.

Nuclear power in the UK Part Two 25
Fig
ure
11
Cha
nges
in th
e D
epar
tmen
t’s p
roje
ctio
ns fo
r ren
ewab
le e
lect
ricity
gen
erat
ion
Ren
ewab
les
as a
sha
re o
f tot
al e
lect
ricity
gen
erat
ion
(%)
Co
mp
ared
to
201
2, t
he D
epar
tmen
t no
w p
red
icts
tha
t re
new
able
so
urce
s w
ill g
ener
ate
mo
re e
lect
rici
ty
2008
2009
2010
2011
2012
2013
2014
2015
2016
2017
2018
2019
2020
2021
2022
2023
2024
2025
2026
2027
2028
2029
2030
Sou
rce:
Dep
artm
ent o
f Ene
rgy
& C
limat
e C
hang
e, E
nerg
y &
Em
issi
ons
Pro
ject
ions
201
2 an
d U
pd
ated
Ene
rgy
& E
mis
sion
s P
roje
ctio
ns 2
015
2015
2015
pro
ject
ion
2012
2012
pro
ject
ion
05
101520253035404550
26 Part Two Nuclear power in the UK
2.9 As well as ensuring there will be enough capacity to meet peak demand in future years, the Department wants the Capacity Market to incentivise developers to invest in new generation when it is needed. To date, there have been two Capacity Market auctions, which have secured 94 GW of capacity agreements although relatively little of this is for new generation (Figures 13 and Figure 14 on page 28). In these auctions, existing generation sources were able to fulfil the majority of the capacity required, meaning bid prices did not rise high enough to make investment in new plant viable. The Department expects future auctions to lead to more investment in new plant, particularly gas generation to replace coal plants due to close by 2025.
Figure 12Levelised cost of generating 1MWh with different technologies in 2025: changes in Department’s estimates
£/MWh
The Department has revised downwards its estimate for the cost of generating electricity from solar and wind in 2025
Forecast range
Central estimate
Notes
1 Figures in 2014 real prices.
2 Levelised costs exclude the wider system and external costs typically associated with intermittent generation.
3 FOAK: First of a kind.
Source: National Audit Office analysis on data from: Department of Energy & Climate Change, Review of the generation costs and deployment potential of renewable electricity technologies in the UK, October 2011; Electricity Generation Costs, October 2012; Electricity Generation Costs 2013, July 2013; Review of Renewable Electricity Generation Cost and Technical Assumptions, March 2016
2010 2013 2016 2010 2013 2016 2010 2013 2012 20132016 2012 2013 2015
0
50
100
150
200
250
Offshore wind Onshore wind Large solar Nuclear FOAKGas – CCGT

Nuclear power in the UK Part Two 27
Figure 13Results of the 2014 and 2015 Capacity Market auctions
Technology 2014 auction 2018‑19 capacity
(GW)
2015 auction2019‑20 capacity
(GW)
Total
(GW)
Capacity(GW)
Combined Cycle Gas Turbines
22.3 21.8 44.1
Combined Heat and Power and autogeneration
4.2 4.2 8.4
Coal/Biomass 9.2 4.7 13.9
Demand-side response
0.2 0.5 0.7
Hydro 0.7 0.7 1.4
Nuclear 7.9 7.6 15.5
Open Cycle Gas Turbines and reciprocating engines
2.1 2.4 4.5
Storage 2.7 2.6 5.3
Interconnector – 1.9 1.9
Total 49.3 46.4 93.8
Duration 1 year 89% 98%
3 years 6% –
15 years 5% 2%
Cost
(£m)
Clearance price
Total cost
£19.4 per kW per year
£9992
£18 per kW per year
£8341 £1,833
Notes
1 2014-15 prices.
2 2012 prices.
Source: National Audit Offi ce analysis on National Grid, Final Auction Results, T-4 Capacity Market Auction for 2019-20 and National Grid, Final Auction Results, T-4 Capacity Market Auction 2014

28 Part Two Nuclear power in the UK
Nuclear power
2.10 The government wants nuclear power to be a significant part of a balanced power generation mix. It wants to stimulate a renaissance in building nuclear power stations in the UK – there has not been a new one built since 1995. The Department believes that nuclear contributes to all three objectives of its ‘trilemma’:
• secure supply: it provides baseload electricity irrespective of whether the sun is shining or the wind is blowing;
• decarbonisation: it is a low-carbon technology that can be delivered at scale. The Department’s modelling concludes that having nuclear power in the UK’s future energy mix reduces the costs of meeting the UK’s 2050 decarbonisation target; and
• affordability: it is cheaper than some other low-carbon alternatives, and comparable with gas-fired power stations (including government-set carbon prices), over the lifetime of generation.
33.6
0.2
42.0
1.9 0.5
0
5
10
15
20
25
30
35
40
45
Existing generation
2.6 1.9
New-build generation Interconnector Demand-sideresponse
0.1
Refurbished generation
12.9
Figure 14Sources of capacity procured through Capacity Market auctions
Gigawatts
New-build generation was 5% of capacity procured in the 2014 auction and 4% of the capacity procured in the 2015 auction
Source: National Audit Office analysis on National Grid, Final Auction Results, T-4 Capacity Market Auction for 2019-20 and National Grid, Final Auction Results, T-4 Capacity Market Auction 2014
2014 2015

Nuclear power in the UK Part Two 29
The challenges of nuclear power
2.11 There are specific challenges in ensuring that nuclear power is on an equal footing in the market with other low-carbon technologies:
• Nuclear power plants have very high upfront costs and take a long time to build. Costs have increased in recent years given the extra safety considerations following the Fukushima disaster and increasing terrorist threats. These are offset to some extent by low running costs, which are not linked to the price of fuel in the way that gas, coal and oil power plants are. This means investments in nuclear power have a very long payback period.
• Nuclear power investments are therefore exposed to external risks, including changes in government policy and market fluctuations, such as falls in the wholesale price of electricity. This could result, for example, from technological advances in how electricity is generated, stored or distributed.
• Nuclear power plants are ideal for providing baseload capacity, but are inflexible. Running them at less than full capacity generates few cost savings.
• The disposal of nuclear waste poses particular challenges and is expensive. Spent nuclear fuel remains radioactive for millennia and it is not yet possible to guarantee complete decontamination.
• The costs to decommission nuclear power stations are very high relative to other low-carbon technologies. These costs are generally far in the future and therefore uncertain.
2.12 Furthermore, there are some challenges specific to building new nuclear power stations in the UK:
• No new nuclear power stations have been built in the UK for over 20 years. The UK lacks a proven, skilled supply chain to support the construction of a new power station. The costs to build ‘first-of-a-kind’ power stations will be much higher than in countries that have rolled out new facilities, where learning and expertise can be shared.
• The government’s policy is that new nuclear generation should be privately-financed. There are very few private companies able to risk such large upfront investments with such a long payback period. Many companies in the European utility sector, which would be potential investors, have faced financial pressures in recent years, partly due to falls in wholesale electricity prices.

30 Part Two Nuclear power in the UK
Government strategy
2.13 The government has a package of measures to overcome barriers to investment in new nuclear power stations (Figure 15). In 2011, the Department identified eight sites it considered potentially suitable for constructing new nuclear power stations by 2025 (Figure 16).
Figure 15Government’s policies to facilitate new nuclear power stations
Measure Description
Planning laws The Planning Act 2008 streamlined the process to facilitate the siting and building of significant new infrastructure projects such as nuclear power stations, railways, airports and sewage treatment works.
Siting The Department published a national nuclear policy statement in July 2011 saying planning decisions for new nuclear power stations should give ‘substantial weight to the benefits’ (including the benefits of displacing carbon dioxide emissions). The Department identified eight sites in the policy statement that it considered potentially suitable for constructing new nuclear power stations by the end of 2025 (Figure 16).
Site licensing Construction of a new nuclear power station cannot commence until a site licence has been granted to a corporate body by the Office for Nuclear Regulation (ONR). ONR granted a licence to NNB Generation Company Ltd in November 2012 to construct and operate a nuclear reactor at the Hinkley Point C site.
Generic Design Assessment
ONR and the Environment Agency (for sites in England) conduct an assessment process, which considers the safety, security and environmental implications of new reactor designs. So far, only the EDF/Areva UK European Pressurised Water Reactor has received a Design Acceptance Confirmation.
Bespoke contracts for difference
The Department has negotiated bilaterally with EDF a contract for difference (CfD)for the building of HPC. The CfD will last for 35 years, longer than the typical timeframe of existing CfDs (15 years). It also includes a Secretary of State Investor Agreement, which means the government will compensate investors if the plant is shut shown for reasons that are political, or due to certain changes in insurance arrangements or certain changes in law.
UK guarantee scheme
The government will provide a guarantee to help support crucial infrastructure projects (not just in energy) seeking finance and investment. It has provisionally agreed a £2 billion loan guarantee for Hinkley Point C.
Funded Decommissioning Programme (FDP)
The Department has established a model agreement whereby investors ensure decommissioning and waste management liabilities are funded out of their operational revenues. Part of the fund will go towards costs of transferring intermediate-level waste and spent fuel to a geological disposal facility. The government will take on liability for transferring waste, but it expects that investors’ contributions will be sufficient to cover the costs. An independent board, the Nuclear Liabilities Financing Assurance Board, advises the Secretary of State on the suitability of an operator’s proposed FDP.
Source: National Audit Offi ce

Nuclear power in the UK Part Two 31
Figure 16Nuclear existing capacity and newly licensed sites
Licensed site
Existing site, scheduled for decommissioning
Source: National Audit Offi ce analysis
The government identified eight sites suitable for new nuclear power plants
Hunterston, North Ayrshire
Existing station in operation until 2023
Moorside, Cumbria
Oldbury, Gloucestershire
Hinkley Point, Somerset
Existing station in operation until 2023
Heysham, Lancashire
Existing station in operation until 2024 (Heysham I) and 2030 (Heysham II)
Dungeness, Kent
Existing station in operation until 2028
Bradwell, Essex
Sizewell, Suffolk
Existing station in operation until 2035
Hartlepool, County Durham
Existing station in operation until 2024
Torness, East Lothian
Existing station in operation until 2030
Wylfa, Anglesey

32 Part Two Nuclear power in the UK
Progress of the new nuclear strategy
2.14 The Department has negotiated commercial terms on a deal with NNB Generation Company (NNBG) for Hinkley Point C (HPC). NNBG is owned by EDF, the French state-owned energy company. Once the deal is finalised, China General Nuclear Power Corporation (CGN) will take 33.5% ownership of NNBG. Although contracts will not be signed until EDF’s final investment decision, the Department notified Parliament of potential contingent liabilities relating to the HPC deal in October 2015. This included:
• A 35-year CfD, with a strike price of £92.50. The Department calculated at that time that top-up payments under the contract would be between £4 billion and £19 billion depending on future wholesale prices.12 The contract has some mechanisms which mean the strike price could be adjusted in certain circumstances. For example, if the costs to build HPC are less than expected, or the costs to run it once built are higher or lower than forecast.
• A Secretary of State Investor Agreement, which provides protection if there is a change in government policy that means HPC would be shut down. The Department calculated that this could cost up to £22 billion (2012 prices).
• Waste Transfer Contracts, through which the government takes on the liability for the spent fuel and intermediate-level waste from HPC. NNBG will be required to pay a ‘risk fee’ at the start of power generation, and a further waste transfer fee, which the government will set around 25 years after the start of power generation. The Department will incur a liability if the total fees are less than the actual costs. It states this risk is ‘very low’.
2.15 Also as part of the deal, HM Treasury has agreed provisionally to guarantee up to £2 billion of NNBG’s bonds issued to finance construction. The guarantee would be repayable first by NNBG’s shareholders (EDF and CGN) in 2020 with any unmet liabilities then falling to the government.
2.16 EDF’s current expectation is that two reactors at HPC will begin generating 3.2 GW of electricity in 2025, fulfilling around 7% of the UK’s total electricity demand. EDF’s final decision on whether to proceed with HPC has been delayed and it is still uncertain when EDF will begin constructing the facility. EDF expects HPC to cost £18 billion to build, excluding financing costs.
12 2012 prices, discounted to 2012 using discount rate of 3.5%. Low estimate is based on high fossil-fuel price series and rising carbon prices. High estimate is based on low fossil-fuel prices and flat carbon price increases.

Nuclear power in the UK Part Two 33
2.17 Two other new nuclear projects have direct links to the HPC deal. EDF and CGN have reached a provisional agreement on jointly developing two more nuclear power stations, at Sizewell and Bradwell. If Sizewell goes ahead, the HPC contract for difference strike price will be £89.50 rather than £92.50. Also as part of the same deal, CGN intend to lead the development of a nuclear power station in Bradwell in partnership with EDF who would hold a 33.5% stake in the project. CGN plans to begin the Generic Design Assessment process for its Hualong reactor once the HPC deal has concluded. It will need to achieve regulators’ entry requirements and be given permission by ministers to proceed.
2.18 Two further nuclear reactor vendors, Hitachi-GE and Westinghouse, are going through the Generic Design Assessment process for their reactor designs. Both designs are expected to gain approval by 2018 or earlier (Figure 17 on pages 34 and 35). At the same time, Horizon Ltd and NuGen are seeking nuclear site licences in 2018 for Wylfa Newydd and Moorside respectively. Under current plans, both consortia could have a new nuclear plant up and running by the mid-2020s.

34 Part Two Nuclear power in the UK
Figure 17New nuclear pipeline
Six projects are currently in development
Note
1 Future milestones are based on best estimates provided by the Offi ce for Nuclear Regulation and developers. No contingency has been built in for delays in obtaining the necessary approvals, agreeing a CfD or construction.
Source: Offi ce for Nuclear Regulation and nuclear power station developers
1995
Last nuclear power station built at Sizewell B
Jul 2006
2006 Energy Challenge Review published
Reintroduced the prospect of new nuclear power stations in the UK
Jan 2008
Meeting the Energy Challenge: A White Paper on Nuclear Power published
Sets out the government’s strategic case for new nuclear
Jul 2011
National Policy Statement for Nuclear Power Generation published
Oldbury
Horizon (Hitachi Ltd)
2 x 1.35 GW ABWR reactors
ABWR design – See Wylfa Newydd
No decision date No details yet No details yet No details yet No start date No start date
Bradwell B
CGN
2 x 1.2 GW Hualong One reactors
GDA process will start following Hinkley Point C final investment decision
No decision date No details yet No details yet No decision date No start date No start date
Wylfa Newydd
Horizon (Hitachi Ltd)
2 x 1.35 GW ABWR reactors
Apr 2013 – Hitachi-GE submits ABWR design to the regulators
Expected to be completed by the end of 2017
Horizon to submit site licence application by 2017
Licence expected to be granted 2018
Expected 2019 Scheduled 2019 Pencilled in for 2019
Scheduled mid-2020s
Hinkley Point C
NNBG (EDF/CGN)
2 x 1.6 GW EPR reactors
Aug 2007 – EDF/Areva submits EPR design to regulators for regulatory assessment
Oct 2013 – Key terms agreed
Scheduled Jul 2016–Sep 2016
Scheduled 2017-18 Scheduled2025
Dec 2012
Nov 2012
Sizewell C
NNBG (EDF/CGN)
2 x 1.6 GW EPR reactors
No details yet No details yet Pencilled in for 2018-19
Possibly 2028EPR design – See Hinkley Point C
Nov 2012
No details yet
Moorside
NuGen (Toshiba/Engie)
3 x AP1000 reactors providing up 3.8 GW
Expected 2018 Following site licence (expected 2018 )
Pencilled in for 2019
Scheduled mid-2020s
Aug 2007 – Westinghouse submits AP1000 design to the regulators
December 2011 – Interim design acceptances given before pause in GDA process
August 2014 – GDA process recommenced
Expected to be completed by Mar 2017
NuGen to submit site licence application by 2017
Licence expected to be granted 2018
Planned nuclear new build
Generic Design Assessment (GDA) process started
Completion of GDA
Site licence
Contract for difference
Final investment decision
Construction begins
Generation begins

Nuclear power in the UK Part Two 35
Figure 17New nuclear pipeline
Six projects are currently in development
Note
1 Future milestones are based on best estimates provided by the Offi ce for Nuclear Regulation and developers. No contingency has been built in for delays in obtaining the necessary approvals, agreeing a CfD or construction.
Source: Offi ce for Nuclear Regulation and nuclear power station developers
1995
Last nuclear power station built at Sizewell B
Jul 2006
2006 Energy Challenge Review published
Reintroduced the prospect of new nuclear power stations in the UK
Jan 2008
Meeting the Energy Challenge: A White Paper on Nuclear Power published
Sets out the government’s strategic case for new nuclear
Jul 2011
National Policy Statement for Nuclear Power Generation published
Oldbury
Horizon (Hitachi Ltd)
2 x 1.35 GW ABWR reactors
ABWR design – See Wylfa Newydd
No decision date No details yet No details yet No details yet No start date No start date
Bradwell B
CGN
2 x 1.2 GW Hualong One reactors
GDA process will start following Hinkley Point C final investment decision
No decision date No details yet No details yet No decision date No start date No start date
Wylfa Newydd
Horizon (Hitachi Ltd)
2 x 1.35 GW ABWR reactors
Apr 2013 – Hitachi-GE submits ABWR design to the regulators
Expected to be completed by the end of 2017
Horizon to submit site licence application by 2017
Licence expected to be granted 2018
Expected 2019 Scheduled 2019 Pencilled in for 2019
Scheduled mid-2020s
Hinkley Point C
NNBG (EDF/CGN)
2 x 1.6 GW EPR reactors
Aug 2007 – EDF/Areva submits EPR design to regulators for regulatory assessment
Oct 2013 – Key terms agreed
Scheduled Jul 2016–Sep 2016
Scheduled 2017-18 Scheduled2025
Dec 2012
Nov 2012
Sizewell C
NNBG (EDF/CGN)
2 x 1.6 GW EPR reactors
No details yet No details yet Pencilled in for 2018-19
Possibly 2028EPR design – See Hinkley Point C
Nov 2012
No details yet
Moorside
NuGen (Toshiba/Engie)
3 x AP1000 reactors providing up 3.8 GW
Expected 2018 Following site licence (expected 2018 )
Pencilled in for 2019
Scheduled mid-2020s
Aug 2007 – Westinghouse submits AP1000 design to the regulators
December 2011 – Interim design acceptances given before pause in GDA process
August 2014 – GDA process recommenced
Expected to be completed by Mar 2017
NuGen to submit site licence application by 2017
Licence expected to be granted 2018
Planned nuclear new build
Generic Design Assessment (GDA) process started
Completion of GDA
Site licence
Contract for difference
Final investment decision
Construction begins
Generation begins

36 Part Three Nuclear power in the UK
Part Three
Value-for-money risks
3.1 We have previously reported on the main risks to value for money arising from government’s planning for economic infrastructure, including energy. These are:
• inaccurate identification of the need for infrastructure;
• policy uncertainty;
• failure to assess the cumulative impact on consumers of funding infrastructure through bills;
• taxpayers’ exposure to losses; and
• delivery costs that are higher than they should be.13
3.2 This part of the report describes the relevance of these risks to the Department of Energy & Climate Change’s (the Department’s) approach to securing investment in new generating capacity, particularly nuclear power.
Identifying the need for infrastructure
Demand uncertainties
3.3 The Department’s strategy is underpinned by its projections for electricity demand. Predicting demand is challenging as it is subject to particular risks and uncertainties, such as technological changes, economic trends and consumer behaviour. If the Department overestimates demand, it could provide support and incentives to more projects than is necessary, which would result in poor value for money. Equally, if it underestimates demand, it may need to take short-term remedial action in the future that could be more expensive to consumers, or more polluting.
13 Comptroller and Auditor General, Planning for economic infrastructure, Session 2012-13, HC 595, National Audit Office, January 2013.

Nuclear power in the UK Part Three 37
3.4 In Part One, we explained that the Department’s projections of electricity demand have fallen significantly since 2012. National Grid, which runs the country’s core electricity and gas transmission networks, produces its own projections, which are different to the Department’s. Its 2016 Future Energy Scenarios assume slower electrification of heat and transportation and therefore predict slower increases in electricity demand than the Department. National Grid predicts that demand will increase by 10% at most by 2035, compared with the Department’s central scenario prediction of a 20% increase.
Supply uncertainties
3.5 The rate that existing generating sources will close is also uncertain. The Department predicts that 64 GW of the UK’s existing generating capacity may close on technical or economic grounds over the next two decades. But some of these are decisions for the power station owners, rather than government. For example, EDF announced plans in February 2016 to extend the operating lives of four of its nuclear power stations – Hartlepool, Heysham I and II, and Torness – for up to seven years. This will make an extra 4.7 GW available until 2024, of which 2.4 GW will be available until 2030. However, if the projected closures of existing plants happen more quickly, for example because power stations fail, increased pressure will be put on security of supply.
New technologies
3.6 The nature of demand for electricity in future could change as a result of technological advances. The rate of change and the reliability of new technologies are uncertain but could have an impact on the future generating mix.
Storage
3.7 The government’s National Infrastructure Commission recently reported that in future storage could be used at every level, from the whole network down to individual households. This could be through a mix of batteries, hydropower and supercapacitors. The National Infrastructure Commission points out that the cost of some of these technologies have fallen dramatically in recent years: lithium ion batteries cost less than 7% now of what they did in 1990.14 However, the ability of current electricity storage technologies to provide power over long time periods remains limited.
14 National Infrastructure Commission, Smart Power, March 2016, p. 10.

38 Part Three Nuclear power in the UK
Demand-side response
3.8 Demand-side response is where households and businesses use electricity more flexibly, so that they use less during times of peak demand and more during times of low demand. Reducing electricity use at peak times reduces the total capacity required. The National Infrastructure Commission calculates that if 5% of current peak demand were met by demand flexibility then the power saved would be equivalent to a new nuclear power station.15 Spreading out people’s use of electricity would increase the value of generation sources that can only generate power in certain conditions, such as wind and solar.
Impact on nuclear power’s role
3.9 Developments in storage technology and increased use of demand-side response could change the role that nuclear power plays in the generating mix, but this is uncertain. One of the Department’s main reasons for including nuclear power in the generating mix is that it provides baseload capacity to complement the intermittency of renewable sources like wind and solar. If major advances are made in storage technology, electricity from wind and solar could be captured and used when the wind stops blowing or the sun stops shining. The need for baseload could then reduce. Alternatively, storage technology may enable baseload to be absorbed during dips in demand and released during peaks when it is needed. If demand for electricity is also more flexible or evenly spread, this would counter the relative inflexibility of nuclear power.
Policy uncertainty
3.10 The government relies on market conditions and investor confidence to minimise the support needed for private investment in new generating sources. Securing investment depends critically on developers’ perspectives of future trends in fossil-fuel, wholesale-power and carbon prices, and cost trajectories of low-carbon generating technologies. Developers determine the return they require according to the perceived risk of investing in a project (hurdle rate). If they calculate that returns will be lower than the hurdle rate they will not invest without government support, such as through CfDs. However, if investors perceive the risks are still too high compared to the likely return then few will come forward. This could mean more government support is needed, which could increase costs to consumers.
15 National Infrastructure Commission, Smart Power, March 2016, p. 48.

Nuclear power in the UK Part Three 39
3.11 A lack of certainty could lead to project sponsors, lenders and contractors deferring or abandoning UK projects in favour of opportunities elsewhere. We have previously described the need for greater certainty in the government’s and regulators’ decisions to improve market confidence in the pipeline of investment and contracting opportunities.16 Some stakeholders have raised concerns about the impact of recent government decisions on investor confidence. A recent Energy and Climate Change Committee inquiry identified several factors that have combined to damage investors’ confidence. These include sudden policy changes, an inconsistent approach, lack of transparency and lack of a long-term vision.17 The UK’s position in the EY Renewable Energy Country Attractiveness Index, a measure of investor confidence, has steadily declined over the past two years (Figure 18). Investor confidence could also be impacted by factors outside the Department’s control, such as the uncertainty following the EU Referendum.
Impact on consumers
3.12 The costs of the Department’s interventions to ensure enough new generating capacity is built will ultimately be passed onto consumers’ bills. If the Department fails to assess the cumulative impact on bills of its policies there is a risk of financial hardship for consumers, or the need for unplanned taxpayer support.
3.13 The government introduced the Levy Control Framework to control the costs of supporting investment in low-carbon generation and to protect consumers. The Levy Control Framework caps aggregate spending on consumer-funded support for low-carbon projects in 2020-21 at £7.6 billion (2011-12 prices). The Department estimates that this will add, on average, around £92 (7%) to annual household energy bills in 2020 (real 2014 prices).18
16 Comptroller and Auditor General, Planning for economic infrastructure, Session 2012-13, HC 595, National Audit Office, January 2013, paragraph 4.3.
17 Energy and Climate Change Committee, Investor confidence in the UK energy sector, Third report of Session 2015-16, HC 542, March 2016.
18 Department of Energy & Climate Change, Estimated impacts of energy and climate change policies on energy prices and bills, November 2014, available at: www.gov.uk/government/publications/estimated-impacts-of-energy-and-climate-change-policies-on-energy-prices-and-bills-2014, Department of Energy & Climate Change prices and bills report 2014.
Figure 18UK position on EY Renewable Energy Country Attractiveness Index
The UK slid from eighth to thirteenth position following 2015 policy announcements
September 2014
March2015
June 2015
September 2015
May 2016
UK rank 7 8 8 11 13
Source: EY, Renewable Energy Country Attractiveness Index

40 Part Three Nuclear power in the UK
3.14 The most recent forecasts of Levy Control Framework spending suggest the cap will be breached. The Office for Budget Responsibility released forecasts alongside the 2016 Budget showing that the £7.6 billion cap will be exceeded by more than £1.1 billion (2011-12 prices) in 2020-21. This is within the 20% headroom that is permissible in the Framework, but is equivalent to an additional £20 on the average bill. We will report on the Department’s management of the Levy Control Framework later this year.
3.15 Falls in wholesale prices would increase the level of support that consumers provide through CfDs. CfDs fix the cost of electricity from new generating sources so that investments in low-carbon technology are viable. Falls in the market price therefore need to be offset by top-up payments. While this reduces the risks to consumers from price volatility, it means they benefit less from wholesale price reductions.
3.16 The Department has revised downwards its projections of wholesale electricity prices since 2012. The Department publishes projections of electricity wholesale prices up to 20 years ahead. In 2015, the Department projected wholesale electricity to cost £65.58 per megawatt hour in 2030, a 22% fall compared with its 2012 projection (Figure 19). The fall stems mainly from reductions in expected price of fossil fuels. The proliferation of renewable sources, such as wind and solar, also dampens down wholesale prices as their marginal cost to produce electricity is less than fossil-fuelled sources.
0
10
20
30
40
50
60
70
80
90
2015 2016 2017 2018 2019 2020 2021 2022 2023 2024 2025 2026 2027 2028 2029 2030 2031 2032 2033 2034 2035
Figure 19The Department’s projections of wholesale electricity prices
£ per MWh
2012 projection
Source: National Audit Office analysis, Department of Energy & Climate Change
The Department projects lower wholesale electricity prices compared to its 2012 projection
2015 projection

Nuclear power in the UK Part Three 41
3.17 The predicted value of top-up payments under existing and proposed CfDs has increased due to reductions in projected wholesale prices. The Department calculates that in the 2015-16 financial year the current value of future top-up payments through existing CfDs have increased by £5.6 billion because of lower wholesale electricity prices. We estimate that the value of future top-up payments under the proposed HPC CfD have increased from £6.1 billion in October 2013, when the strike price was agreed, to £29.7 billion in March 2016 (Figure 20).
Notes
1 HPC strike price will decrease from £92.50 to £89.50 if NNGB builds a second plant at Sizewell. This will also reduce the forecast difference payments.
2 The October 2013 and April 2014 estimates are based upon the Department’s successive projections of wholesale electricity prices, using their central fossil fuel price trajectory and a rising carbon price assumption. The April 2014 price series was used to value the existing CfD contracts at the date of their signature.
3 The price projections for March 2015 and March 2016 are the series used to value the signed CfD contracts at those dates for the Department’s financial statements.
4 Difference payments have been expressed in 2015-16 prices. They have been discounted at 0.7%, which is the rate HM Treasury specifies for valuing financial liabilities.
Source: National Audit Office analysis; Department of Energy & Climate Change
Wholesale electricity price projection
Figure 20Top-up payments under the Hinkley Point C CfD
£ million discounted, 2015-16 prices
Top-up payments that consumers will make have more than quadrupled since 2013 as wholesale price projections have fallen
6,092
2,723
10,888
29,723
0
5,000
10,000
15,000
20,000
25,000
30,000
35,000
October 2013 April 2014 March 2015 March 2016

42 Part Three Nuclear power in the UK
3.18 The longer duration of the HPC CfD compared with existing CfDs means consumers are exposed to greater uncertainty. The range of potential wholesale electricity prices 35 years from when generation begins (currently expected to be 2025) is very uncertain – the Department only projects wholesale electricity prices for 20 years. Additionally, over a longer timeframe there is greater potential for technological changes that reduce the competitiveness of nuclear compared to other power sources. We previously recommended that the Department should ensure there are effective arrangements for actively managing contracts to minimise their costs to consumers.19 This is especially the case where the contracts last longer.
Taxpayer exposure to losses
3.19 Neither taxpayers nor energy consumers pay anything towards construction under CfDs, meaning they are not exposed to project risks. Difference payments are only made once generation begins. However, taxpayers could be exposed to losses if the government guarantees to bear or share the project risks, such as cost overruns, and that risk subsequently materialises.
3.20 The government’s approach to supporting construction of new nuclear power stations could expose taxpayers to losses:
• Its debt guarantee for HPC covers up to £2 billion of bonds NNBG issues between 2018 and 2020. If the guarantee were ever called on, this could lead to taxpayer losses, although NNBG’s shareholders will be liable before it would fall to government. NNBG will pay a guarantee fee for the risk that the government is taking.
• The government will take on the liability for disposing of spent fuel and intermediate-level waste from HPC, and must provide a waste disposal service. The Department told Parliament that it expects the costs of this liability to be met through NNBG’s Funded Decommissioning Programme. The Department requires NNBG to set aside a certain level of revenues to cover decommissioning costs, including contingency. The Department calculates the risk of taxpayer losses as ‘very low’.
• International and UK law requires nuclear operators to hold insurance or other security to meet claims in the event of a nuclear accident at their site. However, this only covers the first 1,200 million euros of costs in the event of an incident. Costs over and above that amount would have to be met by the taxpayer.
19 Comptroller and Auditor General, Early contracts for renewable electricity, Session 2014-15, HC 172, National Audit Office, June 2014.

Nuclear power in the UK Part Three 43
Total delivery costs
3.21 UK infrastructure costs have historically been higher than those overseas, including for energy infrastructure. Infrastructure UK (IUK) reported in 2010 that there is a UK cost premium of between 10% and 100% for different types of project. IUK’s review found that there was no single reason for this premium. It cited stop-start contracting, fragmentation of the construction industry, and complex procurement approaches as major contributors.20
3.22 Although like-for-like comparisons are difficult, the cost of building new nuclear power stations in the UK may be higher than in other countries (Figure 21). Reasons for this include the lack of recent nuclear programmes, with associated shortage of skills and supply chain; cost of labour; and higher safety requirements compared with other countries.
20 Comptroller and Auditor General, Planning for economic infrastructure, Session 2012-13, HC 595, National Audit Office, January 2013, paragraph 4.7.
UnitedKingdom
Hungary Belgium SlovakRepublic
France Japan Finland UnitedStates
SouthKorea
0
20
40
60
80
100
120
140
160
Figure 21Levelised cost of electricity for nuclear plants in OECD countries
US dollars per MWh
10% discount rate
3% discount rate
Source: National Audit Office analysis, © OECD/IEA and OECD/NEA 2015, Projected costs of generating electricity, IEA publishing. Licence: www.iea.org/t&c
The costs to build nuclear power stations in the UK may be higher than in other countries

44 Part Three Nuclear power in the UK
3.23 Costs could be higher as a result of the government’s policy that nuclear projects should be privately financed. We have previously found that the effective interest rate of all private finance deals across government (7%–8%) is double that of government borrowing (3%–4%). However, private finance can be value for money provided the benefits from risk transfer (such as construction risk) and commercial disciplines outweigh the costs.21
3.24 Supporting early new nuclear projects could lead to higher costs in the short-term than continuing to support wind and solar. The cost competitiveness of nuclear power is weakening as wind and solar become more established. The levelised cost of electricity from wind and solar has reduced in recent years as these technologies have been deployed more widely (Figure 12 on page 26). The decision to proceed with support for nuclear power therefore relies more on strategic than financial grounds: nuclear power is needed in the supply mix to complement the intermittent nature of wind and solar. It is also more easily scalable. For wind and solar to generate the same amount of electricity as a nuclear power plant would mean covering large areas of sea or land, which could cause public opposition and technical challenges.
3.25 There is less competition in the market to build nuclear power stations than for other low-carbon technologies like wind and solar, meaning costs could be higher. At the time the Department negotiated the HPC contract for difference, it was the only potential new nuclear power station with development consent. EDF’s chosen technology – the Areva/EDF EPR pressurised water reactor – was also the only design at an advanced stage for regulatory approval. The Department chose to enter into bilateral negotiations rather than its preferred approach of relying on competition to minimise costs. It thought delays in bringing forward a new nuclear build would be costly in terms of additional carbon and risks to future supply. The Department mitigated the risk that costs could be higher by setting up a cost discovery and verification process that sought to validate expected construction costs and project cash flows. It also negotiated a ‘gainshare’ mechanism as part of the CfD, so consumers benefit if construction costs are lower or returns on the project are higher than anticipated.
21 National Audit Office, The choice of finance for capital investment, March 2015.

This report has been printed on Evolution Digital Satin and contains material sourced from responsibly managed and sustainable forests certified in accordance with the FSC (Forest Stewardship Council).
The wood pulp is totally recyclable and acid-free. Our printers also have full ISO 14001 environmental accreditation, which ensures that they have effective procedures in place to manage waste and practices that may affect the environment.

£10.00
9 781786 040671
ISBN 978-1-78604-067-1
Design and Production by NAO External Relations DP Ref: 11201-001