Nucl. Acids Res. 2011 Medina Rivera 808 24
17
Theoretical and empirical quality assessment of transcription factor-binding motifs Alejandra Medina-Rivera 1,2, *, Cei Abreu-Goodger 3 , Morgane Thomas-Chollier 4 , Heladia Salgado 1 , Julio Collado-Vides 1 and Jacques van Helden 1,2 1 Centro de Ciencias Genomicas, Universidad Nacional Auto ´ noma de Me ´ xico. Av. Universidad s/n. Cuernavaca, Col. Chamilpa, Morelos 62210; Mexico, 2 Laboratoire de Bioinformatique des Ge ´ nomes et des Re ´ seaux (BiGRe). Universite ´ Libre de Bruxelles, Campus Plaine, CP 263. Bld du Triomphe. B-1050 Bruxelles, Belgium, 3 EMBL—European Bioinformatics Institute, Wellcome Trust Genome Campus, Hinxton, Cambridge, CB10 1SD, UK and 4 Department of Computational Molecular Biology. Max Planck Institute for Molecular Genetics. Ihnestrasse 73. 14195 Berlin, Germany Received February 11, 2010; Revised July 2, 2010; Accepted July 27, 2010 ABSTRACT Positi on-spe cific scoring matrice s (PSSMs) are rou- ti nel y used to pre di ct tra nscription fact or (TF)- binding sites in genome sequences. However, their reliability to predict novel binding sites can be far from optimum, due to the use of a small number of training sites or the inappropriate choice of param- eters when building the matrix or when scannin g sequences with it. Measures of matrix quality such as E -value and information content rely on theoret- ical models, and may fail in the context of full genome sequences. We propose a method, imple- ment ed in the program ‘mat ri x- qual it y’ , that combines theoretical and empirical score distribu- tions to ass ess rel iabili ty of PSSMs for predict ing TF- binding si tes. We applied ‘mat rix -qualit y’ to estimate the predictive capacity of matrices for bac- teri al, yeast and mouse TFs. The eval uati on of matrices from RegulonDB reve aled some poorly predictive motifs, and allowed us to quantify the im- provements obtained by appl ying mult i-genome moti f discovery. Inte restingly, the meth od reve als differences between global and specific regulators. It also highlights the enrichment of binding sites in seque nce sets obtained from hi gh- throu ghput ChIP-chi p (bacterial and yeast TFs), and ChIP–se q and experiments (mouse TFs ). The method pre- sented here has many applications, including: se- lecting reliable motifs before scannin g sequen ces; improvi ng motif collections in TFs databases; evaluat ing motifs discovered using high-th roughput data sets. BACKGROUND Position-specific scoring matrices (PSSM) are commonly used to describe the binding specificity of a transcription fac tor (TF) to DNA. Such mat rices can be built fro m colle ction s of exper iment ally chara cter ized bind ing site s (1–7), or result from pattern discovery algorithms (8–12). TF-binding motifs are generally short in length and mod- erately informative, so searching for motif instances over a seq uen ce can return man y fal se pos iti ves. In additi on, annotated bi nding si tes and moti fs ar e of vari able quality. It is thus essential for biologists to evaluate the ability of a PSSM to discover functional binding sites in genome sequences. Sev era l the ore tic al measures hav e been pro pos ed to est ima te int rin sic pro per tie s of a PSS M: inf ormati on content (13,14), E -value (14) a- and b-risk distributions (15) . However, al l of these re ly on some theore ti cal model without any guarantee of their adequacy for pre- dicting binding sites in practice. A precise example of this conflict was shown when comparing matrices designed to pred ict sigma70 promoter s, where infor mati on cont ent was not , sur pri sin gly , the bes t ind ica tor of pre dic tiv e capacity (16). In order to estimate the capability of a PSSM to distin- guish bona fide binding sites from genome background, we propose a method that relies on the combined analysis of theo retic al and empir ical scor e dist ribu tion s in posi tive and negative control sets. Impo rtan tly, positive sets are ana lyz ed us ing mat ric es reb uil t wit h a Leave- One-Out (LOO) pro cedure , to red uce ove r-fi tti ng bia ses. As an additional negative control, we compare empirical distri- but ion s of the or igi nal mat rix wit h tho se of col umn - permuted PSSM. Beyon d quan tify ing the reliabili ty of a matr ix, score dist ribu tion s revea l inter estin g biolo gical prop erti es of *To whom correspondence should be addressed. Tel: +52 777 3132063; Fax: +52 777 3291694; Email: [email protected] 808–824 Nucleic Acids Research, 2011, Vol. 39, No. 3 Published online 4 October 2010 doi:10.1093/nar/gkq710 The Author(s) 2010. Published by Oxford University Press. This is an Open Access article distributed under the terms of the Creative Commons Attribution Non-Commercial License (http://creativecommons.org/licenses/ by-nc/2.5), which permits unrestricted non-commercial use, distribution, and reproduction in any medium, provided the original work is properly cited. a t U N A - C I F N o F e b r u a r y 1 7 , 2 0 1 6 h t t p : / / n a r . o x f o r d j o u r a l s . o r g / D o w n l o a d e d f r o m
-
Upload
pedro-arturo-ach -
Category
Documents
-
view
217 -
download
0
Transcript of Nucl. Acids Res. 2011 Medina Rivera 808 24

8/17/2019 Nucl. Acids Res. 2011 Medina Rivera 808 24
http://slidepdf.com/reader/full/nucl-acids-res-2011-medina-rivera-808-24 1/17
Theoretical and empirical quality assessmentof transcription factor-binding motifs
Alejandra Medina-Rivera1,2,*, Cei Abreu-Goodger3, Morgane Thomas-Chollier4,
Heladia Salgado
1
, Julio Collado-Vides
1
and Jacques van Helden
1,2
1Centro de Ciencias Genomicas, Universidad Nacional Auto noma de Me xico. Av. Universidad s/n. Cuernavaca,
Col. Chamilpa, Morelos 62210; Mexico, 2Laboratoire de Bioinformatique des Ge nomes et des Re seaux (BiGRe).
Universite Libre de Bruxelles, Campus Plaine, CP 263. Bld du Triomphe. B-1050 Bruxelles, Belgium,3EMBL—European Bioinformatics Institute, Wellcome Trust Genome Campus, Hinxton, Cambridge, CB10 1SD,
UK and 4Department of Computational Molecular Biology. Max Planck Institute for Molecular Genetics.
Ihnestrasse 73. 14195 Berlin, Germany
Received February 11, 2010; Revised July 2, 2010; Accepted July 27, 2010
ABSTRACT
Position-specific scoring matrices (PSSMs) are rou-tinely used to predict transcription factor (TF)-
binding sites in genome sequences. However, their
reliability to predict novel binding sites can be far
from optimum, due to the use of a small number of
training sites or the inappropriate choice of param-
eters when building the matrix or when scanning
sequences with it. Measures of matrix quality such
as E -value and information content rely on theoret-
ical models, and may fail in the context of full
genome sequences. We propose a method, imple-
mented in the program ‘matrix-quality’, that
combines theoretical and empirical score distribu-
tions to assess reliability of PSSMs for predicting
TF-binding sites. We applied ‘matrix-quality’ to
estimate the predictive capacity of matrices for bac-
terial, yeast and mouse TFs. The evaluation of
matrices from RegulonDB revealed some poorly
predictive motifs, and allowed us to quantify the im-
provements obtained by applying multi-genome
motif discovery. Interestingly, the method reveals
differences between global and specific regulators.
It also highlights the enrichment of binding sites in
sequence sets obtained from high-throughput
ChIP-chip (bacterial and yeast TFs), and ChIP–seq
and experiments (mouse TFs). The method pre-
sented here has many applications, including: se-
lecting reliable motifs before scanning sequences;
improving motif collections in TFs databases;
evaluating motifs discovered using high-throughput
data sets.
BACKGROUND
Position-specific scoring matrices (PSSM) are commonlyused to describe the binding specificity of a transcriptionfactor (TF) to DNA. Such matrices can be built fromcollections of experimentally characterized binding sites(1–7), or result from pattern discovery algorithms (8–12).TF-binding motifs are generally short in length and mod-erately informative, so searching for motif instances over asequence can return many false positives. In addition,annotated binding sites and motifs are of variablequality. It is thus essential for biologists to evaluate theability of a PSSM to discover functional binding sites ingenome sequences.
Several theoretical measures have been proposed toestimate intrinsic properties of a PSSM: information
content (13,14), E -value (14) a- and b-risk distributions(15). However, all of these rely on some theoreticalmodel without any guarantee of their adequacy for pre-dicting binding sites in practice. A precise example of thisconflict was shown when comparing matrices designed topredict sigma70 promoters, where information contentwas not, surprisingly, the best indicator of predictivecapacity (16).
In order to estimate the capability of a PSSM to distin-guish bona fide binding sites from genome background, wepropose a method that relies on the combined analysis of theoretical and empirical score distributions in positiveand negative control sets. Importantly, positive sets areanalyzed using matrices rebuilt with a Leave-One-Out
(LOO) procedure, to reduce over-fitting biases. As anadditional negative control, we compare empirical distri-butions of the original matrix with those of column-permuted PSSM.
Beyond quantifying the reliability of a matrix, scoredistributions reveal interesting biological properties of
*To whom correspondence should be addressed. Tel: +52 777 3132063; Fax: +52 777 3291694; Email: [email protected]
808–824 Nucleic Acids Research, 2011, Vol. 39, No. 3 Published online 4 October 2010doi:10.1093/nar/gkq710
The Author(s) 2010. Published by Oxford University Press.
This is an Open Access article distributed under the terms of the Creative Commons Attribution Non-Commercial License (http://creativecommons.org/licenses/
by-nc/2.5), which permits unrestricted non-commercial use, distribution, and reproduction in any medium, provided the original work is properly cited.

8/17/2019 Nucl. Acids Res. 2011 Medina Rivera 808 24
http://slidepdf.com/reader/full/nucl-acids-res-2011-medina-rivera-808-24 2/17
TFs, distinguishing global from specific regulators. Weillustrate the pragmatic interest of the method byapplying it to 60 motifs annotated in RegulonDB (17),and show that multi-genome pattern discovery can signifi-cantly improve the quality of problematic motifs.Furthermore, we analyze the enrichment of binding sitesin sequences obtained from a ChIP-chip experiments
characterizing bacterial and yeast TFs (18), as well asChIP–seq experiments for 13 mouse TFs (19).
MATERIALS AND METHODS
Sequence analysis
Except for matrix building (done with MEME and con-sensus), all the sequence retrieval and analysis tasks wereperformed using the Regulatory Sequence Analysis Tools(RSAT) (36–38).
Sequence retrieval
The tool ‘retrieve–seq’ was used to retrieve upstream se-quences of all the protein-coding genes of Escherichia coli K12. Sequence lengths were computed to collect allnon-coding sequence up to the first upstream gene, witha maximal distance of 400 bp.
For multi-genome analysis, putative orthologs were col-lected with ‘get-orthologs’ on the basis of the reciprocalbest-hit criterion, and upstream sequences were collectedfor each organism using the tool ‘retrieve–seq-multigenome’.
Computation of weight scores
The weight score (W S ) of a site is computed according to(14).
Ws ¼ ln P S jM ð Þ
P S jBð Þ
ð1Þ
where S is a sequence segment of the same length as thematrix (w), P(S|M ) is the probability of S given the motif M , and P(S|B) the probability of S given the backgroundmodel B.
PðS jM Þ ¼YW
j ¼1
f 0i , j ð2Þ
f 0i , j ¼ ni , j + pi k
PAr¼1
nr,
j +k
ð3Þ
where i is the residue of sequence S aligned with the j th column of the matrix, f
0
i ; j is the frequency of thisresidue at the j th position of the PSSM, corrected by apseudo-count k (14). The background probability of thesequence PðS jBÞ, can be estimated using either a Bernoullischema, or a higher order Markov chain (21).
Theoretical score distribution
The program ‘matrix-distrib’, available as part of theRSAT suite of programs, is able to compute the
theoretical distribution of WS for a given PSSM witheither Bernoulli (39) or Markovian (21) backgroundmodels. For each possible weight score (W S ), theprogram computes its P-value, defined as the probabilityto observe a score of at least W S under the backgroundmodel.
P-value ¼ PðW wjBÞ
Validation statistics
Sensitivity (Sn) is defined as
Sn ¼ TP=ðTP+FNÞ ð4Þ
where TP is the number true positives (i.e. annotated siteswith W S above a threshold), and FN is the number of falsenegatives (i.e. annotated sites scoring below thatthreshold).
The False Positive Rate (FPR) is defined as
FPR ¼ FP=ðFP+TNÞ ð5Þ
where FP is the number of false positives (i.e. non-bindingsites scoring above the threshold) and TN is the numberof true negatives (i.e. non-binding sites below thethreshold).
Matrix building
PSSMs were collected from RegulonDB in February 2008(2,17). We only retained matrices built from TFs having atleast four binding sites reported in the literature. Themotifs stored in RegulonDB were initially built with theprogram consensus (8). Motif width is set manually foreach TF depending on the sizes of the binding sitesreported in the literature.
In addition to the RegulonDB matrices, we derived newcollections of matrices using two alternative matrix-building programs: MEME (10) and consensus (14). Forbuilding this new collection, redundant sites were filteredout by eliminating sites whose positions overlap by at least8 bp. We also tested the impact of various parameters onthe resulting matrices: (1) motif width varied form 8 to 42;(2) The background Markov was estimated either fromthe complete genome of E. coli K12 or from the subsetof upstream non-coding sequences; (3) for MEME, wetested Bernoulli and first-order Markov models (consen-sus only accepts Bernoulli models).
ChIP-chip data
LexA ChIP-chip detected binding sequences wereobtained from the Supplementary Material of Wadeet al . (30).
RESULTS
Overview of the method
The method, implemented in the software tool‘matrix-quality’, consists of comparing a series of score
Nucleic Acids Research, 2011, Vol. 39, No. 3 809

8/17/2019 Nucl. Acids Res. 2011 Medina Rivera 808 24
http://slidepdf.com/reader/full/nucl-acids-res-2011-medina-rivera-808-24 3/17
distributions that characterize various properties of aPSSM:
(1) The ‘theoretical distribution’ provides an estimate of the expected FPR at each possible weight score (W S ),based on the prior choice of a relevant backgroundmodel.
(2) The ‘empirical score distribution in all upstreamnon-coding sequences’ of the organism of interest.These sequences are essentially composed of non-binding sites (the non-coding genomic background),interspersed with a few functional binding sites. Theempirical distribution typically fits the theoretical dis-tribution for small W S values (the background), butseparates at high W S values, most likely correspond-ing to functional TF-binding sites.
(3) The ‘separation between the right tails of the empir-ical and theoretical distributions’ indicates the cap-ability of the matrix to identify a set of high-scoringputative binding sites in the collection of promoters.We capture this separation by computing normalized
weight difference (NWD) curves.(4) An empirical estimate of the FPR is obtained by
scanning all upstream non-coding sequences withcolumn-permuted matrices, which supposedly donot correspond to any TF in the organism underconsideration. If the background model has beenchosen correctly, the ‘empirical distribution of thepermuted matrices’ should fit the theoreticaldistribution.
(5) The ‘empirical score distribution in the annotatedbinding sites’ indicates the sensitivity of the matrix,i.e. its capability to recover binding sites above agiven W S threshold. Matrices are rebuilt andannotated sites are scored using a LOO procedure
to reduce over-fitting biases when estimating thecapability to detect novel sites.
(6) ‘Receiver Operating Characteristic (ROC) curves’ aredrawn to indicate the tradeoff between sensitivityand FPR. These curves provide a direct way toestimate the expected cost (in terms of false positives)for achieving a desired sensitivity, or, reciprocally,the sensitivity that can be expected for a given FPR.
(7) Optionally, empirical distributions can be measuredin any other sequence set, e.g. sequences pulled downin ChIP-chip or ChIP–seq experiments. The compari-son with the theoretical distribution indicates the en-richment of these collections in putatively functionalbinding sites.
Study cases
As our main study case we apply ‘matrix-quality’ to thePSSM for the E. coli K12 tryptophan repressor (TrpR),obtained from RegulonDB. We also discuss the quality of six other representative TFs: CRP, FNR, LexA, CysB,HipB and NanR. We then extend our analysis to all TFsannotated in RegulonDB and further apply it to severalhigh-throughput datasets from bacteria, yeast and mouse.
The tryptophan repressor (TrpR) is a specific TFinvolved in regulating tryptophan biosynthesis.
RegulonDB holds information on 10 binding sitesassociated with five operons in the genome of E. coli K12 (Figure 1A). The database also contains a PSSMbuilt from the aligned binding sites (Figure 1B).Position-specific residue conservation can be summarizedeither by a degenerate consensus (Figure 1C) or as asequence logo (Figure 1D) (20).
Theoretical score distribution provides an estimateof the FPR
To detect putative binding sites with a PSSM, theRegulatory Sequence Analysis Tools (RSAT) program‘matrix-scan’ (21) computes various statistics, includingthe weight score (W S ) defined by Hertz and Stormo (14)(‘Materials and Methods’ section). However, W S can bemisleading, because its range depends on the matrix widthand information content. A more interpretable score is theP-value, i.e. the probability of observing by chance a sitescoring above a given W S , which gives an estimate of the
FPR. The theoretical distribution indicates the P-valueassociated to each possible W S (Figure 2A and B), andcorresponds to the distribution that would be expectedwhen scoring a random sequence of infinite lengthgenerated according to the background model.
The theoretical frequency of all possible W S for theTrpR matrix is shown in Figure 2A. This is a discretedistribution, because the weight is obtained by computingproducts from two finite sets of probabilities, respectivelydefined by the matrix and the background model. Thedecreasing cumulative distribution function (dCDF,Figure 2B) indicates the P-value, i.e. the probability toobtain by chance a W s higher than or equal to a given
value. This curve is displayed with a logarithmic axis; thearrows show that, in this curve, a W S of 10 has a P-valueof 2.7 106, which initially seems excellent. However,even with this quite restrictive cutoff value, we wouldexpect about 23 false positives when scanning the wholegenome of E. coli K12 (4.2 Mb) on both strands, and threefalse positives if the search is restricted to the upstreamsequences of all the genes (579 kb 2 strands).
When the same analysis is applied to other TFs(Figure 3), each PSSM shows a specific theoreticalP-value distribution, depending on the particular fre-quency of each residue in each column of the matrix.Remarkably, NanR shows a step-wise shape, explainedby the fact that this motif was built from six identical
sites, and thus basically corresponds to a single word.The steps of the theoretical distribution correspond tothe probability of observing from 0 to 7 matchingresidues by chance, which fits a binomial distribution. Asimilar effect is observed, to a lesser extent, with the yeastSte12 p motif discovered by detecting over-representedwords in ChIP-chip data (Supplementary Data). In thiscase, the motif of width 11 was built from 59 sites, butthe strong conservation of the heptanucleotidic core (TGTTTCA) imposes a step-wise shape, which is only slightlysmoothed by the contribution of the poorly informativeflanking residues.
810 Nucleic Acids Research, 2011, Vol. 39, No. 3

8/17/2019 Nucl. Acids Res. 2011 Medina Rivera 808 24
http://slidepdf.com/reader/full/nucl-acids-res-2011-medina-rivera-808-24 4/17
Background models especially affect estimation of high-scoring sites
Figure 4 shows the impact of the background model onthe theoretical score distributions. For most factors, theMarkov order has a negligible effect on the lower weightvalues (corresponding to the non-coding genomic back-ground), but it particularly affects the right tail of the weight distribution (the range of high WS
corresponding to true binding sites). Curiously, TrpR isthe only TF that shows a difference between low andhigh order background models over the whole
distribution (Figure 4C). This is likely due to thepresence of the tetranucleotide CTAG in TrpR sites
(Figure 1A), which is heavily under-represented in theE. coli K12 genome due to the so-called ‘very short
patch repair system’ (22).
A
D
C
B
E
Figure 1. TrpR PSSM annotated in RegulonDB and permutation examples. (A) Collection of experimentally characterized binding sites for the TFTrpR of E. coli K12. (B) Count matrix, indicating the occurrences of each residue (row) at each position (column) of the aligned binding sites.
(C) Degenerate consensus derived from the matrix (obtained with the RSAT program ‘convert-matrix’). (D) Sequence logo obtained with theprogram ‘seqlogo’ (40). (E) Three examples of column-permuted matrices used for the negative controls (logo representation).
Nucleic Acids Research, 2011, Vol. 39, No. 3 811
8/17/2019 Nucl. Acids Res. 2011 Medina Rivera 808 24
http://slidepdf.com/reader/full/nucl-acids-res-2011-medina-rivera-808-24 5/17
In general, the theoretical distribution can be con-sidered a convenient estimate of the FPR, but relies onthe correctness of the background model. This assumptioncan be verified empirically, as shown in the followingsections.
Empirical weight score distributions
An empirical score distribution is the collection of W S
measured using a PSSM at all possible positions of a given set of sequences. For each PSSM annotatedin RegulonDB, we computed two empirical score
A B
C D
E F
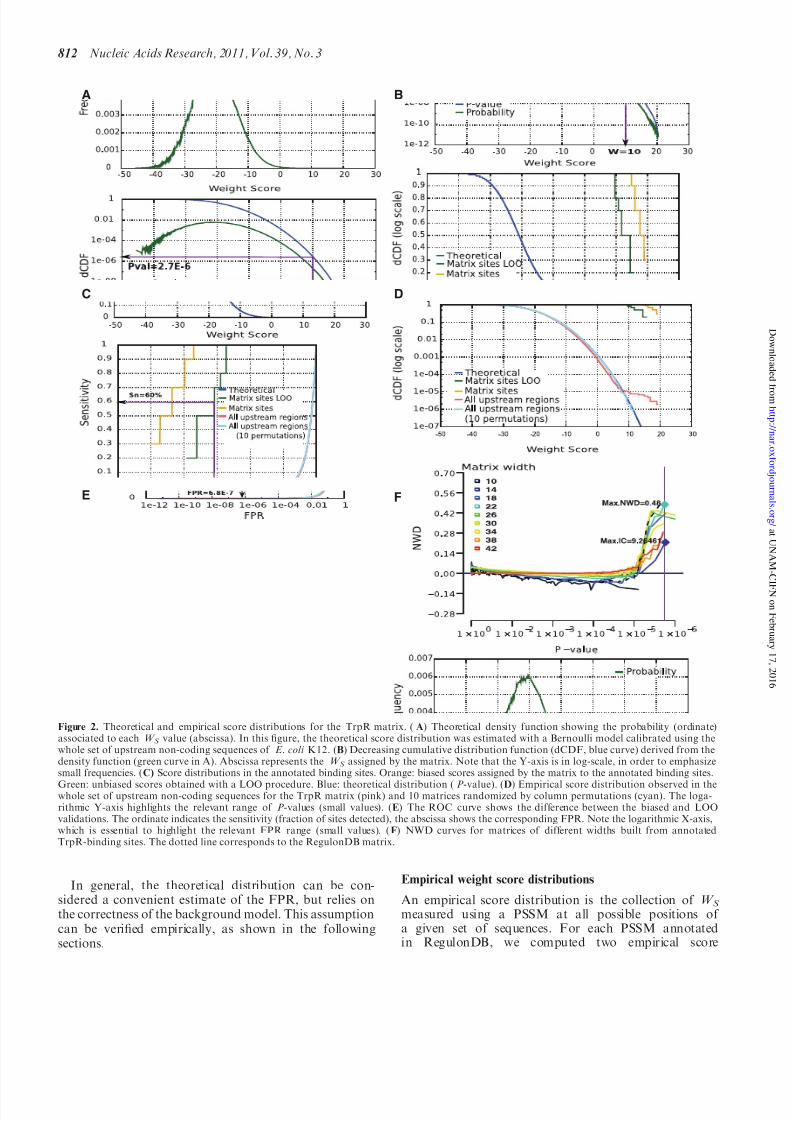
Figure 2. Theoretical and empirical score distributions for the TrpR matrix. (A) Theoretical density function showing the probability (ordinate)associated to each W S value (abscissa). In this figure, the theoretical score distribution was estimated with a Bernoulli model calibrated using thewhole set of upstream non-coding sequences of E. coli K12. (B) Decreasing cumulative distribution function (dCDF, blue curve) derived from thedensity function (green curve in A). Abscissa represents the W S assigned by the matrix. Note that the Y-axis is in log-scale, in order to emphasizesmall frequencies. (C) Score distributions in the annotated binding sites. Orange: biased scores assigned by the matrix to the annotated binding sites.
Green: unbiased scores obtained with a LOO procedure. Blue: theoretical distribution (P-value). (D) Empirical score distribution observed in thewhole set of upstream non-coding sequences for the TrpR matrix (pink) and 10 matrices randomized by column permutations (cyan). The loga-rithmic Y-axis highlights the relevant range of P-values (small values). (E) The ROC curve shows the difference between the biased and LOOvalidations. The ordinate indicates the sensitivity (fraction of sites detected), the abscissa shows the corresponding FPR. Note the logarithmic X-axis,which is essential to highlight the relevant FPR range (small values). (F) NWD curves for matrices of different widths built from annotatedTrpR-binding sites. The dotted line corresponds to the RegulonDB matrix.
812 Nucleic Acids Research, 2011, Vol. 39, No. 3

8/17/2019 Nucl. Acids Res. 2011 Medina Rivera 808 24
http://slidepdf.com/reader/full/nucl-acids-res-2011-medina-rivera-808-24 6/17
Figure 3. Sequence logos and score distributions for a selection of representative TFs. Each row corresponds to one TF, indicated in the left column.(First column) Sequence logos. (Second column) Score distributions. (Third column) ROC curves displayed with a logarithmic scale on the abscissa(FPR). (Fourth column) Score difference curves to compare alternative matrices for the same TF. Each curve represents the score differences(abscissa) between positive and negative sets, for different P-values (ordinate).
Nucleic Acids Research, 2011, Vol. 39, No. 3 813

8/17/2019 Nucl. Acids Res. 2011 Medina Rivera 808 24
http://slidepdf.com/reader/full/nucl-acids-res-2011-medina-rivera-808-24 7/17
distributions to assess the quality of a matrix: (i) the
complete set of upstream non-coding sequences of E. coli K12, and (ii) the sequence set of binding sitesused to build the matrix. Although these sequence setsare optional, we recommend using both of them toachieve a complete analysis. Additional sequence sets(e.g. sequence fragments pulled down by ChIP-chip orChIP–seq, upstream sequences of co-expressed genes,etc.) can be added as input to ‘matrix-quality’ in orderto compute their empirical distribution and measuretheir enrichment of putative binding sites.
Empirical W S distribution in all upstream sequences
The W S distribution was measured in the complete set of upstream non-coding sequences of E. coli K12 (Figure 2D,pink). This empirical distribution reasonably follows thetheoretical distribution in the lower range (W S 7). Athigher weights the curves separate, revealing a smallnumber of sites with a much higher score than expectedby chance (W S 9). These high-scoring sites supposedlycorrespond to experimentally reported TrpR-binding sites.The abrupt separation between the two curves results in aplateau-like shape, suggesting that, in the high scorerange, the TrpR matrix efficiently distinguishes functionalbinding sites from the background.
Permuted matrices as negative control
An ideal negative control would be a set of sequences towhich the TF of interest does not bind. Unfortunately,experimental evidence of this type is generally not avail-able. An alternative would be to select a random set of promoters, but this could accidentally include some realbinding sites. Another possibility is to generate randomsequences using some background model (e.g. Markovchain). However, nothing guarantees that Markovchains provide realistic models of biological sequences.
To circumvent these problems, ‘matrix-quality’ auto-matically performs a negative control by scanning inputsequences with randomized matrices, obtained bypermuting the columns of the original PSSM, as recom-
mended in other studies (23,24). Column-permutedmatrices (e.g. Figure 1 E) have the advantage of preservingimportant characteristics of the PSSM such as residuecomposition (sum of each row), number of sites (sum of any column), total information content (14), and completetheoretical score distribution (for Bernoulli models).
All upstream regions of E. coli K12 (579 kb) werescanned on both strands using ten randomized versionsof the TrpR PSSM. The distribution of permutedmatrices is thus estimated from a total of >107 weightscores (579 kb 2 strands 10 matrices). The score distri-bution of all permuted matrices (Figure 2D, cyan curve)
A B
C D
Figure 4. Impact of the background model on the theoretical score distribution for four matrices annotated in RegulonDB. For each factor, thetheoretical weight distribution was computed using Markov models of various orders (from 0 to 4) estimated from k-mer frequencies measured in allupstream regions of E. coli K12. (A) FNR. (B) CRP. (C) TrpR. (D) LexA.
814 Nucleic Acids Research, 2011, Vol. 39, No. 3
8/17/2019 Nucl. Acids Res. 2011 Medina Rivera 808 24
http://slidepdf.com/reader/full/nucl-acids-res-2011-medina-rivera-808-24 8/17
closely follows the theoretical distribution (blue curve) onits whole range, without showing any separation at highscores. This confirms that the plateau observed for theoriginal TrpR PSSM (Figure 2D, pink curve) correspondsto sites specifically detected by this matrix in the genome.
The column-permuted distribution can be considered an‘empirical estimate of the FPR’. This distribution is
estimated from scanning a few megabases of sequenceand hence its precision is limited. For example, thehighest score observed for the negative control of TrpRhad a frequency of 1 106. This empirical distributionwould not allow us to estimate lower P-values, which arethe most relevant for binding site evaluation. To combinethe advantages of theoretical and empirical FPR curves,we propose the following strategy: (i) scan a representativeset of biological sequences with column-permutedmatrices; and (ii) if the results fit the theoretical distribu-tion, use the latter to estimate the P-value of predictedsites.
Note that the column-permutation test fails for TFsshowing low-complexity motifs (e.g. GGGCGG, TATA
TA). In such cases, the consensus residues of thepermuted matrix will frequently match those of theoriginal matrix, resulting in similar empiricaldistributions.
Estimation of sensitivity
The sensitivity of a PSSM is the fraction of correct sitesdetected above a score threshold, which is usuallyestimated by scoring the sites originally used to build thematrix (‘Materials and Methods’ section). As an example,scores for annotated TrpR sites range from 14.90 to 19.42(Figure 2C, orange curve). However, this PSSM isprobably over-fitted to these particular sites, since each
of them is used in the alignment from which the matrixis derived (Figure 1). For an unbiased estimate of sensi-tivity, we would ideally need two separate collections of sites: one for building the PSSM, another for testing it.Unfortunately, for most TFs, very few binding sites areknown. In order to ensure an independent assessmentwhile minimizing the loss of information, the program‘matrix-quality’ performs a LOO validation, iterativelydiscarding one annotated site, re-building the matrix,and scoring the left-out site with the new matrix. Theprogram also discards multiple copies of identical sites,if those are not from independent sources, which wouldotherwise induce the same kind of bias. RegulonDBcontains 10 TrpR sites (Figure 1A), with only five remain-
ing after redundancy filtering. Not surprisingly, whenapplying the redundancy filter and the LOO procedurethese sites have lower scores ranging from 9.62 to 15.78(Figure 2C, green). The LOO score distribution thuscorrects obvious biases in the estimation of the matrixsensitivity, and the difference with the matrix sites distri-bution (Figure 2C, orange curve) indicates the level of over-fitting to the training sites.
Strong differences between uncorrected and LOOcurves reveal problematic matrices. For instance, theCysB matrix from RegulonDB covers 43 columns, whichis unusually large for a TF-binding motif. Initially, the
score distribution in all promoters follows the theoreticaldistribution for low score values (weight < 5), and shows aclear plateau for high scores (weight > 10), with a few sitesscoring above 20, thus suggesting that the motif has goodspecificity. However, the LOO test (Figure 3, green curve)returns much lower scores than the uncorrected site dis-tribution (Figure 3, orange curve), thereby revealing a
strong effect of over-fitting. The CysB matrix is able torecognize the eight genomic sites used to build it, but failsto predict additional sites.
In contrast, matrices built from many sites (CRP, FNR)show almost no difference between LOO and uncorrectedsite distributions (Figure 3). For factors like LexA,over-fitting seems reasonably low, thanks to the sufficientnumber of annotated sites (23 sites).
ROC curves indicate the trade-off between sensitivityand FPR
The ROC curve (25) is a standard representation of thetrade-off between FPR and sensitivity. However, the risk
of false positives applies to every position of the scannedsequences. Even with an apparently low FPR, the actualnumber of FP can be very high when scanning a genome.For example, E. coli K12 upstream regions scanned onboth strands represent more than 1 million scored pos-itions, so that an FPR of 0.001 would return 1159 FPs.Consequently, regular ROC curves are of no use forestimating the discriminatory power of a matrix. For thesame reason, the Area Under the Curve (AUC), classicallyused to assess the quality of ROC curves, is ineffective.Indeed, the AUC is obtained by integrating sensitivityover the full range of FPR from 0 to 1, yet genome-widepredictions performed with an FPR of 90%, 50%, 10% oreven 1% are not useful at all. To emphasize the lower,
more relevant, range of FPR, ROC curves are drawnwith a logarithmic abscissa, and we use alternative statis-tics instead of the AUC.
For the TrpR PSSM, the LOO curve (Figure 2 E, greencurve) shows that 60% sensitivity can be attained with aFPR of 6.8 107, or a cost of 1 FP every1/(6.8 107)bp= 1.47 Mb. This estimation of sensitivitywith LOO procedure is unbiased, but it is based only onfive non-redundant sites, thus being of questionable robust-ness (this could change if new TrpR sites become available).For the LexA matrix, built from 23 binding sites, the ROCcurve shows a gradual increase (Figure 3); at 50% sensitiv-ity the expected FPR remains reasonably low(FPR50%=1.3 105), whereas 90% sensitivity includes
almost 1FP per 100 bp (FPR90%=8.3 10
3). HipB is atypical case of TF with a very small number of characterized sites (four sites, all involved in the regulationof the hipBA operon). Since each site contributed 25% of the matrix frequencies, the matrix is over-fitted, as denotedby a 10 000-fold difference in FPR between the uncorrected(orange) and the LOO (green) site score distributions(Figure 3). It is thus essential to estimate the FPR onthe LOO curves rather than on the simple distributionof scores in the annotated sites. We systematicallyanalyzed the FPR50%, FPR90% and FPR100% for all thePSSM annotated in RegulonDB (Table 1). The ratio
Nucleic Acids Research, 2011, Vol. 39, No. 3 815

8/17/2019 Nucl. Acids Res. 2011 Medina Rivera 808 24
http://slidepdf.com/reader/full/nucl-acids-res-2011-medina-rivera-808-24 9/17

8/17/2019 Nucl. Acids Res. 2011 Medina Rivera 808 24
http://slidepdf.com/reader/full/nucl-acids-res-2011-medina-rivera-808-24 10/17
between the FPR computed with the LOO approach andfrom the matrix sites (biased) shows wide variations (from 2to 1010). High ratio values indicate an over-fitting of thematrix to the training sites, and can be used to detect poorlypredictive matrices in a TF database.
Normalized weight difference curves
Comparison between the theoretical score distribution(Figure 2C, blue curve) and the observed score distribu-tion in upstream non-coding regions (Figure 2D, pinkcurve) indicates the discriminative power of a matrix.Differences between theoretical and empirical distribu-tions indicate the presence of a higher number of siteswith a P-value smaller than expected, suggesting that thePSSM is capable of recovering significant putative bindingsites.
At each frequency value (y-axis of Figure 2D) wecalculated the weight score difference (WD), defined asthe difference between the observed W S in all upstreamnon-coding regions and the expected W S in the theoretical
distribution of the PSSM for a given P-value. The WD canbe visualized as the horizontal distance between the distri-bution curves (Figure 2D, blue and pink curves). As largermatrices allow higher scores, we divided the difference bythe matrix width to obtain the normalized weight differ-ence (NWD). The NWD curve (Figure 2 F) indicates thecapability of a PSSM to distinguish putative sites from thenon-coding genomic background.
Superimposition of NWD curves facilitates comparisonbetween different PSSM for a given TF. In Figure 2 F, theNWD curve of the TrpR matrix, annotated in RegulonDB(dotted line), is shown super-imposed with alternativeTrpR matrices built from the same sites, but varyingthe widths from 10 to 42. Clearly the smaller matrix
(width= 10) fails to distinguish known sites from thebackground, as revealed by its negative NWD. Incontrast, matrices of width 18 to 30 show a sharpincrease in NWD above P-values of 1 105, indicatingenrichment in putative binding sites.
In some cases, the Maximal NWD (MNWD) scoregives good results for PSSM selection as can be seen forLexA matrices. The most conserved residues were a pair of trinucleotides separated by 10 less conserved positions(CTGn10CAG). This core is encompassed by a matrix of width 16, yet the annotated matrix extends over 21 nt inorder to include information about the conservation of theflanking residues. The PSSM with the highest MNWDhad 18 columns (Figure 3, cyan NWD curve for LexA),
followed by one of 22 (turquoise). However, NWD curvescan be misleading in case of over-fitted matrices, as forHipB: this factor has target genes with multiple bindingsites arranged in tandem. Consequently, large matricesencompass multiple sites, so that increasing the PSSMwidth leads to ever increasing score separations(Figure 3). However, these matrices are only gettingbetter at predicting the sites from which they were con-structed, while getting worse at predicting novel sites, asdenoted by the LOO analysis of site score distributions.
NWD curves give a feeling about the enrichment inhigh-scoring binding sites observed in a reference
sequence set (e.g. all upstream regions of the organismof interest) by comparison to the theoretical expectation.In Bacteria, an abrupt slope in the NWD curve reveals thepresence of a handful of high-scoring binding sites forhighly specific TFs (e.g. TrpR, LexA), whereas a progres-sive increase of the NWD slope is indicative of globalfactors, such as CRP, FNR (Figure 3), Fur, FruR, IHF
and FIS (Supplementary Data). NWD curves can estimatematrix quality when individual binding sites can be distin-guished from their background (the whole set of non-coding upstream sequences).
In metazoan genomes (drosophila, mammals), theNWD curves are generally flat for specific factors (unpub-lished data, JvH), because the number of high-scoring sitesdoes not significantly exceed the theoretical expectation,due to the increase of gene number and upstream regionsizes. In such genomes, transcriptional regulation isensured by cis-regulatory modules, which combinemultiple binding sites for one or several TFs. Also, indi-vidual binding sites generally show a wider range of vari-ation, so that PSSMs are less discriminative than in
microbial genomes.
Empirical score distributions distinguish global fromspecific TFs
The global TFs CRP and FNR have several hundredannotated functional binding sites. Their score distribu-tions in all promoters do not show a plateau: rather,their empirical curves (Figure 3, pink curve) progressivelyseparate from the theoretical distribution, starting fromrelatively low W S (5), associated to high P-values(>1 103). This suggests that the high number of target genes of global TFs results from a spectrum of sites bound with a wide range of affinities. The progressive
separation observed for global factors opens the questionof whether their numerous binding sites result mostly fromnon-specific binding (reflected by a motif of low informa-tion content), which has been suggested previously (26), orfrom the presence of numerous specific binding sites inupstream regions of a large number of target genes. Inthe first scenario (poorly informative motifs) we wouldexpect similar curves for the permuted and non-permutedmatrices, since column permutations preserve the informa-tion content. This is however not the case. For all theglobal TFs (CRP, FNR, FIS and FUR), permutedmatrices showed a tight fit to the theoretical distributions(see cyan curves on Figure 3 for CRP, FNR, andSupplementary Data for other factors). This suggests
that there is room within the whole set of possible se-quences, to have a large number of binding sites of lower affinity for TF binding enabling regulation of many target genes, and nonetheless different from thosegenerated by permuted matrices.
However, the slow separation observed for globalfactors may be an artifact resulting from the fact thattheir matrices were built from a larger number of sitesthan specific TFs. In order to test this possibility, webuilt matrices by sampling random subsets of bindingsites for CRP and FNR. We tested matrices built from 7or 14 sites, respectively, and repeated the experiment three
Nucleic Acids Research, 2011, Vol. 39, No. 3 817

8/17/2019 Nucl. Acids Res. 2011 Medina Rivera 808 24
http://slidepdf.com/reader/full/nucl-acids-res-2011-medina-rivera-808-24 11/17
times (Supplementary Data). All the sub-sampled matri-ces showed the same characteristic distribution of global TFs: their empirical distribution slowly separatesfrom the theoretical one above relatively low weightscores (w 5).
The distinction between global and specific factors canalso be observed in yeast promoters: the Saccharomyces
cerevisiae TF Abf1 p, described in SGD as a ‘multifunc-tional global regulator’, shows a progressive separationfrom the theoretical distribution above scores of 5(Figure 7). The same behavior is observed for two otheryeast global TFs, CBF1 and RAP1 (Supplementary Data).In contrast, for the GAL4 factor, which activates ahandful of genes involved in galactose utilization, the em-pirical score distribution suddenly separates from the the-oretical distribution at high scores (w 10), similar tospecific TFs in E. coli .
We further investigated the capability of ‘matrix-quality’ to distinguish global from specific TFs byevaluating the score distribution of the Bacillus subtilisFNR-binding motif. The B. subtilis FNR motif (TGTGA-N6-TCACA) is highly similar to that of CRP in E. coli K12. However, in B. subtilis, the factor has been recruitedfor a specific function (adaptation to low oxygen tension)and regulates a much smaller regulon than CRP in E. coli .Consistently, the score distribution of B. subtilis FNRshows the typical shape of a specific TF: the empiricaldistribution follows the theoretical for low weight scores,and shows a neat separation above 10 (SupplementaryData). The distinction between the B. subtilis FNR andE. coli K12 CRP distributions nicely shows that the samemotif (TGTGA-N6-TCACA) can be bound by a genericfactor in one genome, and a specific factor in anothergenome.
Multi-genome pattern discovery can compensate for asmall number of annotated binding sites
In some cases, the collection of annotated binding sites isinsufficient to build a consistent matrix. The HipB PSSMin RegulonDB was built from four binding sites found intandem in the hipB promoter (hipB is auto-regulated).Consequently, the collection of extended binding sitesprovided by RegulonDB shows redundancy, since eachaligned site is flanked by one or two neighboring sites,and the motif has a poor predictive power, as discussedabove. The paucity of annotated binding sites canhowever be compensated by a multi-genome approach.
We ran the program ‘footprint-discovery’ (27) todiscover conserved motifs in the promoters of 14 hipBorthologs found in Enterobacteriales. The resultingmotif (Figure 5A) shows the same core as the annotatedone, but the error bars are considerably smaller, becausethe matrix was built from a much larger collection of binding sites. The score distributions and the ROC curve(Figure 5B and C) show a neat improvement over theoriginal annotated matrix (Figure 3): the differencebetween uncorrected matrix sites and LOO distributionbecomes negligible, and the estimated FPR_70%improves from 1 105 to 1 108.
Enrichment of binding sites in promoters and peak regionsselected by ChIP-chip and ChIP–seq experiments
Until recently, matrices stored in TF databases were builtby assembling a restricted number of sites obtained fromcase-by-case experiments. ChIP-chip (18) and ChIP–seq(28) technologies now permit a genome-wise localization
of the regions bound by a TF. However, these regions arenot precisely defined, due to several technical difficulties:(i) during Chromatin Immuno-Precipitation (ChIP),the ultrasonication step cuts DNA into fragments of variable sizes; (ii) the DNA probes hybridized onChIP-chip microarrays may contain regions of severaltens, or even hundreds base pairs (this problem has beenminimized with recent tiling arrays); and (iii) for ChIP– seq, the primary reads from the next generationsequencing machines correspond to the 50 and 30
extremities of the DNA fragments, which can be separatedfrom the actual site by several tens of base pairs. Theprimary results (hybridized probes or genome-mappedsequence reads) are generally post-processed to detect
the ‘peaks’, i.e. genomic regions most likely to containone or more binding sites (29). Motifs can then beobtained by running pattern discovery algorithms insequence sets resulting from those high-throughputmethods.
In the next sections, we show that ‘matrix-quality’ canbe used for two purposes during analysis of ChIP-chip andChIP–seq results: (i) to evaluate the high-throughputsequence sets (e.g. a collection of peak regions) for enrich-ment of putative binding sites of a TF for which wealready have a matrix; and (ii) to evaluate the quality of new motifs built from high-throughput data sets.
Enrichment of promoters selected by ChIP-chip in
LexA-binding sites
Wade and co-workers (30) used high-density microarraysrepresenting the entire E. coli genome to identify 49high-confidence in vivo targets of the LexA repressor. Of these, 15 were already included in the 23 target genesannotated in RegulonDB.
We first analyzed the enrichment in putative LexA-binding sites within the promoters of the high-scoringtarget genes identified by Wade and co-workers. Scoredistribution curves (Figure 6A) showed a significant en-richment of high-scoring sites in ChIP-selected promoters(purple curve) in comparison with the distribution inall promoters (salmon curve). This illustrates the use
of ‘matrix-quality’ to compare collections of sequencesobtained from various sources, and to estimate theirrespective enrichment in binding sites for a givenTF-binding motif by comparing the entire W S
distributions.
Enrichment of ChIP–seq peaks shows interactionsbetween mouse factors
We used ‘matrix-quality’ to measure the enrichment of peak regions selected by ChIP–seq for 13 mouse TFs(19). Whenever available, we compared the motifsannotated in TRANSFAC with those built from the
818 Nucleic Acids Research, 2011, Vol. 39, No. 3

8/17/2019 Nucl. Acids Res. 2011 Medina Rivera 808 24
http://slidepdf.com/reader/full/nucl-acids-res-2011-medina-rivera-808-24 12/17
ChIP–seq peaks, taken either from JASPAR (31) or froma recent study by Bailey, et al . (32). Empirical score dis-tributions show a clear enrichment of peak regions forsome, but not all matrices (Supplementary Data).Beyond comparing the respective quality of alternativematrices, the distribution plots can in some cases highlightthe interactions between two factors. For example, themouse factors Sox2 and Oct4 can form a dimer thatbinds a spaced motif (the so-called ‘SOCT’ motif).Interestingly, Sox2 peak sequences are enriched not only
for Sox2 (Figure 8A), but also for Oct4 (Figure 8B)-binding sites. However, the strongest enrichment isobtained with the Sox2-Oct4 hybrid motif (Figure 8C),thereby confirming the capability of the two factors tobind DNA in the dimeric form.
Improving matrix qualities by running motif discovery inpromoters pulled down by ChIP–chip
We used the pattern discovery program ‘dyad-analysis’ (33)to build a new matrix from the LexA-binding regionsreported by Wade and co-workers, and analyzed itsquality as described above. This matrix shows a plateau
of high-scoring binding sites within the complete collectionof E. coli K12 promoters (salmon curve), and a strong en-richment of such sites in the promoters of the target genesselected by ChIP-chip (Figure 6C). Interestingly, the ROCcurve shows better performance for the new LexA motif than for the motif annotated in RegulonDB: the FPR_50%drops from 105 for the annotated motif (green curve onFigure 6B) to 107 for the new one (Figure 6D). The newlydiscovered motif also shows a good capability to recoverthe 23 binding sites annotated in RegulonDB, although
only some of those sites were used to build it.A similar improvement can be obtained by discovering
motifs in yeast promoters selected by ChIP-chip experi-ments: for the yeast global factor Abf1 p, we analyzedthree matrices annotated in TRANSFAC (34), one fromSCPD (35), and a matrix built with ‘dyad-analysis’ (33) inAbf1p target promoters selected by ChIP-chip (18). Thematrix obtained with ‘dyad-analysis’ (Figure 7C and D)shows a 100-fold lower FPR than the matrix annotated inSCPD (Figure 7A and B). We obtained similar improve-ments for several yeast TFs for which ChIP-chip data wereavailable (Supplementary Data).
A
B
C
D
Figure 5. Motif discovered by ‘footprint-discovery’ in the promoters of 14 hipB orthologs (Enterobacteriales). (A) Sequence logos from differentmatrices representing the binding motif for the TF HipB. ( B) P-value distribution for the multi-genome matrix. (C) ROC curves for the multi-genomematrix. (D) Quality comparison of different matrices based on NWD distributions. Dotted curve: RegulonDB matrix. Light mauve: multi-genomematrix. Other curves: matrices of various widths built from the 4 HipB sites annotated in RegulonDB. Note the abrupt step in the light mauve curve,
indicating the discriminant power of the multigenome matrix.
Nucleic Acids Research, 2011, Vol. 39, No. 3 819

8/17/2019 Nucl. Acids Res. 2011 Medina Rivera 808 24
http://slidepdf.com/reader/full/nucl-acids-res-2011-medina-rivera-808-24 13/17
DISCUSSION
We described a method to characterize the ability of aPSSM to detect TF-binding sites in genome sequences.The method combines theoretical and empirical scoredistributions and is implemented in a program called‘matrix-quality’, which is part of the RSAT (36).
We applied the method to a collection of 60 PSSMsfrom the RegulonDB database (2,17). We analyzedseven representative E. coli K12 PSSMs, and showedthat matrices can be significantly improved by enlargingthe set of sites using either data from high-throughputexperiments (yeast ChIP–chip, mouse ChIP–seq) or fromcomparative genomics (‘footprint discovery’).
Our study shows that any single-criterion selection willfail to capture the multiple aspects required to assess thepredictive power of a matrix. Consequently, our generalstrategy was to select matrices presenting a good trade-off between the multiple parameters discussed in the previoussections: (i) the discriminative power of the PSSM is firstestimated by examining the separation between the theor-etical and empirical distribution in all upstream sequences(MNWD); (ii) the fitting between the theoretical distribu-tion and the empirical distribution of permuted matricesindicates the correctness of the background model;(iii) over-fitted matrices are revealed by a large distance
between the biased and unbiased (LOO) distributions of W S in annotated binding sites; and (iv) the ROC curvesindicate the tradeoff between sensitivity and risk of falsepositives.
The distributions of scores and the ROC curves cangive relevant information for researchers who areusing matrices to predict putative binding sites ingenome sequences. It is important to remark that thisevaluation is context-specific: rather than evaluatingintrinsic properties of the matrix (e.g. informationcontent, E -value), we monitor its practical behavior inthe context of a given genome. The method can thusprovide realistic estimates of the expected sensitivity
and FPR when scanning real genome sequences topredict TF-binding sites. In addition, we saw that theshape of the distribution observed in complete sets of pro-moters provides clues about the global versus specificnature of a TF. Since this interpretation does notrequire any prior knowledge of proven binding sites, itcan also be used for evaluating matrices resulting frompattern discovery in various data types: promoters of co-expressed genes, promoters of orthologous genes,whole-genome analyses and collections of peak regionsobtained from ChIP–seq or ChIP-chip experiments,among others.
A B
C D
Figure 6. Analysis of LexA target genes detected by a ChIP-chip experiment. (A) Score distributions showing the enrichment of putativeLexA-binding sites in the target promoters detected by ChIP–chip. Sites were predicted with the LexA matrix from RegulonDB. ( B) ROC curveof the LexA matrix available in RegulonDB. (C) Score distributions of a LexA PSSM resulting from pattern discovery (‘dyad-analysis’) in the LexAtarget genes detected by ChIP–chip. (D) ROC curve of the matrix discovered with ‘dyad-analysis’.
820 Nucleic Acids Research, 2011, Vol. 39, No. 3

8/17/2019 Nucl. Acids Res. 2011 Medina Rivera 808 24
http://slidepdf.com/reader/full/nucl-acids-res-2011-medina-rivera-808-24 14/17
Our method is also of pragmatic value for annotators of TF databases. The analysis of score distributions allowed
us to detect problems related to the annotated bindingsites (e.g. five redundant sites out of 10 for TrpR, six iden-tical sites for NanR, over-fitted matrix for HipB), or to thematrices built from those sites (e.g. excessively largematrix for CysB).
The method can also help to guide annotators inthe choice of optimal parameters to build matricesfrom collections of binding sites (e.g. matrix width, back-ground model, exclusion of poorly scoring sites, etc.). Asa systematic test, for each one of the seven study casefactors (Figures 2 and 3), we collected their bindingsites from RegulonDB and generated a series of PSSM
using two alternative algorithms (MEME and consensus),two alternative background models (Bernoulli or Markov
order 1) and motif length ranging from 8 to 42. Bycomparing all the ‘matrix-quality’ results, we selected,for each factor, the matrix providing the best tradeoff between sensitivity and FPR robustness (based onthe LOO analysis). The parameters of the selectedmatrices are shown in Table 2, and are comparedto those of the original RegulonDB matrices(Table 1). In addition, we are generating a collectionof matrices enriched by multi-genome pattern discovery.This study is currently being extended to the wholeRegulonDB collection, in preparation for the nextdatabase release.
Figure 7. Matrices obtained from motif discovery in yeast promoters selected by ChIP-chip experiments . Score distribution and ROC curves for theABF1 matrix annotated in SCPD (A and B), an ABF1 matrix discovered in promoters selected by ChIP-chip (C and D) and a GAL4 matrixdiscovered in promoters selected by ChIP-chip (E and F).
Nucleic Acids Research, 2011, Vol. 39, No. 3 821

8/17/2019 Nucl. Acids Res. 2011 Medina Rivera 808 24
http://slidepdf.com/reader/full/nucl-acids-res-2011-medina-rivera-808-24 15/17
SUPPLEMENTARY DATA
Supplementary Data are available at NAR Online.
ACKNOWLEDGEMENTS
The authors acknowledge the members of the BiGRelaboratory for useful comments on the article.
FUNDING
A.M.-R. was supported during her PhD studies(Programa de Doctorado en Ciencias Biome ´ dicas,Universidad Nacional Auto ´ noma de Me ´ xico) by a fellow-ship from the Consejo Nacional de Ciencia y Tecnologı ´a(Mexico). The BiGRe laboratory is supported bythe BioSapiens Network of Excellence funded under thesixth Framework program of the European Communities(LSHG-CT-2003-503265); Belgian Program onInteruniversity Attraction Poles, initiated by the BelgianFederal Science Policy Office, project P6/25 (BioMaGNet) T
a b l e
2 . S e l e c t i o n o f P S S M
o n t h e b a s i s o f ‘ m a t r i x - q u a l i t y ’ r e s u l t s
F a c t o r
P r o g r a m
M a r k o v
o r d e r
W i d t h
N o .
s i t e s
M a t r i x C o n s e n s u s ( I U P A C )
T o t a l
I C
I C p e r c o l u m n
E - v a l u e
F P R 5 0 %
( L O O )
F P R 9 0 %
( L O O )
F P R 1 0 0 %
( L O O )
F P R 5 0 %
( m a t r i x s i t e s )
F P R 9 0 %
( m a t r i x s i t e s )
F
P R 1 0 0 %
( m a t r i x s i t e s )
L O O / M a t r i x
s i t e s
( F P R 5 0 % )
T r p R
m e m e
1
2 4
6
t y G t A C t m G y k a A C t a G T a C r a t r
1 3
. 6 2
0 . 5 7
1 . 3 0 E - 1 0
1 . 0 0 E - 0 8
7 . 7 0 E - 0 6
7 . 7 0 E - 0 6
1 . 5 0 E - 1 2
1 . 5 0 E - 0 9
1
. 5 0 E - 0 9
6 . 6 7 E + 0 3
C R P
m e m e
0
2 4
1 9 8
a a a w w t g t G a y r y a g a T C A C a w w w
7
. 2 9
0 . 3 0
6 . 4 0 E - 2 4 2
6 . 2 0 E - 0 5
3 . 7 0 E - 0 3
2 . 8 0 E - 0 2
4 . 5 0 E - 0 5
2 . 7 0 E - 0 3
2
. 1 0 E - 0 2
1 . 3 8 E + 0 0
C y s B
m e m e
1
3 0
8
g G A a v G r r r t a A y K r m w t r m c a r a k y k m k t
1 0
. 6 7
0 . 3 6
1 9 0 0
2 . 6 0 E - 0 4
1 . 4 0 E - 0 1
1 . 4 0 E - 0 1
2 . 8 0 E - 0 8
3 . 2 0 E - 0 5
3
. 2 0 E - 0 5
9 . 2 9 E + 0 3
N a n R
m e m e
1
2 0
6
k t A T A m M w G k t a t a M m r G w w
1 0
. 2 8
0 . 5 1
8 . 3 0 E - 0 7
2 . 3 0 E - 0 6
1 . 6 0 E - 0 3
1 . 6 0 E - 0 3
1 . 5 0 E - 1 1
6 . 4 0 E - 0 7
6
. 4 0 E - 0 7
1 . 5 3 E + 0 5
L e x A
m e m e
1
2 2
2 1
w w t r C T G t a y a t a m a m m C A G y a
1 1
. 6 5
0 . 5 3
2 . 6 0 E - 4 6
2 . 0 0 E - 0 8
4 . 6 0 E - 0 4
3 . 1 0 E - 0 3
1 . 5 0 E - 0 9
1 . 5 0 E - 0 5
1
. 5 0 E - 0 4
1 . 3 3 E + 0 1
H i p B
m e m e
1
1 8
4
A T C C s s k a g m G C G G A T A A
1 0
. 9 5
0 . 6 1
0 . 0 0 0 2 2
5 . 0 0 E - 0 8
4 . 3 0 E - 0 6
4 . 3 0 E - 0 6
1 . 5 0 E - 1 1
3 . 1 0 E - 0 9
3
. 1 0 E - 0 9
3 . 3 3 E + 0 3
F N R
c o n s e n s u s
0
2 0
7 2
t d y w w w t T G a T w w m r a T C a a
6
. 9 4
0 . 3 5
2 . 0 9 E - 7 1
1 . 3 0 E - 0 4
5 . 3 0 E - 0 3
1 . 8 0 E - 0 2
7 . 6 0 E - 0 5
2 . 9 0 E - 0 3
9
. 8 0 E - 0 3
1 . 7 1 E + 0 0
A
B
C
Figure 8. Enrichment of putative binding sites for mouse TFs in peak
sequences detected by ChIP–seq experiments. Score distributions inpeak regions detected by a Sox2 ChIP–seq experiment, analyzingmotifs for Sox2 (A), Oct4 (B) and Sox2-Oct4 (C).
822 Nucleic Acids Research, 2011, Vol. 39, No. 3

8/17/2019 Nucl. Acids Res. 2011 Medina Rivera 808 24
http://slidepdf.com/reader/full/nucl-acids-res-2011-medina-rivera-808-24 16/17
and by the MICROME Collaborative Project funded bythe European Commission within its FP7 Programme,under the thematic area ‘BIO-INFORMATICS— Microbial genomics and bio-informatics’, contractnumber 222886-2.’; Actions de Recherches Concerte ´ esde la Communaute ´ Francaise de Belgique (ARC grantnumber 04/09-307), the Bureau des Relations
Internationales et de Coope ´ ration (BRIC, Universite ´Libre de Bruxelles) and UNAM for travel costs of A.M.-R.; National Institutes of Health, grant numberR01 GM071962-05 (to J.C.-V.); Alexander vonHumbold Stiftung (to M.T.C.). Funding for open accesscharge: Belgian Program on Interuniversity AttractionPoles, initiated by the Belgian Federal Science PolicyOffice, project P6/25 (BioMaGNet); Consejo Nacionalde Ciencia y Tecnologı ´a (Mexico).
Conflict of interest statement. None declared.
REFERENCES
1. Salgado,H., Gama-Castro,S., Peralta-Gil,M., Diaz-Peredo,E.,Sanchez-Solano,F., Santos-Zavaleta,A., Martinez-Flores,I.,Jimenez-Jacinto,V., Bonavides-Martinez,C., Segura-Salazar,J. et al .(2006) RegulonDB (version 5.0): Escherichia coli K-12transcriptional regulatory network, operon organization, andgrowth conditions. Nucleic Acids Res., 34, D394–D397.
2. Huerta,A.M., Salgado,H., Thieffry,D. and Collado-Vides,J. (1998)RegulonDB: a database on transcriptional regulation inEscherichia coli. Nucleic Acids Res., 26, 55–59.
3. Knuppel,R., Dietze,P., Lehnberg,W., Frech,K. and Wingender,E.(1994) TRANSFAC retrieval program: a network model databaseof eukaryotic transcription regulating sequences and proteins.J. Comput. Biol., 1, 191–198.
4. Wingender,E. (2004) TRANSFAC, TRANSPATH andCYTOMER as starting points for an ontology of regulatorynetworks. In Silico Biol., 4, 55–61.
5. Montgomery,S.B., Griffith,O.L., Sleumer,M.C., Bergman,C.M.,Bilenky,M., Pleasance,E.D., Prychyna,Y., Zhang,X. and Jones,S.J.(2006) ORegAnno: an open access database and curation systemfor literature-derived promoters, transcription factor binding sitesand regulatory variation. Bioinformatics, 22, 637–640.
6. Vlieghe,D., Sandelin,A., De Bleser,P.J., Vleminckx,K.,Wasserman,W.W., van Roy,F. and Lenhard,B. (2006) A newgeneration of JASPAR, the open-access repository fortranscription factor binding site profiles. Nucleic Acids Res., 34,D95–D97.
7. Sandelin,A., Alkema,W., Engstrom,P., Wasserman,W.W. andLenhard,B. (2004) JASPAR: an open-access database foreukaryotic transcription factor binding profiles. Nucleic AcidsRes., 32, D91–D94.
8. Hertz,G.Z., Hartzell,G.W. 3rd and Stormo,G.D. (1990)Identification of consensus patterns in unaligned DNA sequences
known to be functionally related. Comput. Appl. Biosci., 6, 81–92.9. Lawrence,C.E., Altschul,S.F., Boguski,M.S., Liu,J.S.,Neuwald,A.F. and Wootton,J.C. (1993) Detecting subtle sequencesignals: a Gibbs sampling strategy for multiple alignment. Science,
262, 208–214.10. Bailey,T.L. and Elkan,C. (1994) Fitting a mixture model by
expectation maximization to discover motifs in biopolymers.Proc. Int. Conf. Intell. Syst. Mol. Biol., 2, 28–36.
11. Neuwald,A.F., Liu,J.S. and Lawrence,C.E. (1995) Gibbs motif sampling: detection of bacterial outer membrane protein repeats.Protein Sci., 4, 1618–1632.
12. Thijs,G., Lescot,M., Marchal,K., Rombauts,S., De Moor,B.,Rouze,P. and Moreau,Y. (2001) A higher-order backgroundmodel improves the detection of promoter regulatory elementsby Gibbs sampling. Bioinformatics, 17, 1113–1122.
13. Schneider,T.D., Stormo,G.D., Gold,L. and Ehrenfeucht,A. (1986)Information content of binding sites on nucleotide sequences.
J. Mol. Biol., 188, 415–431.14. Hertz,G.Z. and Stormo,G.D. (1999) Identifying DNA and
protein patterns with statistically significant alignments of multiple sequences. Bioinformatics, 15, 563–577.
15. Rahmann,S., Muller,T. and Vingron,M. (2003) On the power of profiles for transcription factor binding site detection. Stat. Appl.Genet. Mol. Biol., 2, Article7.
16. Huerta,A.M. and Collado-Vides,J. (2003) Sigma70promoters in Escherichia coli: specific transcription in denseregions of overlapping promoter-like signals. J. Mol. Biol., 333,261–278.
17. Gama-Castro,S., Jimenez-Jacinto,V., Peralta-Gil,M.,Santos-Zavaleta,A., Penaloza-Spinola,M.I., Contreras-Moreira,B.,Segura-Salazar,J., Muniz-Rascado,L., Martinez-Flores,I.,Salgado,H. et al . (2008) RegulonDB (version 6.0): gene regulationmodel of Escherichia coli K-12 beyond transcription, active(experimental) annotated promoters and Textpresso navigation.
Nucleic Acids Res., 36, D120–D124.18. Harbison,C.T., Gordon,D.B., Lee,T.I., Rinaldi,N.J.,
Macisaac,K.D., Danford,T.W., Hannett,N.M., Tagne,J.B.,Reynolds,D.B., Yoo,J. et al . (2004) Transcriptional regulatorycode of a eukaryotic genome. Nature, 431, 99–104.
19. Chen,X., Xu,H., Yuan,P., Fang,F., Huss,M., Vega,V.B., Wong,E.,
Orlov,Y.L., Zhang,W., Jiang,J. et al . (2008) Integration of external signaling pathways with the core transcriptional networkin embryonic stem cells. Cell , 133, 1106–1117.
20. Schneider,T.D. and Stephens,R.M. (1990) Sequence logos: a newway to display consensus sequences. Nucleic Acids Res., 18,6097–6100.
21. Turatsinze,J.V., Thomas-Chollier,M., Defrance,M. and vanHelden,J. (2008) Using RSAT to scan genome sequences fortranscription factor binding sites and cis-regulatory modules.Nat. Protoc., 3, 1578–1588.
22. Bhagwat,A.S. and McClelland,M. (1992) DNA mismatchcorrection by Very Short Patch repair may have altered theabundance of oligonucleotides in the E. coli genome.
Nucleic Acids Res., 20, 1663–1668.23. Hawkins,J., Grant,C., Noble,W.S. and Bailey,T.L. (2009)
Assessing phylogenetic motif models for predicting transcriptionfactor binding sites. Bioinformatics, 25, i339–i347.
24. Frith,M.C., Fu,Y., Yu,L., Chen,J.F., Hansen,U. and Weng,Z.(2004) Detection of functional DNA motifs via statisticalover-representation. Nucleic Acids Res., 32, 1372–1381.
25. Green-D.M. and Swets,J.A. (1966) Signal Detection Theory and Psychophysics. Wiley, NY.
26. Lozada-Chavez,I., Angarica,V.E., Collado-Vides,J. andContreras-Moreira,B. (2008) The role of DNA-binding specificityin the evolution of bacterial regulatory networks. J. Mol. Biol.,
379, 627–643.27. Janky,R. and van Helden,J. (2008) Evaluation of phylogenetic
footprint discovery for predicting bacterial cis-regulatory elementsand revealing their evolution. BMC Bioinformatics, 9, 37.
28. Robertson,G., Hirst,M., Bainbridge,M., Bilenky,M., Zhao,Y.,Zeng,T., Euskirchen,G., Bernier,B., Varhol,R., Delaney,A. et al .
(2007) Genome-wide profiles of STAT1 DNA association usingchromatin immunoprecipitation and massively parallel sequencing.
Nat. Methods, 4, 651–657.29. Pepke,S., Wold,B. and Mortazavi,A. (2009) Computation for
ChIP-seq and RNA-seq studies. Nat. Methods, 6, S22–S32.30. Wade,J.T., Struhl,K., Busby,S.J. and Grainger,D.C. (2007)
Genomic analysis of protein-DNA interactions in bacteria:insights into transcription and chromosome organization.Mol. Microbiol., 65, 21–26.
31. Portales-Casamar,E., Thongjuea,S., Kwon,A.T., Arenillas,D.,Zhao,X., Valen,E., Yusuf,D., Lenhard,B., Wasserman,W.W. andSandelin,A. (2010) JASPAR 2010: the greatly expandedopen-access database of transcription factor binding profiles.
Nucleic Acids Res., 38, D105–D110.32. Bailey,T.L., Boden,M., Whitington,T. and Machanick,P. (2010)
The value of position-specific priors in motif discovery usingMEME. BMC Bioinformatics, 11, 179.
Nucleic Acids Research, 2011, Vol. 39, No. 3 823

8/17/2019 Nucl. Acids Res. 2011 Medina Rivera 808 24
http://slidepdf.com/reader/full/nucl-acids-res-2011-medina-rivera-808-24 17/17
33. van Helden,J., Rios,A.F. and Collado-Vides,J. (2000) Discoveringregulatory elements in non-coding sequences by analysis of spaced
dyads. Nucleic Acids Res., 28, 1808–1818.34. Wingender,E. (2008) The TRANSFAC project as an example of
framework technology that supports the analysis of genomicregulation. Brief. Bioinform., 9, 326–332.
35. Zhu,J. and Zhang,M.Q. (1999) SCPD: a promoter database of the yeast Saccharomyces cerevisiae. Bioinformatics, 15, 607–611.
36. Thomas-Chollier,M., Sand,O., Turatsinze,J.V., Janky,R.,Defrance,M., Vervisch,E., Brohee,S. and van Helden,J. (2008)RSAT: regulatory sequence analysis tools. Nucleic Acids Res., 36,W119–W127.
37. van Helden,J. (2003) Regulatory sequence analysis tools.Nucleic Acids Res., 31, 3593–3596.
38. van Helden,J., Andre,B. and Collado-Vides,J. (2000) A web sitefor the computational analysis of yeast regulatory sequences.Yeast, 16, 177–187.
39. Staden,R. (1989) Methods for calculating the probabilities of finding patterns in sequences. Comput. Appl. Biosci., 5, 89–96.
40. Crooks,G.E., Hon,G., Chandonia,J.M. and Brenner,S.E. (2004)WebLogo: a sequence logo generator. Genome Res., 14,1188–1190.
824 Nucleic Acids Research, 2011, Vol. 39, No. 3


![arXiv:1509.04662v2 [nucl-ex] 25 Apr 2016 · 2016-04-27 · arXiv:1509.04662v2 [nucl-ex] 25 Apr 2016 ... c˝](https://static.fdocuments.in/doc/165x107/5e891cf0fc8bf16fb95ce1d8/arxiv150904662v2-nucl-ex-25-apr-2016-2016-04-27-arxiv150904662v2-nucl-ex.jpg)