
NSW local government waste and resource recovery data report 2010–2011 · 4 NSW Local Government...
71
NSW local government waste and resource recovery data report as reported by councils 2010–2011
Transcript of NSW local government waste and resource recovery data report 2010–2011 · 4 NSW Local Government...

NSW local government waste and resource recovery data report
as reported by councils
2010–2011

Published by: Environment Protection Authority 59–61 Goulburn Street, Sydney PO Box A290, Sydney South 1232 Phone: (02) 9995 5000 (switchboard) Phone: 131 555 (environment information and publications requests) Fax: (02) 9995 5999 TTY users: phone 133 677, then ask for 131 555 Speak and listen users: phone 1300 555 727, then ask for 131 555 Email: [email protected] Website: www.epa.nsw.gov.au ISBN 978 1 74293 862 2 EPA 2012/0834 April 2013 For further information Waste and Resource Recovery Resource Recovery Unit Email: [email protected]
Disclaimer: The NSW Environment Protection Authority (EPA) has compiled this document in good faith, exercising all due care and attention. The State of NSW and the EPA do not accept responsibility for inaccurate or incomplete information. Readers should seek professional advice when applying this information to their specific circumstances.
© NSW EPA 2013

NSW Local Government Waste and Resource Recovery Data Report 2010–2011 3
Contents
Executive Summary ............................................................................................................ 4
Background ......................................................................................................................... 7
1. Kerbside collection of recyclables ................................................................................ 8
Dry recyclables collection ............................................................................................. 8
Kerbside organics collection ....................................................................................... 15
2. Kerbside residual waste collection ............................................................................. 20
3. Alternative Waste Treatment (AWT) .......................................................................... 25
4. Kerbside clean up service .......................................................................................... 26
5. Drop off facilities provided by councils ....................................................................... 27
6. Total domestic generation and diversion rates ........................................................... 28
7. Domestic waste management charges ...................................................................... 35
Glossary ............................................................................................................................ 36
Appendix 1: Kerbside Domestic Waste and Recycling Services 2010-11 ........................ 39
Appendix 2: Domestic Waste Generation and Diversion Rates 2010-11 .......................... 45
Appendix 3: Weekly Kerbside Household and Per Capita Waste Generations 2010-11 .. 53
Appendix 4: Predominant Bin Size and Collection Frequency 2010-11 ............................ 61
Appendix 5: Domestic Waste Management Charges 2010-11 ......................................... 67
Appendix 6: Total Household and Population Figures ...................................................... 71

4 NSW Local Government Waste and Resource Recovery Data Report 2010–2011
Executive summary This is the sixth annual report outlining the performance of local government councils’ kerbside and drop-off waste, recycling and resource recovery services in NSW based on information provided by Councils. The report amalgamates data and information as reported by individual councils.
Reported kerbside collection of dry recyclables and garden organics:
The progressive increase in the overall recycling performance from kerbside dry recyclables and garden organics has continued with 1.15 million tonnes collected in 2010–11 compared to 878,978 tonnes in 2005–06
An average of 5.3kg of dry recyclables was collected per week at the kerbside per household in 2010–11, for the 127 councils that provided service
An average of 5.6kg household organics was collected per week at the kerbside per household in 2010–11, for the 64 councils that provided service
Reported residual waste generation:
An average of 11.8kg of residual waste was generated per week at the kerbside per household in 2010–11, for the 151 councils that provided service
Total residual waste generated at the kerbside dropped by 34,319 tonnes relative to 2005–06, reducing to 1.61 million tonnes in 2010–11
The reported amount of residual waste recovered through an Alternative Waste Technology (AWT) facility was 178,457 tonnes in 2010–11, almost triple the amount recovered in 2005–06. This equates to 11% of the kerbside waste collection being recovered.
Reported kerbside Clean up:
Total waste collected through kerbside cleanup collection services, for the 87 councils that reported, was 178,907 tonnes in 2010–11, of which 44,346 tonnes were recycled (25 per cent recovery rate)
Drop off facilities:
Total reported domestic waste dropped off, for the 128 councils that reported, was 493,664 tonnes in 2010–11, of which 255,673 was recycled (52 per cent recovery rate)
Total domestic waste and diversion rate:
Total of 1.63 million tonnes of recyclables were collected and 1.88 million tonnes of residual waste disposed to landfill in 2010–11
NSW total domestic diversion rate (Includes kerbside, clean up and drop off) has increased from 37.8 per cent in 2005–06 to 46.5 per cent in 2010–11.

NSW Local Government Waste and Resource Recovery Data Report 2010–2011 5
Table 1: Total Domestic Diversion Rates, NSW 2005–06 to 2010–11
Year 2005–06 2006–07 2007–08 2008–2009 2009–2010 2010–2011
Diversion rate 37.8 % 40.8 % 43.2 % 43.7 % 45.1 % 46.5 %
Household kerbside generation trend:
The average weekly household kerbside collection of recyclables increased by 1.5kg, reaching 10.9kg in 2010–11 (5.3kg dry recyclables and 5.6kg organics) compared to 9.4kg in 2005–06.
The average weekly household kerbside residual waste generation in NSW declined by almost 1kg in 2010–11 (11.8kg) relative to 12.7kg generated in 2005–06 (Figure 1).
Figure 1: Average weekly household kerbside generations, NSW 2005–06 to 2010–11
The total kerbside household dry recyclables collection increased by 95,384 tonnes or 16 per cent relative to 2005–06, reaching 704,716 tonnes in 2010–11. Similarly, total kerbside household organics collected increased by 174,801 tonnes or 65 per cent, relative to 2005–06, reaching 444,448 tonnes in 2010–11.

6 NSW Local Government Waste and Resource Recovery Data Report 2010–2011
The total kerbside household residual waste generation dropped by 2 per cent or 34,319 tonnes compared to 2005–06’s figure to a total of 1.61 million tonnes in 2010–11 (Figure 2).
Figure 2: Total household kerbside generation in tonnes, NSW 2005–06 to 2010–11

NSW Local Government Waste and Resource Recovery Data Report 2010–2011 7
Background This report amalgamated information provided by individual councils in response to NSW Environment Protection Authority (EPA) survey of all NSW local government councils to determine the characteristics of waste and resource recovery services available to residents of NSW for 2010–11. The survey incorporated the information required under the National Environment Protection Measure (NEPM) for Used Packaging Materials1 in addition to information relating to domestic resource recovery as well as waste collection and disposal.
This report should assist councils in making decisions and assessing progress against the goals and targets in the NSW Waste Avoidance and Resource Recovery Strategy2.
This report contains information as follows:
Population figures that were used for per capita calculations are derived from the Australian Bureau of Statistics (ABS) population estimates3. The population figures used are from, and refer to, population projections as at 30 June 2010.
EPA acknowledges the cooperation and contribution of all NSW councils in providing the data presented within this report. Please note that the information within this report is entirely dependent on the accuracy of data supplied by councils in the 2010–11 survey. While EPA has made an effort to verify the information supplied by councils wherever possible, EPA is not able to validate the raw data that forms the basis of this report.
1 For further information: www.scew.gov.au 2 For further information: www.environment.nsw.gov.au 3 ABS: Cat. No. 3218.0.55.001 Regional Population Growth, Australia - companion data
8 NSW Local Government Waste and Resource Recovery Data Report 2010–2011
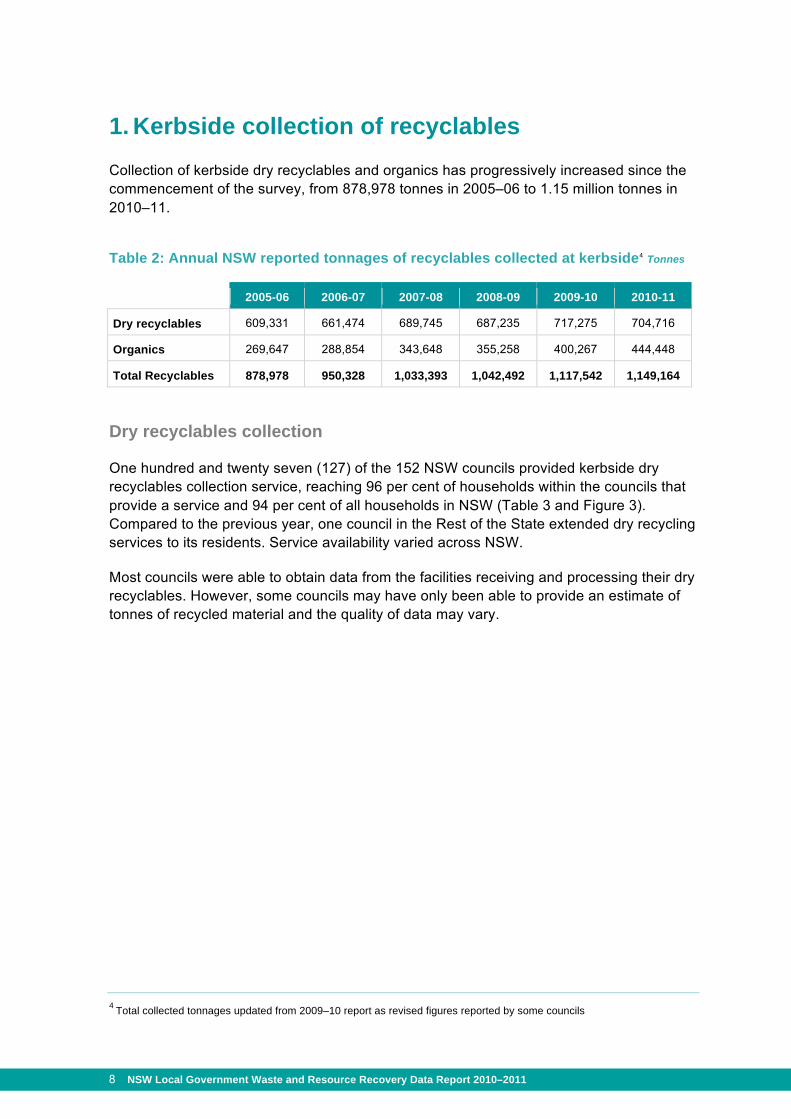
1. Kerbside collection of recyclables Collection of kerbside dry recyclables and organics has progressively increased since the commencement of the survey, from 878,978 tonnes in 2005–06 to 1.15 million tonnes in 2010–11.
Table 2: Annual NSW reported tonnages of recyclables collected at kerbside4 Tonnes
2005-06 2006-07 2007-08 2008-09 2009-10 2010-11
Dry recyclables 609,331 661,474 689,745 687,235 717,275 704,716
Organics 269,647 288,854 343,648 355,258 400,267 444,448
Total Recyclables 878,978 950,328 1,033,393 1,042,492 1,117,542 1,149,164
Dry recyclables collection
One hundred and twenty seven (127) of the 152 NSW councils provided kerbside dry recyclables collection service, reaching 96 per cent of households within the councils that provide a service and 94 per cent of all households in NSW (Table 3 and Figure 3). Compared to the previous year, one council in the Rest of the State extended dry recycling services to its residents. Service availability varied across NSW.
Most councils were able to obtain data from the facilities receiving and processing their dry recyclables. However, some councils may have only been able to provide an estimate of tonnes of recycled material and the quality of data may vary.
4 Total collected tonnages updated from 2009–10 report as revised figures reported by some councils

NSW Local Government Waste and Resource Recovery Data Report 2010–2011 9
Table 3: Percentage coverage of household within council providing a dry recycling service in NSW5
Region
No. of councils providing
service
Household
Total 6 Coverage percentage 7 (NSW / Region with service)
Coverage percentage 8 (NSW / Region)
NSW 127 2,561,624 96% 94%
SMA9 38 1,446,016 99% 99%
ERA10 13 513,159 97% 97%
RRA11 20 294,305 93% 92%
Rest of the State 56 308,144 86% 75%
Figure 3: NSW councils providing kerbside dry recycling collection services
5 Refer Appendix 6 for total NSW and regional figures 6 Represents total households receiving kerbside dry recycling service 7 Coverage percentage of households within NSW / Region with service 8 Coverage percentage of all households within NSW / Region 9 Sydney Metropolitan Area 10 Extended Regulated Area 11 Regional Regulated Area

10 NSW Local Government Waste and Resource Recovery Data Report 2010–2011
An annual average of 275kg kerbside dry recyclables was collected in NSW from households with a recycling service which equates to a weekly average of 5.3kg per household or 1.9kg per person in 2010–11. The average collection figure for household and population in each region is presented below in Table 4.
Table 4: Average reported quantity of kerbside dry recyclables collected by household and population
Region
No. of councils reporting
Household 12 Population 13
Annual kg/hh/yr
Weekly kg/hh/wk
Annual kg/capita/yr
Weekly kg/capita/wk
NSW 127 275 5.3 99 1.9
SMA 38 279 5.4 99 1.9
ERA 13 278 5.4 105 2.0
RRA 20 272 5.2 103 2.0
Rest of the State 56 254 4.9 88 1.7
The reported annual average household dry recycling collection has increased by 14kg compared to 2005–06 however, there has been a drop of 9kg relative to 284 kg/hh/yr collected in 2009–10. The reported average collection for the SMA and ERA were higher than the state average at 279 kg/hh/yr and 278 kg/hh/yr respectively.
Figure 4 shows that the number of councils reporting an average collecting between 4-7kg has increased over the six year period. In 2010-11, 106 councils collected in that range compared to 85 in 2005-06 and more council reported collection close to the state average in 2010–11. Of the 127 councils in NSW that provided kerbside dry recyclable collection service, only 22 had collected less than 4 kg per household per week, and 26 councils exceeded 6kg on average (Figure 4).
12 Based on number of serviced households within councils providing service 13 Based on total population within councils providing service

NSW Local Government Waste and Resource Recovery Data Report 2010–2011 11
Figure 4: Average reported kerbside dry recyclables collected per household across local government areas
NSW councils used seven different dry recycling collection systems in 2010–11 (Table 5). In order to promote greater recovery and provide best practice solution, EPA recommends a minimum of 240L MGB capacity available for dry recycling per fortnight and 107 councils in total used this bin size.
Table 5: Annual average quantity of household kerbside dry recyclables collected, by collection system14
Collection system SMA ERA RRA Rest of
the State No. of
councils
Average collections
kg/ hh /yr kg/ hh /wk
240L MGB 33 10 18 46 107 267 5.1
240L MGB split (P/ C) - 3 1 1 5 243 4.7
140L MGB 1 - 1 1 3 303 5.8
120L MGB 2 - - 1 3 339 6.5
2 x 120L MGB Dual Bins 1 - - - 1 346 6.7
55L MGB - - - 1 1 263 5.1
Crate 1 - - 6 7 178 3.4
No kerbside recycling collection service - - 1 24 25 - -
14 The average annual figure is based on predominant bin size, larger proportion of dwelling types within councils and not based on collection frequency.

12 NSW Local Government Waste and Resource Recovery Data Report 2010–2011
Figure 5 below compares average weekly household dry recyclables collected by bin size. The 240L MGB collected an average of 5.1kg/hh/wk and was used by 84 per cent (107 councils) of the councils with a kerbside recycling service. The 120L MGB dual bins showed the highest average collection at 6.7kg/hh/wk in 2010–11, but only one council within SMA used this bin type.
Figure 5: Average weekly kerbside household dry recyclables collected by collection system
The total quantity of kerbside collected dry recyclables decreased by 2 per cent or 12,560 tonnes in 2010–11 compared to the previous year. Only the ERA reported an increase of 2 per cent or about 3,000 tonnes of dry recyclables collected, while SMA reported a drop of 3 per cent and other regions reported slightly lower collection compared to the previous year.
Total dry recyclables collected at the kerbside in NSW in 2010–11 was 704,716 tonnes with 403,681 tonnes collected from the SMA; 142,884 tonnes from the ERA; 79,943 tonnes from the RRA and 78,208 tonnes from the Rest of the State.
The total dry recyclables collected in 2010–11 increased by 16 per cent or 95,384 tonnes relative to 2005–06 figures (Figure 6).
Figure 6 also shows average weekly household collection increased to 5.3kg in 2010–11 or by 6 per cent compared to 5.0kg collected in 2005–06. Although the average weekly household collection has not varied much since 2006–07, apart from a slight rise in 2009–10, the total collected quantity increased during the same period.

NSW Local Government Waste and Resource Recovery Data Report 2010–2011 13
Figure 6: Reported annual quantity and average weekly kerbside household dry recyclables collected in NSW
In NSW, the average weekly per capita collection of dry recyclables has been fluctuating over the last five years with a 6 per cent increase in 2010–11 compared to 2005–06 (Figure 7). During the same period, the overall population within councils providing a kerbside dry recycling service increased by 10 per cent and the total dry recyclables collected increased by 16 per cent. The increase in collection may be due to improved recycling behaviour by residents and more councils offering a dry recycling service.
Figure 7: Reported annual quantity and average weekly per capita collection of kerbside dry recyclables in NSW

14 NSW Local Government Waste and Resource Recovery Data Report 2010–2011
Environmental benefits of recovering dry recyclables
Recycling results in the avoidance of environmental impacts associated with resource extraction, materials production and manufacturing processes. The environmental benefits of the community recycling 704,716 tonnes of dry recyclables in NSW during 2010–11 are demonstrated using the Environmental Benefits of Recycling Calculator15. The indicators used in the calculator are greenhouse benefits, energy and water savings, as well as landfill space saved. All benefits are net benefits, that is, they are the benefits after the average impacts of collection, transporting and reprocessing have been accounted for.
The recycling of 704,716 tonnes of dry recyclables saves 423,481 equivalent tonnes of CO2, 7.21 million gigajoules of energy, 11.62 million mega litres of water (4,647 Olympic size swimming pools) and saves 4.59 million m3 of landfill space.
15 For further information: http://www.environment.nsw.gov.au/warr/BenefitRecycling.htm

NSW Local Government Waste and Resource Recovery Data Report 2010–2011 15
Kerbside organics collection
Sixty four (64) of the 152 NSW councils provided kerbside garden organics collections in 2010–11, reaching 80 per cent of households within the councils that provide a service and 56 per cent of all households in NSW (Table 6 and Figure 8). Some councils could only provide estimates of the quantities recovered.
Table 6: Percentage coverage of household and population with organics service in NSW
Region
No. of councils providing
service
Household
Total 16 Coverage percentage 17 (NSW / Region with service)
Coverage percentage 18 (NSW / Region)
NSW 64 1,519,307 80% 56%
SMA 34 956,704 78% 65%
ERA 6 281,027 97% 53%
RRA 13 162,332 71% 51%
Rest of the State 11 119,244 75% 29%
Figure 8: NSW councils providing kerbside organics collection services
16 Represents total households receiving kerbside organics service 17 Coverage percentage of households within NSW / Region with service 18 Coverage percentage of all households within NSW / Region
16 NSW Local Government Waste and Resource Recovery Data Report 2010–2011
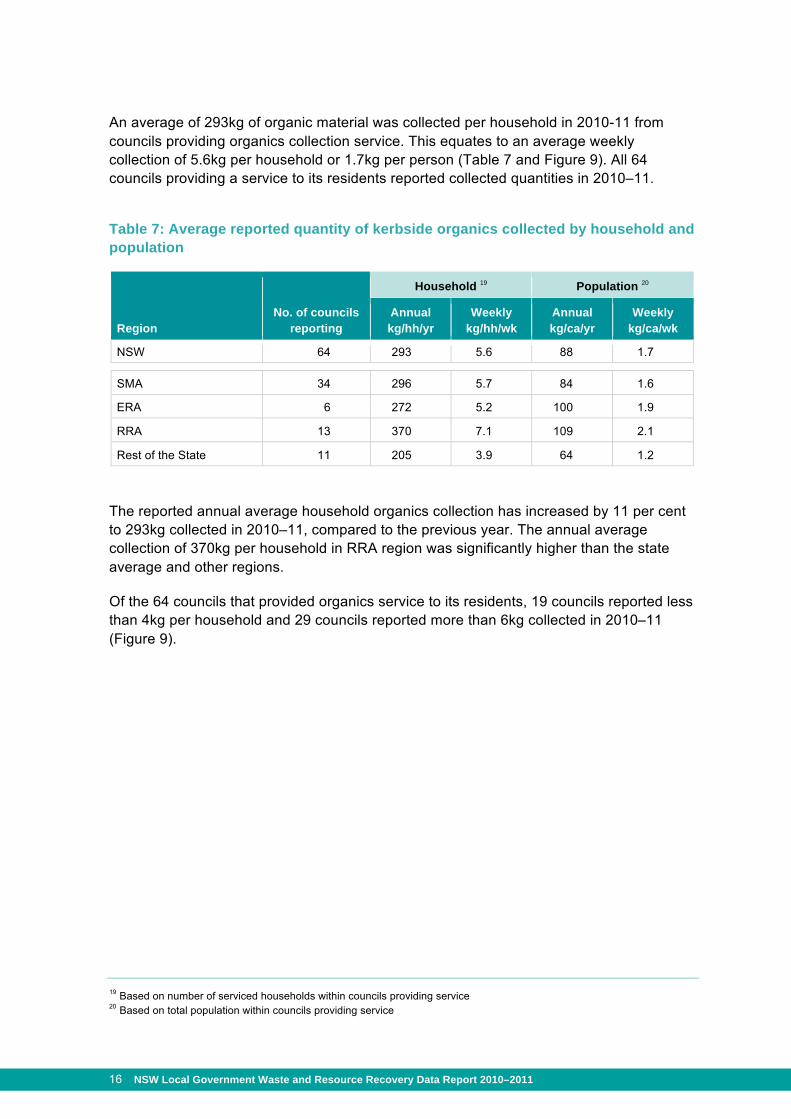
An average of 293kg of organic material was collected per household in 2010-11 from councils providing organics collection service. This equates to an average weekly collection of 5.6kg per household or 1.7kg per person (Table 7 and Figure 9). All 64 councils providing a service to its residents reported collected quantities in 2010–11.
Table 7: Average reported quantity of kerbside organics collected by household and population
Region No. of councils
reporting
Household 19 Population 20
Annual kg/hh/yr
Weekly kg/hh/wk
Annual kg/ca/yr
Weekly kg/ca/wk
NSW 64 293 5.6 88 1.7
SMA 34 296 5.7 84 1.6
ERA 6 272 5.2 100 1.9
RRA 13 370 7.1 109 2.1
Rest of the State 11 205 3.9 64 1.2
The reported annual average household organics collection has increased by 11 per cent to 293kg collected in 2010–11, compared to the previous year. The annual average collection of 370kg per household in RRA region was significantly higher than the state average and other regions.
Of the 64 councils that provided organics service to its residents, 19 councils reported less than 4kg per household and 29 councils reported more than 6kg collected in 2010–11 (Figure 9).
19 Based on number of serviced households within councils providing service 20 Based on total population within councils providing service

NSW Local Government Waste and Resource Recovery Data Report 2010–2011 17
Figure 9: Average reported kerbside organics collected per household across local government areas
The EPA preferred resource recovery systems for local councils in draft Best Bin System guide recommends a 240L MGB for organics service. In 2010–11, the most common collection system provided by councils was a 240L MGB with varied collection frequencies. Of those, 42 councils collected fortnightly, 9 councils collected weekly and 5 councils collected monthly. The other common collection system was a combination of various systems (Others – tied and bundled, MGBs or mixture of these systems), collected fortnightly, on call or monthly (Table 8).
Table 8: Annual average quantity of household kerbside organics collected, by collection system21
Collection system SMA ERA RRA Rest of
the State No. of
councils
Average collections
kg/hh/yr kg/hh/wk
240L MGB (Fortnightly) 21 5 8 8 42 299 5.8
240L MGB (Weekly) 4 - 5 - 9 423 8.1
240L MGB (Monthly) 3 - 2 5 162 3.1
240L MGB (On Call) 1 1 39 0.7
Others (Various) + 5 1 1 7 176 3.4
No Service 4 7 8 69 88 - -
* Tied and Bundled + MGBs, or combination of both, Frequency (Various).
21 The average annual figure is based on predominant bin size and larger proportion of dwelling types within councils.

18 NSW Local Government Waste and Resource Recovery Data Report 2010–2011
Figure 10 below compares the average weekly quantity of household organics collected by collection type. The 42 councils that used the 240L bin with fortnightly collection frequency were geographically spread across the SMA, ERA, RRA and the Rest of the State. The average weekly collection by this bin type increased by 12 per cent to 5.8kg in 2010–11 compared to previous year’s collection of 5.2kg. The weekly collection of the 240L bin preferred by 9 councils averaged the highest collected quantity at 8.1kg per household.
Figure 10: Average weekly kerbside household organics collected by collection system
Kerbside organics collection across NSW increased by 65 per cent or around 175,000 tonnes compared to 2005–06, to a total of 444,448 tonnes in 2010–11. Since 2008–09, the reported organics collection has increased by more than 40,000 tonnes annually with 13 per cent and 11 per cent increases in 2009–10 and 2010–11 respectively (Figure 11).
The breakdown of total organics collected from the regions shows that the SMA had the highest reported amount collected at 283,466 tonnes from 34 councils providing an organics service within that region. The remaining 19 councils within the regulated area providing an organics service collected 76,578 tonnes and 59,989 tonnes from ERA and RRA regions respectively. The 11 councils providing service in Rest of the State collected 24,415 tonnes in 2010–11.
The average weekly collection of household organics has increased by 27 per cent to 5.6kg in 2010–11 relative to 4.4kg collected on 2005–06. An increase in average weekly collection of 12 per cent was reported in 2010–11 compared to previous year (5.0kg in 2009–10, Figure 11). This was the highest year to year increase in average weekly household collection since 2005–06.

NSW Local Government Waste and Resource Recovery Data Report 2010–2011 19
Figure 11: Reported annual kerbside organics collected in NSW
The average weekly collection of kerbside organics per capita in NSW has increased by 21 per cent to 1.7kg in 2010–11 compared to 1.4kg collected in 2005–06. During the same period the total collected quantity increased by 65 per cent which can be partly explained by a continued increase in the number of councils offering a kerbside organics collection service. From 2007–08 to 2009–10, the average weekly per capita generation of organics levelled off at 1.6kg with 6 per cent increase in 2010–11 but the total collected quantity increased by 30 per cent during that period (Figure 12).
Figure 12: Reported annual and average weekly per capita collection of kerbside organics in NSW

20 NSW Local Government Waste and Resource Recovery Data Report 2010–2011
2. Kerbside residual waste collection In 2010–11, 151 councils provided a kerbside residual waste collection service, reaching 96 per cent of households within the councils providing service and 96 per cent of all households in NSW. Access to collection varied across NSW; with all households receiving collection services in the SMA, 97 per cent in ERA, 92 per cent in RRA and 86 per cent of households in the Rest of the State (Table 9 and Figure 13).
Table 9: Percentage coverage of household and population with a residual waste service in NSW
Region
No. of Councils providing
service
Household
Total 22 Coverage percentage 23 (NSW / Region with service)
Coverage percentage 24 (NSW / Region)
NSW 151 2,619,091 96% 9%
SMA 38 1,457,586 100% 100%
ERA 13 513,158 97% 97%
RRA 21 296,106 92% 92%
Rest of the State 79 352,241 86% 86%
Figure 13: NSW councils providing kerbside residual waste collection services
22 Represents total households receiving kerbside residual waste service 23 Coverage percentage of all households within NSW / Region with service 24 Coverage percentage of all households within NSW / Region

NSW Local Government Waste and Resource Recovery Data Report 2010–2011 21
An average of 613kg of residual waste was collected per household from the 151 councils in 2010–11, averaging weekly generation of 11.8kg per household or 4.3kg per person in NSW (Table 10). The average weekly household generation decreased by almost a kilogram in 2010–11, compared to 12.7kg generated in 2005–06.
Councils within the RRA reported the least annual average kerbside residual waste generation compared to other regions at 520kg. The ERA reported the highest generation at 661kg in 2010–11.
Table 10: Average reported quantity of kerbside residual waste generated by household and population
Region
No. of councils reporting
Household25 Population26
Annual kg/hh/yr
Weekly kg/hh/wk
Annual kg/ca/yr
Weekly kg/ca/wk
NSW 151 613 11.8 222 4.3
SMA 38 607 11.7 217 4.2
ERA 13 661 12.7 248 4.8
RRA 21 520 10.0 196 3.8
Rest of the State 79 648 12.5 226 4.4
Since 2005–06, councils reporting kerbside household residual waste generation of more than 15kg per week have gradually decreased. In 2010–11, only 36 councils generated more than 15kg compared to 43 councils in the previous year.
Figure 14 shows a shift in the quantity of residual waste generation in NSW, as more councils reported generating less in 2010–11 compared to 2005–06. It also shows more councils reported weekly generation close to the state average in 2010–11.
25 Based on number of serviced households within councils providing service 26 Based on total population within councils providing service

22 NSW Local Government Waste and Resource Recovery Data Report 2010–2011
Figure 14: Average reported kerbside residual waste generated per household across local government areas
Four different residual waste collection systems were used by NSW councils (Table 11). Seventy three councils in total used 80, 120 or 140 litre MGB for residual waste collection and the other 78 councils providing service used 240 litre MGB.
Table 11: Annual average quantity of household kerbside residual waste collected, by collection system27
Collection system SMA ERA RRA Rest of
the State No. of
councils
Average collections
kg/hh/yr kg/hh/wk
240L MGB 11 6 12 49 78 648 12.5
140L MGB 10 3 7 16 36 558 10.7
120L MGB 14 3 2 13 32 628 12.1
80L MGB 3 1 - 1 5 396 7.6
No service - - - 1 1 - -
27 The average annual figure is based on predominant bin size, larger proportion of dwelling types within councils and not based on collection frequency.
NSW Local Government Waste and Resource Recovery Data Report 2010–2011 23
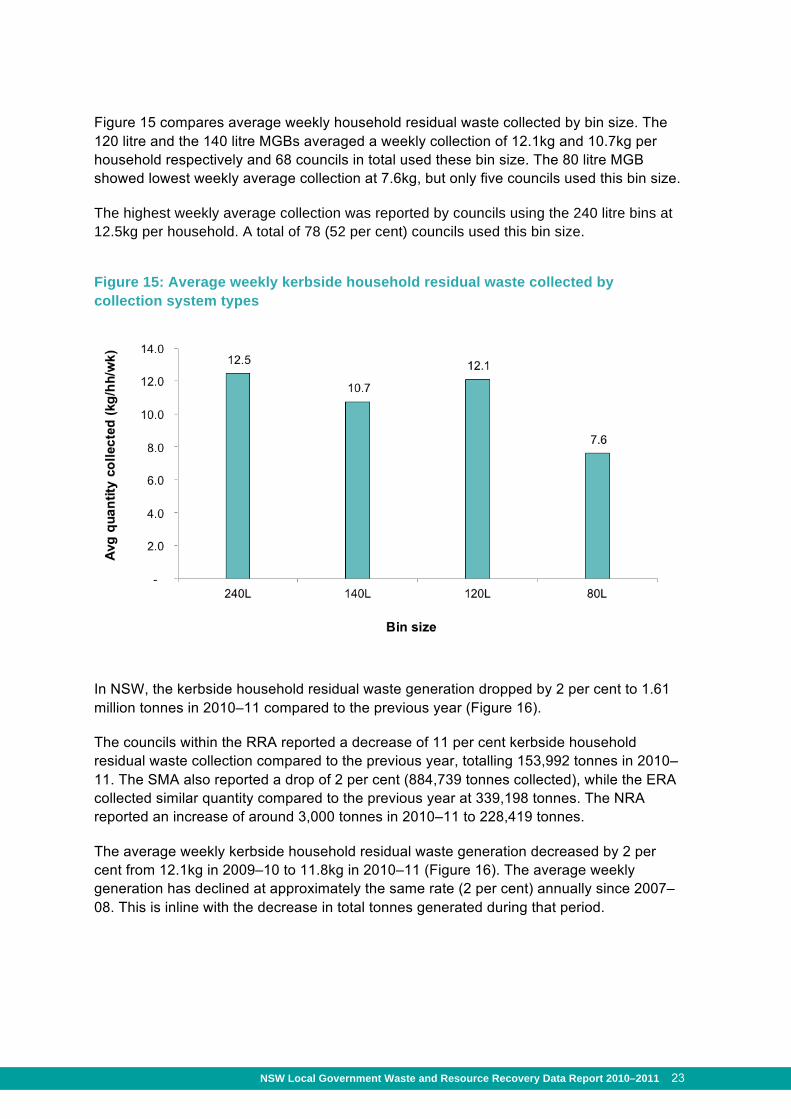
Figure 15 compares average weekly household residual waste collected by bin size. The 120 litre and the 140 litre MGBs averaged a weekly collection of 12.1kg and 10.7kg per household respectively and 68 councils in total used these bin size. The 80 litre MGB showed lowest weekly average collection at 7.6kg, but only five councils used this bin size.
The highest weekly average collection was reported by councils using the 240 litre bins at 12.5kg per household. A total of 78 (52 per cent) councils used this bin size.
Figure 15: Average weekly kerbside household residual waste collected by collection system types
In NSW, the kerbside household residual waste generation dropped by 2 per cent to 1.61 million tonnes in 2010–11 compared to the previous year (Figure 16).
The councils within the RRA reported a decrease of 11 per cent kerbside household residual waste collection compared to the previous year, totalling 153,992 tonnes in 2010–11. The SMA also reported a drop of 2 per cent (884,739 tonnes collected), while the ERA collected similar quantity compared to the previous year at 339,198 tonnes. The NRA reported an increase of around 3,000 tonnes in 2010–11 to 228,419 tonnes.
The average weekly kerbside household residual waste generation decreased by 2 per cent from 12.1kg in 2009–10 to 11.8kg in 2010–11 (Figure 16). The average weekly generation has declined at approximately the same rate (2 per cent) annually since 2007–08. This is inline with the decrease in total tonnes generated during that period.

24 NSW Local Government Waste and Resource Recovery Data Report 2010–2011
Figure 16: Reported annual quantity and average weekly kerbside household residual waste generation in NSW
The average weekly per capita generation of residual waste also decreased by 2 per cent from 4.4kg in 2009–10 to 4.3kg in 2010–11 and by 8 per cent compared to 2005–06 figure (Figure 17).
Figure 17: Reported annual quantity and average weekly per capita kerbside residual waste generation in NSW

NSW Local Government Waste and Resource Recovery Data Report 2010–2011 25
3. Alternative Waste Treatment (AWT) Not all domestic residual waste collected at kerbside goes to landfill; some goes to Alternative Waste Treatment (AWT) facilities. AWT use a range of different mechanical and biological treatment technologies to treat or process residual waste. Depending on the technology and the operation of the facility, these plants can recover additional physical and organic resources from residual waste; recover energy from the waste; stabilise waste material prior to landfilling to reduce greenhouse gas emissions and reduce the mass of waste that goes to landfill and thus save on disposal costs. Typically, the ultimate residual wastes from the AWT process, and any processed material that cannot be beneficially reused, is disposed of to landfill.
A total of 21 councils sent all or part of their kerbside residual waste to an AWT facility in 2010–11. In total these councils reported 178,457 tonnes recovered from residual waste in 2010–11. The total amount recovered from AWT facilities increased by 20 per cent compared to 148,415 tonnes recovered in 2009–10. The residual waste disposed to landfill from the process increased by only 6 per cent to 194,570 tonnes compared to 184,030 tonnes disposed in the previous year.
Figure 18 presents the percentage and amount recovered by AWT facilities from the regions with largest quantity being recovered in the SMA. Twelve out of 38 councils from the SMA, 2 councils each from the ERA and the Rest of State and 5 councils from the RRA processed waste through an AWT facility in 2010–11.
Of the total recovered amount, 89 per cent was from the SMA, 8 per cent from the ERA, around 2 per cent from the RRA and 88 tonnes from Rest of the State AWT facilities.
Figure 18: Domestic kerbside waste recovered in tonnes from AWT by region
The total amount of waste processed through an AWT has almost tripled since 2005–06 to 373,027 tonnes in 2010–11 and the reported material recovery through an AWT has increased to 48 per cent in 2010–11 compared to 43 per cent reported 2005–06.
Note: The manner in which councils reported recovery by an AWT facility varied as detailed in the footnote to Appendix 2.

26 NSW Local Government Waste and Resource Recovery Data Report 2010–2011
4. Kerbside clean up service In NSW, 88 councils provided kerbside clean up service, reaching 87 per cent of all households and 88 per cent of the entire population in NSW (Figure 19). Access to kerbside clean up service varied across NSW. All 38 councils within the SMA, 11 councils (85 per cent) in the ERA, 15 councils (71 per cent) in the RRA and 24 councils (30 per cent) in the Rest of the State provided this service.
Figure 19: NSW councils with a kerbside clean up service
In 2010–11, 178,90728 tonnes of material was collected from council clean-up services. Of the total collected, 134,561 tonnes went to landfill and 44,346 tonnes were recycled (25,116 tonnes of dry recyclables and 19,230 tonnes of organics).
The overall recovery rate (RR) for kerbside clean up in NSW was 25 per cent.
SMA – 18,607 tonnes recycled and 92,861 tonnes waste to landfill (17 per cent RR)
ERA – 9260 tonnes recycled and 26,316 tonnes waste to landfill (26 per cent RR)
RRA – 8001 tonnes recycled and 6,653 tonnes waste to landfill (55 per cent RR)
Rest of the State – 8478 tonnes recycled and 8,731 tonnes waste to landfill (49 per cent RR)
28 Represents only 87 councils providing the collected tonnages

NSW Local Government Waste and Resource Recovery Data Report 2010–2011 27
5. Drop off facilities provided by councils One hundred and thirty four (134) NSW councils provided a drop off facility, which was accessible by 82 per cent of all households and 81 per cent of the entire population in NSW (Figure 20). Access to drop off facilities varied across NSW with 26 councils (68 per cent) in the SMA, all 13 councils in the ERA, 20 councils (95 per cent) in the RRA and 75 councils (94 per cent) in the Rest of the State providing this service.
Figure 20: NSW councils providing a drop off facility
In 2010–11, 493,66429 tonnes of materials were collected from drop off facilities, of which 237,991 tonnes were sent to landfill and 255,673 tonnes of recyclable material (68,421 tonnes dry recyclables and 187,252 tonnes garden organics) were recovered.
The overall recovery rate (RR) for domestic drop off in NSW was 52 per cent.
20,527 tonnes recycled and 4991 tonnes disposed to landfill in the SMA (80 per cent RR)
66,431 tonnes recycled and 62,467 tonnes disposed to landfill in the ERA (52 per cent RR)
83,750 tonnes recycled and 117,837 tonnes disposed to landfill in the RRA (42 per cent RR)
29 Represents only 128 councils providing the collected tonnages

28 NSW Local Government Waste and Resource Recovery Data Report 2010–2011
84,965 tonnes recycled and 52,695 tonnes disposed to landfill in the Rest of the State (62 per cent RR)
6. Total domestic generation and diversion rates This report is based on waste generated and recyclables collected from households only, which is the major component of Municipal Solid Waste (MSW) but is not the total of MSW. The separate biennial WARR Strategy report provides updates on the progress that the NSW community is making towards the waste avoidance and resource recovery targets of the Strategy.
The total domestic waste generated is the sum total of recyclables (dry recyclables and organics) collected and residual waste generated from households premises received directly from respective collection services. The services offered by councils typically include kerbside, clean up collections and drop off facilities.
Figure 21 presents the total quantity of domestic waste generated from respective waste streams from NSW in 2010–11. A total of 1.63 million tonnes of recyclables were collected and 1.88 million tonnes of residual waste disposed to landfill in 2010-11. This represents a 6 per cent increase in recyclables collection and only a one percent increase in residual waste disposed to landfill compared to the previous year.
The recyclables collected increased by around 40 per cent from 1.16 million tonnes collected in 2005–06 to 1.63 million in 2010–11. During the same period, the residual waste disposed to landfill has dropped by almost 2 per cent to 1.88 million tonnes in 2010–11 from 1.91 million tonnes disposed in 2005–06.
Figure 21: Total domestic generation by waste streams in NSW, 2010–11
Note: The kerbside residual waste disposed to landfill excludes the AWT recovery tonnages but includes reported contaminates disposed from kerbside recyclables collection.

NSW Local Government Waste and Resource Recovery Data Report 2010–2011 29
The total domestic diversion rate for individual councils is reported as the percentage of the total waste diverted from landfills through various recycling practices. Annual and weekly generation rates per household and per capita have also been developed to compare data at an individual level. When comparing figures from different local government areas, consideration should be given to regional variations in consumption patterns and available services.
Table 12 below presents the diversion rates from 2005–06 to 2010–11 for each region and an overall rate for NSW.
The total domestic diversion rate for NSW in 2010–11 was 46.5 per cent when waste from all streams are included in the calculation. The total domestic diversion rate for NSW has progressively increased from 37.8 per cent in 2005–06 to 46.5 per cent in 2010–11.
The councils within the SMA and the ERA regions also improved their total domestic diversion rate during the six year period. The diversion rate for the councils within the SMA region has always been above the state average throughout the six year period.
When comparing the diversion rate for the Rest of the State over the six period consideration should be given to the formation of the regional regulated area (RRA), which commenced from 2009–10. The RRA was formed from 21 councils that prior to 2009–10 were within the Rest of the State. The 21 councils within the RRA region reported the highest diversion rate for the year 2010–11 at 51.1 per cent.
Table 12: Total Domestic Diversion Rate Trend 30
2005-06 2006-07 2007-08 2008-09 2009-10 2010-11
NSW 37.8% 40.5% 43.2% 43.7% 45.2% 46.5% SMA 39.2% 42.9% 47.1% 45.3% 48.5% 50.8%
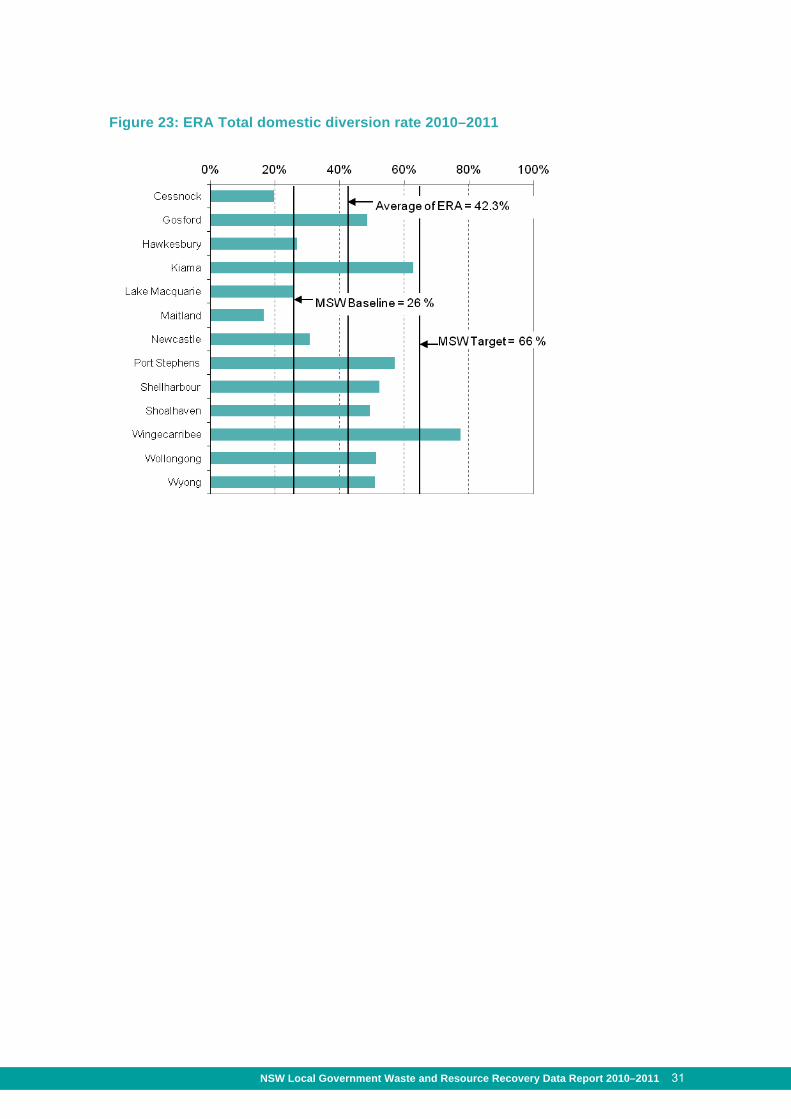
ERA 40.9% 40.9% 40.0% 43.0% 42.9% 42.3%
Rest of the State 32.7% 37.2% 38.0% 40.0% 34.1% 34.6%
RRA - - - - 49.3% 51.1%
30 Total domestic diversion rate updated from 2009-10 report as revised figures reported by some councils

30 NSW Local Government Waste and Resource Recovery Data Report 2010–2011
Figure 22: SMA Total domestic diversion rate 2010–2011
NSW Local Government Waste and Resource Recovery Data Report 2010–2011 31
Figure 23: ERA Total domestic diversion rate 2010–2011

32 NSW Local Government Waste and Resource Recovery Data Report 2010–2011
Figure 24: RRA Total domestic diversion rate 2010–2011

NSW Local Government Waste and Resource Recovery Data Report 2010–2011 33
Figure 25: Rest of State total domestic diversion rate 2010–2011
Note: * No kerbside dry recycling service ** No kerbside residual waste and dry recycling service

34 NSW Local Government Waste and Resource Recovery Data Report 2010–2011
Note: * No kerbside dry recycling service

NSW Local Government Waste and Resource Recovery Data Report 2010–2011 35
7. Domestic waste management charges For the range of Domestic Waste Management Charges (DWMC) in NSW please refer to Appendix 5.
Councils levy a charge for the provision of domestic waste management services for each parcel of rateable land for which the services are available. In levying this charge councils must ensure that the charge does not exceed the reasonable cost to council of providing those services (s496 and s504 of the Local Government Act 1993).
The charges detailed in Appendix 5 are the DWMCs that have been provided by Councils. When considering or comparing these charges it should be understood that services provided through the DWMC may vary considerably from council to council. Also councils may have various DWMCs for a different bin sizes and collection frequencies. The figures listed in Appendix 5 are based on the predominant bin size and single unit dwelling types.

36 NSW Local Government Waste and Resource Recovery Data Report 2010–2011
Glossary
AWT
Alternative Waste Treatment
Diversion Rate
The percentage of waste materials diverted from traditional disposal such as land filling or incineration to be recycled, composted, or re-used (often used interchangeably with recycling rate).
Diversion Rate per cent = Total Recyclables collected (weight) x 100
Total waste generated (waste + Recyclables, weight)
Domestic waste
The sum total of all materials collected or recovered through domestic waste collection services (i.e. residual waste + dry recycling + garden organics + clean up + drop off).
Drop off
Places where materials or goods can be lawfully deposited for resource recovery or special management.
Dry recyclables
The standard range of dry recyclables includes: recyclable paper and cardboard including newspapers, magazines, phone books, cardboard packaging and liquid paperboard; glass bottles and jars; steel cans and aerosols; aluminium rigid and semi-rigid packaging; all plastic containers.
EPA
Environment Protection Authority
Household
A household comprises one or more person, at least one of whom is at lest 15 years of age, usually residing in a same private dwelling (house, unit, farm etc).
Kerbside Clean up collection
A kerbside collection service for waste items that is too large for collection via normal household waste service.
LGA
Local Government Area

NSW Local Government Waste and Resource Recovery Data Report 2010–2011 37
MGB
Mobile Garbage Bin. Also in the general context refers to mobile bins used for the collection of residual waste, dry recycling and garden organics.
Organics Compostable organics is a generic term for all organic materials that are appropriate for collection and use as feedstocks for composting or in related biological treatment systems (Ex: anaerobic digestion). Compostable organics is defined by its material components: residual food organics, garden organics, wood and timber, biosolids and agricultural organics.
Garden organics include:
Putrescible garden organic material (grass clippings)
Non-woody garden organic material
Woody garden organic material
Trees and limbs
Stumps and rootballs (not usually accepted in kerbside collection systems).
Garden organics is one of the primary components of the compostable organics stream.
Predominant bin type
Where a council offers residents a range of bin sizes for a particular waste stream, the size used by largest number of households in a given LGA is considered the predominant bin type.
Resource Recovery Rate
Percentage of usable recycled materials that have been removed from the total amount of waste generated.
Resource Recovery Rate per cent = Total Recyclables materials (weight) x 100
Total waste generated (waste + Recyclables, weight)
Residual waste
Residual waste or garbage is materials that are not separated for recycling or recovery, but are generally disposed of at solid and inert waste landfills.
Waste Avoidance and Resource Recovery (WARR) Act 2001
An Act to promote waste avoidance and resource recovery. Its purpose is to develop a state-wide framework to achieve integrated waste and resource management planning, programs and service delivery, to provide for the continual reduction in waste generation, to minimise the consumption of natural resources and final disposal of waste and to encourage the most efficient use of resources.

38 NSW Local Government Waste and Resource Recovery Data Report 2010–2011
Waste Avoidance and Resource Recovery Strategy (WARR Strategy) 2003
The development of the WARR Strategy is a requirement of the WARR Act. The initial Strategy was released in 2003 and updated in 2007. The WARR Strategy provides guidance and priorities for action to ensure that efficient resource use and impacts on the environment are considered throughout the life cycle of goods and materials. This includes the extraction of raw materials, manufacturing, distribution, consumption and recovery for reprocessing or safe disposal.

NSW
Local Governm
ent Waste and R
esource Recovery D
ata Report 2010–2011 39
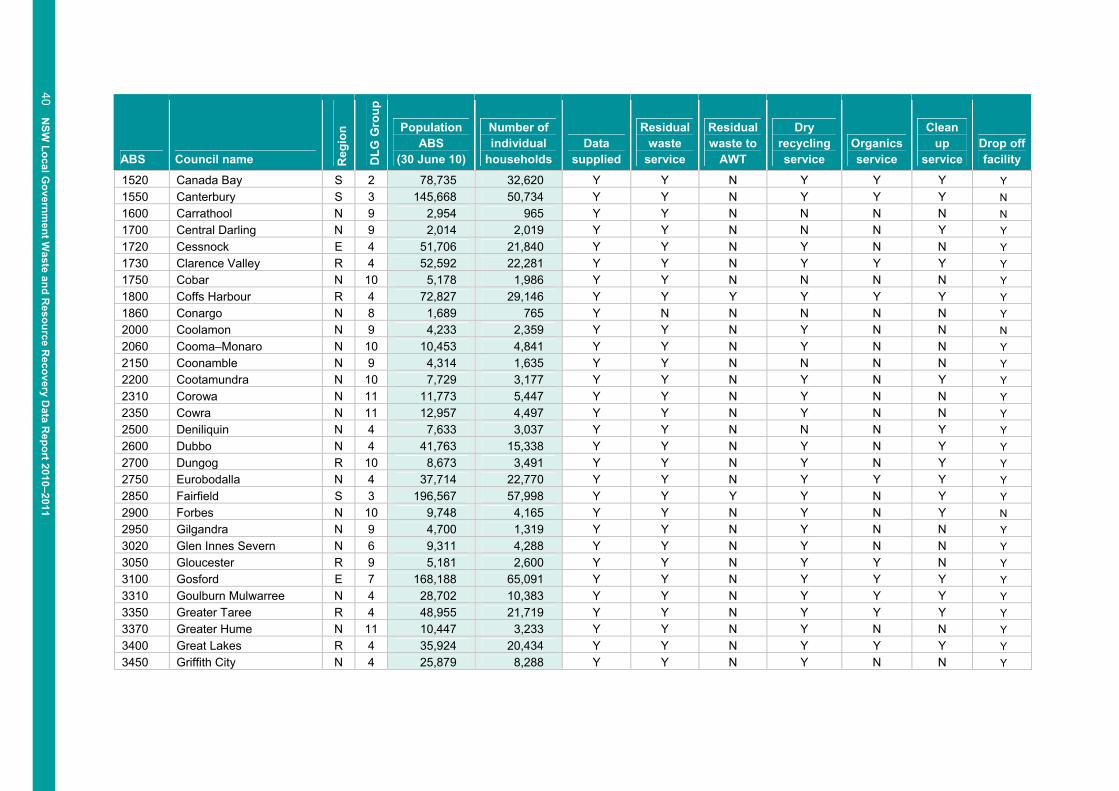
Appendix 1: Kerbside Domestic Waste and Recycling Services 2010–11
ABS Council name Reg
ion
DLG
Gro
up
Population ABS
(30 June 10)
Number of individual
households Data
supplied
Residual waste
service
Residual waste to
AWT
Dry recycling service
Organics service
Clean up
service Drop off facility
60 Albury N 4 51,112 21,049 Y Y N Y Y N Y 110 Armidale Dumaresq N 4 25,855 9,175 Y Y N Y Y N Y 150 Ashfield S 2 42,787 15,093 Y Y N Y Y Y Y 200 Auburn S 2 78,597 23,170 Y Y N Y Y Y Y 250 Ballina R 4 42,708 15,281 Y Y N Y N N Y 300 Balranald N 9 2,476 375 Y Y N N N N Y 350 Bankstown S 3 188,814 62,606 Y Y N Y Y Y N 470 Bathurst N 4 39,915 16,394 Y Y N Y N N Y 500 Hills Shire S 7 179,716 58,676 Y Y N Y Y Y Y 550 Bega Valley N 4 33,925 15,654 Y Y N Y Y N Y 600 Bellingen R 11 13,450 3,882 Y Y Y Y Y Y Y 650 Berrigan N 10 8,644 3,750 Y Y N Y N N Y 750 Blacktown S 3 307,816 100,899 Y Y Y Y N Y N 800 Bland N 10 6,410 3,648 Y Y N N N N Y 850 Blayney N 10 7,259 3,007 Y Y N Y N Y Y 900 Blue Mountains R 7 77,943 32,282 Y Y N Y N Y Y 950 Bogan N 9 3,003 1,069 Y Y N N N N Y 1000 Bombala N 9 2,617 1,379 Y Y Y Y N N Y 1050 Boorowa N 9 2,478 634 Y Y N Y N N Y 1100 Botany Bay S 2 40,463 13,845 Y Y N Y Y Y N 1150 Bourke N 9 3,079 857 Y Y N N N N Y 1200 Brewarrina N 9 1,910 375 Y Y N N N N Y 1250 Broken Hill N 4 19,818 9,544 Y Y N N Y N Y 1300 Burwood S 2 33,803 10,873 Y Y N Y Y Y Y 1350 Byron R 4 32,378 13,678 Y Y N Y N Y Y 1400 Cabonne N 11 13,351 6,355 Y Y N Y N Y Y 1450 Camden S 6 56,809 17,285 Y Y Y Y Y Y N 1500 Campbelltown S 7 153,222 50,097 Y Y Y Y Y Y Y
40 NSW
Local Governm
ent Waste and R
esource Recovery D
ata Report 2010–2011
ABS Council name Reg
ion
DLG
Gro
up
Population ABS
(30 June 10)
Number of individual
households Data
supplied
Residual waste
service
Residual waste to
AWT
Dry recycling service
Organics service
Clean up
service Drop off facility
1520 Canada Bay S 2 78,735 32,620 Y Y N Y Y Y Y 1550 Canterbury S 3 145,668 50,734 Y Y N Y Y Y N 1600 Carrathool N 9 2,954 965 Y Y N N N N N 1700 Central Darling N 9 2,014 2,019 Y Y N N N Y Y 1720 Cessnock E 4 51,706 21,840 Y Y N Y N N Y 1730 Clarence Valley R 4 52,592 22,281 Y Y N Y Y Y Y 1750 Cobar N 10 5,178 1,986 Y Y N N N N Y 1800 Coffs Harbour R 4 72,827 29,146 Y Y Y Y Y Y Y 1860 Conargo N 8 1,689 765 Y N N N N N Y 2000 Coolamon N 9 4,233 2,359 Y Y N Y N N N 2060 Cooma–Monaro N 10 10,453 4,841 Y Y N Y N N Y 2150 Coonamble N 9 4,314 1,635 Y Y N N N N Y 2200 Cootamundra N 10 7,729 3,177 Y Y N Y N Y Y 2310 Corowa N 11 11,773 5,447 Y Y N Y N N Y 2350 Cowra N 11 12,957 4,497 Y Y N Y N N Y 2500 Deniliquin N 4 7,633 3,037 Y Y N N N Y Y 2600 Dubbo N 4 41,763 15,338 Y Y N Y N Y Y 2700 Dungog R 10 8,673 3,491 Y Y N Y N Y Y 2750 Eurobodalla N 4 37,714 22,770 Y Y N Y Y Y Y 2850 Fairfield S 3 196,567 57,998 Y Y Y Y N Y Y 2900 Forbes N 10 9,748 4,165 Y Y N Y N Y N 2950 Gilgandra N 9 4,700 1,319 Y Y N Y N N Y 3020 Glen Innes Severn N 6 9,311 4,288 Y Y N Y N N Y 3050 Gloucester R 9 5,181 2,600 Y Y N Y Y N Y 3100 Gosford E 7 168,188 65,091 Y Y N Y Y Y Y 3310 Goulburn Mulwarree N 4 28,702 10,383 Y Y N Y Y Y Y 3350 Greater Taree R 4 48,955 21,719 Y Y N Y Y Y Y 3370 Greater Hume N 11 10,447 3,233 Y Y N Y N N Y 3400 Great Lakes R 4 35,924 20,434 Y Y N Y Y Y Y 3450 Griffith City N 4 25,879 8,288 Y Y N Y N N Y

NSW
Local Governm
ent Waste and R
esource Recovery D
ata Report 2010–2011 41
ABS Council name Reg
ion
DLG
Gro
up
Population ABS
(30 June 10)
Number of individual
households Data
supplied
Residual waste
service
Residual waste to
AWT
Dry recycling service
Organics service
Clean up
service Drop off facility
3500 Gundagai N 9 3,902 1,550 Y Y N Y N N Y 3550 Gunnedah N 11 12,265 5,402 Y Y N Y Y N Y 3650 Guyra N 9 4,550 1,108 Y Y N Y N N Y 3660 Gwydir N 10 5,425 2,564 Y Y N Y N N Y 3700 Harden N 9 3,669 1,409 Y Y N Y N N Y
3750 Port Macquarie – Hastings R 4 76,323 34,705 Y Y Y Y Y Y Y
3800 Hawkesbury E 6 64,030 21,514 Y Y N Y N Y Y 3850 Hay N 9 3,349 1,224 Y Y N N N N Y 3950 Holroyd S 3 102,188 33,382 Y Y Y Y N Y Y 4000 Hornsby S 7 164,034 54,456 Y Y N Y Y Y Y 4100 Hunters Hill S 2 14,591 4,820 Y Y Y Y Y Y Y 4150 Hurstville S 3 80,823 30,285 Y Y N Y Y Y N 4200 Inverell N 11 16,841 7,198 Y Y N Y N N Y 4250 Jerilderie N 8 1,674 514 Y Y N N N N Y 4300 Junee N 10 6,298 2,095 Y Y N Y N N Y 4350 Kempsey R 4 29,442 12,993 Y Y N Y Y N Y 4400 Kiama E 4 20,906 9,005 Y Y N Y Y Y Y 4450 Kogarah S 2 59,200 20,783 Y Y N Y Y Y Y 4500 Ku–ring–gai S 3 114,142 39,879 Y Y N Y Y Y N 4550 Kyogle R 10 9,877 3,983 Y Y N N N N Y 4600 Lachlan N 10 6,844 2,680 Y Y N N Y N Y 4650 Lake Macquarie E 5 200,849 70,738 Y Y N Y N Y Y 4700 Lane Cove S 2 33,335 12,622 Y Y N Y Y Y N 4750 Leeton N 11 11,929 5,076 Y Y N Y N N Y 4800 Leichhardt S 2 55,596 24,567 Y Y Y Y Y Y Y 4850 Lismore R 4 45,917 16,470 Y Y N Y Y N Y 4880 Lithgow N 4 21,094 10,005 Y Y N Y N Y Y 4900 Liverpool S 7 185,481 53,938 Y Y Y Y Y Y Y 4920 Liverpool Plains N 10 7,965 2,970 Y Y N Y N Y Y 4950 Lockhart N 9 3,318 1,265 Y Y N Y N Y Y

42 NSW
Local Governm
ent Waste and R
esource Recovery D
ata Report 2010–2011
ABS Council name Reg
ion
DLG
Gro
up
Population ABS
(30 June 10)
Number of individual
households Data
supplied
Residual waste
service
Residual waste to
AWT
Dry recycling service
Organics service
Clean up
service Drop off facility
5050 Maitland E 4 70,296 24,591 Y Y N Y N N Y 5150 Manly S 2 41,925 18,027 Y Y N Y Y Y Y 5200 Marrickville S 3 79,215 30,575 Y Y N Y Y Y Y 5270 Mid–Western N 4 22,860 7,155 Y Y N Y N N Y 5300 Moree Plains N 11 14,425 6,132 Y Y N Y N Y Y 5350 Mosman S 2 29,232 13,005 Y Y N Y Y Y Y 5500 Murray N 10 7,319 2,665 Y Y N Y N N Y 5550 Murrumbidgee N 9 2,557 860 Y Y Y Y N Y Y 5650 Muswellbrook R 11 16,676 5,182 Y Y N Y Y Y Y 5700 Nambucca R 11 19,369 8,050 Y Y Y Y Y Y Y 5750 Narrabri N 11 13,741 5,443 Y Y N Y N N Y 5800 Narrandera N 10 6,280 3,349 Y Y N N N N Y 5850 Narromine N 10 6,841 2,600 Y Y N Y N Y N 5900 Newcastle E 5 156,112 59,843 Y Y N Y Y Y Y 5950 North Sydney S 2 64,795 36,028 Y Y Y Y Y Y N 6110 Oberon N 10 5,438 1,029 Y Y N N N N Y 6150 Orange N 4 39,329 17,173 Y Y N Y N Y Y 6180 Palerang N 11 14,652 6,281 Y Y N Y N N Y 6200 Parkes N 11 15,192 7,138 Y Y N Y N Y Y 6250 Parramatta S 3 172,333 60,935 Y Y N Y Y Y N 6350 Penrith S 7 186,221 64,526 Y Y N Y Y Y Y 6370 Pittwater S 2 59,847 22,052 Y Y N Y Y Y Y 6400 Port Stephens E 4 67,825 29,418 Y Y Y Y N Y Y 6470 Queanbeyan N 4 41,430 15,909 Y Y N Y Y Y Y 6550 Randwick S 3 133,116 56,228 Y Y N Y Y Y Y 6610 Richmond Valley R 4 23,115 7,555 Y Y N Y N N Y 6650 Rockdale S 3 103,164 35,629 Y Y Y Y N Y Y 6700 Ryde S 3 106,289 38,570 Y Y N Y Y Y Y 6900 Shellharbour E 4 67,797 23,582 Y Y N Y Y Y Y 6950 Shoalhaven E 5 96,967 51,990 Y Y N Y N Y Y

NSW
Local Governm
ent Waste and R
esource Recovery D
ata Report 2010–2011 43
ABS Council name Reg
ion
DLG
Gro
up
Population ABS
(30 June 10)
Number of individual
households Data
supplied
Residual waste
service
Residual waste to
AWT
Dry recycling service
Organics service
Clean up
service Drop off facility
7000 Singleton R 4 24,182 9,332 Y Y N Y N Y Y 7050 Snowy River N 10 8,188 4,410 Y Y N Y N N Y 7100 Strathfield S 2 36,911 11,114 Y Y N Y Y Y Y 7150 Sutherland S 3 220,835 81,588 Y Y N Y Y Y Y 7210 Sydney S 1 182,226 89,502 Y Y Y Y Y Y Y 7310 Tamworth Regional N 4 59,461 21,834 Y Y N Y Y Y Y 7350 Temora N 10 6,216 2,780 Y Y N N N Y Y 7400 Tenterfield N 10 7,071 2,511 Y Y N N N N Y 7450 Tumbarumba N 9 3,765 1,886 Y Y N Y N N N 7510 Tumut N 11 11,480 4,105 Y Y N Y N N Y 7550 Tweed R 5 90,090 35,980 Y Y N Y Y Y Y 7620 Upper Hunter R 11 14,198 5,619 Y Y N Y N Y N 7640 Upper Lachlan N 10 7,559 2,650 Y Y N Y N N Y 7650 Uralla N 10 6,287 1,839 Y Y N Y N Y Y 7700 Urana Shire N 8 1,261 669 Y Y N N N Y Y 7750 Wagga Wagga N 4 63,500 24,149 Y Y N Y Y N Y 7800 Wakool N 9 4,389 1,755 Y Y N Y N N Y 7850 Walcha N 9 3,299 727 Y Y N Y N N Y 7900 Walgett N 10 7,235 3,300 Y Y N N N N Y 7950 Warren Shire N 9 2,845 1,000 Y Y N N N Y Y 8000 Warringah S 3 145,865 51,511 Y Y N Y Y Y Y 8020 Warrumbungle N 11 10,330 2,900 Y Y N Y N N Y 8050 Waverley S 2 69,420 30,883 Y Y N Y Y Y N 8100 Weddin N 9 3,780 2,416 Y Y N Y N N Y 8150 Wellington N 10 8,875 3,776 Y Y N N N N Y 8200 Wentworth N 10 7,120 2,867 Y Y N N N N Y 8250 Willoughby S 2 70,008 27,038 Y Y Y Y Y Y Y 8350 Wingecarribee E 4 46,960 20,743 Y Y Y Y N Y Y 8400 Wollondilly R 6 44,050 15,812 Y Y Y Y Y Y Y 8450 Wollongong E 5 203,487 71,655 Y Y N Y Y Y Y

44 NSW
Local Governm
ent Waste and R
esource Recovery D
ata Report 2010–2011
ABS Council name Reg
ion
DLG
Gro
up
Population ABS
(30 June 10)
Number of individual
households Data
supplied
Residual waste
service
Residual waste to
AWT
Dry recycling service
Organics service
Clean up
service Drop off facility
8500 Woollahra S 2 56,005 25,304 Y Y N Y Y Y N 8550 Wyong E 7 151,527 59,309 Y Y N Y Y Y Y 8710 Yass N 11 15,190 4,309 Y Y N Y N N Y 8750 Young N 11 13,078 5,914 Y Y N Y N Y Y Total 7,231,473 2,721,305
Total Count 152 151 21 127 64 88 134

NSW
Local Governm
ent Waste and R
esource Recovery D
ata Report 2010–2011 45
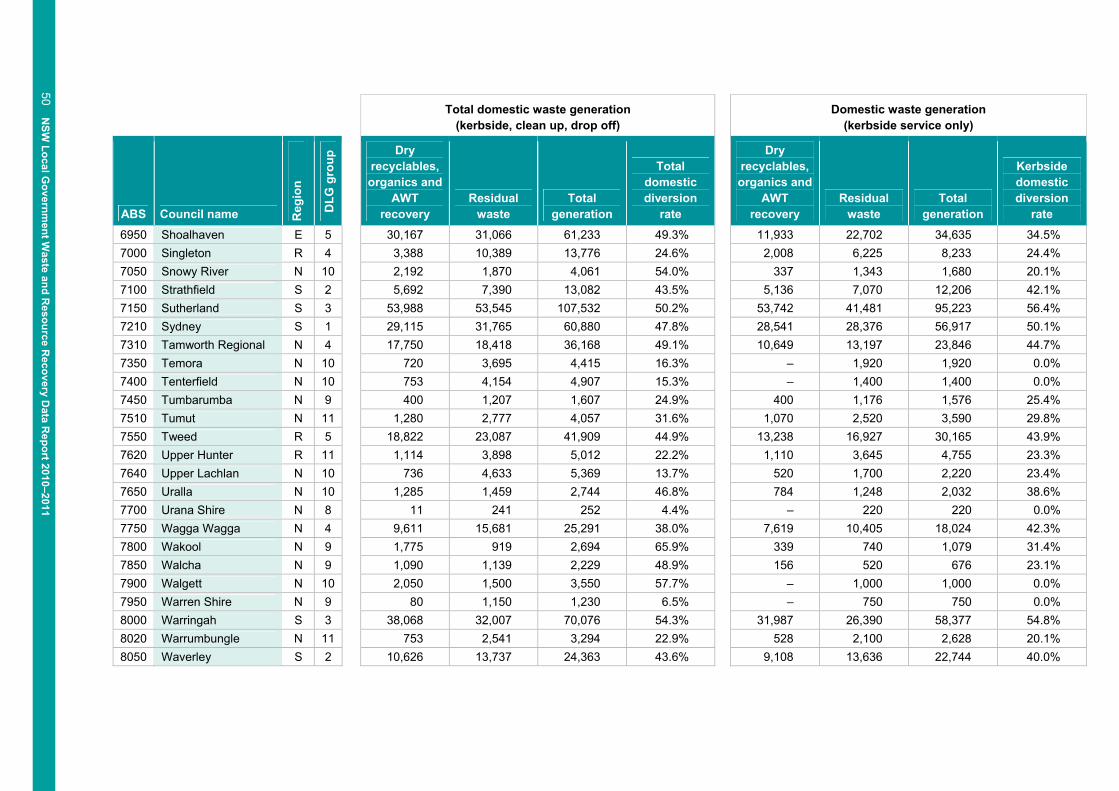
Appendix 2: Domestic Waste Generation and Diversion Rates 2010–11
Total domestic waste generation
(kerbside, clean up, drop off) Domestic waste generation (kerbside service only)
ABS Council name Reg
ion
DLG
gro
up
Dry recyclables, organics and
AWT recovery
Residual waste
Total generation
Total domestic diversion
rate
Dry recyclables, organics and
AWT recovery
Residual waste
Total generation
Kerbside domestic diversion
rate 60 Albury N 4 13,039 25,370 38,409 33.9% 8,771 11,665 20,436 42.9% 110 Armidale Dumaresq N 4 13,438 8,239 21,677 62.0% 5,879 4,728 10,606 55.4% 150 Ashfield S 2 6,011 11,239 17,250 34.8% 5,750 9,938 15,688 36.7% 200 Auburn S 2 7,450 21,225 28,675 26.0% 7,293 18,830 26,123 27.9% 250 Ballina R 4 10,751 16,470 27,221 39.5% 3,510 11,992 15,502 22.6% 300 Balranald N 9 – 356 356 0.0% – 356 356 0.0% 350 Bankstown S 3 37,439 45,158 82,596 45.3% 36,765 39,989 76,753 47.9% 470 Bathurst N 4 7,361 16,820 24,181 30.4% 3,252 9,646 12,898 25.2% 500 Baulkham Hills S 7 40,050 41,170 81,220 49.3% 37,459 37,375 74,834 50.1% 550 Bega Valley N 4 9,524 14,252 23,776 40.1% 6,886 10,216 17,102 40.3% 600 Bellingen R 11 2,742 3,046 5,787 47.4% 2,162 948 3,110 69.5% 650 Berrigan N 10 1,614 2,159 3,773 42.8% 896 1,334 2,230 40.2% 750 Blacktown S 3 74,470 52,392 126,862 58.7% 74,075 44,068 118,143 62.7% 800 Bland N 10 652 1,368 2,020 32.3% – 873 873 0.0% 850 Blayney N 10 1,589 4,748 6,337 25.1% 534 2,000 2,534 21.1% 900 Blue Mountains R 7 22,575 28,024 50,599 44.6% 8,834 22,781 31,615 27.9% 950 Bogan N 9 – 1,854 1,854 0.0% – 954 954 0.0% 1000 Bombala N 9 427 820 1,247 34.3% 216 378 594 36.4% 1050 Boorowa N 9 101 593 694 14.6% 44 500 544 8.1% 1100 Botany Bay S 2 3,563 11,278 14,841 24.0% 3,389 9,934 13,323 25.4% 1150 Bourke N 9 150 650 800 18.8% – 350 350 0.0%

46 NSW
Local Governm
ent Waste and R
esource Recovery D
ata Report 2010–2011
Total domestic waste generation
(kerbside, clean up, drop off) Domestic waste generation (kerbside service only)
ABS Council name Reg
ion
DLG
gro
up
Dry recyclables, organics and
AWT recovery
Residual waste
Total generation
Total domestic diversion
rate
Dry recyclables, organics and
AWT recovery
Residual waste
Total generation
Kerbside domestic diversion
rate 1200 Brewarrina N 9 – 400 400 0.0% – 300 300 0.0% 1250 Broken Hill N 4 5,473 10,871 16,344 33.5% 1,348 6,885 8,233 16.4% 1300 Burwood S 2 7,012 7,740 14,752 47.5% 5,011 7,028 12,039 41.6% 1350 Byron R 4 11,435 9,731 21,166 54.0% 4,954 6,651 11,605 42.7% 1400 Cabonne N 11 2,104 4,389 6,493 32.4% 557 1,579 2,137 26.1% 1450 Camden S 6 18,787 9,420 28,206 66.6% 18,476 7,795 26,271 70.3% 1500 Campbelltown S 7 43,211 25,844 69,055 62.6% 42,269 20,114 62,383 67.8% 1520 Canada Bay S 2 13,783 18,235 32,018 43.0% 13,563 15,858 29,421 46.1% 1550 Canterbury S 3 24,149 37,498 61,647 39.2% 23,780 33,028 56,808 41.9% 1600 Carrathool N 9 – 300 300 0.0% – 300 300 0.0% 1700 Central Darling N 9 103 949 1,052 9.8% – 824 824 0.0% 1720 Cessnock E 4 6,165 25,199 31,364 19.7% 4,312 14,474 18,786 23.0% 1730 Clarence Valley R 4 17,321 19,473 36,794 47.1% 9,534 11,945 21,479 44.4% 1750 Cobar N 10 – 1,440 1,440 0.0% – 1,440 1,440 0.0% 1800 Coffs Harbour R 4 27,679 14,483 42,162 65.7% 20,038 9,934 29,972 66.9% 1860 Conargo N 8 307 1,869 2,176 14.1% No Service 2000 Coolamon N 9 300 702 1,002 30.0% 300 700 1,000 30.0% 2060 Cooma–Monaro N 10 1,381 3,635 5,016 27.5% 614 1,764 2,378 25.8% 2150 Coonamble N 9 – 3,000 3,000 0.0% – 1,500 1,500 0.0% 2200 Cootamundra N 10 3,824 2,990 6,815 56.1% 500 1,677 2,177 22.9% 2310 Corowa N 11 1,315 8,692 10,007 13.1% 1,195 3,345 4,540 26.3% 2350 Cowra N 11 1,844 4,653 6,496 28.4% 1,196 4,195 5,391 22.2% 2500 Deniliquin N 4 869 4,243 5,112 17.0% – 2,623 2,623 0.0% 2600 Dubbo N 4 4,469 13,259 17,728 25.2% 3,413 10,893 14,306 23.9%

NSW
Local Governm
ent Waste and R
esource Recovery D
ata Report 2010–2011 47
Total domestic waste generation
(kerbside, clean up, drop off) Domestic waste generation (kerbside service only)
ABS Council name Reg
ion
DLG
gro
up
Dry recyclables, organics and
AWT recovery
Residual waste
Total generation
Total domestic diversion
rate
Dry recyclables, organics and
AWT recovery
Residual waste
Total generation
Kerbside domestic diversion
rate 2700 Dungog R 10 1,526 1,685 3,211 47.5% 783 1,018 1,801 43.5% 2750 Eurobodalla N 4 11,099 14,781 25,881 42.9% 7,760 6,460 14,221 54.6% 2850 Fairfield S 3 48,821 36,211 85,032 57.4% 48,181 27,952 76,133 63.3% 2900 Forbes N 10 680 3,513 4,193 16.2% 675 3,460 4,135 16.3% 2950 Gilgandra N 9 431 805 1,236 34.9% 431 621 1,052 41.0% 3020 Glen Innes Severn N 6 2,703 2,536 5,239 51.6% 701 1,850 2,551 27.5% 3050 Gloucester R 9 2,948 2,532 5,481 53.8% 1,606 1,250 2,856 56.2% 3100 Gosford E 7 50,572 53,650 104,222 48.5% 40,985 35,851 76,836 53.3% 3310 Goulburn Mulwarree N 4 8,139 5,749 13,888 58.6% 5,730 5,050 10,780 53.2% 3350 Greater Taree R 4 14,177 14,053 28,231 50.2% 9,614 9,854 19,468 49.4% 3370 Greater Hume N 11 862 2,262 3,124 27.6% 762 1,901 2,663 28.6% 3400 Great Lakes R 4 15,981 11,928 27,908 57.3% 10,650 6,846 17,496 60.9% 3450 Griffith City N 4 2,021 7,202 9,223 21.9% 1,612 6,717 8,329 19.4% 3500 Gundagai N 9 320 684 1,004 31.9% 300 610 910 33.0% 3550 Gunnedah N 11 3,876 6,332 10,208 38.0% 2,044 2,219 4,263 47.9% 3650 Guyra N 9 277 881 1,158 23.9% 277 859 1,136 24.4% 3660 Gwydir N 10 499 530 1,029 48.5% 165 330 495 33.3% 3700 Harden N 9 753 985 1,738 43.3% 210 572 782 26.9%
3750 Port Macquarie–Hastings R 4 32,641 18,088 50,730 64.3% 22,286 10,859 33,145 67.2%
3800 Hawkesbury E 6 9,405 25,632 35,037 26.8% 6,445 20,078 26,523 24.3% 3850 Hay N 9 286 3,448 3,734 7.7% – 748 748 0.0% 3950 Holroyd S 3 20,705 23,702 44,407 46.6% 18,648 19,875 38,522 48.4% 4000 Hornsby S 7 37,849 35,866 73,715 51.3% 35,975 30,974 66,949 53.7% 4100 Hunters Hill S 2 3,550 1,838 5,388 65.9% 3,530 1,497 5,027 70.2%

48 NSW
Local Governm
ent Waste and R
esource Recovery D
ata Report 2010–2011
Total domestic waste generation
(kerbside, clean up, drop off) Domestic waste generation (kerbside service only)
ABS Council name Reg
ion
DLG
gro
up
Dry recyclables, organics and
AWT recovery
Residual waste
Total generation
Total domestic diversion
rate
Dry recyclables, organics and
AWT recovery
Residual waste
Total generation
Kerbside domestic diversion
rate 4150 Hurstville S 3 15,136 20,457 35,593 42.5% 15,136 18,054 33,190 45.6% 4200 Inverell N 11 3,000 3,235 6,235 48.1% 3,000 3,000 6,000 50.0% 4250 Jerilderie N 8 18 77 95 18.9% – 60 60 0.0% 4300 Junee N 10 483 974 1,457 33.1% 464 938 1,402 33.1% 4350 Kempsey R 4 9,634 8,784 18,419 52.3% 5,179 6,730 11,909 43.5% 4400 Kiama E 4 7,321 4,365 11,686 62.7% 5,381 3,964 9,345 57.6% 4450 Kogarah S 2 12,006 12,572 24,578 48.8% 10,791 11,514 22,305 48.4% 4500 Ku–ring–gai S 3 34,537 23,684 58,221 59.3% 34,474 20,082 54,556 63.2% 4550 Kyogle R 10 1,049 4,960 6,009 17.5% – 1,301 1,301 0.0% 4600 Lachlan N 10 802 2,205 3,007 26.7% 300 2,100 2,400 12.5% 4650 Lake Macquarie E 5 24,815 71,409 96,223 25.8% 19,090 60,382 79,472 24.0% 4700 Lane Cove S 2 5,959 6,320 12,279 48.5% 5,862 5,373 11,236 52.2% 4750 Leeton N 11 719 3,528 4,247 16.9% 708 2,138 2,846 24.9% 4800 Leichhardt S 2 9,491 12,512 22,003 43.1% 9,157 10,359 19,517 46.9% 4850 Lismore R 4 14,670 8,546 23,216 63.2% 9,013 6,212 15,225 59.2% 4880 Lithgow N 4 5,124 10,618 15,742 32.6% 806 3,607 4,413 18.3% 4900 Liverpool S 7 53,887 22,569 76,455 70.5% 53,627 17,511 71,138 75.4% 4920 Liverpool Plains N 10 1,315 1,493 2,808 46.8% 438 1,210 1,648 26.6% 4950 Lockhart N 9 413 905 1,318 31.3% 159 217 377 42.2% 5050 Maitland E 4 6,523 32,916 39,439 16.5% 6,030 21,431 27,460 22.0% 5150 Manly S 2 8,772 8,326 17,098 51.3% 7,648 6,961 14,610 52.4% 5200 Marrickville S 3 13,615 16,991 30,607 44.5% 12,984 16,113 29,097 44.6% 5270 Mid–Western N 4 2,392 7,190 9,582 25.0% 2,392 4,810 7,202 33.2% 5300 Moree Plains N 11 2,940 3,744 6,685 44.0% 934 2,993 3,927 23.8%

NSW
Local Governm
ent Waste and R
esource Recovery D
ata Report 2010–2011 49
Total domestic waste generation
(kerbside, clean up, drop off) Domestic waste generation (kerbside service only)
ABS Council name Reg
ion
DLG
gro
up
Dry recyclables, organics and
AWT recovery
Residual waste
Total generation
Total domestic diversion
rate
Dry recyclables, organics and
AWT recovery
Residual waste
Total generation
Kerbside domestic diversion
rate 5350 Mosman S 2 5,547 6,560 12,107 45.8% 4,792 6,012 10,804 44.4% 5500 Murray N 10 652 2,484 3,136 20.8% 644 1,765 2,409 26.7% 5550 Murrumbidgee N 9 15 181 196 7.7% 15 80 95 15.8% 5650 Muswellbrook R 11 4,166 4,243 8,409 49.5% 2,801 2,692 5,493 51.0% 5700 Nambucca R 11 5,471 3,323 8,794 62.2% 4,592 2,256 6,848 67.1% 5750 Narrabri N 11 1,764 11,413 13,177 13.4% 1,764 7,941 9,705 18.2% 5800 Narrandera N 10 1,223 1,759 2,982 41.0% – 1,664 1,664 0.0% 5850 Narromine N 10 976 2,077 3,053 32.0% 476 1,054 1,530 31.1% 5900 Newcastle E 5 21,166 47,570 68,735 30.8% 16,499 46,278 62,777 26.3% 5950 North Sydney S 2 16,678 8,277 24,955 66.8% 16,638 5,969 22,607 73.6% 6110 Oberon N 10 160 2,710 2,870 5.6% – 1,560 1,560 0.0% 6150 Orange N 4 12,328 19,485 31,812 38.8% 2,570 15,457 18,027 14.3% 6180 Palerang N 11 1,844 10,464 12,307 15.0% 453 874 1,327 34.1% 6200 Parkes N 11 1,189 6,198 7,387 16.1% 732 3,102 3,834 19.1% 6250 Parramatta S 3 26,938 38,692 65,630 41.0% 26,938 32,271 59,209 45.5% 6350 Penrith S 7 52,217 34,106 86,323 60.5% 51,922 27,115 79,037 65.7% 6370 Pittwater S 2 20,174 15,751 35,925 56.2% 11,593 10,893 22,486 51.6% 6400 Port Stephens E 4 18,370 13,807 32,178 57.1% 17,014 13,354 30,368 56.0% 6470 Queanbeyan N 4 9,255 10,396 19,651 47.1% 5,539 7,894 13,433 41.2% 6550 Randwick S 3 19,710 31,844 51,553 38.2% 19,181 25,345 44,526 43.1% 6610 Richmond Valley R 4 4,420 8,745 13,166 33.6% 1,516 4,428 5,944 25.5% 6650 Rockdale S 3 11,816 33,455 45,271 26.1% 11,026 27,898 38,924 28.3% 6700 Ryde S 3 21,464 24,357 45,821 46.8% 19,947 21,093 41,040 48.6% 6900 Shellharbour E 4 21,111 19,237 40,348 52.3% 15,253 12,584 27,836 54.8%
50 NSW
Local Governm
ent Waste and R
esource Recovery D
ata Report 2010–2011
Total domestic waste generation
(kerbside, clean up, drop off) Domestic waste generation (kerbside service only)
ABS Council name Reg
ion
DLG
gro
up
Dry recyclables, organics and
AWT recovery
Residual waste
Total generation
Total domestic diversion
rate
Dry recyclables, organics and
AWT recovery
Residual waste
Total generation
Kerbside domestic diversion
rate 6950 Shoalhaven E 5 30,167 31,066 61,233 49.3% 11,933 22,702 34,635 34.5% 7000 Singleton R 4 3,388 10,389 13,776 24.6% 2,008 6,225 8,233 24.4% 7050 Snowy River N 10 2,192 1,870 4,061 54.0% 337 1,343 1,680 20.1% 7100 Strathfield S 2 5,692 7,390 13,082 43.5% 5,136 7,070 12,206 42.1% 7150 Sutherland S 3 53,988 53,545 107,532 50.2% 53,742 41,481 95,223 56.4% 7210 Sydney S 1 29,115 31,765 60,880 47.8% 28,541 28,376 56,917 50.1% 7310 Tamworth Regional N 4 17,750 18,418 36,168 49.1% 10,649 13,197 23,846 44.7% 7350 Temora N 10 720 3,695 4,415 16.3% – 1,920 1,920 0.0% 7400 Tenterfield N 10 753 4,154 4,907 15.3% – 1,400 1,400 0.0% 7450 Tumbarumba N 9 400 1,207 1,607 24.9% 400 1,176 1,576 25.4% 7510 Tumut N 11 1,280 2,777 4,057 31.6% 1,070 2,520 3,590 29.8% 7550 Tweed R 5 18,822 23,087 41,909 44.9% 13,238 16,927 30,165 43.9% 7620 Upper Hunter R 11 1,114 3,898 5,012 22.2% 1,110 3,645 4,755 23.3% 7640 Upper Lachlan N 10 736 4,633 5,369 13.7% 520 1,700 2,220 23.4% 7650 Uralla N 10 1,285 1,459 2,744 46.8% 784 1,248 2,032 38.6% 7700 Urana Shire N 8 11 241 252 4.4% – 220 220 0.0% 7750 Wagga Wagga N 4 9,611 15,681 25,291 38.0% 7,619 10,405 18,024 42.3% 7800 Wakool N 9 1,775 919 2,694 65.9% 339 740 1,079 31.4% 7850 Walcha N 9 1,090 1,139 2,229 48.9% 156 520 676 23.1% 7900 Walgett N 10 2,050 1,500 3,550 57.7% – 1,000 1,000 0.0% 7950 Warren Shire N 9 80 1,150 1,230 6.5% – 750 750 0.0% 8000 Warringah S 3 38,068 32,007 70,076 54.3% 31,987 26,390 58,377 54.8% 8020 Warrumbungle N 11 753 2,541 3,294 22.9% 528 2,100 2,628 20.1% 8050 Waverley S 2 10,626 13,737 24,363 43.6% 9,108 13,636 22,744 40.0%

NSW
Local Governm
ent Waste and R
esource Recovery D
ata Report 2010–2011 51
Total domestic waste generation
(kerbside, clean up, drop off) Domestic waste generation (kerbside service only)
ABS Council name Reg
ion
DLG
gro
up
Dry recyclables, organics and
AWT recovery
Residual waste
Total generation
Total domestic diversion
rate
Dry recyclables, organics and
AWT recovery
Residual waste
Total generation
Kerbside domestic diversion
rate 8100 Weddin N 9 193 574 767 25.2% 167 540 707 23.6% 8150 Wellington N 10 22 4,320 4,342 0.5% – 4,320 4,320 0.0% 8200 Wentworth N 10 – 2,609 2,609 0.0% – 2,609 2,609 0.0% 8250 Willoughby S 2 19,996 11,445 31,441 63.6% 19,783 9,852 29,635 66.8% 8350 Wingecarribee E 4 17,017 4,976 21,994 77.4% 9,523 3,674 13,197 72.2% 8400 Wollondilly R 6 12,979 9,589 22,568 57.5% 10,310 5,691 16,001 64.4% 8450 Wollongong E 5 49,693 47,265 96,959 51.3% 44,113 37,363 81,476 54.1% 8500 Woollahra S 2 13,710 12,595 26,305 52.1% 12,679 11,409 24,088 52.6% 8550 Wyong E 7 47,683 45,851 93,535 51.0% 37,742 32,206 69,948 54.0% 8710 Yass N 11 1,050 7,109 8,159 12.9% 940 3,990 4,930 19.1% 8750 Young N 11 5,962 4,787 10,749 55.5% 1,538 1,746 3,284 46.8%
Total NSW 1,627,639 1,876,039 3,503,679 46.5% 1,327,621 1,427,890 2,755,511 48.2%
SMA 885,988 857,773 1,743,761 50.8% 846,854 725,033 1,571,887 53.9%
ERA 310,008 422,944 732,953 42.3% 234,318 324,341 558,660 41.9%
RRA 235,490 225,077 460,566 51.1% 143,739 150,185 293,924 48.9%
Rest of the State 196,153 370,246 566,399 34.6% 102,710 228,331 331,041 31.0%
52 NSW
Local Governm
ent Waste and R
esource Recovery D
ata Report 2010–2011
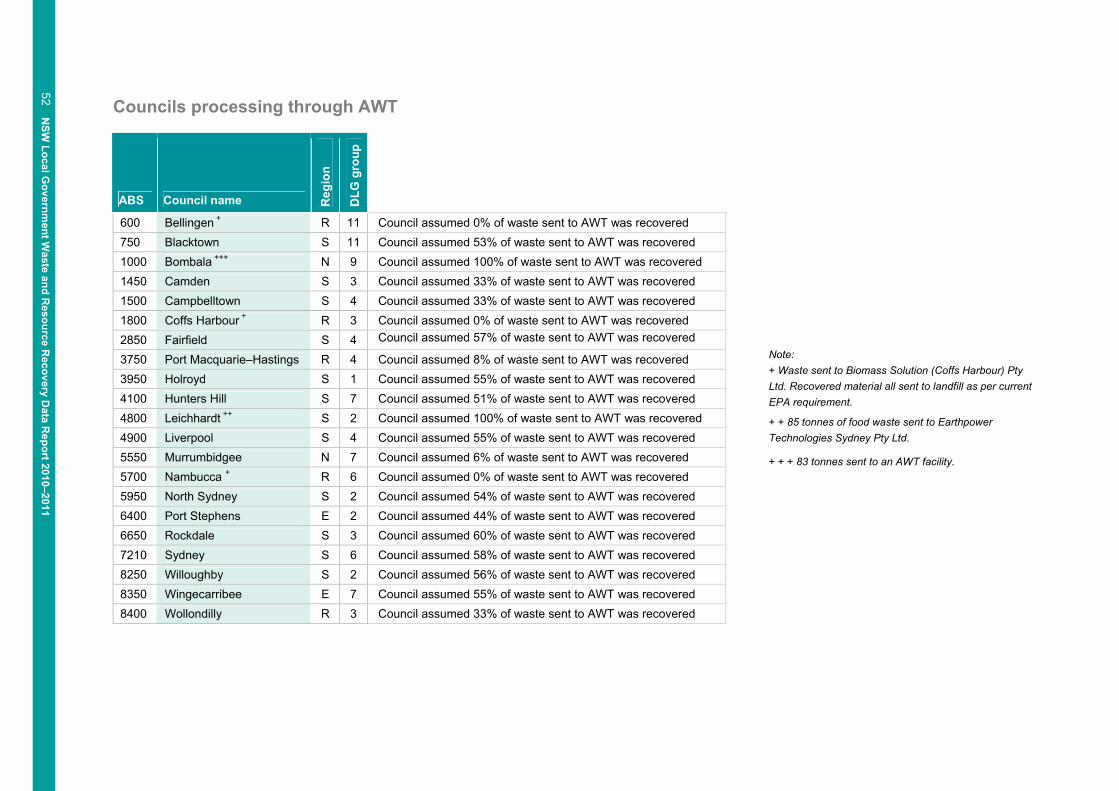
Councils processing through AWT
ABS Council name Reg
ion
DLG
gro
up
600 Bellingen + R 11 Council assumed 0% of waste sent to AWT was recovered 750 Blacktown S 11 Council assumed 53% of waste sent to AWT was recovered 1000 Bombala +++ N 9 Council assumed 100% of waste sent to AWT was recovered 1450 Camden S 3 Council assumed 33% of waste sent to AWT was recovered 1500 Campbelltown S 4 Council assumed 33% of waste sent to AWT was recovered 1800 Coffs Harbour + R 3 Council assumed 0% of waste sent to AWT was recovered 2850 Fairfield S 4 Council assumed 57% of waste sent to AWT was recovered
3750 Port Macquarie–Hastings R 4 Council assumed 8% of waste sent to AWT was recovered 3950 Holroyd S 1 Council assumed 55% of waste sent to AWT was recovered 4100 Hunters Hill S 7 Council assumed 51% of waste sent to AWT was recovered 4800 Leichhardt ++ S 2 Council assumed 100% of waste sent to AWT was recovered 4900 Liverpool S 4 Council assumed 55% of waste sent to AWT was recovered 5550 Murrumbidgee N 7 Council assumed 6% of waste sent to AWT was recovered 5700 Nambucca + R 6 Council assumed 0% of waste sent to AWT was recovered 5950 North Sydney S 2 Council assumed 54% of waste sent to AWT was recovered 6400 Port Stephens E 2 Council assumed 44% of waste sent to AWT was recovered 6650 Rockdale S 3 Council assumed 60% of waste sent to AWT was recovered 7210 Sydney S 6 Council assumed 58% of waste sent to AWT was recovered 8250 Willoughby S 2 Council assumed 56% of waste sent to AWT was recovered 8350 Wingecarribee E 7 Council assumed 55% of waste sent to AWT was recovered 8400 Wollondilly R 3 Council assumed 33% of waste sent to AWT was recovered
Note: + Waste sent to Biomass Solution (Coffs Harbour) Pty Ltd. Recovered material all sent to landfill as per current EPA requirement.
+ + 85 tonnes of food waste sent to Earthpower Technologies Sydney Pty Ltd.
+ + + 83 tonnes sent to an AWT facility.

NSW
Local Governm
ent Waste and R
esource Recovery D
ata Report 2010–2011 53
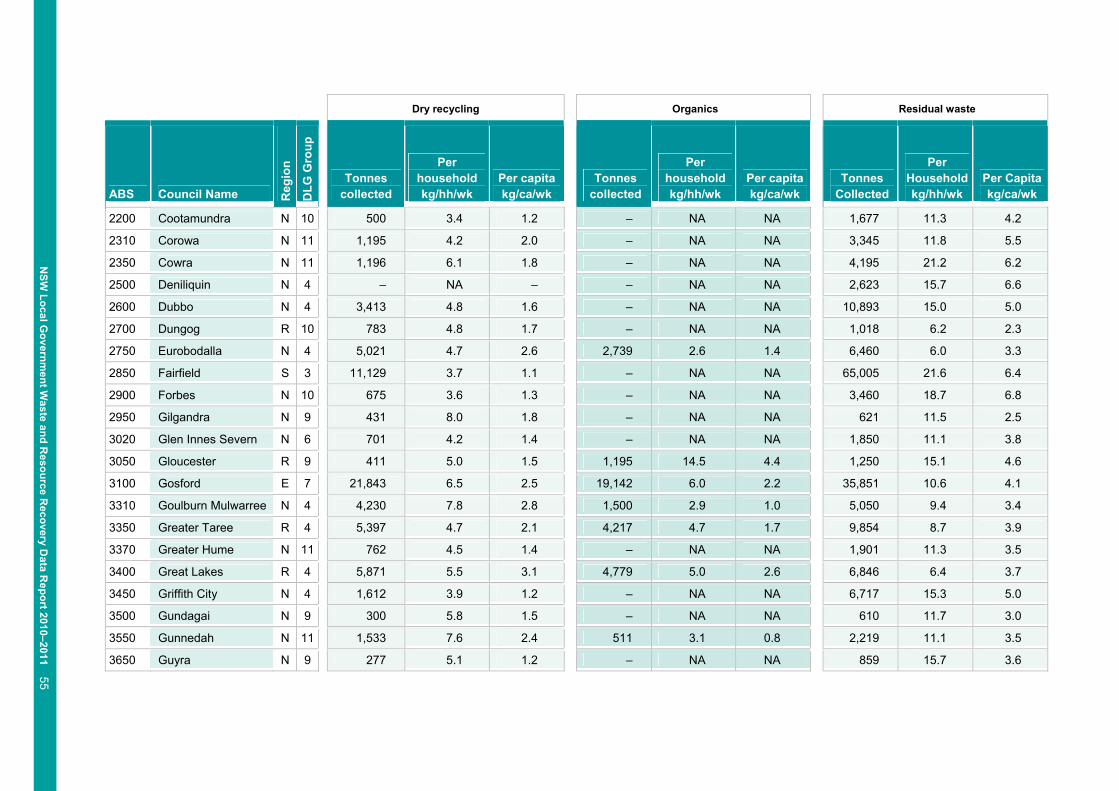
Appendix 3:Weekly kerbside household and per capita waste generations 2010–11
Dry recycling Organics Residual waste
ABS Council Name Reg
ion
DLG
Gro
up
Tonnes
collected
Per householdkg/hh/wk
Per capitakg/ca/wk
Tonnes collected
Per householdkg/hh/wk
Per capitakg/ca/wk
Tonnes Collected
Per Householdkg/hh/wk
Per Capita kg/ca/wk
60 Albury N 4 4,902 4.5 1.8 3,870 9.1 1.5 11,665 10.7 4.4
110 Armidale Dumaresq N 4 3,735 7.8 2.8 2,144 4.5 1.6 4,728 9.9 3.5
150 Ashfield S 2 4,130 5.3 1.9 1,620 7.2 0.7 9,938 12.7 4.5
200 Auburn S 2 3,635 3.0 0.9 3,658 5.8 0.9 18,830 15.6 4.6
250 Ballina R 4 3,510 4.4 1.6 – NA NA 11,992 15.1 5.4
300 Balranald N 9 – NA – – NA NA 356 24.9 2.8
350 Bankstown S 3 16,478 5.1 1.7 20,287 6.2 2.1 39,989 12.3 4.1
470 Bathurst N 4 3,252 4.6 1.6 – NA NA 9,646 13.6 4.6
500 Baulkham Hills S 7 18,318 6.6 2.0 19,141 7.8 2.0 37,375 12.6 4.0
550 Bega Valley N 4 4,012 6.2 2.3 2,874 5.3 1.6 10,216 13.8 5.8
600 Bellingen R 11 962 4.8 1.4 1,199 5.9 1.7 948 4.7 1.4
650 Berrigan N 10 896 6.2 2.0 – NA NA 1,334 9.1 3.0
750 Blacktown S 3 25,045 4.8 1.6 – NA NA 93,098 17.7 5.8
800 Bland N 10 – NA – – NA NA 873 9.4 2.6
850 Blayney N 10 534 4.2 1.4 – NA NA 2,000 15.8 5.3
900 Blue Mountains R 7 8,834 5.3 2.2 – NA NA 22,781 13.6 5.6
950 Bogan N 9 – NA – – NA NA 954 17.2 6.1
1000 Bombala N 9 134 3.2 1.0 – NA NA 461 10.5 3.4
1050 Boorowa N 9 44 1.5 0.3 – NA NA 500 16.9 3.9

54 NSW
Local Governm
ent Waste and R
esource Recovery D
ata Report 2010–2011
Dry recycling Organics Residual waste
ABS Council Name Reg
ion
DLG
Gro
up
Tonnes collected
Per householdkg/hh/wk
Per capitakg/ca/wk
Tonnes collected
Per householdkg/hh/wk
Per capitakg/ca/wk
Tonnes Collected
Per Householdkg/hh/wk
Per Capita kg/ca/wk
1100 Botany Bay S 2 2,600 3.6 1.2 789 2.3 0.4 9,934 13.8 4.7
1150 Bourke N 9 – NA – – NA NA 350 8.7 2.2
1200 Brewarrina N 9 – NA – – NA NA 300 19.2 3.0
1250 Broken Hill N 4 – NA – 1,348 3.1 1.3 6,885 14.4 6.7
1300 Burwood S 2 2,696 4.8 1.5 2,315 4.1 1.3 7,028 12.4 4.0
1350 Byron R 4 4,954 7.8 2.9 – NA NA 6,651 10.1 4.0
1400 Cabonne N 11 557 4.2 0.8 – NA NA 1,579 12.0 2.3
1450 Camden S 6 7,465 8.1 2.5 7,171 9.4 2.4 11,635 12.7 3.9
1500 Campbelltown S 7 14,935 5.7 1.9 17,284 6.6 2.2 30,164 11.6 3.8
1520 Canada Bay S 2 8,657 5.1 2.1 4,906 2.9 1.2 15,858 9.3 3.9
1550 Canterbury S 3 13,283 5.0 1.8 10,497 7.0 1.4 33,028 12.5 4.4
1600 Carrathool N 9 – NA – – NA NA 300 6.0 2.0
1700 Central Darling N 9 – NA – – NA NA 824 16.4 7.9
1720 Cessnock E 4 4,312 4.3 1.6 – NA NA 14,474 14.5 5.4
1730 Clarence Valley R 4 4,164 3.8 1.5 5,370 5.9 2.0 11,945 10.9 4.4
1750 Cobar N 10 – NA – – NA NA 1,440 13.9 5.3
1800 Coffs Harbour R 4 8,619 6.0 2.3 11,420 8.9 3.0 9,934 6.9 2.6
1860 Conargo N 8 – NA – – NA NA NS – –
2000 Coolamon N 9 300 4.5 1.4 – NA NA 700 10.5 3.2
2060 Cooma–Monaro N 10 614 4.3 1.1 – NA NA 1,764 12.5 3.2
2150 Coonamble N 9 – NA – – NA NA 1,500 20.1 6.7
NSW
Local Governm
ent Waste and R
esource Recovery D
ata Report 2010–2011 55
Dry recycling Organics Residual waste
ABS Council Name Reg
ion
DLG
Gro
up
Tonnes
collected
Per householdkg/hh/wk
Per capitakg/ca/wk
Tonnes collected
Per householdkg/hh/wk
Per capitakg/ca/wk
Tonnes Collected
Per Householdkg/hh/wk
Per Capita kg/ca/wk
2200 Cootamundra N 10 500 3.4 1.2 – NA NA 1,677 11.3 4.2
2310 Corowa N 11 1,195 4.2 2.0 – NA NA 3,345 11.8 5.5
2350 Cowra N 11 1,196 6.1 1.8 – NA NA 4,195 21.2 6.2
2500 Deniliquin N 4 – NA – – NA NA 2,623 15.7 6.6
2600 Dubbo N 4 3,413 4.8 1.6 – NA NA 10,893 15.0 5.0
2700 Dungog R 10 783 4.8 1.7 – NA NA 1,018 6.2 2.3
2750 Eurobodalla N 4 5,021 4.7 2.6 2,739 2.6 1.4 6,460 6.0 3.3
2850 Fairfield S 3 11,129 3.7 1.1 – NA NA 65,005 21.6 6.4
2900 Forbes N 10 675 3.6 1.3 – NA NA 3,460 18.7 6.8
2950 Gilgandra N 9 431 8.0 1.8 – NA NA 621 11.5 2.5
3020 Glen Innes Severn N 6 701 4.2 1.4 – NA NA 1,850 11.1 3.8
3050 Gloucester R 9 411 5.0 1.5 1,195 14.5 4.4 1,250 15.1 4.6
3100 Gosford E 7 21,843 6.5 2.5 19,142 6.0 2.2 35,851 10.6 4.1
3310 Goulburn Mulwarree N 4 4,230 7.8 2.8 1,500 2.9 1.0 5,050 9.4 3.4
3350 Greater Taree R 4 5,397 4.7 2.1 4,217 4.7 1.7 9,854 8.7 3.9
3370 Greater Hume N 11 762 4.5 1.4 – NA NA 1,901 11.3 3.5
3400 Great Lakes R 4 5,871 5.5 3.1 4,779 5.0 2.6 6,846 6.4 3.7
3450 Griffith City N 4 1,612 3.9 1.2 – NA NA 6,717 15.3 5.0
3500 Gundagai N 9 300 5.8 1.5 – NA NA 610 11.7 3.0
3550 Gunnedah N 11 1,533 7.6 2.4 511 3.1 0.8 2,219 11.1 3.5
3650 Guyra N 9 277 5.1 1.2 – NA NA 859 15.7 3.6

56 NSW
Local Governm
ent Waste and R
esource Recovery D
ata Report 2010–2011
Dry recycling Organics Residual waste
ABS Council Name Reg
ion
DLG
Gro
up
Tonnes collected
Per householdkg/hh/wk
Per capitakg/ca/wk
Tonnes collected
Per householdkg/hh/wk
Per capitakg/ca/wk
Tonnes Collected
Per Householdkg/hh/wk
Per Capita kg/ca/wk
3660 Gwydir N 10 165 2.4 0.6 – NA NA 330 4.8 1.2
3700 Harden N 9 210 4.2 1.1 – NA NA 572 11.5 3.0
3750 Port Macquarie–Hastings R 4 9,644 6.4 2.4 11,680 8.1 2.9 11,820 7.9 3.0
3800 Hawkesbury E 6 6,445 5.8 1.9 – NA NA 20,078 17.9 6.0
3850 Hay N 9 – NA – – NA NA 748 11.8 4.3
3950 Holroyd S 3 7,973 4.6 1.5 – NA NA 30,550 17.6 5.7
4000 Hornsby S 7 17,352 6.1 2.0 18,623 6.9 2.2 30,974 10.9 3.6
4100 Hunters Hill S 2 1,431 5.7 1.9 551 3.4 0.7 3,045 12.1 4.0
4150 Hurstville S 3 8,171 5.2 1.9 6,965 6.1 1.7 18,054 11.5 4.3
4200 Inverell N 11 3,000 10.8 3.4 – NA NA 3,000 10.8 3.4
4250 Jerilderie N 8 – NA – – NA NA 60 3.4 0.7
4300 Junee N 10 464 4.9 1.4 – NA NA 938 9.9 2.9
4350 Kempsey R 4 2,897 5.0 1.9 2,282 6.3 1.5 6,730 11.5 4.4
4400 Kiama E 4 2,483 5.5 2.3 2,898 6.7 2.7 3,964 8.8 3.6
4450 Kogarah S 2 5,889 5.4 1.9 4,902 4.5 1.6 11,514 10.7 3.7
4500 Ku–ring–gai S 3 15,470 7.5 2.6 19,004 11.5 3.2 20,082 9.7 3.4
4550 Kyogle R 10 – NA – – NA NA 1,301 12.9 2.5
4600 Lachlan N 10 – NA – 300 4.8 0.8 2,100 18.6 5.9
4650 Lake Macquarie E 5 19,090 5.2 1.8 – NA NA 60,382 16.4 5.8
4700 Lane Cove S 2 3,924 6.0 2.3 1,938 3.0 1.1 5,373 8.2 3.1
4750 Leeton N 11 708 3.9 1.1 – NA NA 2,138 11.7 3.4

NSW
Local Governm
ent Waste and R
esource Recovery D
ata Report 2010–2011 57
Dry recycling Organics Residual waste
ABS Council Name Reg
ion
DLG
Gro
up
Tonnes
collected
Per householdkg/hh/wk
Per capitakg/ca/wk
Tonnes collected
Per householdkg/hh/wk
Per capitakg/ca/wk
Tonnes Collected
Per Householdkg/hh/wk
Per Capita kg/ca/wk
4800 Leichhardt S 2 7,562 5.9 2.6 1,510 1.2 0.5 10,444 8.2 3.6
4850 Lismore R 4 4,161 5.5 1.7 4,852 8.3 2.0 6,212 8.2 2.6
4880 Lithgow N 4 806 1.5 0.7 – NA NA 3,607 6.9 3.3
4900 Liverpool S 7 16,387 5.8 1.7 15,837 6.1 1.6 38,914 13.9 4.0
4920 Liverpool Plains N 10 438 3.2 1.1 – NA NA 1,210 8.9 2.9
4950 Lockhart N 9 159 3.4 0.9 – NA NA 217 4.6 1.3
5050 Maitland E 4 6,030 4.7 1.6 – NA NA 21,431 16.8 5.9
5150 Manly S 2 5,320 5.7 2.4 2,329 2.5 1.1 6,961 7.4 3.2
5200 Marrickville S 3 8,978 5.6 2.2 4,006 3.5 1.0 16,113 10.1 3.9
5270 Mid–Western N 4 2,392 6.4 2.0 – NA NA 4,810 12.9 4.0
5300 Moree Plains N 11 934 3.7 1.2 – NA NA 2,993 12.0 4.0
5350 Mosman S 2 3,784 5.6 2.5 1,008 1.5 0.7 6,012 8.9 4.0
5500 Murray N 10 644 4.6 1.7 – NA NA 1,765 12.7 4.6
5550 Murrumbidgee N 9 10 0.3 0.1 – NA NA 85 2.2 0.6
5650 Muswellbrook R 11 1,338 5.0 1.5 1,463 6.0 1.7 2,692 10.0 3.1
5700 Nambucca R 11 1,898 5.5 1.9 2,694 8.4 2.7 2,256 6.6 2.2
5750 Narrabri N 11 1,764 9.0 2.5 – NA NA 7,941 40.4 11.1
5800 Narrandera N 10 – NA – – NA NA 1,664 15.3 5.1
5850 Narromine N 10 476 4.6 1.3 – NA NA 1,054 10.1 3.0
5900 Newcastle E 5 14,194 4.6 1.7 2,305 0.7 0.3 46,278 14.9 5.7
5950 North Sydney S 2 8,108 4.3 2.4 1,389 0.7 0.4 13,110 7.0 3.9

58 NSW
Local Governm
ent Waste and R
esource Recovery D
ata Report 2010–2011
Dry recycling Organics Residual waste
ABS Council Name Reg
ion
DLG
Gro
up
Tonnes collected
Per householdkg/hh/wk
Per capitakg/ca/wk
Tonnes collected
Per householdkg/hh/wk
Per capitakg/ca/wk
Tonnes Collected
Per Householdkg/hh/wk
Per Capita kg/ca/wk
6110 Oberon N 10 – NA – – NA NA 1,560 28.5 5.5
6150 Orange N 4 2,570 3.5 1.3 – NA NA 15,457 20.9 7.6
6180 Palerang N 11 453 4.9 0.6 – NA NA 874 9.4 1.1
6200 Parkes N 11 732 2.9 0.9 – NA NA 3,102 12.1 3.9
6250 Parramatta S 3 13,798 5.1 1.5 13,140 6.8 1.5 32,271 10.5 3.6
6350 Penrith S 7 20,273 6.0 2.1 31,649 12.2 3.3 27,115 8.1 2.8
6370 Pittwater S 2 8,784 7.9 2.8 2,809 2.5 0.9 10,893 9.8 3.5
6400 Port Stephens E 4 6,647 4.3 1.9 – NA NA 23,721 15.5 6.7
6470 Queanbeyan N 4 3,477 4.4 1.6 2,062 4.0 1.0 7,894 9.9 3.7
6550 Randwick S 3 13,163 4.5 1.9 6,018 5.4 0.9 25,345 8.7 3.7
6610 Richmond Valley R 4 1,516 4.1 1.3 – NA NA 4,428 11.9 3.7
6650 Rockdale S 3 9,240 5.0 1.7 – NA NA 29,684 16.0 5.5
6700 Ryde S 3 10,714 5.3 1.9 9,233 4.6 1.7 21,093 10.5 3.8
6900 Shellharbour E 4 7,086 5.8 2.0 8,166 6.7 2.3 12,584 10.3 3.6
6950 Shoalhaven E 5 11,933 5.1 2.4 – NA NA 22,702 9.7 4.5
7000 Singleton R 4 2,008 4.7 1.6 – NA NA 6,225 14.5 5.0
7050 Snowy River N 10 337 2.0 0.8 – NA NA 1,343 7.8 3.2
7100 Strathfield S 2 2,960 5.1 1.5 2,176 7.4 1.1 7,070 12.2 3.7
7150 Sutherland S 3 28,037 6.6 2.4 25,705 6.1 2.2 41,481 9.8 3.6
7210 Sydney S 1 15,963 3.4 1.7 744 2.9 0.1 40,210 8.6 4.2
7310 Tamworth Regional N 4 5,171 4.5 1.7 5,478 6.5 1.8 13,197 11.6 4.3

NSW
Local Governm
ent Waste and R
esource Recovery D
ata Report 2010–2011 59
Dry recycling Organics Residual waste
ABS Council Name Reg
ion
DLG
Gro
up
Tonnes
collected
Per householdkg/hh/wk
Per capitakg/ca/wk
Tonnes collected
Per householdkg/hh/wk
Per capitakg/ca/wk
Tonnes Collected
Per Householdkg/hh/wk
Per Capita kg/ca/wk
7350 Temora N 10 – NA – – NA NA 1,920 17.1 5.9
7400 Tenterfield N 10 – NA – – NA NA 1,400 16.0 3.8
7450 Tumbarumba N 9 400 7.3 2.0 – NA NA 1,176 21.4 6.0
7510 Tumut N 11 1,070 5.3 1.8 – NA NA 2,520 12.3 4.2
7550 Tweed R 5 8,308 4.7 1.8 4,930 7.5 1.1 16,927 9.8 3.6
7620 Upper Hunter R 11 1,110 4.5 1.5 – NA NA 3,645 14.9 4.9
7640 Upper Lachlan N 10 520 5.1 1.3 – NA NA 1,700 16.6 4.3
7650 Uralla N 10 784 8.9 2.4 – NA NA 1,248 14.0 3.8
7700 Urana Shire N 8 – NA – – NA NA 220 6.3 3.4
7750 Wagga Wagga N 4 6,030 5.3 1.8 1,589 1.4 0.5 10,405 9.1 3.2
7800 Wakool N 9 339 5.2 1.5 – NA NA 740 11.4 3.2
7850 Walcha N 9 156 4.1 0.9 – NA NA 520 13.8 3.0
7900 Walgett N 10 – NA – – NA NA 1,000 13.7 2.7
7950 Warren Shire N 9 – NA – – NA NA 750 14.4 5.1
8000 Warringah S 3 17,816 6.7 2.3 14,171 5.3 1.9 26,390 9.9 3.5
8020 Warrumbungle N 11 528 1.8 1.0 – NA NA 2,100 7.0 3.9
8050 Waverley S 2 7,089 4.4 2.0 2,019 1.3 0.6 13,636 8.5 3.8
8100 Weddin N 9 167 2.9 0.8 – NA NA 540 9.4 2.7
8150 Wellington N 10 – NA – – NA NA 4,320 29.3 9.4
8200 Wentworth N 10 – NA – – NA NA 2,609 17.5 7.0
8250 Willoughby S 2 8,301 5.9 2.3 6,219 9.1 1.7 15,115 10.8 4.2

60 NSW
Local Governm
ent Waste and R
esource Recovery D
ata Report 2010–2011
Dry recycling Organics Residual waste
ABS Council Name Reg
ion
DLG
Gro
up
Tonnes collected
Per householdkg/hh/wk
Per capitakg/ca/wk
Tonnes collected
Per householdkg/hh/wk
Per capitakg/ca/wk
Tonnes Collected
Per Householdkg/hh/wk
Per Capita kg/ca/wk
8350 Wingecarribee E 4 5,033 5.8 2.1 – NA NA 8,164 9.5 3.3
8400 Wollondilly R 6 3,557 4.6 1.6 3,907 8.2 1.7 8,537 11.1 3.7
8450 Wollongong E 5 20,147 5.4 1.9 23,966 6.4 2.3 37,363 10.0 3.5
8500 Woollahra S 2 8,825 6.7 3.0 3,854 2.9 1.3 11,409 8.7 3.9
8550 Wyong E 7 17,642 5.9 2.2 20,100 6.9 2.6 32,206 10.8 4.1
8710 Yass N 11 940 4.2 1.2 – NA NA 3,990 17.8 5.1
8750 Young N 11 1,538 7.4 2.3 – NA NA 1,746 8.4 2.6
Total 704,716 444,448 1,606,347
NSW Average 5.3 1.9 5.6 1.7 11.8 4.3
Region
SMA 403,681 5.4 1.9 283,466 5.7 1.6 884,739 11.7 4.2
ERA 142,884 5.4 2.0 76,578 5.2 1.9 339,198 12.7 4.8
RRA 79,943 5.2 2.0 59,989 7.1 2.1 153,992 10.0 3.8
Rest of the State 78,208 4.9 1.7 24,415 3.9 1.2 228,419 12.5 4.4
Note: NA = Not applicable NS = No service

NSW
Local Governm
ent Waste and R
esource Recovery D
ata Report 2010–2011 61
Appendix 4: Predominant bin size and collection frequency 2010–11
Dry Recycling Organics Residual Waste
ABS Council Name Reg
ion
DLG
Gro
up
Predominant BIN size Frequency
Predominant BIN size Frequency
Predominant BIN size Frequency
60 Albury N 4 240L Fortnightly 240L Fortnightly 140L Weekly 110 Armidale Dumaresq N 4 Crate Weekly 240L Fortnightly 140L Weekly 150 Ashfield S 2 240L Fortnightly 240L Fortnightly 120L Weekly 200 Auburn S 2 240L Fortnightly 240L Fortnightly 120L Weekly 250 Ballina R 4 240L Fortnightly No Service 240L Weekly 300 Balranald N 9 No Service No Service 240L Weekly 350 Bankstown S 3 240L Fortnightly 240L Fortnightly 120L Weekly 470 Bathurst N 4 240L Fortnightly No Service 240L Weekly 500 Baulkham Hills S 7 240L Fortnightly 240L Fortnightly 140L Weekly 550 Bega Valley N 4 240L Fortnightly 240L Monthly 140L Weekly 600 Bellingen R 11 240L Fortnightly 240L Weekly 240L Fortnightly 650 Berrigan N 10 240L Fortnightly No Service 120L Weekly 750 Blacktown S 3 240L Fortnightly No Service 240L Weekly 800 Bland N 10 No Service No Service 240L Weekly 850 Blayney N 10 240L Fortnightly No Service 240L Weekly 900 Blue Mountains R 7 140L Weekly No Service 240L Weekly 950 Bogan N 9 No Service No Service 240L Weekly 1000 Bombala N 9 Crate Weekly No Service 140L Weekly 1050 Boorowa N 9 240L Fortnightly No Service 140L Weekly 1100 Botany Bay S 2 Crate Weekly Others Weekly 240L Weekly 1150 Bourke N 9 No Service No Service 240L Weekly 1200 Brewarrina N 9 No Service No Service 240L Weekly 1250 Broken Hill N 4 No Service 240L Fortnightly 240L Weekly 1300 Burwood S 2 240L Fortnightly 240L Fortnightly 120L Weekly

62 NSW
Local Governm
ent Waste and R
esource Recovery D
ata Report 2010–2011
Dry Recycling Organics Residual Waste
ABS Council Name Reg
ion
DLG
Gro
up
Predominant BIN size Frequency
Predominant BIN size Frequency
Predominant BIN size Frequency
1350 Byron R 4 240L Fortnightly No Service 140L Weekly 1400 Cabonne N 11 240L Fortnightly No Service 240L Weekly 1450 Camden S 6 240L Weekly 240L Weekly 120L Weekly 1500 Campbelltown S 7 240L Fortnightly 240L Fortnightly 140L Weekly 1520 Canada Bay S 2 240L Fortnightly 240L Fortnightly 120L Weekly 1550 Canterbury S 3 240L Fortnightly 240L Fortnightly 140L Weekly 1600 Carrathool N 9 No Service No Service 240L Weekly 1700 Central Darling N 9 No Service No Service 120L Weekly 1720 Cessnock E 4 240L Split (P/C) Fortnightly No Service 240L Weekly 1730 Clarence Valley R 4 240L Split (P/C) Fortnightly 240L Fortnightly 240L Weekly 1750 Cobar N 10 No Service No Service 240L Weekly 1800 Coffs Harbour R 4 240L Fortnightly 240L Weekly 240L Fortnightly 1860 Conargo N 8 No Service No Service No Service 2000 Coolamon N 9 240L Fortnightly No Service 140L Weekly 2060 Cooma–Monaro N 10 140L Fortnightly No Service 240L Weekly 2150 Coonamble N 9 No Service No Service 240L Weekly 2200 Cootamundra N 10 240L Fortnightly No Service 140L Weekly 2310 Corowa N 11 240L Fortnightly No Service 240L Weekly 2350 Cowra N 11 240L Fortnightly No Service 240L Weekly 2500 Deniliquin N 4 No Service No Service 240L Weekly 2600 Dubbo N 4 240L Fortnightly No Service 240L Weekly 2700 Dungog R 10 240L Fortnightly No Service 240L Weekly 2750 Eurobodalla N 4 240L Fortnightly Others Monthly 80L Weekly 2850 Fairfield S 3 240L Fortnightly No Service 240L Weekly 2900 Forbes N 10 240L Fortnightly No Service 240L Weekly 2950 Gilgandra N 9 240L Fortnightly No Service 240L Weekly

NSW
Local Governm
ent Waste and R
esource Recovery D
ata Report 2010–2011 63
Dry Recycling Organics Residual Waste
ABS Council Name Reg
ion
DLG
Gro
up
Predominant BIN size Frequency
Predominant BIN size Frequency
Predominant BIN size Frequency
3020 Glen Innes Severn N 6 240L Fortnightly No Service 140L Weekly 3050 Gloucester R 9 240L Weekly 240L Fortnightly 240L Weekly 3100 Gosford E 7 240L Fortnightly 240L Fortnightly 120L Weekly 3310 Goulburn Mulwarree N 4 240L Fortnightly 240L Monthly 140L Weekly 3350 Greater Taree R 4 240L Fortnightly 240L Fortnightly 140L Weekly 3370 Greater Hume N 11 240L Fortnightly No Service 240L Weekly 3400 Great Lakes R 4 240L Fortnightly 240L Fortnightly 140L Weekly 3450 Griffith City N 4 240L Fortnightly No Service 240L Weekly 3500 Gundagai N 9 240L Fortnightly No Service 120L Weekly 3550 Gunnedah N 11 120L Weekly 240L Fortnightly 140L Weekly 3650 Guyra N 9 55L Weekly No Service 140L Weekly 3660 Gwydir N 10 240L Fortnightly No Service 240L Weekly 3700 Harden N 9 240L Fortnightly No Service 120L Weekly 3750 Port Macquarie–Hastings R 4 240L Fortnightly 240L Weekly 120L Weekly 3800 Hawkesbury E 6 240L Fortnightly No Service 240L Weekly 3850 Hay N 9 No Service No Service 240L Weekly 3950 Holroyd S 3 240L Fortnightly No Service 240L Weekly 4000 Hornsby S 7 240L Fortnightly 240L Fortnightly 140L Weekly 4100 Hunters Hill S 2 240L Fortnightly 240L Monthly 120L Weekly 4150 Hurstville S 3 240L Fortnightly 240L Fortnightly 120L Weekly 4200 Inverell N 11 240L Fortnightly No Service 240L Weekly 4250 Jerilderie N 8 No Service No Service 240L Weekly 4300 Junee N 10 240L Fortnightly No Service 120L Weekly 4350 Kempsey R 4 240L Fortnightly 240L Fortnightly 140L Mixed 4400 Kiama E 4 240L Fortnightly 240L Fortnightly 140L Weekly 4450 Kogarah S 2 240L Fortnightly 240L Fortnightly 120L Weekly

64 NSW
Local Governm
ent Waste and R
esource Recovery D
ata Report 2010–2011
Dry Recycling Organics Residual Waste
ABS Council Name Reg
ion
DLG
Gro
up
Predominant BIN size Frequency
Predominant BIN size Frequency
Predominant BIN size Frequency
4500 Ku–ring–gai S 3 240L Fortnightly Others Fortnightly 120L Weekly 4550 Kyogle R 10 No Service No Service 240L Weekly 4600 Lachlan N 10 No Service 240L Fortnightly 240L Mixed 4650 Lake Macquarie E 5 240L Split (P/C) Fortnightly No Service 240L Weekly 4700 Lane Cove S 2 120L Fortnightly Others Monthly 80L Weekly 4750 Leeton N 11 240L Fortnightly No Service 240L Weekly 4800 Leichhardt S 2 120L Weekly Others Weekly 120L Weekly 4850 Lismore R 4 240L Fortnightly 240L Weekly 140L Fortnightly 4880 Lithgow N 4 Crate Weekly No Service 240L Weekly 4900 Liverpool S 7 240L Fortnightly 240L Fortnightly 140L Weekly 4920 Liverpool Plains N 10 240L Fortnightly No Service 240L Weekly 4950 Lockhart N 9 240L Fortnightly No Service 240L Weekly 5050 Maitland E 4 240L Split (P/C) Fortnightly No Service 240L Weekly 5150 Manly S 2 240L Fortnightly 240L Monthly 240L Weekly 5200 Marrickville S 3 240L Fortnightly 240L Fortnightly 140L Weekly 5270 Mid–Western N 4 240L Weekly No Service 240L Weekly 5300 Moree Plains N 11 240L Fortnightly No Service 140L Weekly 5350 Mosman S 2 240L Weekly 240L Monthly 120L Weekly 5500 Murray N 10 240L Fortnightly No Service 140L NA 5550 Murrumbidgee N 9 240L Fortnightly No Service 240L Weekly 5650 Muswellbrook R 11 240L Fortnightly 240L Fortnightly 140L Weekly 5700 Nambucca R 11 240L Fortnightly 240L Weekly 240L Fortnightly 5750 Narrabri N 11 240L Weekly No Service 120L Weekly 5800 Narrandera N 10 No Service No Service 240L Weekly 5850 Narromine N 10 240L Fortnightly No Service 240L Weekly 5900 Newcastle E 5 240L Fortnightly Others Quarterly 140L Weekly

NSW
Local Governm
ent Waste and R
esource Recovery D
ata Report 2010–2011 65
Dry Recycling Organics Residual Waste
ABS Council Name Reg
ion
DLG
Gro
up
Predominant BIN size Frequency
Predominant BIN size Frequency
Predominant BIN size Frequency
5950 North Sydney S 2 240L Weekly 240L On Call 240L Weekly 6110 Oberon N 10 No Service No Service 240L Weekly 6150 Orange N 4 240L Fortnightly No Service 240L Weekly 6180 Palerang N 11 240L Fortnightly No Service 140L Weekly 6200 Parkes N 11 240L Fortnightly No Service 240L Weekly 6250 Parramatta S 3 240L Fortnightly 240L Fortnightly 140L Weekly 6350 Penrith S 7 240L Fortnightly 240L Weekly 140L Weekly 6370 Pittwater S 2 140L Weekly Others Quarterly 80L Weekly 6400 Port Stephens E 4 240L Fortnightly No Service 240L Weekly 6470 Queanbeyan N 4 240L Fortnightly 240L Fortnightly 140L Weekly 6550 Randwick S 3 240L Fortnightly 240L Fortnightly 240L Weekly 6610 Richmond Valley R 4 240L Fortnightly No Service 240L Weekly 6650 Rockdale S 3 240L Fortnightly No Service 240L Weekly 6700 Ryde S 3 240L Fortnightly 240L Fortnightly 140L Weekly 6900 Shellharbour E 4 240L Fortnightly 240L Fortnightly 240L Fortnightly 6950 Shoalhaven E 5 240L Fortnightly No Service 120L Weekly 7000 Singleton R 4 240L Fortnightly No Service 240L Weekly 7050 Snowy River N 10 Crate Fortnightly No Service 240L Weekly 7100 Strathfield S 2 240L Fortnightly 240L Fortnightly 120L Weekly 7150 Sutherland S 3 240L Fortnightly 240L Fortnightly 120L Weekly 7210 Sydney S 1 240L Weekly 240L Fortnightly 240L Weekly 7310 Tamworth Regional N 4 240L Fortnightly 240L Fortnightly 240L Weekly 7350 Temora N 10 No Service No Service 240L Weekly 7400 Tenterfield N 10 No Service No Service 120L Weekly 7450 Tumbarumba N 9 240L Weekly No Service 120L Fortnightly 7510 Tumut N 11 240L Fortnightly No Service 120L Weekly
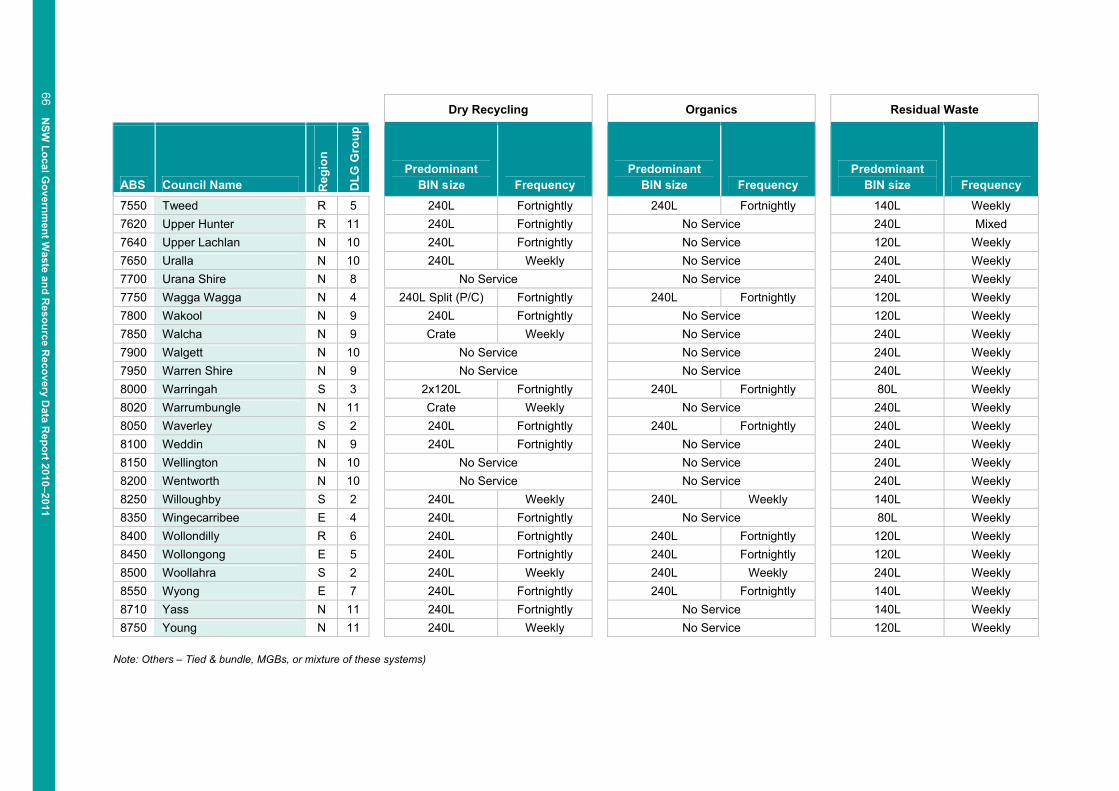
66 NSW
Local Governm
ent Waste and R
esource Recovery D
ata Report 2010–2011
Dry Recycling Organics Residual Waste
ABS Council Name Reg
ion
DLG
Gro
up
Predominant BIN size Frequency
Predominant BIN size Frequency
Predominant BIN size Frequency
7550 Tweed R 5 240L Fortnightly 240L Fortnightly 140L Weekly 7620 Upper Hunter R 11 240L Fortnightly No Service 240L Mixed 7640 Upper Lachlan N 10 240L Fortnightly No Service 120L Weekly 7650 Uralla N 10 240L Weekly No Service 240L Weekly 7700 Urana Shire N 8 No Service No Service 240L Weekly 7750 Wagga Wagga N 4 240L Split (P/C) Fortnightly 240L Fortnightly 120L Weekly 7800 Wakool N 9 240L Fortnightly No Service 120L Weekly 7850 Walcha N 9 Crate Weekly No Service 240L Weekly 7900 Walgett N 10 No Service No Service 240L Weekly 7950 Warren Shire N 9 No Service No Service 240L Weekly 8000 Warringah S 3 2x120L Fortnightly 240L Fortnightly 80L Weekly 8020 Warrumbungle N 11 Crate Weekly No Service 240L Weekly 8050 Waverley S 2 240L Fortnightly 240L Fortnightly 240L Weekly 8100 Weddin N 9 240L Fortnightly No Service 240L Weekly 8150 Wellington N 10 No Service No Service 240L Weekly 8200 Wentworth N 10 No Service No Service 240L Weekly 8250 Willoughby S 2 240L Weekly 240L Weekly 140L Weekly 8350 Wingecarribee E 4 240L Fortnightly No Service 80L Weekly 8400 Wollondilly R 6 240L Fortnightly 240L Fortnightly 120L Weekly 8450 Wollongong E 5 240L Fortnightly 240L Fortnightly 120L Weekly 8500 Woollahra S 2 240L Weekly 240L Weekly 240L Weekly 8550 Wyong E 7 240L Fortnightly 240L Fortnightly 140L Weekly 8710 Yass N 11 240L Fortnightly No Service 140L Weekly 8750 Young N 11 240L Weekly No Service 120L Weekly
Note: Others – Tied & bundle, MGBs, or mixture of these systems)

NSW Local Government Waste and Resource Recovery Data Report 2010–2011 67
Appendix 5: Domestic waste management charges 2010–11
Domestic waste management charge
SUDs
ABS Council name Reg
ion
DLG
Gro
up
Residual waste
$
Dry Recycling
$ Organics
$ Overall
$
60 Albury N 4 93 62 60 215 110 Armidale Dumaresq N 4 – – – 265 150 Ashfield S 2 135 88 59 223 200 Auburn S 2 – – – 339 250 Ballina R 4 182 124 – 306 300 Balranald N 9 246 – – 246 350 Bankstown S 3 – – – 300 470 Bathurst N 4 140 63 – 203 500 Baulkham Hills S 7 – – – 335 550 Bega Valley N 4 186 98 49 405 600 Bellingen R 11 435 – – 435 650 Berrigan N 10 – – – 227 750 Blacktown S 3 241 54 – 280 800 Bland N 10 270 – – 270 850 Blayney N 10 240 110 – 240 900 Blue Mountains R 7 – – – 297 950 Bogan N 9 175 – – 175 1000 Bombala N 9 272 272 – 272 1050 Boorowa N 9 249 – – 249 1100 Botany Bay S 2 – – – 279 1150 Bourke N 9 221 – – 221 1200 Brewarrina N 9 275 – – 275 1250 Broken Hill N 4 216 – – 216 1300 Burwood S 2 – – – 341 1350 Byron R 4 215 – – 215 1400 Cabonne N 11 – – – 275 1450 Camden S 6 253 – – 253 1500 Campbelltown S 7 221 55 46 221 1520 Canada Bay S 2 181 69 41 316 1550 Canterbury S 3 291 – – 291 1600 Carrathool N 9 180 – – 180 1700 Central Darling N 9 360 – – 360 1720 Cessnock E 4 385 – – 385 1730 Clarence Valley R 4 122 61 53 236 1750 Cobar N 10 180 – – 180 1800 Coffs Harbour R 4 – – – 345 1860 Conargo N 8 – – – NA 2000 Coolamon N 9 170 65 – 235 2060 Cooma–Monaro N 10 250 75 – 325 2150 Coonamble N 9 – – – 270

68 NSW Local Government Waste and Resource Recovery Data Report 2010–2011 68 NSW Local Government Waste and Resource Recovery Data Report 2010–2011
Domestic waste management charge
SUDs
ABS Council name Reg
ion
DLG
Gro
up
Residual waste
$
Dry Recycling
$ Organics
$ Overall
$
2200 Cootamundra N 10 266 – – 266 2310 Corowa N 11 235 – – 235 2350 Cowra N 11 366 83 – 449 2500 Deniliquin N 4 270 – – 270 2600 Dubbo N 4 – – – 238 2700 Dungog R 10 179 100 – 279 2750 Eurobodalla N 4 244 – – 244 2850 Fairfield S 3 – – – 350 2900 Forbes N 10 – 49 – 244 2950 Gilgandra N 9 320 – – 320 3020 Glen Innes Severn N 6 177 88 – 320 3050 Gloucester R 9 432 – – 432 3100 Gosford E 7 – – – 291 3310 Goulburn Mulwarree N 4 – 17 – 237 3350 Greater Taree R 4 245 137 168 319 3370 Greater Hume N 11 150 75 – 150 3400 Great Lakes R 4 – – – 295 3450 Griffith City N 4 221 112 – 221 3500 Gundagai N 9 315 – – 315 3550 Gunnedah N 11 128 104 62 294 3650 Guyra N 9 218 – – 218 3660 Gwydir N 10 343 171 – 515 3700 Harden N 9 325 – – 325
3750 Port Macquarie – Hastings R 4 182 52 – 363
3800 Hawkesbury E 6 – – – 350 3850 Hay N 9 185 – – 185 3950 Holroyd S 3 – – – 285 4000 Hornsby S 7 184 49 38 271 4100 Hunters Hill S 2 – – – NA 4150 Hurstville S 3 148 62 60 270 4200 Inverell N 11 252 – – 252 4250 Jerilderie N 8 160 – – 160 4300 Junee N 10 261 261 – 261 4350 Kempsey R 4 57 78 122 353 4400 Kiama E 4 – – – 321 4450 Kogarah S 2 335 – – 335 4500 Ku–ring–gai S 3 – – – 300 4550 Kyogle R 10 – – – 390 4600 Lachlan N 10 274 – – 274 4650 Lake Macquarie E 5 – – – 321 4700 Lane Cove S 2 – – – NA 4750 Leeton N 11 216 109 – 325

NSW Local Government Waste and Resource Recovery Data Report 2010–2011 69
Domestic waste management charge
SUDs
ABS Council name Reg
ion
DLG
Gro
up
Residual waste
$
Dry Recycling
$ Organics
$ Overall
$
4800 Leichhardt S 2 234 64 24 234 4850 Lismore R 4 – – – 223 4880 Lithgow N 4 – 58 – 317 4900 Liverpool S 7 – – – 299 4920 Liverpool Plains N 10 192 97 – 289 4950 Lockhart N 9 204 102 – 306 5050 Maitland E 4 197 61 – 258 5150 Manly S 2 – – – 450 5200 Marrickville S 3 – – – 400 5270 Mid–Western N 4 – – – 153 5300 Moree Plains N 11 123 123 – 245 5350 Mosman S 2 440 440 – 440 5500 Murray N 10 187 – – 187 5550 Murrumbidgee N 9 100 100 – 100 5650 Muswellbrook R 11 241 – – 241 5700 Nambucca R 11 – – – 438 5750 Narrabri N 11 – – – 357 5800 Narrandera N 10 170 – – 276 5850 Narromine N 10 330 85 – 415 5900 Newcastle E 5 186 69 12 268 5950 North Sydney S 2 – – – 246 6110 Oberon N 10 176 – – 176 6150 Orange N 4 163 55 – 218 6180 Palerang N 11 156 76 – 509 6200 Parkes N 11 250 – – 250 6250 Parramatta S 3 – – – 261 6350 Penrith S 7 123 38 – 249 6370 Pittwater S 2 410 – – 410 6400 Port Stephens E 4 190 97 – 287 6470 Queanbeyan N 4 101 70 70 242 6550 Randwick S 3 – – – 410 6610 Richmond Valley R 4 355 – – 355 6650 Rockdale S 3 – – – 330 6700 Ryde S 3 237 39 39 325 6900 Shellharbour E 4 – – – 278 6950 Shoalhaven E 5 – – – 230 7000 Singleton R 4 300 300 – 300 7050 Snowy River N 10 310 119 – 429 7100 Strathfield S 2 365 – – 365 7150 Sutherland S 3 181 59 42 282 7210 Sydney S 1 – – – 323 7310 Tamworth Regional N 4 – – – 251

70 NSW Local Government Waste and Resource Recovery Data Report 2010–2011 70 NSW Local Government Waste and Resource Recovery Data Report 2010–2011
Domestic waste management charge
SUDs
ABS Council name Reg
ion
DLG
Gro
up
Residual waste
$
Dry Recycling
$ Organics
$ Overall
$
7350 Temora N 10 158 – – 158 7400 Tenterfield N 10 – – – 232 7450 Tumbarumba N 9 443 92 – 443 7510 Tumut N 11 277 – – 277 7550 Tweed R 5 172 60 50 282 7620 Upper Hunter R 11 266 79 – 266 7640 Upper Lachlan N 10 – – – 294 7650 Uralla N 10 98 63 – 161 7700 Urana Shire N 8 155 – – 155 7750 Wagga Wagga N 4 79 79 79 236 7800 Wakool N 9 116 128 – 244 7850 Walcha N 9 365 – – 365 7900 Walgett N 10 – – – 479 7950 Warren Shire N 9 220 – – 220 8000 Warringah S 3 – – – 230 8020 Warrumbungle N 11 300 – – 300 8050 Waverley S 2 – – – 380 8100 Weddin N 9 178 74 – 222 8150 Wellington N 10 299 – – 299 8200 Wentworth N 10 162 – – 167 8250 Willoughby S 2 – – – 401 8350 Wingecarribee E 4 283 – – 283 8400 Wollondilly R 6 160 55 80 403 8450 Wollongong E 5 – – – 340 8500 Woollahra S 2 – – – NA 8550 Wyong E 7 255 67 67 417 8710 Yass N 11 301 301 – 301 8750 Young N 11 209 53 – 262
Note: NA – Not available / not reported

NSW Local Government Waste and Resource Recovery Data Report 2010–2011 71
Appendix 6: Total household and population figures
Total
Region Councils Households Population (ABS June 2009)
NSW 152 2,721,305 7,231,473 SMA (Sydney Metropolitan Area) 38 1,461,143 4,069,794 ERA (Extended Regulated Area) 13 529,319 1,366,650 RRA (Regional Regulated Area) 21 320,475 783,870 Rest of the State 80 410,368 1,011,159


![Waste Heat Recovery[1]](https://static.fdocuments.in/doc/165x107/577d28de1a28ab4e1ea56f01/waste-heat-recovery1.jpg)

