NSS Information and Intelligence - arthro.scot.nhs.uk
65
Annual Report 2018. NSS Information and Intelligence National Services Scotland
Transcript of NSS Information and Intelligence - arthro.scot.nhs.uk

Annual Report 2018.
NSS Information and Intelligence
NationalServicesScotland

© NHS National Services Scotland/Crown Copyright 2018Brief extracts from this publication may be reproduced provided the source is fully acknowledged. Proposals for reproduction of large extracts should be addressed to:
PHI Digital Support Information Services Division NHS National Services Scotland Gyle Square 1 South Gyle Crescent Edinburgh EH12 9EB
phone: +44 (0)131 275 6233 email: [email protected]
Designed and typeset byPHI Digital Support
Translation ServiceIf you would like this leaflet in a different language, large print or Braille (English only), or would like information on how it can be translated into your community language, please phone 0845 310 9900 quoting reference 287407.

Table of Contents
Foreword .............................................................................................................................................................................................................................................................................................................1
Introduction .................................................................................................................................................................................................................................................................................................2Scottish Arthroplasty Steering Committee 2017 – 2018 ......................................................................................................................................................................2
Key points .......................................................................................................................................................................................................................................................................................................3
1. Number of Arthroplasties ...............................................................................................................................................................................................................................41.1 National rates .....................................................................................................................................................................................................................................................................................41.2 Number of arthroplasties by Health Board ..................................................................................................................................................................................................81.3 Consultants performing low volumes .............................................................................................................................................................................................................18
2. Patient Demographics ......................................................................................................................................................................................................................................252.1 Age ..............................................................................................................................................................................................................................................................................................................252.2 Indication for surgery ..........................................................................................................................................................................................................................................................26
3. Inpatient Episodes ......................................................................................................................................................................................................................................................303.1 Length of stay ...............................................................................................................................................................................................................................................................................30
4. Complications arising from arthroplasty procedures ........................................................................................................344.1 National trends ............................................................................................................................................................................................................................................................................344.2 Complication funnel charts ..........................................................................................................................................................................................................................................38
5. Revision Rates ...................................................................................................................................................................................................................................................................... 475.1 Hips ............................................................................................................................................................................................................................................................................................................ 475.2 Complication funnel charts – hips ......................................................................................................................................................................................................................505.3 Knees .......................................................................................................................................................................................................................................................................................................525.4 Complication funnel charts – knees ................................................................................................................................................................................................................535.5 Acute renal failure ....................................................................................................................................................................................................................................................................56
6. Clinical Governance ............................................................................................................................................................................................................................................... 576.1 What is clinical governance? .................................................................................................................................................................................................................................... 576.2 Statistical analysis of complication rates associated with arthroplasty ............................................................................................................ 576.3 Quality Improvement through Case Review and Action Plan ................................................................................................................................... 57
References ................................................................................................................................................................................................................................................................................................59
Appendix A ...............................................................................................................................................................................................................................................................................................60
Appendix B to Section 6 ......................................................................................................................................................................................................................................61
Contact ...............................................................................................................................................................................................................................................................................................................62
Scottish Arthroplasty Project Annual Report 2018
1
Foreword
Data presented in the Scottish Arthroplasty Project Annual Report 2018 continues to demonstrate high standards of arthroplasty care and outcomes generally across Scotland. Many surgeons will already know this with the system that the Scottish Arthroplasty Project have organised facilitating access to their individual data online. There is a clear interest in this access with large numbers of “hits” recorded at the site. We remain well ahead of many other surgical sub specialties with respect to our data access and reporting capabilities. This does not mean of course that it cannot be improved, and many other changes are likely to be coming in the next year or two.
Initiatives commenced in 2016/17 are ongoing. The topic of low volume surgeons is gathering interest at an international level with registry data now being used to help provide a clearer understanding of the issues. The Scottish Arthroplasty Project plans to continue providing surgeons with relevant data on this subject.
The Scottish Government remains behind plans to record arthroplasty implant details and the Scottish Arthroplasty Project looks forward to being able to access and link this data to our current data set and provide a more complete picture of arthroplasty care across the nation.
Scotland remains a member of the International Society of Arthroplasty Registries, with this years annual meeting in Reykjavik where data on shoulder replacements in Scotland was presented. It remains important that the Scottish Arthroplasty Project continues to look not only at the large volume joint replacements of hip and knee but also shoulder, elbow and ankle, as these procedures come under increased scrutiny in coming years.
Mr R Ingram Chair, Scottish Arthroplasty Project Steering Committee

Scottish Arthroplasty Project Annual Report 2018
2
Introduction
The Scottish Arthroplasty Project Annual Report 2018 continues to present data relating to arthroplasty procedures including hip, knee, shoulder, elbow and ankle replacements. We hope that the data is more accurate than ever having provided surgeons with electronic access to their own data over the course of the last year, and a simple route to correct any obvious errors. High quality and accurate data is clearly very important to maintain standards and we thank the Orthopaedic community for their ongoing support and engagement with the Scottish Arthroplasty Project.
This year’s report should provide reassurance with respect to complication rates nationally for major joint replacement but may raise issues related to some aspects of care, particularly low volume surgeons. Again, we seek to provide the data to enable the surgical community to see the “bigger picture”, and where improvement/rationalisation/organisation can be bettered, encourage that to happen.
Scottish Arthroplasty Steering Committee 2017 – 2018
Clinical Non-Clinical
Mr Roland Ingram (Chairman) Mr Sandy Shirra (Lay member)
Mr James Bidwell Mr Robert Frame (Lay member)
Mr Ben Clift Mr Thomas Ferguson (Lay member)
Dr Karen Cranfield Mr Martin Paton (Info. Analyst)
Mr William MacLeod Mr Martin O’Neill (Principal Info. Analyst)
Mr Matthew Moran Mrs Kate James
Mr Martin Sarungi Mr Stuart Baird (Service Manager)

Scottish Arthroplasty Project Annual Report 2018
3
Key points
Number of arthroplasty operations
performed in 2017Revision rate
within 5 years of arthroplasty
operation
Average length of stay when undergoing
a hip or knee arthroplasty
Incidence of death within 90 days following a hip or knee arthroplasty
Average age of patients
undergoing an NHS Scotland arthroplasty operation
2001 - 10 days2017 - 4 days
knee - 2.51 %
hip - 2.12 %
knee - 7282
hip - 7786
knee - 68 yrs
hip - 67 yrs
knee - 0.22 %
hip - 0.22 %

Scottish Arthroplasty Project Annual Report 2018
4
1. Number of Arthroplasties
1.1 National ratesThe number of hip and knee arthroplasties performed remains relatively static over the last few years however we have observed a slight decline in both 2016 and 2017. During 2017 there were a total of 7786 and 7282 primary hip and knee procedures performed respectively (Figure 1a). Other joint replacement registries report that the number of knee arthroplasties significantly exceeds the number of hip arthroplasties performed on an annual basis. It is probable that, in Scotland, less knee arthroplasties are performed than in other countries with similar population demographics.
The number of elbow arthroplasties has remained stable over the last 16 years with levels seen close to that performed back in 2001 and compared to other types of arthroplasty has seen less variability year-on-year. The trend for shoulder arthroplasty shows a similar pattern to that of hip and knee arthroplasty with an increase in numbers over the period 2003 to 2012 and then a levelling off in activity (458 in 2017). The greatest percentage increase in arthroplasty activity is seen in ankle arthroplasty, with just 14 ankle arthroplasties performed in 2001 and 101 in 2017 (Figure 1b). The reasons for this are likely to be multifactorial and may include improved prosthesis and instrument design, increasing surgeon specialisation and patient and surgeon preferences.
The proportion of primary arthroplasties performed as an emergency has remained static over time, with a significant proportion of hip, shoulder and elbow arthroplasties being performed as emergencies (mostly for treatment of fractures) and low numbers of ankle and knee arthroplasties performed on an emergency basis (Figures 1e and 1f). Overall there is a significant resource requirement for non-elective arthroplasty surgery to be performed. The adequate organisation of theatre time, referral pathways and surgical expertise to deal with emergency hip, shoulder and elbow arthroplasty should be considered.
The number of hip revisions in 2017 continues to decrease, with 963 and 777 hip revisions carried out in 2013 and 2017 respectively (Figure 1c). This may reflect the early failure rate of certain metal-on-metal hip implants that were used and have now been revised. The number of knee revisions remains approximately level since 2013 with 463 procedures in 2017. There has been an increase in the number of shoulder and ankle revision operations. Shoulder revisions are up to 42, from 25 in 2013 and ankle revisions up to 11, from 5 in 2013. Overall the revision burden for 2017 (number of revision operations divided by total number of arthroplasties)is for hip arthroplasty 9.07%, knee arthroplasty 5.98%, shoulder arthroplasty 8.40%, elbow arthroplasty 15.52% and ankle arthroplasty 9.82%.
The proportion of hip revisions performed as an emergency has been steadily increasing from to reach 20.4% in 2001 to 36.2%% in 2017. This may reflect a reduction in the number of planned revisions (with the number of at risk metal-on-metal hips reducing) and an increase in the number of periprosthetic fracture revisions. We do not have the data to analyse this further. The absolute numbers of shoulder, elbow and ankle revisions performed as an emergency is low so care must be taken interpreting Figure 1f).

Scottish Arthroplasty Project Annual Report 2018
5
Figure 1a — Primary hip and knee arthroplasties per year (2001 - 2017)
Num
ber
of o
per
atio
ns
Hip arthroplasty Knee arthroplasty
4219
7786
3343
7282
0
1000
2000
3000
4000
5000
6000
7000
8000
9000
2001 2002 2003 2004 2005 2006 2007 2008 2009 2010 2011 2012 2013 2014 2015 2016 2017
Includes emergency admissions; bilateral operations counted twice; includes known patients from independent hospitals.
Figure 1b — Primary shoulder, elbow and ankle arthroplasties per year (2001 - 2017)
Shoulder arthroplasty Elbow arthroplasty Ankle arthroplasty
Num
ber
of o
per
atio
ns
234
458
53 4914
101
0
50
100
150
200
250
300
350
400
450
500
2001 2002 2003 2004 2005 2006 2007 2008 2009 2010 2011 2012 2013 2014 2015 2016 2017
Includes emergency admissions; bilateral operations counted twice; includes known patients from independent hospitals.

Scottish Arthroplasty Project Annual Report 2018
6
Figure 1c — Revision hip and knee arthroplasties per year (2001 - 2017)
Knee revisionHip revision
Num
ber
of o
per
atio
ns 789 777
249
463
0
200
400
600
800
1000
1200
2001 2002 2003 2004 2005 2006 2007 2008 2009 2010 2011 2012 2013 2014 2015 2016 2017
Includes emergency admissions; bilateral operations counted twice; includes known patients from independent hospitals.
Figure 1d — Revision shoulder, elbow and ankle arthroplasties per year (2001 - 2017)
Num
ber
of o
per
atio
ns
Shoulder revision Elbow revision Ankle revision
6
42
17
92
11
0
5
10
15
20
25
30
35
40
45
50
2001 2002 2003 2004 2005 2006 2007 2008 2009 2010 2011 2012 2013 2014 2015 2016 2017
Includes emergency admissions; bilateral operations counted twice; includes known patients from independent hospitals.

Scottish Arthroplasty Project Annual Report 2018
7
Figure 1e — Hip and knee arthroplasty, primary and revision: incidence of non-elective surgery per year (2001 - 2017)
Hip arthroplasty non-elective Hip revision non-elective
Knee arthroplasty non-elective Knee revision non-elective
% o
f op
erat
ions
0
5
10
15
20
25
30
35
40
2001 2002 2003 2004 2005 2006 2007 2008 2009 2010 2011 2012 2013 2014 2015 2016 2017
Includes emergency admissions; bilateral operations counted twice; includes known patients from independent hospitals.
Figure 1f — Shoulder, elbow and ankle arthroplasty, primary and revision: incidence of non-elective surgery per year (2001 - 2017)
% o
f non
-ele
ctiv
e op
erat
ions
Shoulder arthroplasty non-electiveShoulder revision non-elective
Elbow arthroplasty non-electiveElbow revision non-elective
Ankle arthroplasty non-electiveAnkle revision non-elective
0
5
10
15
20
25
30
35
40
2001 2002 2003 2004 2005 2006 2007 2008 2009 2010 2011 2012 2013 2014 2015 2016 2017
Includes emergency admissions; bilateral operations counted twice; includes known patients from independent hospitals.

Scottish Arthroplasty Project Annual Report 2018
8
1.2 Number of arthroplasties by Health BoardThe numbers of patients undergoing primary joint arthroplasty by Health Board of treatment is given in Figures 2a to 2e. Tables 1a to 1j show the figures for primary and revision joint replacement for Health Board of treatment and Health Board of residence.
A large number of patients undergoing primary hip or knee arthroplasty are treated out with their Health Board of residence (Tables 1a, 1f, 1b, 1g). This affects some Health Boards much more than others. In some Health Boards it is possible that this change, which has occurred over time, will have significantly altered the workload. This may have implications for staffing in certain Health Boards, in terms of the ability to recruit consultants and the expertise that is required. This trend is not seen in shoulder, ankle or elbow replacement (Tables 1c,1h,1d,1i,1e,1j).
The migration patterns seen for primary hip and knee replacement are not replicated in the figures for revision hip and knee replacement. For example some Health Boards perform considerably less primary hip and knee replacement than would be expected given the number of hip and knee replacements performed by place of residence but perform more revisions than would be expected. This may be due to Health Boards referring primary arthroplasty procedures to the NHS National Waiting Times Centre (GJNH) whereas there is a rising trend for hip and knee revisions to be performed as an emergency procedure.
The impact of referrals to the NHS National Waiting Times Centre (GJNH) is not evenly distributed across Scotland. For example, the data suggests that NHS Fife and NHS Tayside export very few primary hip and knee arthroplasties (the number of patients by health board of residence approximately matches the number treated). Other Health Boards have much greater variation; over 50% of patients that live in NHS Lanarkshire and NHS Forth Valley have a primary hip or knee arthroplasty outwith their Health Board. This discrepancy in Health Board of residence versus treatment is not seen for shoulder arthroplasty (Figure 1c and 1h). For arthroplasty operations performed in low volumes (ankle and elbow) there are a number of Health Boards where very low numbers are performed (Table 1d and 1e). Provision of these operations may be best arranged in a few centres across Scotland.
Please note that no arthroplasty procedures are undertaken within NHS Orkney and NHS Shetland therefore they do not appear in the tables that follow. Patients who require joint replacement surgery and who live within these two boards have surgery under the care of a mainland Health Board.

Scottish Arthroplasty Project Annual Report 2018
9
Figure 2a — Number of primary hip arthroplasties 2016-2017 by Health Board of treatment (NHS GG&C split)
450
179 205
445
201
731
387
666
435 415 417
818 797
60
1635
52
529
172 176
404
199
634
331
630
464 422385
822
692
53
1704
169
0
200
400
600
800
1000
1200
1400
1600
1800A
yrsh
ire &
Arr
an
Bor
der
s
Dum
frie
s &
Gal
low
ay
Fife
Fort
h V
alle
y
Gra
mp
ian
Nor
th G
lasg
ow
Sou
th G
lasg
ow
Cly
de
Hig
hlan
d
Lana
rksh
ire
Loth
ian
Tays
ide
Wes
tern
Isle
s
GJN
H
Ind
epen
den
t ho
spita
l
Num
ber
of o
per
atio
ns
Hip primary arthroplasties 2016 Hip primary arthroplasties 2017 Includes emergency admissions; bilateral operations counted twice; includes known patients from independent hospitals.
Figure 2b — Number of primary knee arthroplasties 2016-2017 by Health Board of treatment (NHS GG&C split)
438
139182
468
200
602521
595
402 340436
824
529
68
1785
83
497
176 164
433
211
520412
531431 391 398
683
537
44
1692
162
0
200
400
600
800
1000
1200
1400
1600
1800
2000
Ayr
shire
& A
rran
Bor
der
s
Dum
frie
s &
Gal
low
ay
Fife
Fort
h V
alle
y
Gra
mp
ian
Nor
th G
lasg
ow
Sou
th G
lasg
ow
Cly
de
Hig
hlan
d
Lana
rksh
ire
Loth
ian
Tays
ide
Wes
tern
Isle
s
GJN
H
Ind
epen
den
t ho
spita
l
Num
ber
of o
per
atio
ns
Knee primary arthroplasties 2016 Knee primary arthroplasties 2017
Includes emergency admissions; bilateral operations counted twice; includes known patients from independent hospitals.

Scottish Arthroplasty Project Annual Report 2018
10
Figure 2c — Number of primary shoulder arthroplasties 2016-2017 by Health Board of treatment (NHS GG&C split)
55
8
1924
21
63
45
61
34
16 16
51
30
4 2
39
10
20 19 20
66
35
69
42
10
30
55
36
7
0
10
20
30
40
50
60
70
80
Ayr
shire
& A
rran
Bor
der
s
Dum
frie
s &
Gal
low
ay
Fife
Fort
h V
alle
y
Gra
mp
ian
Nor
th G
lasg
ow
Sou
th G
lasg
ow
Cly
de
Hig
hlan
d
Lana
rksh
ire
Loth
ian
Tays
ide
Wes
tern
Isle
s
GJN
H
Ind
epen
den
t ho
spita
l
Num
ber
of o
per
atio
ns
Shoulder primary arthroplasties 2016 Shoulder primary arthroplasties 2017
Includes emergency admissions; bilateral operations counted twice; includes known patients from independent hospitals.
Figure 2d — Number of primary elbow arthroplasties 2016-2017 by Health Board of treatment (NHS GG&C split)
76
8
1 1 1
15
55
23
4
6
1 1
16
11
0
2
4
6
8
10
12
14
16
18
Ayr
shire
& A
rran
Bor
der
s
Dum
frie
s &
Gal
low
ay
Fife
Fort
h V
alle
y
Gra
mp
ian
Nor
th G
lasg
ow
Sou
th G
lasg
ow
Cly
de
Hig
hlan
d
Lana
rksh
ire
Loth
ian
Tays
ide
Wes
tern
Isle
s
GJN
H
Ind
epen
den
t ho
spita
l
Num
ber
of o
per
atio
ns
Elbow primary arthroplasties 2016 Elbow primary arthroplasties 2017
Includes emergency admissions; bilateral operations counted twice; includes known patients from independent hospitals.

Scottish Arthroplasty Project Annual Report 2018
11
Figure 2e — Number of primary ankle arthroplasties 2016-2017 by Health Board of treatment (NHS GG&C split)
13
13
810
12
20
13 34
22
11
7 7
37
13
0
5
10
15
20
25
30
35
40
Ayr
shir
e &
Arr
an
Bo
rder
s
Dum
frie
s &
Gal
low
ay
Fife
Fort
h V
alle
y
Gra
mp
ian
No
rth
Gla
sgo
w
So
uth
Gla
sgo
w
Cly
de
Hig
hlan
d
Lan
arks
hire
Lo
thia
n
Tays
ide
Wes
tern
Isle
s
GJN
H
Ind
epen
den
t ho
spita
l
Num
ber
of o
per
atio
ns
Ankle primary arthroplasties 2016 Ankle primary arthroplasties 2017
Includes emergency admissions; bilateral operations counted twice; includes known patients from independent hospitals.
Table 1a — Number of hip arthroplasties by Health Board of treatment (NHS GG&C split)
NHS BoardMean number of operations
2012-2015
Number of operations
2016
Number of operations
2017
Mean number of revisions 2012-2015
Number of revisions 2016
Number of revisions 2017
Ayrshire & Arran 439 450 529 59 36 47Borders 204 179 172 8 6 5Dumfries & Galloway 174 205 176 6 2 4Fife 467 445 404 48 37 39Forth Valley 211 201 199 34 29 36Grampian 724 731 634 89 72 47North Glasgow 612 387 331 98 33 39South Glasgow 445 666 630 99 123 124Clyde 390 435 464 47 41 53Highland 353 415 422 35 36 28Lanarkshire 410 417 385 52 42 54Lothian 851 818 822 154 166 164Tayside 793 797 692 90 67 65Western Isles 53 60 53 3 2 0GJNH 1316 1635 1704 75 94 72Independent hospital 304 52 169 1 0 0Total 7743 7893 7786 899 786 777
Includes emergency admissions; bilateral operations counted twice; includes known patients from independent hospitals.

Scottish Arthroplasty Project Annual Report 2018
12
Table 1b — Number of knee arthroplasties by Health Board of treatment (NHS GG&C split)
NHS BoardMean number of operations
2012-2015
Number of operations
2016
Number of operations
2017
Mean number of revisions 2012-2015
Number of revisions 2016
Number of revisions 2017
Ayrshire & Arran 460 438 497 42 28 25Borders 176 139 176 6 3 4Dumfries & Galloway 174 182 164 1 1 1Fife 483 468 433 38 38 41Forth Valley 225 200 211 18 24 17Grampian 593 602 520 45 50 32North Glasgow 714 521 412 51 38 48South Glasgow 404 595 531 32 36 26Clyde 444 402 431 28 23 32Highland 302 340 391 14 20 19Lanarkshire 484 436 398 36 37 37Lothian 802 824 683 65 73 81Tayside 657 529 537 46 35 38Western Isles 53 68 44 1 1 0GJNH 1378 1785 1692 46 61 62Independent hospital 303 83 162 2 0 0Total 7650 7612 7282 468 468 463
Includes emergency admissions; bilateral operations counted twice; includes known patients from independent hospitals.
Table 1c — Number of shoulder arthroplasties by Health Board of treatment (NHS GG&C split)
NHS BoardMean number of operations
2012-2015
Number of operations
2016
Number of operations
2017
Mean number of revisions 2012-2015
Number of revisions 2016
Number of revisions 2017
Ayrshire & Arran 60 55 39 6 6 4Borders 4 8 10 0 0 0Dumfries & Galloway 20 19 20 0 0 0Fife 17 24 19 0 3 1Forth Valley 19 21 20 1 2 1Grampian 56 63 66 6 9 8North Glasgow 57 45 35 5 4 5South Glasgow 32 61 69 4 4 4Clyde 34 34 42 4 1 3Highland 19 16 10 1 1 3Lanarkshire 21 16 30 1 3 3Lothian 69 51 55 3 8 7Tayside 33 30 36 3 1 3Western Isles 7 4 7 1 0 0GJNH 0 0 0 0 0 0Independent hospital 8 2 0 1 0 0Total 454 449 458 35 42 42
Includes emergency admissions; bilateral operations counted twice; includes known patients from independent hospitals.

Scottish Arthroplasty Project Annual Report 2018
13
Table 1d — Number of elbow arthroplasties by Health Board of treatment (NHS GG&C split)
NHS BoardMean number of operations
2012-2015
Number of operations
2016
Number of operations
2017
Mean number of revisions 2012-2015
Number of revisions 2016
Number of revisions 2017
Ayrshire & Arran 6 7 5 0 0 0Borders 0 0 0 0 0 0Dumfries & Galloway 0 0 0 0 0 0Fife 1 0 0 0 0 0Forth Valley 1 0 2 1 0 0Grampian 7 6 3 2 2 1North Glasgow 7 8 4 3 0 1South Glasgow 6 1 6 2 1 1Clyde 2 1 0 0 0 0Highland 3 0 1 1 0 1Lanarkshire 2 1 1 0 0 0Lothian 18 15 16 4 7 3Tayside 6 5 11 1 0 2Western Isles 0 0 0 0 0 0GJNH 0 0 0 0 0 0Independent hospital 1 0 0 0 0 0Total 58 44 49 12 10 9
Includes emergency admissions; bilateral operations counted twice; includes known patients from independent hospitals.
Table 1e — Number of ankle arthroplasties by Health Board of treatment (NHS GG&C split)
NHS BoardMean number of operations
2012-2015
Number of operations
2016
Number of operations
2017
Mean number of revisions 2012-2015
Number of revisions 2016
Number of revisions 2017
Ayrshire & Arran 0 0 0 0 0 0Borders 1 0 0 0 0 0Dumfries & Galloway 2 1 0 0 0 1Fife 5 3 4 1 0 0Forth Valley 0 0 0 0 0 0Grampian 1 0 0 0 0 0North Glasgow 16 13 22 5 7 5South Glasgow 4 8 11 1 1 1Clyde 2 10 7 0 0 1Highland 0 0 0 0 0 0Lanarkshire 6 12 7 1 3 0Lothian 13 20 37 2 1 2Tayside 2 1 0 0 0 0Western Isles 0 0 0 0 0 0GJNH 2 3 13 0 0 1Independent hospital 4 3 0 0 0 0Total 56 74 101 9 12 11
Includes emergency admissions; bilateral operations counted twice; includes known patients from independent hospitals.

Scottish Arthroplasty Project Annual Report 2018
14
Table 1f — Number of hip arthroplasties by Health Board of residence
NHS BoardMean number of operations
2012-2015
Number of operations
2016
Number of operations
2017
Mean number of revisions 2012-2015
Number of revisions 2016
Number of revisions 2017
Ayrshire & Arran 641 652 714 76 47 52Borders 250 237 235 26 26 24Dumfries & Galloway 254 306 289 35 39 30Fife 561 513 462 59 53 50Forth Valley 438 400 503 49 35 53Grampian 838 807 724 80 70 42GG&C 1258 1330 1224 176 145 159Highland 550 611 668 56 53 51Lanarkshire 865 953 936 101 92 98 Lothian 1209 1192 1216 130 142 145Orkney 48 40 34 9 4 5Shetland 49 52 41 5 3 5Tayside 682 706 637 85 56 58Western Isles 72 73 73 11 12 3England/Wales/NI 20 14 18 3 8 2Unknown 3 2 1 1 0Outside UK 5 5 12 1 0 0Total 7743 7893 7786 899 786 777
Includes emergency admissions; bilateral operations counted twice; includes known patients from independent hospitals.
Table 1g — Number of knee arthroplasties by Health Board of residence
NHS BoardMean number of operations
2012-2015
Number of operations
2016
Number of operations
2017
Mean number of revisions 2012-2015
Number of revisions 2016
Number of revisions 2017
Ayrshire & Arran 691 684 702 46 44 36Borders 207 189 210 11 10 12Dumfries & Galloway 239 279 261 18 12 13Fife 574 497 487 44 42 46Forth Valley 465 476 546 25 34 27Grampian 691 654 583 42 46 29GG&C 1431 1370 1206 87 74 75Highland 493 564 602 25 34 32Lanarkshire 997 1043 945 60 61 62 Lothian 1132 1197 1098 61 67 80Orkney 38 34 26 3 5 2Shetland 46 51 43 4 2 4Tayside 564 479 500 40 33 36Western Isles 70 85 61 4 4 9England/Wales/NI 9 9 7 1 0 0Unknown 4 0 2 0 0 0Outside UK 3 1 3 0 0 0Total 7650 7612 7282 468 468 463
Includes emergency admissions; bilateral operations counted twice; includes known patients from independent hospitals.

Scottish Arthroplasty Project Annual Report 2018
15
Table 1h — Number of shoulder arthroplasties by Health Board of residence
NHS BoardMean number of operations
2012-2015
Number of operations
2016
Number of operations
2017
Mean number of revisions 2012-2015
Number of revisions 2016
Number of revisions 2017
Ayrshire & Arran 62 55 42 7 6 7Borders 9 9 11 0 0 1Dumfries & Galloway 23 23 25 1 1 2Fife 22 26 24 1 4 1Forth Valley 24 21 20 2 3 1Grampian 48 54 59 6 6 5GG&C 92 109 114 9 7 6Highland 32 29 24 3 3 5Lanarkshire 31 33 42 2 3 5 Lothian 63 49 54 3 7 5Orkney 4 3 2 0 0 0Shetland 2 5 3 0 0 0Tayside 31 28 28 3 2 4Western Isles 9 4 8 1 0 0England/Wales/NI 2 1 2 0 0 0Unknown 0 0 0 0 0 0Outside UK 0 0 0 0 0 0Total 454 449 458 35 42 42
Includes emergency admissions; bilateral operations counted twice; includes known patients from independent hospitals.
Table 1i — Number of elbow arthroplasties by Health Board of residence
NHS BoardMean number of operations
2012-2015
Number of operations
2016
Number of operations
2017
Mean number of revisions 2012-2015
Number of revisions 2016
Number of revisions 2017
Ayrshire & Arran 7 7 5 0 0 1Borders 2 1 1 0 0 0Dumfries & Galloway 1 1 0 1 0 1Fife 3 1 2 1 1 1Forth Valley 2 3 2 1 0 1Grampian 7 6 3 1 2 1GG&C 9 6 7 2 1 0Highland 3 1 1 1 0 1Lanarkshire 5 2 4 2 0 0 Lothian 14 11 14 3 6 1Orkney 0 0 0 0 0 0Shetland 0 0 0 0 0 0Tayside 6 5 10 1 0 2Western Isles 0 0 0 0 0 0England/Wales/NI 0 0 0 0 0 0Unknown 0 0 0 0 0 0Outside UK 0 0 0 0 0 0Total 58 44 49 12 10 9
Includes emergency admissions; bilateral operations counted twice; includes known patients from independent hospitals.

Scottish Arthroplasty Project Annual Report 2018
16
Table 1j — Number of ankle arthroplasties by Health Board of residence
NHS BoardMean number of operations
2012-2015
Number of operations
2016
Number of operations
2017
Mean number of revisions 2012-2015
Number of revisions 2016
Number of revisions 2017
Ayrshire & Arran 4 2 8 1 1 2Borders 2 2 1 1 0 0Dumfries & Galloway 2 2 1 0 1 2Fife 5 3 4 1 0 0Forth Valley 1 2 7 0 0 0Grampian 1 1 0 0 0GG&C 12 18 22 2 0 1Highland 3 5 6 1 1 1Lanarkshire 10 19 9 3 6 3 Lothian 17 18 36 2 1 2Orkney 0 0 0 0 0 0Shetland 0 0 0 0 0 0Tayside 2 2 6 0 1 0Western Isles 1 0 1 0 1 0England/Wales/NI 0 0 0 1 0 0Unknown 0 0 0 0 0 0Outside UK 0 0 0 0 0 0Total 56 74 101 9 12 11
Includes emergency admissions; bilateral operations counted twice; includes known patients from independent hospitals.
Scottish Arthroplasty Project Annual Report 2018
17
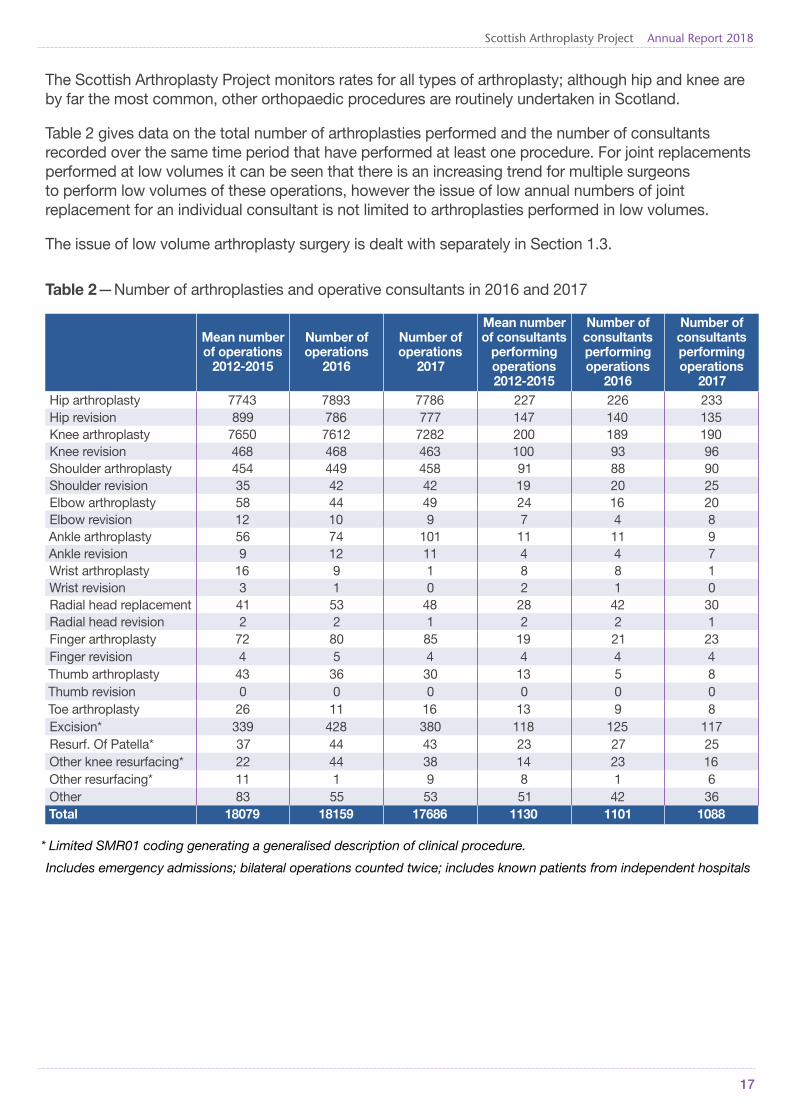
The Scottish Arthroplasty Project monitors rates for all types of arthroplasty; although hip and knee are by far the most common, other orthopaedic procedures are routinely undertaken in Scotland.
Table 2 gives data on the total number of arthroplasties performed and the number of consultants recorded over the same time period that have performed at least one procedure. For joint replacements performed at low volumes it can be seen that there is an increasing trend for multiple surgeons to perform low volumes of these operations, however the issue of low annual numbers of joint replacement for an individual consultant is not limited to arthroplasties performed in low volumes.
The issue of low volume arthroplasty surgery is dealt with separately in Section 1.3.
Table 2 — Number of arthroplasties and operative consultants in 2016 and 2017
Mean number of operations
2012-2015
Number of operations
2016
Number of operations
2017
Mean number of consultants
performing operations 2012-2015
Number of consultants performing operations
2016
Number of consultants performing operations
2017Hip arthroplasty 7743 7893 7786 227 226 233Hip revision 899 786 777 147 140 135Knee arthroplasty 7650 7612 7282 200 189 190Knee revision 468 468 463 100 93 96Shoulder arthroplasty 454 449 458 91 88 90Shoulder revision 35 42 42 19 20 25Elbow arthroplasty 58 44 49 24 16 20Elbow revision 12 10 9 7 4 8Ankle arthroplasty 56 74 101 11 11 9Ankle revision 9 12 11 4 4 7Wrist arthroplasty 16 9 1 8 8 1Wrist revision 3 1 0 2 1 0Radial head replacement 41 53 48 28 42 30Radial head revision 2 2 1 2 2 1Finger arthroplasty 72 80 85 19 21 23Finger revision 4 5 4 4 4 4Thumb arthroplasty 43 36 30 13 5 8Thumb revision 0 0 0 0 0 0Toe arthroplasty 26 11 16 13 9 8Excision* 339 428 380 118 125 117Resurf. Of Patella* 37 44 43 23 27 25Other knee resurfacing* 22 44 38 14 23 16Other resurfacing* 11 1 9 8 1 6Other 83 55 53 51 42 36Total 18079 18159 17686 1130 1101 1088
* Limited SMR01 coding generating a generalised description of clinical procedure.
Includes emergency admissions; bilateral operations counted twice; includes known patients from independent hospitals
Scottish Arthroplasty Project Annual Report 2018
18
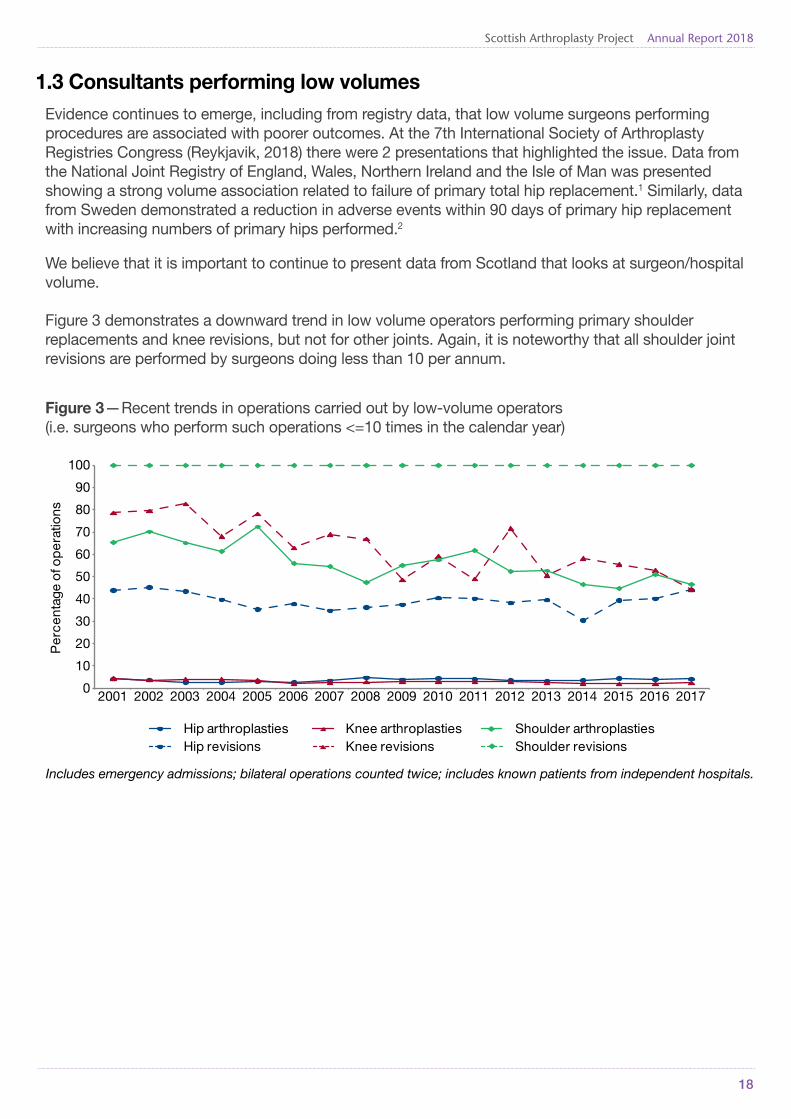
1.3 Consultants performing low volumesEvidence continues to emerge, including from registry data, that low volume surgeons performing procedures are associated with poorer outcomes. At the 7th International Society of Arthroplasty Registries Congress (Reykjavik, 2018) there were 2 presentations that highlighted the issue. Data from the National Joint Registry of England, Wales, Northern Ireland and the Isle of Man was presented showing a strong volume association related to failure of primary total hip replacement.1 Similarly, data from Sweden demonstrated a reduction in adverse events within 90 days of primary hip replacement with increasing numbers of primary hips performed.2
We believe that it is important to continue to present data from Scotland that looks at surgeon/hospital volume.
Figure 3 demonstrates a downward trend in low volume operators performing primary shoulder replacements and knee revisions, but not for other joints. Again, it is noteworthy that all shoulder joint revisions are performed by surgeons doing less than 10 per annum.
Figure 3 — Recent trends in operations carried out by low-volume operators (i.e. surgeons who perform such operations <=10 times in the calendar year)
Per
cent
age
of o
per
atio
ns
Hip arthroplasties Hip revisions
Knee arthroplastiesKnee revisions
Shoulder arthroplasties Shoulder revisions
0
10
20
30
40
50
60
70
80
90
100
2001 2002 2003 2004 2005 2006 2007 2008 2009 2010 2011 2012 2013 2014 2015 2016 2017
Includes emergency admissions; bilateral operations counted twice; includes known patients from independent hospitals.

Scottish Arthroplasty Project Annual Report 2018
19
Table 3a demonstrates that 40.3% of surgeons performing primary hip replacement in Scotland do less than ten per annum and contribute to only 4.2% of the hips done in Scotland (327 hips).
Table 3a — The number and percentage of hip arthroplasties by surgeon and performance activity 2013-2017
YearTotal number
of hip arthroplasties
Total number of surgeons
Percentage of surgeons performing
<=10 operations
per year
Percentage of
operations by surgeons performing
<=10 operations
per year
Percentage of surgeons performing
11-30 operations
per year
Percentage of
operations by surgeons performing
11-30 operations
per year
Percentage of surgeons performing
31-50 operations
per year
Percentage of
operations by surgeons performing
31-50 operations
per year
Percentage of surgeons performing
51-80 operations
per year
Percentage of
operations by surgeons performing
51-80 operations
per year
Percentage of surgeons performing
81-100 operations
per year
Percentage of
operations by surgeons performing
81-100 operations
per year
Percentage of surgeons performing
>100 operations
per year
Percentage of
operations by surgeons performing
>100 operations
per year
2013 7666 217 35.9% 3.4% 21.2% 11.8% 17.5% 19.3% 11.5% 21.0% 5.1% 12.6% 8.8% 31.9%2014 7823 232 36.6% 3.7% 27.2% 15.9% 12.1% 14.0% 10.8% 21.2% 6.5% 17.1% 6.9% 28.2%2015 7972 231 39.8% 4.5% 19.5% 11.3% 17.7% 20.8% 11.7% 23.0% 4.3% 10.9% 6.9% 29.6%2016 7893 226 39.4% 4.0% 16.4% 9.0% 18.6% 21.2% 11.5% 20.7% 6.2% 15.6% 8.0% 29.4%2017 7786 233 40.3% 4.2% 18.0% 10.9% 15.5% 17.8% 14.6% 27.7% 4.7% 12.7% 6.9% 26.7%
Includes emergency admissions; bilateral operations counted twice; includes known patients from independent hospitals.
Table 3b demonstrates that the issue is less marked in primary knee replacement with 21.1% of surgeons performing less than 10 per annum with a downward trend over the last 5 years (24.5% in 2013).
Table 3b — The number and percentage of knee arthroplasties by surgeon and performance activity 2013-2017
YearTotal number
of knee arthroplasties
Total number of surgeons
Percentage of surgeons performing
<=10 operations
per year
Percentage of
operations by surgeons performing
<=10 operations
per year
Percentage of surgeons performing
11-30 operations
per year
Percentage of
operations by surgeons performing
11-30 operations
per year
Percentage of surgeons performing
31-50 operations
per year
Percentage of
operations by surgeons performing
31-50 operations
per year
Percentage of surgeons performing
51-80 operations
per year
Percentage of
operations by surgeons performing
51-80 operations
per year
Percentage of surgeons performing
81-100 operations
per year
Percentage of
operations by surgeons performing
81-100 operations
per year
Percentage of surgeons performing
>100 operations
per year
Percentage of
operations by surgeons performing
>100 operations
per year
2013 7227 196 24.5% 2.5% 29.6% 16.7% 19.9% 21.0% 13.3% 23.2% 7.1% 17.4% 5.6% 19.2%2014 7889 201 21.9% 2.3% 31.3% 16.6% 19.4% 20.0% 13.9% 22.1% 6.0% 13.7% 7.5% 25.3%2015 7936 195 19.5% 2.1% 30.3% 15.5% 22.1% 21.2% 14.4% 21.7% 6.2% 13.3% 7.7% 26.2%2016 7612 189 19.6% 2.1% 32.8% 17.6% 18.5% 18.5% 16.9% 27.3% 5.8% 12.4% 6.3% 22.1%2017 7282 190 21.1% 2.6% 31.6% 18.6% 22.6% 23.4% 14.7% 24.6% 4.2% 10.4% 5.8% 20.6%
Includes emergency admissions; bilateral operations counted twice; includes known patients from independent hospitals.

Scottish Arthroplasty Project Annual Report 2018
20
Table 3c demonstrates that 90 surgeons in Scotland who perform shoulder arthroplasty do only 458 shoulder replacements between them. Only 16.7 % of surgeons doing this operation do between 11 and 30 procedures and nobody does more than 30.
Table 3c — The number and percentage of shoulder arthroplasties by surgeon and performance activity 2013-2017
YearTotal number of shoulder
arthroplasties
Total number of surgeons
Percentage of surgeons performing
<=10 operations
per year
Percentage of
operations by
surgeons performing
<=10 operations
per year
Percentage of surgeons performing
11-30 operations
per year
Percentage of
operations by
surgeons performing
11-30 operations
per year
Percentage of surgeons performing
31-50 operations
per year
Percentage of
operations by
surgeons performing
31-50 operations
per year
Percentage of surgeons performing
51-80 operations
per year
Percentage of
operations by
surgeons performing
51-80 operations
per year
Percentage of surgeons performing
81-100 operations
per year
Percentage of
operations by
surgeons performing
81-100 operations
per year
Percentage of surgeons performing
>100 operations
per year
Percentage of
operations by
surgeons performing
>100 operations
per year
2013 442 85 87.1% 52.7% 11.8% 38.2% 1.2% 9.0% 0.0% 0.0% 0.0% 0.0% 0.0% 0.0%2014 472 95 85.3% 46.6% 12.6% 38.8% 2.1% 14.6% 0.0% 0.0% 0.0% 0.0% 0.0% 0.0%2015 462 91 85.7% 44.8% 12.1% 40.5% 2.2% 14.7% 0.0% 0.0% 0.0% 0.0% 0.0% 0.0%2016 449 88 86.4% 51.0% 13.6% 49.0% 0.0% 0.0% 0.0% 0.0% 0.0% 0.0% 0.0% 0.0%2017 458 90 83.3% 46.7% 16.7% 53.3% 0.0% 0.0% 0.0% 0.0% 0.0% 0.0% 0.0% 0.0%
Includes emergency admissions; bilateral operations counted twice; includes known patients from independent hospitals.
Table 3d shows that while there may be a downward trend in the number of surgeons performing any revision hip replacements, of those that do, the majority are low volume surgeons doing less than 10.
Table 3d — The number and percentage of hip revisions by surgeon and performance activity 2013-2017
YearTotal number of hip
revisionsTotal number of
surgeons
Percentage of surgeons performing <=10 operations per
year
Percentage of operations by
surgeons performing <=10 operations per
year
Percentage of surgeons performing 11-20 operations per
year
Percentage of operations by
surgeons performing 11-20 operations per
year
Percentage of surgeons performing 21-80 operations per
year
Percentage of operations by
surgeons performing 21-80 operations per
year
2013 963 152 80.9% 39.7% 11.2% 26.5% 7.9% 33.9%2014 848 138 78.3% 30.4% 15.9% 40.9% 5.8% 28.7%2015 833 148 82.4% 39.4% 12.2% 32.9% 5.4% 27.7%2016 786 140 81.4% 40.2% 12.1% 29.6% 6.4% 30.2%2017 777 135 82.2% 44.1% 12.6% 31.1% 5.2% 24.7%
Includes emergency admissions; bilateral operations counted twice; includes known patients from independent hospitals.

Scottish Arthroplasty Project Annual Report 2018
21
Table 3e demonstrates that 96 surgeons did 463 revision knee replacements with only 14.6% of surgeons being high volume (more than 10 knee revisions).
Table 3e — The number and percentage of knee revisions by surgeon and performance activity 2013-2017
YearTotal number of knee
revisionsTotal number of
surgeons
Percentage of surgeons performing <=10 operations per
year
Percentage of operations by
surgeons performing <=10 operations per
year
Percentage of surgeons performing 11-20 operations per
year
Percentage of operations by
surgeons performing 11-20 operations per
year
Percentage of surgeons performing 21-80 operations per
year
Percentage of operations by
surgeons performing 21-80 operations per
year
2013 472 103 84.5% 50.6% 12.6% 34.5% 2.9% 14.8%2014 478 101 88.1% 58.2% 9.9% 31.6% 2.0% 10.3%2015 477 94 87.2% 55.6% 11.7% 37.3% 1.1% 7.1%2016 468 93 86.0% 52.8% 9.7% 28.4% 4.3% 18.8%2017 463 96 85.4% 44.3% 11.5% 36.9% 3.1% 18.8%
Includes emergency admissions; bilateral operations counted twice; includes known patients from independent hospitals.
Table 3f shows that 25 surgeons performed 42 revision shoulder procedures.
Table 3f — The number and percentage of shoulder revisions by surgeon and performance activity 2013-2017
YearTotal number of
shoulder revisionsTotal number of
surgeons
Percentage of surgeons performing <=10 operations per
year
Percentage of operations by
surgeons performing <=10 operations per
year
Percentage of surgeons performing 11-20 operations per
year
Percentage of operations by
surgeons performing 11-20 operations per
year
Percentage of surgeons performing 21-80 operations per
year
Percentage of operations by
surgeons performing 21-80 operations per
year
2013 25 15 100.0% 100.0% 0.0% 0.0% 0.0% 0.0%2014 45 25 100.0% 100.0% 0.0% 0.0% 0.0% 0.0%2015 40 18 100.0% 100.0% 0.0% 0.0% 0.0% 0.0%2016 42 20 100.0% 100.0% 0.0% 0.0% 0.0% 0.0%2017 42 25 100.0% 100.0% 0.0% 0.0% 0.0% 0.0%
Includes emergency admissions; bilateral operations counted twice; includes known patients from independent hospitals.

Scottish Arthroplasty Project Annual Report 2018
22
Map 1 below shows the numbers of surgeons performing low volume arthroplasty surgery by individual hospital and joint for both 2016 and 2017. We have adopted a colour coding for each procedure at each hospital by net difference from 2016 and 2017. We should make it clear that this is NOT Scottish Arthroplasty Project data. This is consultants own individual hospital data which we have asked individual consultants to verify and correct in the process. We at the Scottish Arthroplasty Project cannot correct it. Any corrections must be done within each hospital coding department which will then become evident and visible to the Scottish Arthroplasty Project the following month. Whilst going through this process we have had much communication from individual consultants, most of which had been extremely helpful and encouraging. This data should be interpreted with caution - we recognise that there are ongoing coding issues, cases being wrongly attributed to consultants etc. all of which contribute to the picture presented. We have decided to publish the map to provide a reference which is visible and will hopefully change/improve as we move forward with a new process described at the end of this section.
Map 1 provides visual feedback by hospital demonstrating change in the number of low volume surgeons performing joint replacement in comparison to the previous year.

Scottish Arthroplasty Project Annual Report 2018
23
University Hospital Ayr2016 2017
Elbow - 1Hip 2 4Hip revision 1 2Knee 0 1Knee revision 1 3Shoulder 1 1
University Hospital Crosshouse
2016 2017Elbow 2 4Hip 5 5Hip revision 6 3Knee 3 3Knee revision 2 3Shoulder 6 3
Western General, Glasgow
2016 2017Elbow 2 -Hip revision 0 -Hip - 1Shoulder - 1
Borders General Hospital
2016 2017Elbow 1 -Hip 4 2Hip revision 3 3Knee 4 2Knee revision 1 3Shoulder 1 1
Queen Margaret Hospital, Dunfermline
2016 2017Elbow 1 -Shoulder 0 -
Victoria Hospital,Kirkcaldy
2016 2017Ankle 1 1Elbow 2 1Hip 3 7Hip revision 5 4Knee 3 3Knee revision 7 2Shoulder 2 3
Glasgow Royal Infirmary (inc. Stobhill)
2016 2017Ankle 0 0Elbow 6 2Hip 8 11Hip revision 5 8Knee 3 3Knee revision 4 3Shoulder 6 3
Golden Jubilee National Hospital
2016 2017Ankle 1 0Hip 1 0Hip revision 7 5Knee 1 0Knee revision 5 5
Inverclyde Royal Hospital
2016 2017Elbow 2 2Hip 4 3Hip revision 4 3Knee 2 1Knee revision 2 3Shoulder 3 3
Queen Elizabeth University Hospital
2016 2017Ankle 2 2Elbow 13 10Hip 19 12Hip revision 18 20Knee 5 4Knee revision 4 9Shoulder 15 15
Royal Alexandra Hospital
2016 2017Ankle 1 1Elbow 1 -Hip 5 7Hip revision 3 6Knee 0 4Knee revision 6 4Shoulder 4 4
Raigmore Hospital Inverness
2016 2017Elbow - 1Hip 0 1Hip revision 6 5Knee 0 1Knee revision 7 6Shoulder 6 4
University HospitalHairmyres
2016 2017Ankle 0 1Elbow - 3Hip 4 3Hip revision 3 4Knee 1 3Knee revision 3 5Shoulder 1 3
University Hospital Monklands
2016 2017Elbow 1 -Hip 2 -Hip revision 3 -Knee 3 -Knee revision 1 -Shoulder 2 -
Wishaw General Hospital2016 2017
Elbow 3 1Hip 1 8Hip revision 3 4Knee 2 3Knee revision 2 3Shoulder 2 8
Aberdeen Royal Infirmary and Woodend
General Hospital2016 2017
Elbow 7 3Hip 10 8Hip revision 12 11Knee 3 4Knee revision 14 10Shoulder 7 8
Dr Gray’s Hospital2016 2017
Hip 3 1Hip revision 1 1Knee 3 0
Edinburgh Royal Infirmary
2016 2017Ankle 1 1Elbow 8 7Hip 7 7Hip revision 11 13Knee 0 2Knee revision 10 10Shoulder 4 2
Ninewells Hospital Dundee
2016 2017Ankle 1 -Elbow 4 6Hip 3 4Hip revision 8 8Knee 0 0Knee revision 4 4Shoulder 2 3
Perth Royal Infirmary2016 2017
Elbow 2 3Hip 1 2Hip revision 3 3Knee 0 1Knee revision 2 2Shoulder 3 2
Forth Valley Royal2016 2017
Elbow - 4Hip 5 6Hip revision 6 7Knee 0 2Knee revision 4 6Shoulder 6 7
Western Isles Hospital2016 2017
Hip 0 0Hip revision 2 -Knee 0 0Knee revision 1 -Shoulder 1 1
Dumfries and Galloway Royal Infirmary
2016 2017Ankle 1 1Hip 3 2Hip revision 2 3Knee 3 2Knee revision 1 1Shoulder 3 5
Stracathro Hospital2016 2017
Elbow - 1Hip 1 1Knee 0 0Knee revision - 1Shoulder 2 1
Key
Decrease in number of low volume surgeons from 2016 to 2017
No change in number of low volume surgeons from 2016 to 2017
Incease in number of low volume surgeons from 2016 to 2017
Dash means no operation was performed
Map 1— Number of low volume surgeons (10 or fewer) by hospital during 2016 and 2017 (caution advised in interpreting data – see text)

Scottish Arthroplasty Project Annual Report 2018
24
The future
It remains clear that many surgeons in Scotland perform low volumes of joint replacements and much could be done to change this scenario. Publishing this data should highlight this issue in Scotland, much as is happening across other countries, particularly those involved in the International Society of Arthroplasty Registries. We hope this will continue to fuel the debate and where appropriate provide impetus for change/re-organisation.

Scottish Arthroplasty Project Annual Report 2018
25
2. Patient Demographics
2.1 AgePrimary hip and knee arthroplasty operations are generally considered as a last choice in the treatment of advanced degenerative hip and knee diseases, and as such, these operations tend to be generally performed for the elderly population. It is interesting that the mean age for primary hip arthroplasty between 2001 and 2017 has remained relatively static (67.2 and 67.3 years old in 2001 and 2017 respectively). The same cannot be said for primary knee arthroplasty where there has been a decrease in mean age (69.2 and 68.2 in 2001 and 2017 respectively) although this appears to have reached a plateau in the last few years. Back in 2001 there was a difference of 2 years in mean age between those undergoing primary hip and knee replacement procedures however this difference continues to decrease as people are undergoing primary knee procedures earlier in life than that observed previously.
The mean age of patients who had revision hip or revision knee procedures performed show opposite direction of change compared to the primary procedures. This year the mean age for revision hip was 70.7 years and mean age for revision knee was 67.9 years a net difference of 2.8 years in the opposite direction observed in primary hip and primary knee. This year we have also observed (similar to 2013) that the mean age for patients undergoing revision knee surgery is lower than the mean age for patients undergoing a primary knee procedure (primary knee 68.2 years; revision knee 67.9 years). Whilst it is possible that one contributing factor to this in the revision knee group patients are those cases when unicompartmental knee replacements are converted to total knee replacements, but it is also recognised that early failures tends to be more frequent in knee replacements compared to hip replacement (see reports and charts for 3 and 5 years national revision rates for hips and knees – figures 22a DATA and 23a DATA in supplementary tables).
The mean age for those undergoing primary shoulder arthroplasty was 66.5 and 70.5 years old in 2001 and 2017 respectively representing an increase of 4 years. The biggest increase in mean age of 6 years was observed in those undergoing a primary elbow arthroplasty (63.5 and 69.7 years old in 2001 and 2017 respectively). These changes in these 2 groups seem to reflect the general changes in practice over the years.
The mean age for revision shoulder arthroplasty was 64.8 and 67.3 years in 2001 and 2017 respectively. Similarly to previous years, the mean age of patients who undergo revision shoulder replacement is younger than the mean age of patients who have primary shoulder replacements, which may indicate the presence of relatively early postoperative problems that lead to revision surgery in younger patients.
As mentioned in the last 2 reports, recording other demographic data such as body mass index (BMI) would be very useful to include and analyse but this data is still currently unavailable.

Scottish Arthroplasty Project Annual Report 2018
26
Figure 4 — Recent trends in average age of hip, knee and shoulder arthroplasty patients
Ave
rage
age
(Yea
rs)
Hip arthroplasty
Hip revision
Knee arthroplasty
Knee revision
Shoulder arthroplasty
Shoulder revision
67.3
70.7
68.267.9
70.5
67.3
60
62
64
66
68
70
72
2001 2002 2003 2004 2005 2006 2007 2008 2009 2010 2011 2012 2013 2014 2015 2016 2017
Includes emergency admissions; bilateral operations counted twice; includes known patients from independent hospitals
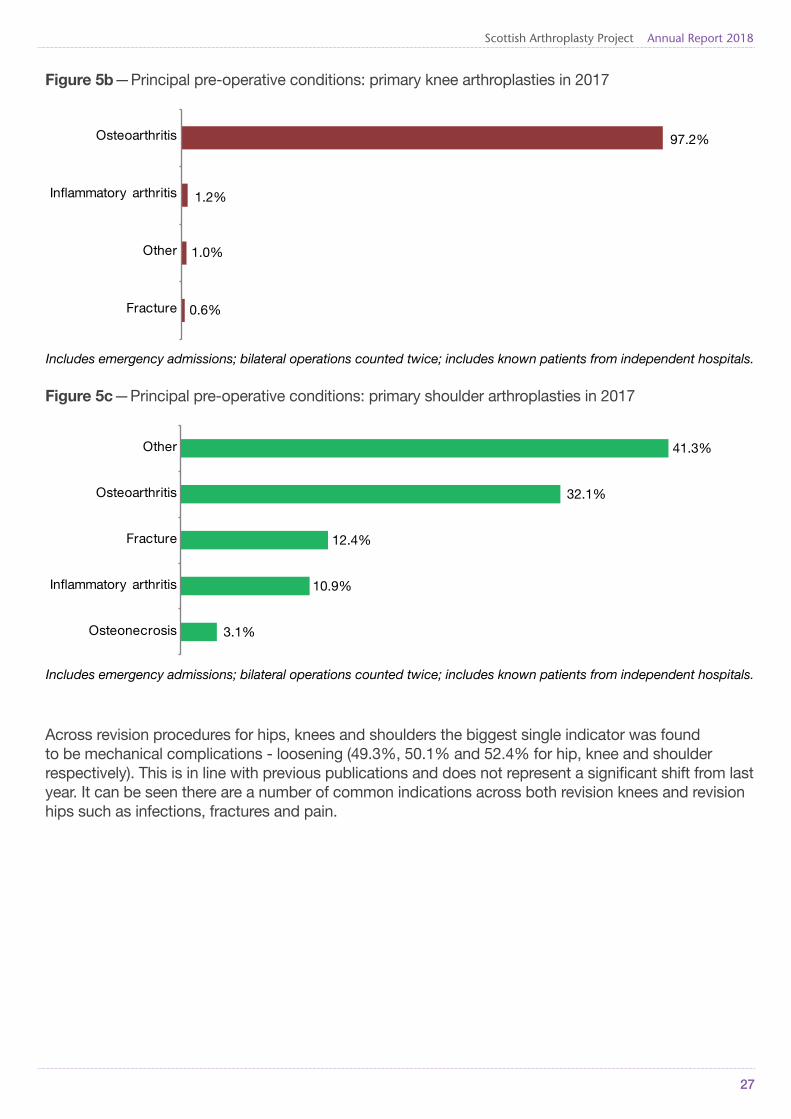
2.2 Indication for surgeryFigure 5a, 5b and 5c give more detailed information on the principal diagnosis/indication for surgery. The ‘Other’ category for indication accounts for indications with counts of less than 5 which have been aggregated together.
The biggest single indicator for primary procedures across hips, knees and shoulders was osteoarthritis (87.1%, 97.2% and 32.1% for hip, knee and shoulder respectively) – as was similarly the case last year. It is perhaps interesting to see that fracture accounts for 7.1% and 12.4% of primary hip and primary shoulder procedures but only 0.6% of primary knee procedures. It is clear to see that inflammatory arthritis is present across all primary procedures although far more common in primary shoulder procedure at 10.9%.
Figure 5a — Principal pre-operative conditions: primary hip arthroplasties in 2017
1.1%
1.2%
1.6%
1.8%
7.1%
87.1%
Other
In�ammatory arthritis
Osteonecrosis
Secondary Osteoarthritis
Fracture
Osteoarthritis
Includes emergency admissions; bilateral operations counted twice; includes known patients from independent hospitals.
Scottish Arthroplasty Project Annual Report 2018
27
Figure 5b — Principal pre-operative conditions: primary knee arthroplasties in 2017
0.6%
1.0%
1.2%
97.2%
Fracture
Other
In�ammatory arthritis
Osteoarthritis
Includes emergency admissions; bilateral operations counted twice; includes known patients from independent hospitals.
Figure 5c — Principal pre-operative conditions: primary shoulder arthroplasties in 2017
3.1%
10.9%
12.4%
32.1%
41.3%
Osteonecrosis
In�ammatory arthritis
Fracture
Osteoarthritis
Other
Includes emergency admissions; bilateral operations counted twice; includes known patients from independent hospitals.
Across revision procedures for hips, knees and shoulders the biggest single indicator was found to be mechanical complications - loosening (49.3%, 50.1% and 52.4% for hip, knee and shoulder respectively). This is in line with previous publications and does not represent a significant shift from last year. It can be seen there are a number of common indications across both revision knees and revision hips such as infections, fractures and pain.

Scottish Arthroplasty Project Annual Report 2018
28
Figure 5d — Principal pre-operative conditions: hip revision in 2017
0.9%
1.0%
1.2%
1.3%
1.5%
2.6%
3.1%
7.3%
8.5%
11.1%
12.2%
49.3%
Mech comp oth internal orthopaedicdevs implants & grafts
Other primary coxarthrosis
Mech comp of internal �xationdevice of bones of limb
Pain in joint
Coxarthrosis, unspeci�ed
Fracture of neck of femur
Oth comps int orthopaedic prosthdevs implants & grafts
Other speci�ed orthopaedicfollow-up care
Other
Infect and in�ammatory reactiondue to internal joint pros
Fract bone �lg ins orthopae implt jntprosthesis/bone plate
Mechanical complicationof internal joint prosthesis
Includes emergency admissions; bilateral operations counted twice; includes known patients from independent hospitals.
Figure 5e — Principal pre-operative conditions: knee revisions in 2016
2.4%
2.4%
4.1%
5.0%
7.6%
8.2%
9.7%
10.6%
50.1%
Other primary gonarthrosis
Pain in joint
Fract bone fllg ins orthopae implt jntprosthesis/bone plate
Gonarthrosis, unspecified
Other specified orthopaedicfollow-up care
Oth comps int orthopaedicprosth devs implants & grafts
Other
Infect and inflammatory reactiondue to internal joint pros
Mechanical complicationof internal joint prosthesis
Includes emergency admissions; bilateral operations counted twice; includes known patients from independent hospitals.

Scottish Arthroplasty Project Annual Report 2018
29
Figure 5f — Principal pre-operative conditions: shoulder revisions in 2017
47.6%
52.4%
Other
Mechanical complicationof internal joint prosthesis
Includes emergency admissions; bilateral operations counted twice; includes known patients from independent hospitals.
As already mentioned in previous Scottish Arthroplasty Project Annual Reports, clinical coding is extracted from local hospital’s coding data. This utilises the WHO International Classification of Diseases (ICD-10) coding for indication for surgery and OPCS Classification of Interventions and Procedures (OPCS-4) coding for procedures. Due to the limitations of the available coding system, indications for surgery (especially for revisions) are not coded in such a format and terminology that most surgeons would use or would recognize. There is also an issue with potential errors in the coding especially with revision cases. This area remains particularly challenging and highlights the need for future work including closer local collaboration between surgeons and coders within every hospital. It has also been recognized and identified as an important area for future work for the Scottish Arthroplasty Project. Work is already ongoing involving the Scottish Arthroplasty Project and the recently established Scottish Revision Knee Network to make improvement in this area. It is hoped that we will be able to provide clinically relevant and meaningful indication subcategories both for primary and revision procedures in the near future.

Scottish Arthroplasty Project Annual Report 2018
30
3. Inpatient Episodes
3.1 Length of stayInpatient stay for the combined major primary arthroplasty groups has more than halved since 2001, resulting in a very significant reduction in bed days across NHS Scotland. Since 2001 the length of stay for patients undergoing hip and knee arthroplasty alone reduced by 60%, from a mean of 10 days to 4 days. There has been a slowing down in improvements in length of stay and the graph (Figure 6) shows a gradual levelling off between 2011 and 2015.
The variation in length of stay between Health Boards remains a clear anomaly. There is little difference between the figures for hip or knee arthroplasty, and both preoperative and postoperative stays should be considered.
Of the units performing in excess of 150 primary hip arthroplasty procedures each year, the range for preoperative stay varies from zero for North Glasgow region of NHS Greater Glasgow & Clyde to 0.63 days for NHS Grampian. Whilst differences in demographics, and geographical or travel factors, may go some way to explain the variation in preoperative stay, the savings in bed days would be significant if all Health Boards were able to move further to day of surgery admission as the default position. It is notable that the highest average for preoperative stay, 0.63 days for NHS Grampian, has reduced from 0.91 days in the 2017 report, reflecting underlying improvement. The figures for postoperative stay show much less spread across NHS Scotland, with rounded figures ranging between 3-5 days, with an average of about 4 days. The reduction of both the length of postoperative stay and the variability between units demonstrates steady improvement across NHS Scotland.
The figures for knee arthroplasty are very similar in range and distribution. There is a range of 0 to 0.6 days preoperative stay for the larger units, with an average of 0.2 days. Again, NHS Grampian is the highest at 0.6 days. Postoperative stay range is from 3.2 - 5.5 days, with an average of 4.4 days, demonstrating less variability, and continuing improvement over the last 10 years.
Of the other arthroplasty groups, shoulder arthroplasty is detailed, showing a reduction in overall inpatient stay compared with the previous report. Preoperative stay averages at 0.2 days, and postoperative stay at 3.3 days. There is wide variability across NHS Scotland, with a range for preoperative stay of 0 to 1 days, and for postoperative stay 1.6 to 5.7 days. Factors to explain this variability include the complex co-morbidities in this patient group and the relatively low numbers for this procedure in some units, along with differences in demographics and geographical spread common to all procedure groups.
As in the previous report, the category of Independent Hospitals is included, and shows a uniformly low total length of stay for both hip and knee replacement.
It is noted that most units have shown improvement in this area with a decline in total length of stay for both hip and knee arthroplasty procedures.

Scottish Arthroplasty Project Annual Report 2018
31
Figure 6 — Recent trends in overall length of stay for elective hip, knee and shoulder arthroplasty
Hip arthroplasty Knee arthroplasty Shoulder arthroplasty
Mea
n le
ngth
of s
tay
(day
s)
4.34.4
3.2
0.0
1.0
2.0
3.0
4.0
5.0
6.0
7.0
8.0
9.0
10.0
11.0
2001 2002 2003 2004 2005 2006 2007 2008 2009 2010 2011 2012 2013 2014 2015 2016 2017
Includes elective patients only; bilateral operations counted twice; includes known patients from independent hospitals.
Figure 7a — Mean length of stay for hip arthroplasty in 2017 by Health Board of treatment (NHS GG&C split) (elective patients only)
Mea
n le
ngth
of s
tay
(Day
s)
Pre-operative Post-operative
0
1
2
3
4
5
6
7
8
9
10
Ayr
shire
& A
rran
Bor
der
s
Dum
frie
s &
Gal
low
ay
Fife
Fort
h V
alle
y
Gra
mp
ian
Nor
th G
lasg
ow
Sou
th G
lasg
ow
Cly
de
Hig
hlan
d
Lana
rksh
ire
Loth
ian
Tays
ide
Wes
tern
Isle
s
GJN
H
Ind
epen
den
t ho
spita
ls
Note: pre-operative days counted as days from date of admission to date of operation; post-operative days calculated as the difference between the number of pre-operative days and the total length of stay in orthopaedic care (where short (<=7 days) transfers to other facilities were not considered to end the patient’s orthopaedic care stay).
Includes elective patients only; bilateral operations counted twice.

Scottish Arthroplasty Project Annual Report 2018
32
Figure 7b — Mean length of stay for knee arthroplasty in 2017 by Health Board of treatment (NHS GG&C split) (elective patients only)
Pre-operative Post-operative
Mea
n le
ngth
of s
tay
(Day
s)
0
1
2
3
4
5
6
7
8
9
10
Ayr
shire
& A
rran
Bor
der
s
Dum
frie
s &
Gal
low
ay
Fife
Fort
h V
alle
y
Gra
mp
ian
Nor
th G
lasg
ow
Sou
th G
lasg
ow
Cly
de
Hig
hlan
d
Lana
rksh
ire
Loth
ian
Tays
ide
Wes
tern
Isle
s
GJN
H
Ind
epen
den
t ho
spita
ls
Note: pre-operative days counted as days from date of admission to date of operation; post-operative days calculated as the difference between the number of pre-operative days and the total length of stay in orthopaedic care (where short (<=7 days) transfers to other facilities were not considered to end the patient’s orthopaedic care stay).
Includes elective patients only; bilateral operations counted twice.

Scottish Arthroplasty Project Annual Report 2018
33
Figure 7c — Mean length of stay for shoulder arthroplasty in 2017 by NHS board of treatment (NHS GG&C split) (elective patients only)
Pre-operative Post-operative
Mea
n le
ngth
of s
tay
(Day
s)
0
1
2
3
4
5
6
7
8
9
10
Ayr
shir
e &
Arr
an
Bo
rder
s
Dum
frie
s &
Gal
low
ay
Fife
Fort
h V
alle
y
Gra
mp
ian
No
rth
Gla
sgo
w
So
uth
Gla
sgo
w
Cly
de
Hig
hlan
d
Lan
arks
hire
Lo
thia
n
Tays
ide
Wes
tern
Isle
s
GJN
H
Ind
epen
den
t ho
spita
ls
Note: pre-operative days counted as days from date of admission to date of operation; post-operative days calculated as the difference between the number of pre-operative days and the total length of stay in orthopaedic care (where short (<=7 days) transfers to other facilities were not considered to end the patient’s orthopaedic care stay).
Includes elective patients only; bilateral operations counted twice.

Scottish Arthroplasty Project Annual Report 2018
34
4. Complications arising from arthroplasty procedures
The major complications covered in this report are:
• Deep Vein Thrombosis/Pulmonary Embolism (DVT/PE)
• Death
• Dislocation of Hip
• Infection
• Acute Myocardial Infarction (AMI)
• Acute Renal Failure
• Cerebrovascular Accident (CVA) or Stroke
Complication rates have been standardised for the type of operation and the report covers the years from 2000-2017.
4.1 National trends
DVT/PE
The national rate for DVT/PE has fallen from 1.4% in 2000 to 0.8% in 2017 for hip arthroplasty. This is shown in Figure 8a and appears to have reached a plateau. The rates are the same for knee arthroplasty in 2017 and again it is good to see the rates reducing.
Death Rate
The rate of death following hip and knee arthroplasty continues to be low at less than 0.5% as in the last report. The rate following hip arthroplasty in 2017 was 0.2% and following knee arthroplasty was 0.2% in 2017. This has fallen since 2000 from 0.8% and 0.6% respectively which is great progress (Figures 8a and 8c).
Dislocation after Hip Arthroplasty
Dislocation within one year of hip arthroplasty has been falling since the beginning of data collection in 2000. The rate of dislocation in 2016 was 0.6% and in 2000 was 1.2%, so the overall trend is continuing to fall which is very pleasing (Figure 8b).
Infection
The rates of infection following hip arthroplasty remain low at less than 1%, but the 2015 figures were the lowest recorded since the beginning of the data collection, at 0.7%. 2017 figures show a slight rise to 0.9% but still under the 1% mark. Following knee arthroplasty, the incidence of infection within a year also remains at less than 1%, and has fallen to the lowest rate recorded of 0.8% in 2016 data, again with a slight rise to 0.9% in 2017. The standardised complication rate in 2000 was 1.4% (Figure 8b).

Scottish Arthroplasty Project Annual Report 2018
35
Acute Myocardial Infarction (AMI)
The rate of AMI after hip and knee arthroplasty remains very low in Scotland and data is comparable to the last report.
Acute Renal Failure
The last two reports have highlighted the rising incidence of acute renal failure following hip and knee arthroplasty. The national data presented in Figure 8e shows the gradual rise in incidence from 2000, with a definite change from 2009 onwards. Rates are now at around 2% nationally, which is still concerning. There has been a slight fall in the percentage since the last report, so this may be due to an increased awareness and action being taken at Health Board level. Rates for acute renal failure following hip arthroplasty are 2.2% (2.3% in 2016) and following knee arthroplasty are 2.1% (2.4% in 2016). In 2000 the figures were 0.2% and 0.3% respectively.
Cerebrovascular Accident or Stroke
The national average of CVA or stroke following hip and knee arthroplasty remains low at less than 0.4% over the years 2013-2017.
Figure 8a — National rates for complications within 90 days: hip arthroplasty
DVT/PE within 90 days Death within 90 days
Com
plc
iatio
n R
ate
(%)
0.0
0.5
1.0
1.5
2.0
2.5
2000 2001 2002 2003 2004 2005 2006 2007 2008 2009 2010 2011 2012 2013 2014 2015 2016 2017
Includes emergency admissions; bilateral operations counted only once; includes known patients from independent hospitals.

Scottish Arthroplasty Project Annual Report 2018
36
Figure 8b — National rates for complications within 1 year: hip arthroplasty
Dislocation within a year Infection within a year
Com
plc
iatio
n R
ate
(%)
0.0
0.5
1.0
1.5
2.0
2000 2001 2002 2003 2004 2005 2006 2007 2008 2009 2010 2011 2012 2013 2014 2015 2016
Includes emergency admissions; bilateral operations counted only once; includes known patients from independent hospitals.
Figure 8c — National rates for complications within 90 days: knee arthroplasty
DVT/PE within 90 days Death within 90 days
Com
plc
iatio
n R
ate
(%)
0.0
0.5
1.0
1.5
2.0
2.5
2000 2001 2002 2003 2004 2005 2006 2007 2008 2009 2010 2011 2012 2013 2014 2015 2016 2017
Includes emergency admissions; bilateral operations counted only once; includes known patients from independent hospitals.

Scottish Arthroplasty Project Annual Report 2018
37
Figure 8d — National rates for complications within 1 year: knee arthroplasty
Infection within a year
Com
plc
iatio
n R
ate
(%)
0.0
0.5
1.0
1.5
2.0
2.5
2000 2001 2002 2003 2004 2005 2006 2007 2008 2009 2010 2011 2012 2013 2014 2015 2016
Includes emergency admissions; bilateral operations counted only once; includes known patients from independent hospitals.
Figure 8e — National rates for acute renal failure within 30 days: hip and knee arthroplasty
Hip Knee
Com
plc
iatio
n R
ate
(%)
0.0
0.5
1.0
1.5
2.0
2.5
2000 2001 2002 2003 2004 2005 2006 2007 2008 2009 2010 2011 2012 2013 2014 2015 2016 2017
Includes emergency admissions; bilateral operations counted only once; includes known patients from independent hospitals.

Scottish Arthroplasty Project Annual Report 2018
38
4.2 Complication funnel chartsThe following data are presented as funnel charts where the upper confidence limit is shown as an upper curved line on the plot, and this represents a warning threshold derived from the national rate and numbers of operations occurring.
Rates of complication which appear above this line are a possible cause for concern and should be investigated by the health boards concerned.
The straight line coloured in green is the national rate (averaged over a period of 5 years) to allow comparisons between centres.
Complications which relate to a one year follow up period are calculated for procedures performed during 2016. Complete data is not currently available to allow complication rates for procedures performed during 2017 to be calculated. For example, an operation performed on 31st December 2017 could have a possible complication recorded up until 31st December 2018.
4.2.1 Dislocation within one year
No Health Boards were outliers for dislocation. The national average rate from 2012 to 2016 was 0.81%.
Figure 9 — Percentage of 2016 primary hip arthroplasty patients with subsequent dislocation within 1 year
Number of operations
NHS Board of Treatment (NHS GG&C split)
National complication rate (%)
Sta
ndar
dis
ed r
ate
(%)
Upper con�dencelimit
Ayrshire & Arran
Borders
Dumfries & Galloway
Fife
Forth ValleyGrampian
North Glasgow
South Glasgow
ClydeHighland
LanarkshireLothian
Tayside
Western Isles
GJNH
0
0.5
1
1.5
2
2.5
3
0 200 400 600 800 1000 1200 1400 1600
Scottish Rate averaged over 5 years 2012-2016.

Scottish Arthroplasty Project Annual Report 2018
39
4.2.2 Infection within one year
For hip arthroplasty, the national average rate from 2012 to 2016 was 0.94% for which 9 Health Boards were above the national average and 6 below. Infection of primary hip arthroplasty within one year showed no outliers during 2016. This is identical to the last report.
For knee arthroplasty, the national average rate from 2012 to 2016 was 1.00% with 10 Health Boards above the national average and 5 below. Of the Health Boards above the national average rate 1 Health Board was found to be an outlier for infection following primary knee arthroplasty.
Figure 10 — Percentage of 2016 primary hip arthroplasty patients with subsequent infection within 1 year
Sta
ndar
dis
ed
rate
(%)
Number of operations
NHS Board of Treatment(NHS GG&C split)
Upper con�dencelimit
National complicationrate (%)
Ayrshire & Arran
Borders
Dumfries & Galloway
Fife
Forth Valley
Grampian
North Glasgow
South Glasgow
Clyde
Highland
Lanarkshire
Lothian
Tayside
Western Isles
GJNH
0
0.5
1
1.5
2
2.5
3
0 200 400 600 800 1000 1200 1400 1600
Scottish Rate averaged over 5 years 2012-2016.
There was one outlying NHS Board for infection after primary knee arthroplasty. Ten boards were above the national average and six below. There was clustering around the national average.

Scottish Arthroplasty Project Annual Report 2018
40
Figure 11 — Percentage of 2016 primary knee arthroplasty patients with subsequent infection within 1 year
Sta
ndar
dis
ed
rate
(%)
Number of operations
NHS Board of Treatment(NHS GG&C split)
Upper con�dencelimit
National complicationrate (%)
Ayrshire & ArranBorders
Dumfries & Galloway
Fife
Forth Valley
GrampianNorth Glasgow
South Glasgow
ClydeHighland Lanarkshire
Lothian
Tayside
Western Isles
0
0.5
1
1.5
2
2.5
3
0 200 400 600 800 1000 1200 1400 1600 1800
GJNH
Scottish Rate averaged over 5 years 2012-2016.
4.2.3 Deep vein thrombosis/pulmonary embolism (DVT/PE) within 90 days
The national average rate from 2013 to 2017 was 0.79% for hip and knee arthroplasty. For primary hip arthroplasty, 6 Health Boards were above the national average, but clustered away from the upper confidence limit with no outliers – similar to what we reported last year. Likewise for primary knee arthroplasty, 8 Health Boards have complication rates above the national average with no outliers.
Figure 12 — Percentage of 2017 primary hip arthroplasty patients with subsequent DVT/PE within 90 days
Sta
ndar
dis
ed
rate
(%)
Number of operations
NHS Board of Treatment(NHS GG&C split)
Upper con�dencelimit
National complicationrate (%)
Ayrshire & Arran
Borders
Dumfries & Galloway
Fife
Forth Valley
Grampian
North Glasgow
South Glasgow
Clyde
Highland
Lanarkshire
Lothian
Tayside
Western Isles
GJNH
0
0.5
1
1.5
2
2.5
3
0 200 400 600 800 1000 1200 1400 1600
Scottish Rate averaged over 5 years 2013-2017.

Scottish Arthroplasty Project Annual Report 2018
41
Figure 13 — Percentage of 2017 primary knee arthroplasty patients with subsequent DVT/PE within 90 days
Sta
ndar
dis
ed
rate
(%)
Number of operations
NHS Board of Treatment(NHS GG&C split)
Upper con�dencelimit
National complicationrate (%)
Ayrshire & Arran
Fife
Forth Valley
Grampian
South Glasgow
Clyde
Highland
Lanarkshire
Lothian
TaysideWestern Isles
GJNH
Borders
0
0.5
1
1.5
2
2.5
3
0 200 400 600 800 1000 1200 1400 1600 1800
Dumfries & Galloway North
Glasgow
Scottish Rate averaged over 5 years 2013-2017.

Scottish Arthroplasty Project Annual Report 2018
42
4.2.4 Death within 90 days
Rates remain low with an average from 2013 to 2017 of 0.26% and 0.22% for primary hip and primary knee arthroplasty respectively. For primary hip arthroplasty, there were 7 Health Boards above the national average rate but remain sufficiently far away from the upper confidence limit. Similarly, for primary knee arthroplasty, there were 9 Health Boards with above the average rate but no outliers.
Figure 14 — Percentage of 2017 primary hip arthroplasty patients who died within 90 days
Sta
ndar
dis
ed
rate
(%)
Number of operations
NHS Board of Treatment(NHS GG&C split)
Upper con�dencelimit
National complicationrate (%)
Ayrshire& ArranBorders
Dumfries &Galloway
Fife
ForthValley
Grampian
NorthGlasgow South
Glasgow
Clyde
Highland
Lanarkshire
Lothian
Tayside
Western Isles
GJNH
0
0.5
1
1.5
2
2.5
0 200 400 600 800 1000 1200 1400 1600 1800
Scottish Rate averaged over 5 years 2013-2017.
Figure 15 — Percentage of 2017 primary knee arthroplasty patients who died within 90 days
Sta
ndar
dis
ed
rate
(%)
Number of operations
NHS Board of Treatment(NHS GG&C split)
Upper con�dencelimit
National complicationrate (%)
Ayrshire & ArranBorders
Dumfries & Galloway
Fife
Forth ValleyGrampianNorth
Glasgow South Glasgow
Clyde
Highland
Lanarkshire
LothianTayside
Western Isles GJNH
0
0.2
0.4
0.6
0.8
1
1.2
1.4
0 200 400 600 800 1000 1200 1400 1600 1800
Scottish Rate averaged over 5 years 2013-2017.
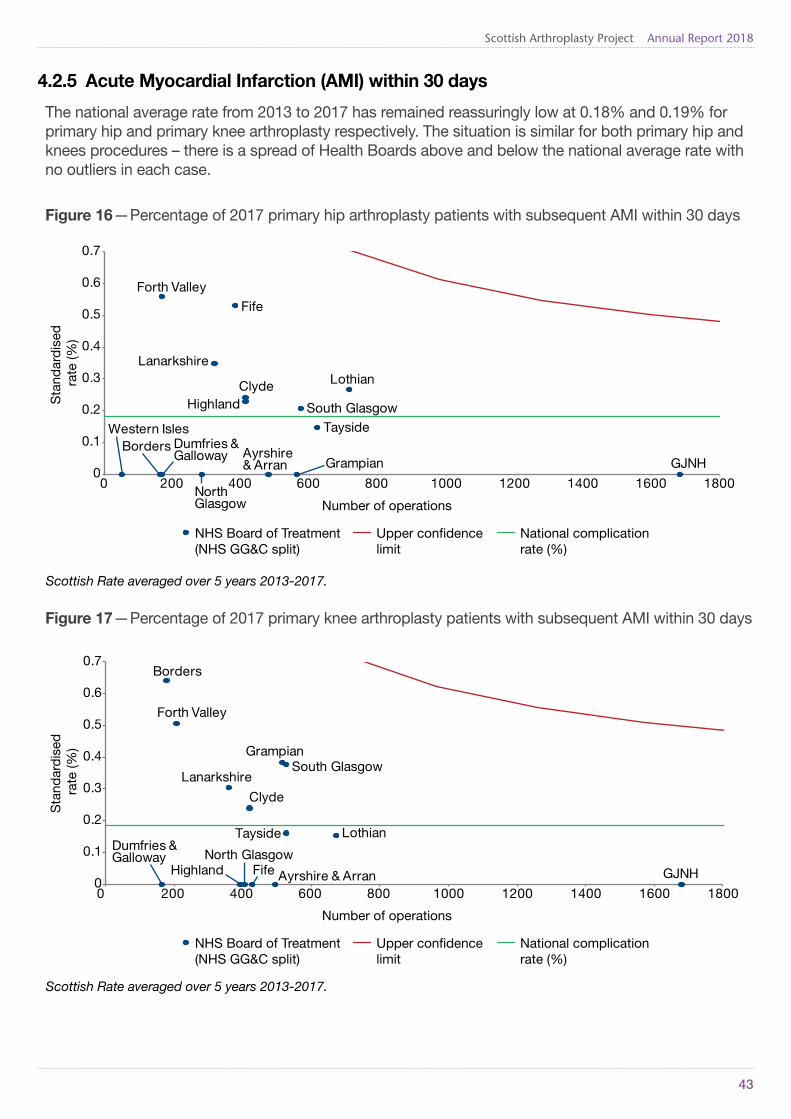
Scottish Arthroplasty Project Annual Report 2018
43
4.2.5 Acute Myocardial Infarction (AMI) within 30 days
The national average rate from 2013 to 2017 has remained reassuringly low at 0.18% and 0.19% for primary hip and primary knee arthroplasty respectively. The situation is similar for both primary hip and knees procedures – there is a spread of Health Boards above and below the national average rate with no outliers in each case.
Figure 16 — Percentage of 2017 primary hip arthroplasty patients with subsequent AMI within 30 days
Sta
ndar
dis
ed
rate
(%)
Number of operations
NHS Board of Treatment(NHS GG&C split)
Upper con�dencelimit
National complicationrate (%)
Ayrshire& Arran
Borders Dumfries &Galloway
Fife
Forth Valley
Grampian
NorthGlasgow
South Glasgow
ClydeHighland
LanarkshireLothian
TaysideWestern Isles
GJNH0
0.1
0.2
0.3
0.4
0.5
0.6
0.7
0 200 400 600 800 1000 1200 1400 1600 1800
Scottish Rate averaged over 5 years 2013-2017.
Figure 17 — Percentage of 2017 primary knee arthroplasty patients with subsequent AMI within 30 days
Sta
ndar
dis
ed
rate
(%)
Number of operations
NHS Board of Treatment(NHS GG&C split)
Upper con�dencelimit
National complicationrate (%)
Ayrshire & Arran
Borders
Dumfries & Galloway
Fife
Forth Valley
Grampian
North Glasgow
South Glasgow
Clyde
Highland
Lanarkshire
LothianTayside
GJNH0
0.1
0.2
0.3
0.4
0.5
0.6
0.7
0 200 400 600 800 1000 1200 1400 1600 1800
Scottish Rate averaged over 5 years 2013-2017.

Scottish Arthroplasty Project Annual Report 2018
44
4.2.6 Acute renal failure within 30 days
The incidence of acute renal failure after hip or knee arthroplasty has risen since 2009. This year’s data appears to show a slight decrease which is welcome (Figure 8e). The national average rate from 2013 to 2017 was 1.60% and 1.69% for primary hip and primary knee arthroplasty respectively.
For primary hips the majority of Health Boards were shown to have rates above the national average with rates varying from a minimum of 0.52% to a maximum of 6.10%. Of the Health Boards with rates above the national average 3 were identified as outliers.
Figure 18 — Percentage of 2017 primary hip arthroplasty patients with subsequent acute renal failure within 30 days
Sta
ndar
dis
ed
rate
(%)
Number of operations
NHS Board of Treatment(NHS GG&C split)
Upper con�dencelimit
National complicationrate (%)
Ayrshire & Arran
Borders
Dumfries & Galloway
Fife
Forth Valley
Grampian
North Glasgow
South Glasgow
Clyde
Highland
Lanarkshire
Lothian
Tayside
Western Isles
GJNH
0
1
2
3
4
5
6
7
8
0 200 400 600 800 1000 1200 1400 1600 1800
Scottish Rate averaged over 5 years 2013-2017.
For primary knees, again, the majority of Health Boards have rates which are above the national average ranging from a minimum of 0.59% to a maximum of 5.16%. In this case, 4 Health Boards were identified as outliers although 1 is on the upper confidence limit.

Scottish Arthroplasty Project Annual Report 2018
45
Figure 19 — Percentage of 2017 primary knee arthroplasty patients with subsequent acute renal failure within 30 days
Sta
ndar
dis
ed
rate
(%)
Number of operations
NHS Board of Treatment(NHS GG&C split)
Upper con�dencelimit
National complicationrate (%)
Ayrshire & Arran
Borders
Dumfries & Galloway
Fife
Forth ValleyGrampian
North Glasgow
South Glasgow
Clyde
HighlandLanarkshire
LothianTayside
Western Isles
GJNH
0
2
4
6
8
10
0 200 400 600 800 1000 1200 1400 1600 1800
Scottish Rate averaged over 5 years 2013-2017.
4.2.7 CVA/Stroke within 30 days
The national average rate from 2013 to 2017 was 0.33% and 0.39% for primary hip and primary knee arthroplasty respectively. There is a mix of Health Boards above and below the national average and no Health Boards identified as outliers against both procedures. Rates remain quite low, with the highest incidence being 0.64% following hip arthroplasty, and lowest 0%. Following knee arthroplasty, the highest incidence was 1.01% and the lowest 0%. These rates are to be falling year-on-year.
Figure 20 — Percentage of 2017 primary hip arthroplasty patients with subsequent stroke within 30 days
Sta
ndar
dis
ed
rate
(%)
Number of operations
NHS Board of Treatment(NHS GG&C split)
Upper con�dencelimit
National complicationrate (%)
Ayrshire & Arran
Borders
Dumfries & Galloway
FifeForth Valley
Grampian
North Glasgow
South Glasgow
ClydeHighland
Lanarkshire
Lothian
TaysideWestern Isles
GJNH
0
0.2
0.4
0.6
0.8
1
1.2
1.4
0 200 400 600 800 1000 1200 1400 1600 1800
Scottish Rate averaged over 5 years 2013-2017.

Scottish Arthroplasty Project Annual Report 2018
46
Figure 21 — Percentage of 2017 primary knee arthroplasty patients with subsequent stroke within 30 days
Sta
ndar
dis
ed
rate
(%)
Number of operations
NHS Board of Treatment(NHS GG&C split)
Upper con�dencelimit
National complicationrate (%)
Ayrshire & Arran
Borders
Dumfries & GallowayFife
Forth Valley
Grampian
North Glasgow
South Glasgow
Clyde
Highland
LanarkshireLothian
TaysideWesternIsles
GJNH
0
0.2
0.4
0.6
0.8
1
1.2
1.4
0 200 400 600 800 1000 1200 1400 1600 1800
Scottish Rate averaged over 5 years 2013-2017.

Scottish Arthroplasty Project Annual Report 2018
47
5. Revision Rates
Revisions are calculated within 1 year, 3 years, 5 years and 7 years for primary hip and primary knee arthroplasty procedures..
The national rate for hip arthroplasty with subsequent revision within 1 year shows a downward trend with an upward trend at the 5 year point. This may reflect problems with large metal on metal bearings including hip resurfacing arthroplasties. Revision of hips with these bearings may have caused a bulge in national revision numbers over the last decade (Figure 1c).
5.1 Hips
Figure 22a — Total number of revisions to primary hip arthroplasties in Scotland per year
Year of primary operation
revisions within a year revisions within 3 yearsrevisions within 5 years revisions within 7 years
Tota
l num
ber
of r
evis
ions
65
88
134147
0
50
100
150
200
250
2005 2006 2007 2008 2009 2010 2011 2012 2013 2014 2015 2016
Includes elective patients only; bilateral operations counted twice; includes known patients from independent hospitals.

Scottish Arthroplasty Project Annual Report 2018
48
Figures 22b and 22c demonstrate the percentage of patients who underwent revision of a primary total hip replacement within 7 years. Figure 22b includes metal on metal resurfacing and 22c excludes these procedures. It is not possible to identify large head metal on metal total hip replacements which may have an impact on the figures from individual units. It will clearly take a number of years for any improvement measures which have been implemented by individual units to become apparent.
Figure 22b — Percentage of primary hip arthroplasty patients from 2006 - 2010 with subsequent revision within 7 years up to 31st December 2017: THR + resurfacing
Southern General Hospital
Western In�rmary
University Hospital Monklands
Perth Royal In�irmary
0
1
2
3
4
5
6
7
8
9
10
0 500 1000 1500 2000 2500 3000 3500 4000 4500 5000
Rev
isio
ns <
7 y
ears
(%)
Number of operations
Hospital Upper con�dence limit National revision rate (%)
Note: Please see supplementary excel tables for more detailed information
Figure 22c — Percentage of primary hip arthroplasty patients from 2006 - 2010 with subsequent revision within 7 years up to 31st December 2017: THR only
Rev
isio
ns <
7 y
ears
(%)
Number of operations
Hospital Upper con�dence limit National revision rate (%)
Southern General Hospital
Western In�rmary
University Hospital Monklands
Perth Royal In�rmary
0
1
2
3
4
5
6
7
8
9
10
0 500 1000 1500 2000 2500 3000 3500 4000 4500 5000
Note: Please see supplementary excel tables for more detailed information

Scottish Arthroplasty Project Annual Report 2018
49
Figures 22d and 22e show an increase in complication rates (from last year) resulting from revision hip procedures nationally, other than death at 90 days, although there has been a decline from 2000.
Figure 22d — National rates for complications within 90 days: hip revisions
0.0
0.5
1.0
1.5
2.0
2.5
2000 2001 2002 2003 2004 2005 2006 2007 2008 2009 2010 2011 2012 2013 2014 2015 2016 2017
Com
plic
atio
n R
ate
(%)
Year of revision
DVT/PE within 90 days Death within 90 days
Bilateral operations counted only once.
Figure 22e — National rates for complications within 1 year: hip revisions
Com
plic
atio
n R
ate
(%)
Year of revision
Dislocation within a year Infection within a year
0.0
1.0
2.0
3.0
4.0
5.0
6.0
2000 2001 2002 2003 2004 2005 2006 2007 2008 2009 2010 2011 2012 2013 2014 2015 2016
Bilateral operations counted only once
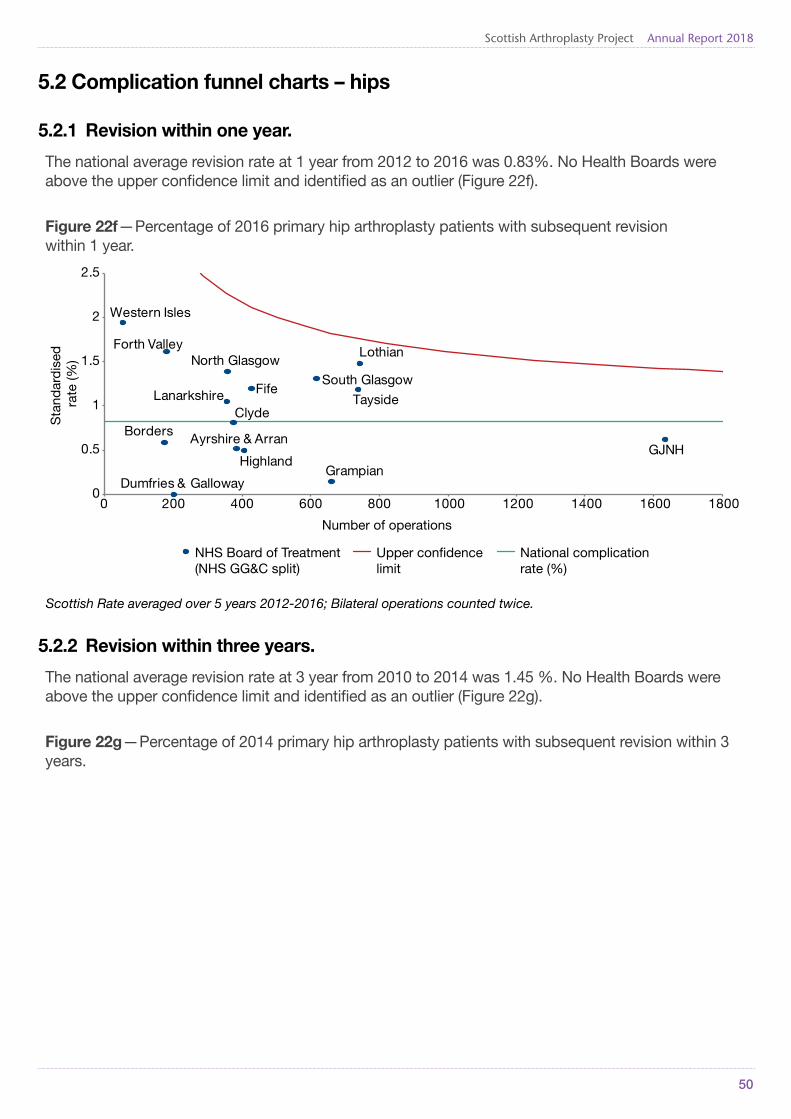
Scottish Arthroplasty Project Annual Report 2018
50
5.2 Complication funnel charts – hips
5.2.1 Revision within one year.
The national average revision rate at 1 year from 2012 to 2016 was 0.83%. No Health Boards were above the upper confidence limit and identified as an outlier (Figure 22f).
Figure 22f — Percentage of 2016 primary hip arthroplasty patients with subsequent revision within 1 year.
Sta
ndar
dis
ed
rate
(%)
Number of operations
NHS Board of Treatment(NHS GG&C split)
Upper con�dencelimit
National complicationrate (%)
Ayrshire & ArranBorders
Dumfries & Galloway
Fife
Forth Valley
Grampian
North GlasgowSouth Glasgow
Clyde
Highland
Lanarkshire
Lothian
Tayside
Western Isles
GJNH
0
0.5
1
1.5
2
2.5
0 200 400 600 800 1000 1200 1400 1600 1800
Scottish Rate averaged over 5 years 2012-2016; Bilateral operations counted twice.
5.2.2 Revision within three years.
The national average revision rate at 3 year from 2010 to 2014 was 1.45 %. No Health Boards were above the upper confidence limit and identified as an outlier (Figure 22g).
Figure 22g — Percentage of 2014 primary hip arthroplasty patients with subsequent revision within 3 years.

Scottish Arthroplasty Project Annual Report 2018
51
Sta
ndar
dis
ed
rate
(%)
Number of operations
NHS Board of Treatment(NHS GG&C split)
Upper con�dencelimit
National complicationrate (%)
Ayrshire & Arran
Borders
Dumfries & Galloway
Fife
Forth Valley Grampian
North Glasgow
South Glasgow
Clyde
Highland
Lanarkshire
Lothian
Tayside
Western Isles
0
1
2
3
4
5
6
7
0 200 400 600 800 1000 1200
Scottish Rate averaged over 5 years 2010-2014; Bilateral operations counted twice.
5.2.3 Revision within five years.
The national average revision rate at 5 year from 2008 to 2012 was 2.12%. No Health Boards were above the upper confidence limit and identified as an outlier (Figure 22h).
Figure 22h — Percentage of 2012 primary hip arthroplasty patients with subsequent revision within 5 years.
Sta
ndar
dis
ed
rate
(%)
Number of operations
NHS Board of Treatment(NHS GG&C split)
Upper con�dencelimit
National complicationrate (%)
Ayrshire & Arran
Borders
Dumfries & Galloway
FifeForth Valley
Grampian
North Glasgow
South Glasgow
Clyde
HighlandLanarkshire
LothianTayside
Western Isles0
1
2
3
4
5
0 200 400 600 800 1000
Scottish Rate averaged over 5 years 2008-2012; Bilateral operations counted twice.

Scottish Arthroplasty Project Annual Report 2018
52
5.3 KneesThe number of knee arthroplasties being revised shows an increase at 1, 3 and 5 years with a continuing downward trend at 7 years (Figure 23a).
Figure 23a — Total number of revisions to primary knee arthroplasties in Scotland per year
Year of primary operation
revisions within a year revisions within 3 yearsrevisions within 5 years revisions within 7 years
Tota
l num
ber
of r
evis
ions
45
129
168
194
0
50
100
150
200
250
2005 2006 2007 2008 2009 2010 2011 2012 2013 2014 2015 2016
Elective patients only; Includes known patients from private hospitals; bilateral operations counted twice.
Figure 23b shows an increase in both DVT/PE rates at 90 days and death rates at 90 days. These increases are however small, 0.5% to 0.7% and 0.2% to 0.5% respectively.
Figure 23b — National rates for complications within 90 days: knee revisions
0.0
0.5
1.0
1.5
2.0
2.5
2000 2001 2002 2003 2004 2005 2006 2007 2008 2009 2010 2011 2012 2013 2014 2015 2016 2017
Com
plic
atio
n R
ate
(%)
Year of revisionDVT/PE within 90 days Death within 90 days
Bilateral operations counted only once
The infection rate for knee revisions has continued to fall and is now 3.4%. This is the lowest rate since 2000.

Scottish Arthroplasty Project Annual Report 2018
53
Figure 23c — National rates for complications within 1 year: knee revisions
Com
plic
atio
nra
te (%
)
Year of revision
Infection within a year
0
2
4
6
8
10
12
14
2000 2001 2002 2003 2004 2005 2006 2007 2008 2009 2010 2011 2012 2013 2014 2015 2016
Bilateral operations counted only once.
5.4 Complication funnel charts – knees
5.4.1 Revision within one year.
The national average revision rate at 1 year from 2012 to 2016 was 0.45%. No Health Boards were above the upper confidence limit and identified as an outlier (Figure 23d).
Figure 23d — Percentage of 2016 primary knee arthroplasty patients with subsequent revision within 1 year
Ayrshire & Arran
Borders
Dumfries & Galloway
Fife
Forth Valley
Grampian
North Glasgow
South GlasgowClyde
Highland
Lanarkshire
LothianTayside
GJNH
0
0.2
0.4
0.6
0.8
1
1.2
1.4
1.6
1.8
2
0 200 400 600 800 1000 1200 1400 1600 1800
Sta
ndar
dis
ed r
ate
(%)
Number of operationsNHS Board of Treatment(NHS GG&C split)
Upper con�dencelimit
National complicationrate (%)
Scottish Rate averaged over 5 years 2012-2016; Bilateral operations counted twice.

Scottish Arthroplasty Project Annual Report 2018
54
5.4.2 Revision within three years.
The national average revision rate at 3 year from 2010 to 2014 was 1.60 %. No Health Boards were above the upper confidence limit and identified as an outlier (Figure 23e).
Figure 23e — Percentage of 2014 primary knee arthroplasty patients with subsequent revision within 3 years
Ayrshire & Arran
Borders
Dumfries & Galloway
Fife
Forth Valley GrampianNorth Glasgow
South Glasgow
Clyde
Highland
Lanarkshire
Lothian
Tayside
GJNH
0
0.5
1
1.5
2
2.5
3
3.5
0 200 400 600 800 1000 1200 1400
Sta
ndar
dis
ed r
ate
(%)
Number of operations
NHS Board of Treatment (NHS GG&C split)
Upper con�dence limit
National complication rate (%)
Scottish Rate averaged over 5 years 2010-2014; Bilateral operations counted twice.

Scottish Arthroplasty Project Annual Report 2018
55
5.4.3 Revision within five years (Figure 23f).
The national average revision rate at 5 year from 2008 to 2012 was 2.51%. No Health Boards were above the upper confidence limit and identified as an outlier (Figure 23f).
Figure 23f — Percentage of 2012 primary knee arthroplasty patients with subsequent revision within 5 years
Sta
ndar
dis
ed
rate
(%)
Number of operations
NHS Board of Treatment(NHS GG&C split)
Upper con�dencelimit
National complicationrate (%)
Ayrshire & Arran
Borders
Dumfries & GallowayFife
Forth Valley
Grampian
North Glasgow
South Glasgow
Clyde
Highland
Lanarkshire
LothianTayside
Western Isles
GJNH
0
1
2
3
4
5
6
0 200 400 600 800 1000 1200
Scottish Rate averaged over 5 years 2008-2012; Bilateral operations counted twice.
When combined, the numbers of revision hip and knee arthroplasties show an upwards trend at 1, 3 and 5 years.
Figure 24a — Total number of revisions of primary hip and knee arthroplasties in Scotland per year
Year of primary operation
revisions within a year revisions within 3 yearsrevisions within 5 years revisions within 7 years
Tota
l num
ber
of r
evis
ions
110
217
302341
0
50
100
150
200
250
300
350
400
450
500
2005 2006 2007 2008 2009 2010 2011 2012 2013 2014 2015 2016
Elective patients only; Includes known patients from private hospitals; bilateral operations counted twice.

Scottish Arthroplasty Project Annual Report 2018
56
5.5 Acute Renal FailureThe rates for acute renal failure for hip revision and knee revision is around 2% (1.81% and 2.24% respectively). There is an apparent upward trend in the rate of renal failure. This should be interpreted with caution as the underlying reason is unclear and may be related to change in definition of renal failure, coding practice, enhanced recovery or changes in prophylactic antibiotic usage. We will continue to observe future trends.
Figure 24b — National rates for acute renal failure within 30 days: hip and knee revisions
Year of revision
Hip revision Knee revision
Com
plic
atio
nra
te (%
)
0.0
0.5
1.0
1.5
2.0
2.5
3.0
3.5
4.0
2000 2001 2002 2003 2004 2005 2006 2007 2008 2009 2010 2011 2012 2013 2014 2015 2016 2017

Scottish Arthroplasty Project Annual Report 2018
57
6. Clinical Governance
6.1 What is clinical governance?Clinical Governance: ’A framework through which NHS organisations are accountable for continually improving the quality of their services and safeguarding high standards of care by creating an environment in which excellence in clinical care will flourish.’3
Clinical Governance is the system used by NHS organisations to monitor and review the quality of healthcare provided so that high standards of care are maintained and patient safety improved. Since 2004, with the support of the Scottish Committee for Orthopaedics and Trauma (SCOT), the policy of the Scottish Arthroplasty Project (SAP) has been to provide high quality data on activity and complications that can be used at a local level to promote quality improvement. Simple monitoring of activity and quality may influence clinical practice but can be insufficient to create significant change. With the support of the SCOT committee, the SAP operates a feedback and review system at consultant level to identify potential quality issues.
6.2 Statistical analysis of complication rates associated with arthroplastyEach month analysts within the Information Services Division (ISD) of NHS National Services Scotland (NHS NSS) calculate the complication rates for all consultants carrying out arthroplasty operations on NHS patients in Scotland.
Since 2010, SAP has used CUSUM (CUmulative SUMmation) methodology to allow us to identify increasing complication rates amongst surgeons with an excellent visual impact when displayed graphically. It has been in use in the UK from as early as 1954 for industrial quality control analysis4 . In clinical disciplines it has been used in cardiothoracic surgery during the past 15 years5 and has been shown to be a superior form of statistical analysis for identifying complications6 .
In simple terms, operations are plotted on a graph as a rate over time. If an operation has an associated complication, the CUSUM rate increases markedly. Subsequent operations without known complications bring the rate down by smaller increments. Three of these ‘jumps’ for the same type of complication in close succession, will raise the CUSUM rate over an agreed control limit and the consultant will be identified as an “outlier”. In practice the limit is usually breached over longer periods of time, which include more ‘jumps’ but also many incremental decreases through successful operations. Two examples are presented in Appendix C.
6.3 Quality Improvement through Case Review and Action PlanWhen outliers are identified, recipients are asked to undertake local review and audit to investigate the reasons for the increased rate in complications and to develop an action plan to reduce their recurrence. The introduction of a new technique, a new implant or particular case mix issues may be identified as reasons for an apparent rise.
Comments, case reviews and audit finding are returned to SAP analysts within ISD. The review process is administered by analysts within NHS Information and Intelligence Services and is subject to NHS confidentiality policy – individual consultant responses are anonymised before being passed onto the SAP committee for review.

Scottish Arthroplasty Project Annual Report 2018
58
Clinical members of the Scottish Arthroplasty Project Steering Committee (SAPSC) grade these reviews and provide feedback. In the very rare occasions when a the response is viewed as less than satisfactory, a resubmission is requested and the issue may be transferred to senior management within the appropriate NHS Board.
The purpose of reviewing outliers is to emphasise quality improvement, rather than to attribute blame. The aim of the review process is to continue to encourage local review of clinical practice and data quality, both of which contribute to the continual improvement of patient care.
Figure 25 — CUSUM outlier notifications during 2015-2017.
Jan-Mar2015
Apr-Jun2015
Jul-Sep2015
Oct-Dec2015
Jan-Mar2016
Apr-Jun2016
Jul-Sep2016
Oct-Dec2016
Num
ber
of
noti�
catio
ns
10 10
6
13
7
10
6
8
18
56
11
0
2
4
6
8
10
12
14
16
18
20
Jan-Mar2017
Apr-Jun2017
Jul-Sep2017
Oct-Dec2017
Figure 26 — CUSUM outlier notification by complication type during 2015-2017.
7
3
7
1
5
10
6
4
2
3
5
4
6
7
3
4
8
5
3
8
9
0 2 4 6 8 10 12
Hip dislocations within 365 days
Hip infections within 365 days
Knee infections within 365 days
Hip DVT/PE within 90 days
Knee DVT/PE within 90 days
Hip revisions within 3 years
Knee revisions within 3 years
Number of noti�cations
201720162015

Scottish Arthroplasty Project Annual Report 2018
59
References
1 The association between surgical volume and failure of primary total hip replacement in England and Wales: Findings from the National Joint Registry of England, Wales, Northern Ireland and the Isle of Man. Adrian Sayers et al. Presented at ISAR Congress June 18 Reykjavik
2 Higher surgeon annual volume reduces the risk for adverse events within 90-days following primary total hip arthroplasty. A registry-based study of 13,180 cases in western Sweden. Per Jolback et al. Presented at ISAR Congress June 18 Reykjavik
3 Scally G and Donaldson LJ (1998) Clinical governance and the drive for quality improvement in the new NHS in England. British Medical Journal. 317 (7150) 4 July pp.61-65.
4 Page ES (1954). Continuous inspection schemes. Biometrika. 41:100 –115.
5 de Leval MR et al. (1994). Analysis of a cluster of surgical failures. Application to a series of neonatal arterial switch operations. J Thorac Car- diovasc Surg. 107:914–24
6 Novick R, et al. (2003). Analysis of the learning curve in telerobotic, beating heart coronary artery bypass grafting: a 90 patient experience. Ann Thor Surg. 76:749–53.

Scottish Arthroplasty Project Annual Report 2018
60
Appendix A
Data Sources
The Scottish Arthroplasty Project is administrated by the Information Services Division (ISD) of NHS National Services Scotland (NHS NSS), a special NHS Health Board. ISD use information submitted by Scottish hospitals (known as SMR01 data) to calculate statistical information related to NHS arthroplasty operations in Scottish hospitals.
Information on SMR01 is available here: http://www.isdscotland.org/Products-and-Services/Hospital-Records-Data-Monitoring/.
Data Completeness
All SMR01 data are required to be securely submitted to ISD no later than six weeks after the end of the month of discharge. Although Medical Records departments within hospitals and NHS Boards make every effort to comply, circumstances outwith their control may mean that this target is not always met. SMR01 data required for the analyses in this report are considered to be 100% complete.
Information on SMR01 data completeness is available here: http://www.isdscotland.org/Products-and-Services/Hospital-Records-Data-Monitoring/.
Arthroplasty coding
Information on codes used to identify arthroplasty operations is available here: Information on codes used to identify arthroplasty operations is available here: http://www.arthro.scot.nhs/OPCS_codes_summary_150710.pdf.

Scottish Arthroplasty Project Annual Report 2018
61
Appendix B to Section 6
In the case below (Figure 27), CUSUM is low until it rises suddenly to the control limit in 2015. Is the rise associated with a change in practise, perhaps a new technique?
Figure 27 — CUSUM chart showing a surgeon with a higher than expected complication rate following 3 complications in quick succession
19-Jan-2015
23-Feb-2015
30-Jun-2015
0
0.5
1
1.5
2
2012 2013 2014 2015 2016
CU
SU
M
In the following case (Figure 28), CUSUM rises steadily to the control limit (2.0). The complication rate is always slightly over average - is there an ongoing issue? When the Control Limit is reached the consultant would be notified that their complication rate had been unusually high and asked to complete a review and Action Plan.
Figure 28 — CUSUM chart showing a surgeon with a higher than expected complication rate following 5 complications over a period of 2.5 years
16-Jan-2013
06-Mar-2013
23-Jul-201309-Jul-2014
24-Jun-2015
0
0.5
1
1.5
2
2012 2013 2014 2015 2016
CU
SU
M

Scottish Arthroplasty Project Annual Report 2018
62
Contact
Martin O’Neill
Principal Information Analyst
martin.o’[email protected]
0131 275 6244
Martin Paton
Information Analyst
0141 207 1867
Email: [email protected]
If you have general questions about joint replacement in Scotland please contact Mr Roland Ingram, Chair of the Scottish Arthroplasty Project and Orthopaedic Consultant:
Mr Roland Ingram FRCS (Tr & Orth)
Chair of Scottish Arthroplasty Project
Consultant Orthopaedic Surgeon
Glasgow Royal Infirmary
Tel: 0141 211 4420 (secretary)
Email: [email protected]