NSROC REGIONAL STATE OF THE ENVIRONMENT REPORT · NSROC REGIONAL STATE OF THE ENVIRONMENT REPORT...
68
1 STATE OF THE ENVIRONMENT REPORT 2005 NSROC REGIONAL STATE OF THE ENVIRONMENT REPORT 2004 / 2005
Transcript of NSROC REGIONAL STATE OF THE ENVIRONMENT REPORT · NSROC REGIONAL STATE OF THE ENVIRONMENT REPORT...

1
STATE OF THE ENVIRONMENT REPORT 2005
NSROC REGIONAL STATE OF THE ENVIRONMENT REPORT
2004 / 2005
Northern Sydney Regional Organisation of Councils
Comprising the Councils ofHornsby, Hunters Hill, Ku-ring-gai, Lane Cove,
North Sydney, Ryde and Willoughby

3
STATE OF THE ENVIRONMENT REPORT 2005
PRESIDENT’S MESSAGEThe northern Sydney region is home to some of the most beautiful and accessible natural environments in Australia. As a long term resident I recognise how fortunate we are to have such a strong track record of environmental management and a broad and healthy environmental heritage. Nevertheless our environment is under constant threat from a wide variety of factors ranging from climate change to urban consolidation and now, more than ever, our communities must be vigilant and active in ensuring our environmental heritage is not lost or irretrievably damaged.
The Northern Sydney Regional Organisation of Councils (NSROC) is comprised of seven councils (Hornsby Shire, Hunter’s Hill, Ku-ring-gai, North Sydney, Lane Cove, City of Ryde, and Willoughby City) in the northern part of Sydney which have voluntarily come together to address regional issues, work co-operatively for the benefit of the region, and advocate on agreed regional positions and priorities. All of these councils work closely with their communities and state and federal counterparts to ensure that the environment is managed appropriately and in a sustainable manner, and the benefits of the environment are recognised and protected.
The recent housing boom and ongoing population growth in our region has put even more pressure on our environment. In recognition of this, the member councils of NSROC have come together to take a regional approach in monitoring environmental indicators and begin the process of managing environmental issues collectively. Such an approach enables us to pool scarce resources, share knowledge and lobby the state and federal governments more effectively.
Over the past 12 months the seven councils that make up NSROC have been working collaboratively to develop the first regional State of the Environment (SoE) report the region has ever produced. While producing this report has in many ways been a challenging process, it has also been a rewarding one. For the first time communities, councillors and staff active in monitoring and managing the environment have a reference document which examines environmental impacts and responses from a regional perspective. This process is incredibly valuable when you consider that our ecosystems are intrinsically connected and environmental issues do not neatly fall within political or administrative boundaries.
In the following pages you will find an abundance of information about the environment in the northern Sydney region, and the pressures it faces. We hope in future years that both the quality and quantity of this information will improve as the councils foster even stronger links and become more accustomed to taking a broader view. However this will not come at the cost of councils overlooking their responsibilities at a local level. Rather local decisions regarding the environment can now be made within an informed regional context.
The northern Sydney councils have historically shown a great deal of leadership in environmental issues and have won much praise and many awards for their innovative and consultative approaches in addressing environmental problems. I commend this regional SoE report to you as the next step in ensuring that the environment of our region receives the strategic, collusive and sustainable management approach it so richly deserves.
Pat Reilly Mayor of Willoughby Council President of NSROC
21 October 2005

4
NORTHERN SYDNEY REGIONAL ORGANISATION OF COUNCILS
CONTENTSAcronyms .........................................................................................................................5
Introduction 6The NSROC Region ..........................................................................................................6State of Environment Reporting ........................................................................................7Why a Regional SoE Report? ............................................................................................8The Future ........................................................................................................................8
Towards Environmental Sustainability 9Limitations ....................................................................................................................10Community Action .........................................................................................................10Corporate Action ...........................................................................................................11
Human Settlement 13Urban Development .......................................................................................................14Population Distribution ...................................................................................................16Aboriginal Heritage ........................................................................................................18Non-Aboriginal Heritage ................................................................................................19Urban Planning/Transport ..............................................................................................20Waste Management .......................................................................................................24Noise .............................................................................................................................26Energy Consumption ......................................................................................................27Water Consumption .......................................................................................................28Community Health .........................................................................................................31
Bushland and Biodiversity 33Bushland Management ..................................................................................................34Open Space ...................................................................................................................37Fire Management ...........................................................................................................38Introduced Flora and Fauna ............................................................................................39Native Flora and Fauna ...................................................................................................41
Water 44Water Quality .................................................................................................................45Catchment Management ...............................................................................................47Stormwater Management ..............................................................................................50
Atmosphere 52Air Quality .....................................................................................................................53Greenhouse Gas Emissions .............................................................................................54
Soil Landscape 57Acid Sulfate Soils ...........................................................................................................58Soil Erosion ....................................................................................................................58Land Contamination ......................................................................................................60
Appendices 62List of threatened species in the NSROC region from the Atlas of NSW Wildlife. .............62

5
STATE OF THE ENVIRONMENT REPORT 2005
ACRONYMS
AGO Australian Greenhouse Office
CBD Central Business District
CCP Cities for Climate Protection
CMP Conservation Management Plan
CRR Catchment Remediation Rate
CSIP Community Sustainability Indicators Project
DCP Development Control Plan
DEC Department of Environment and Conservation (formerly known as NSW EPA, see below)
DIPNR Department of Infrastructure, Planning and Natural Resources (formerly known as Planning NSW)
EPC Energy Performance Contract
ELR Employment Lands Review
EMP Estuary Management Plan
ESD Ecologically Sustainable Development
ICLEI International Council for Local Environmental Initiatives
KPI Key Performance Indicator
LEP Local Environmental Plan
LTP Local Transport Plan
NPWS National Parks and Wildlife Service
NSESD National Strategy for Ecologically Sustainable Development.
NSW EPA New South Wales Environment Protection Authority (now DEC)
NSROC Northern Sydney Regional Organisation of Councils (Hunters Hill, Hornsby Shire, Ku-ring-gai, Lane Cove, North Sydney, City of Ryde, Willoughby City)
RFS Rural Fire Service
SoE State of the Environment Report
SMP Stormwater Management Plan
TCM Total Catchment Management
PHO
TO: L
ES IR
WIG
PHO
TO: L
ES IR
WIG
PHO
TO: D
AV
ID R
AN
OLE

6
NORTHERN SYDNEY REGIONAL ORGANISATION OF COUNCILS
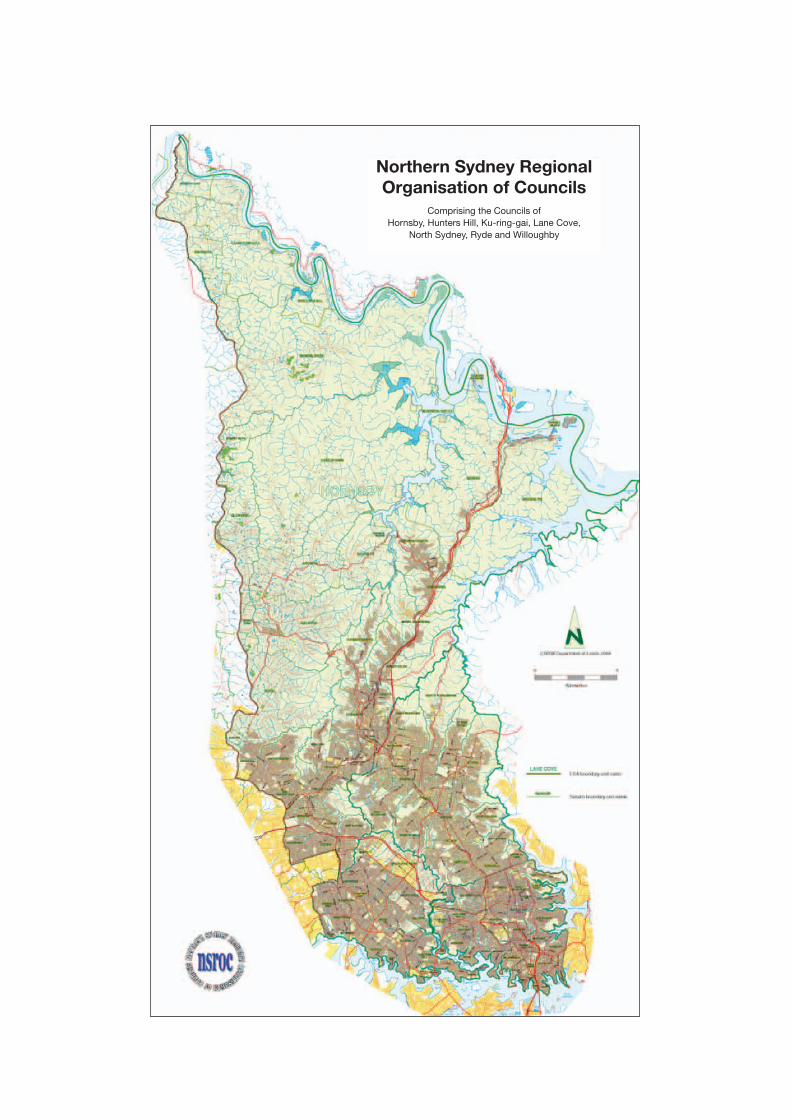
THE NSROC REGION
The Northern Sydney Regional
Organisation of Councils
(NSROC) covers a diverse area
of over 681 square kilometres and is home to over 500,000 people. It includes the local government
areas of North Sydney; Lane Cove; Willoughby City; Ku-ring-gai; Hornsby Shire; City of Ryde and
Hunters Hill which are collectively represented by NSROC. The region is home to a varied collection
of landscapes and communities. These range from scenic waterways, bush land parks and areas of
historical significance, through to residential high-rise living and thriving commercial and retail centres.
Such a large and disparate region provides many challenges to effective environmental management.
This is a result of the differing terrain, the significant number of people who inhabit the region, the
fragility of the environmental ecosystems and the lack of comprehensive scientific data regarding
environmental sustainability.
Introduction

7
STATE OF THE ENVIRONMENT REPORT 2005
Community, residential and tourist surveys regularly indicate that one of the chief attractions of the NSROC area is its environmental attributes. These attributes are commonly identified as an abundance of open space, healthy natural ecosystems, mature and substantial urban tree-scapes, the proximity to National Parks and bushland reserves, lack of pollution, and the prevalence of natural water bodies and water ways.
In part these environmental attributes have made this area of Sydney a popular place to live. It has resulted in steady and significant population growth over recent years exacerbated by the recent property boom. While most growth has occurred through the consolidation of already developed residential areas or within proscribed commercial and industrial centres, the growth in population, coupled with the on-going accumulative environmental impacts of over half a million people, has had inevitable environmental consequences.
For this reason the seven councils, which collectively make up NSROC, commissioned three studies, completed in 2005, to provide background information, data, recommendations and analysis of issues vital to the long term sustainability of the region. The three studies cover the economic, social and environmental impacts of population growth in the region from a local government perspective and suggest future actions which could ameliorate these impacts. Electronic copies and executive summaries can be viewed at www.nsroc.org
The report commissioned by NSROC on the likely impacts of future population growth on the environment in the region states: “Intensification of the population of the NSROC region will unavoidably impact on the key environmental assets that are highly valued by its residents. Some changes will be manageable, but others will be irreversible.” (The Potential Impacts of a Substantial Population Growth in the Northern Region of Sydney, Geoff Noonan, Sydney, 2005)
At the same time, new pressures on the NSROC environment have emerged through on-going drought, increased concerns over the risk of bushfires and water quality, the invasion of new pest and feral species, and changing lifestyle preferences such as increased private vehicle use and energy consumption.
In recognition of these pressures NSROC has for the first time undertaken to produce a regional State of the Environment (SoE) report so that appropriate responses and understanding can be developed at a regional, catchment or community level. It will also provide the resource benefits of the seven councils acting in a coordinated and collective fashion.
STATE OF ENVIRONMENT REPORTINGSince their inception, the northern Sydney councils have played a key role in managing the environment in close consultation with their communities through specific actions and policies. The relatively recent requirement for councils to complete annual SoE reports underlines both the serious nature of councils’ responsibilities and the necessity for environmental management to be a transparent and regulated process.
An SoE report is one of the corporate reporting responsibilities of New South Wales local government under the Local Government Act 1993. It is intended to provide the community with a report as to what condition the environment is in, why it got that way and what is being done to address the issues. SoE reports are important because they indicate to us what impacts we are having on the environment and enable us to manage those impacts and make necessary environmental improvements.
According to legislation, an SoE report must:
• Address the eight environmental sectors of land, air, water, biodiversity, waste, noise, Aboriginal heritage and non-Aboriginal heritage;
• Provide, as a basis of comparison in subsequent reports, a statement outlining the condition of each environmental sector at the date of the report and make the relevant comparison with the equivalent statement in the last SoE report;
• Report on all major environmental impacts and related activities, including management plans relating to the environment; special council projects relating to the environment; and the environmental impact of council’s activities.
Under recent amendments to the Local Government Act 1993, councils are required to prepare comprehensive reports every four years, with a supplementary report in each intervening year. Although this year (2005/06) does not require a comprehensive report to be produced, this SoE report is a comprehensive report as it is the first one to be completed by NSROC and therefore can not build upon previous years of environmental reporting on a whole-of-region basis.
8
NORTHERN SYDNEY REGIONAL ORGANISATION OF COUNCILS
In order to reach a stage where a regional SoE could be produced by NSROC, all of the northern Sydney councils have worked together over the last few years. This was to develop a consistent regional reporting framework and a set of common indicators appropriate for reporting across local government boundaries and through time. This has proved a significant challenge, as while all councils are required to report against key identified environmental issues according to the legislation, each council has chosen their own way of interpreting these reporting requirements. They have also gathered data through different methodologies and emphasised different issues according to what is impacting on their environment at a local level.
WHY A REGIONAL SoE REPORT?The benefit of a regional report is that it enables the community and NSROC to have a greater understanding of the state, pressures and responses to the environment within a regional context. Working together regionally has already yielded benefits including the sharing of ideas on sustainability reporting, the swapping of environmental practices and innovation in the region, and the forging of stronger regional links.
The structure of this report is designed to meet the requirements of providing an accessible environmental reporting tool for the residents and communities of the NSROC area; the needs of councils and councillors in identifying and monitoring key environment issues; and meeting the legislative reporting requirements of the Local Government Act 1993. Each chapter of the report has been constructed around the accepted standard of reporting known as the ‘State-Pressure-Response’ model utilised by the commonwealth and state governments in their respective SoE reports. An outline of the reporting method is as follows:
State A description of the current condition of the environment
Pressure Lists human activities impacting on the environment
Response The actions that have been taken to address the pressures on the environment
The SoE report uses indicators to monitor change in our environment over time and help to connect social, environmental and economic planning functions to secure a more holistic management focus.
THE FUTUREThe process of developing a regional SoE has identified a number of challenges in producing future reports. The first is that the heterogenous nature of the reporting systems and processes of the seven members of NSROC has meant that it has been difficult to obtain complete and robust data sets and core indicators which are relevant to the entire region. This issue has been in part resolved by the fact that the northern Sydney councils have for some time been working together to ensure that reporting systems and indicators are standardised, however it is noted that more work can still be done in this area.
The second challenge has been the lack of quality research and monitoring carried out in the region, and hence an inexact understanding of many of the pressures facing the region. There is only one air quality monitoring station in the region and local government is not adequately equipped or resourced to do its own monitoring beyond a few local sites. The lack of detailed research and comprehension of the data, coupled with declining council revenue as a result of on-going rate-pegging and cost-shifting, provides a significant constraint on the comprehensive analysis and response to environmental issues.
Finally, not all of the environmental ‘story’ for the region is negative, as many of the environmental indicators in this report demonstrate. The northern Sydney councils have achieved a lot through comprehensive approaches to environmental issues and they have demonstrated a leadership role for the community in environmental programs aimed at creating environmental awareness and developing environmental sustainability. Furthermore, some councils have been able to raise funds through the application of special environmental levies where a clear connection between the monies raised and the environmental benefit from its expenditure can be demonstrated.
NSROC, the councils and their communities have had a number of successes in restoring degraded environments; controlling or eradicating invasive species; reducing resource consumption; identifying new environmental threats; conserving fragile or endangered ecological communities; and changing long standing social habits which have negative environmental consequences. The councils continue to show innovation in meeting environmental challenges, in integrating sustainability principles in all that they do, and in allocating appropriate resources to
ensure the right environmental outcomes are achieved.
9
STATE OF THE ENVIRONMENT REPORT 2005
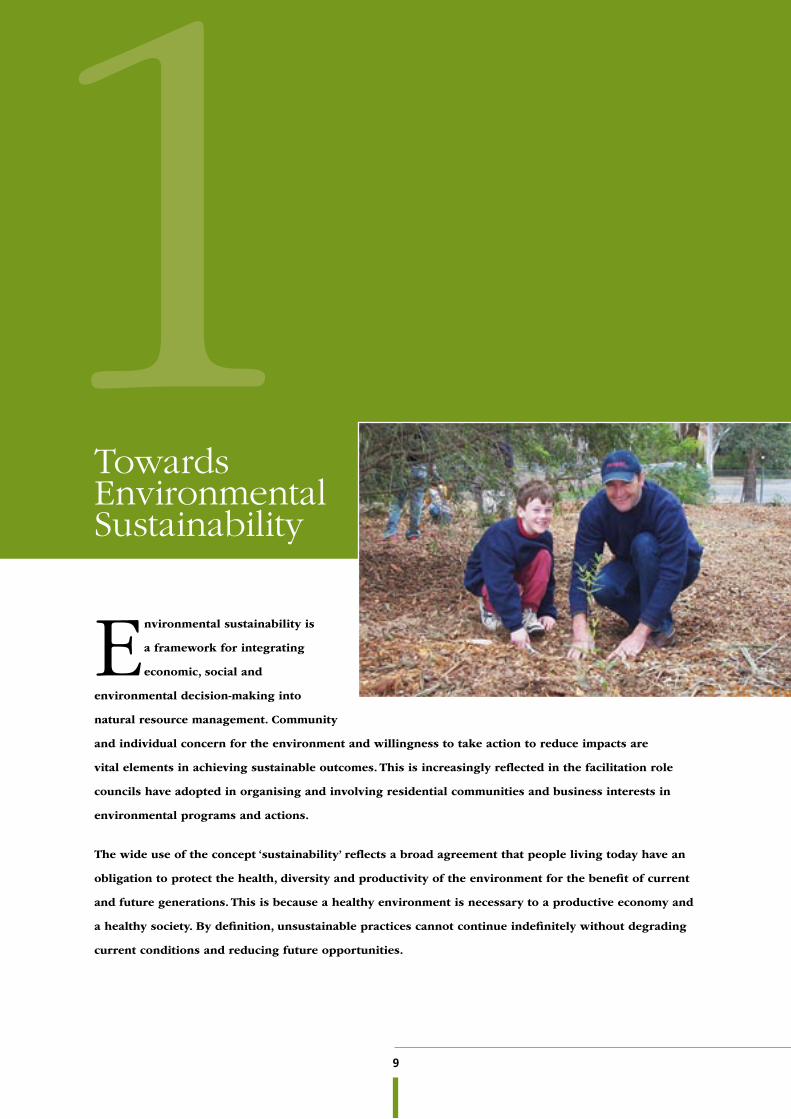
1Environmental sustainability is
a framework for integrating
economic, social and
environmental decision-making into
natural resource management. Community
and individual concern for the environment and willingness to take action to reduce impacts are
vital elements in achieving sustainable outcomes. This is increasingly reflected in the facilitation role
councils have adopted in organising and involving residential communities and business interests in
environmental programs and actions.
The wide use of the concept ‘sustainability’ reflects a broad agreement that people living today have an
obligation to protect the health, diversity and productivity of the environment for the benefit of current
and future generations. This is because a healthy environment is necessary to a productive economy and
a healthy society. By definition, unsustainable practices cannot continue indefinitely without degrading
current conditions and reducing future opportunities.
Towards Environmental Sustainability

10
NORTHERN SYDNEY REGIONAL ORGANISATION OF COUNCILS
Over recent years there has been an extensive effort in the NSROC area to develop new tools and approaches to
reduce the complexity of moving towards sustainability and highlight the fundamental links between the economy,
society and the environment. The northern Sydney councils operate within the context of ongoing drought and
short to medium term concerns regarding: water security, air quality, climate change, flora and fauna protection,
waste management, population growth, transport congestion, land availability and degradation, pollution and
energy consumption. At no time in the councils’ history has the challenge of sustainability been more dramatic
or more compelling.
LIMITATIONS While there are a number of tools to measure sustainability, they remain limited in their application by the councils as they are complex, inexact and subject to varying interpretation. No councils have a formally adopted sustainability indicator for the purposes of SoE reporting and the move towards sustainability must therefore be inferred from secondary sources. For the purpose of this report, two core indicators were identified to indicate the
level of sustainability within the region. These are the amount of community and corporate involvement within the region in environmental management activities. The councils are seeking to develop a more comprehensive and robust set of indicators in this area, notwithstanding the inherent difficulty in SoE reporting on socioeconomic data sets and information.
COMMUNITY ACTIONCouncils are required to consider the principles of sustainability in its decision-making processes (Local Government Act, 1993, s 7e). Accordingly, throughout this SoE there are references to a range of projects that NSROC is undertaking to address sustainability.
The councils run a large number of programs with their communities aimed at achieving environmental sustainability in specific issues such as water conservation, bushland management, energy reduction and waste minimisation. Some of these programs are run as part of council operations and others are funded through specific grants and environment levies.
Some of the projects undertaken throughout the region in 2004/05 are as follows:
• Lane Cove held a Sustainability Expo in September 2004 attracting 250 attendees and 30 exhibitors displaying organic or sustainable products including Solar Panels, Green Cleaning, Organic Paints, Organic Food Tasting, Natural Body Products, Eco-Tastic Games, Rainwater Tanks and more.
• Hunters Hill Waste Watchers Program was delivered to local primary schools under the Keep Australia Beautiful Campaign. Topics included: waste avoidance and minimisation; reuse and recycling; composting and worm farming; sorting waste into correct bins; litter; and stormwater management.
• City of Ryde Council conducted a Plastic Bag Famine in which over 1000 local school students made a committed effort to refuse all plastic bags. A class from Eastwood Heights Public School won an excursion to the Visy Education Centre where they watched the sorting of recycled material followed by a trip to Kimbriki Ecogarden where they learnt about ecology and tasted bush food.
• Ku-ring-gai Council staff have been working with residents surrounding Turramurra and Pymble to improve the condition of local bushland. The Face to Face Program offers free, personalised advice on how to manage weeds and gardens. The program represents a partnership between residents, local businesses, Ku-ring-gai and City of Ryde Councils, the Department of Environment and Conservation (DEC) and the Ku-ring-gai Bushcare Association.
Willoughy Council’s Fauna Fair 2005 – one of the programs aimed at achieving environmental sustainability in bushland management.
11
STATE OF THE ENVIRONMENT REPORT 2005
• Hornsby Shire Council recently piloted its E-waste program to assist in the recycling of electronic goods across residences and small businesses. Over 42 tonnes of computer equipment was collected during the seven week project saving residents around $30 per computer charged by commercial recyclers for computer recycling.
• North Sydney Council has introduced a Car Share Policy to provide on-street and off-street parking opportunities for Car Share Groups. The policy is aimed at encouraging the use of public transport, and reducing private motor vehicle ownership. Up to 10 Car Share parking spaces will be provided in any one residential parking area providing a possible 330 car spaces in North Sydney Council area.
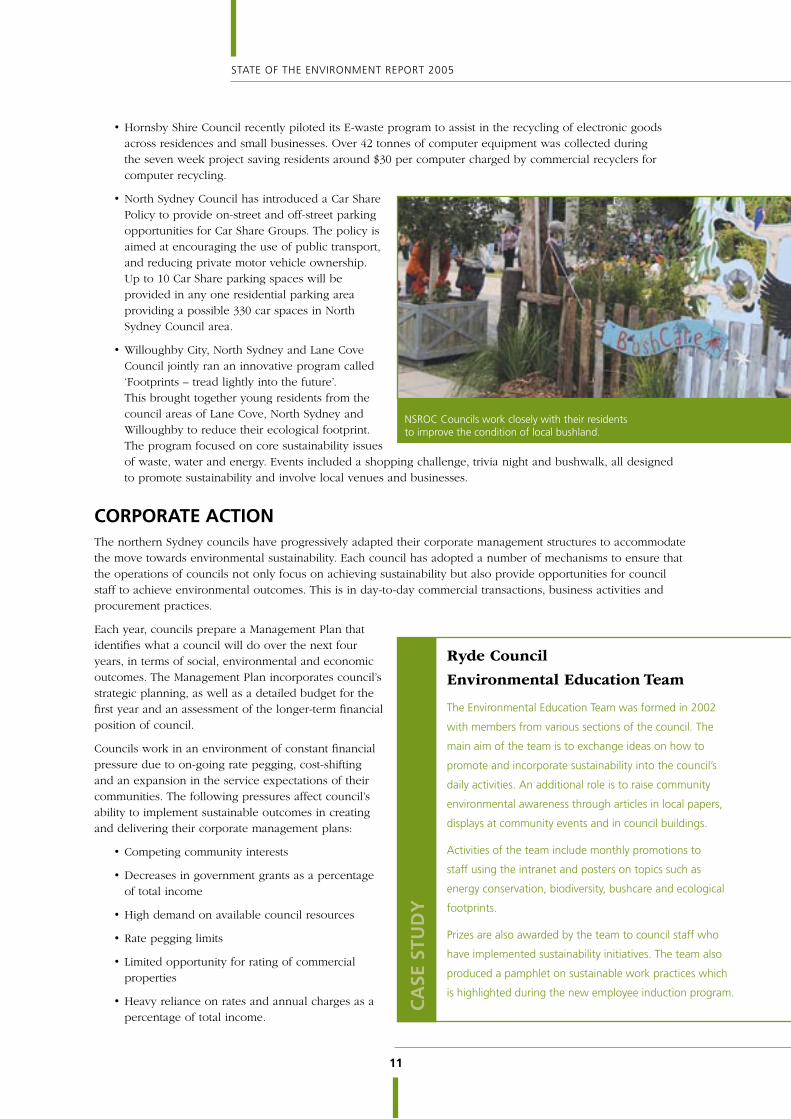
• Willoughby City, North Sydney and Lane Cove Council jointly ran an innovative program called ‘Footprints – tread lightly into the future’. This brought together young residents from the council areas of Lane Cove, North Sydney and Willoughby to reduce their ecological footprint. The program focused on core sustainability issues of waste, water and energy. Events included a shopping challenge, trivia night and bushwalk, all designed to promote sustainability and involve local venues and businesses.
CORPORATE ACTIONThe northern Sydney councils have progressively adapted their corporate management structures to accommodate the move towards environmental sustainability. Each council has adopted a number of mechanisms to ensure that the operations of councils not only focus on achieving sustainability but also provide opportunities for council staff to achieve environmental outcomes. This is in day-to-day commercial transactions, business activities and procurement practices.
Each year, councils prepare a Management Plan that identifies what a council will do over the next four years, in terms of social, environmental and economic outcomes. The Management Plan incorporates council’s strategic planning, as well as a detailed budget for the first year and an assessment of the longer-term financial position of council.
Councils work in an environment of constant financial pressure due to on-going rate pegging, cost-shifting and an expansion in the service expectations of their communities. The following pressures affect council’s ability to implement sustainable outcomes in creating and delivering their corporate management plans:
• Competing community interests
• Decreases in government grants as a percentage of total income
• High demand on available council resources
• Rate pegging limits
• Limited opportunity for rating of commercial properties
• Heavy reliance on rates and annual charges as a percentage of total income.
Ryde Council
Environmental Education Team
The Environmental Education Team was formed in 2002
with members from various sections of the council. The
main aim of the team is to exchange ideas on how to
promote and incorporate sustainability into the council’s
daily activities. An additional role is to raise community
environmental awareness through articles in local papers,
displays at community events and in council buildings.
Activities of the team include monthly promotions to
staff using the intranet and posters on topics such as
energy conservation, biodiversity, bushcare and ecological
footprints.
Prizes are also awarded by the team to council staff who
have implemented sustainability initiatives. The team also
produced a pamphlet on sustainable work practices which
is highlighted during the new employee induction program.
CA
SE S
TUD
Y
NSROC Councils work closely with their residents to improve the condition of local bushland.
12
NORTHERN SYDNEY REGIONAL ORGANISATION OF COUNCILS
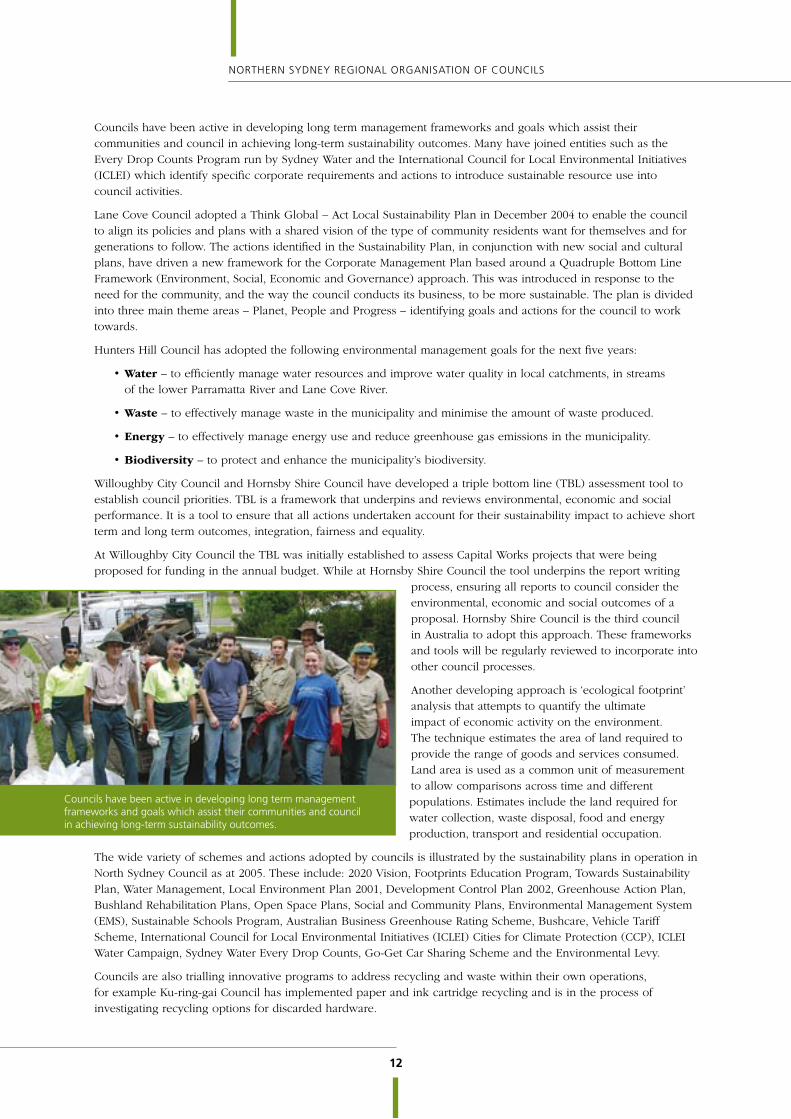
Councils have been active in developing long term management frameworks and goals which assist their communities and council in achieving long-term sustainability outcomes. Many have joined entities such as the Every Drop Counts Program run by Sydney Water and the International Council for Local Environmental Initiatives (ICLEI) which identify specific corporate requirements and actions to introduce sustainable resource use into council activities.
Lane Cove Council adopted a Think Global – Act Local Sustainability Plan in December 2004 to enable the council to align its policies and plans with a shared vision of the type of community residents want for themselves and for generations to follow. The actions identified in the Sustainability Plan, in conjunction with new social and cultural plans, have driven a new framework for the Corporate Management Plan based around a Quadruple Bottom Line Framework (Environment, Social, Economic and Governance) approach. This was introduced in response to the need for the community, and the way the council conducts its business, to be more sustainable. The plan is divided into three main theme areas – Planet, People and Progress – identifying goals and actions for the council to work towards.
Hunters Hill Council has adopted the following environmental management goals for the next five years:
• Water – to efficiently manage water resources and improve water quality in local catchments, in streams of the lower Parramatta River and Lane Cove River.
• Waste – to effectively manage waste in the municipality and minimise the amount of waste produced.
• Energy – to effectively manage energy use and reduce greenhouse gas emissions in the municipality.
• Biodiversity – to protect and enhance the municipality’s biodiversity.
Willoughby City Council and Hornsby Shire Council have developed a triple bottom line (TBL) assessment tool to establish council priorities. TBL is a framework that underpins and reviews environmental, economic and social performance. It is a tool to ensure that all actions undertaken account for their sustainability impact to achieve short term and long term outcomes, integration, fairness and equality.
At Willoughby City Council the TBL was initially established to assess Capital Works projects that were being proposed for funding in the annual budget. While at Hornsby Shire Council the tool underpins the report writing
process, ensuring all reports to council consider the environmental, economic and social outcomes of a proposal. Hornsby Shire Council is the third council in Australia to adopt this approach. These frameworks and tools will be regularly reviewed to incorporate into other council processes.
Another developing approach is ‘ecological footprint’ analysis that attempts to quantify the ultimate impact of economic activity on the environment. The technique estimates the area of land required to provide the range of goods and services consumed. Land area is used as a common unit of measurement to allow comparisons across time and different populations. Estimates include the land required for water collection, waste disposal, food and energy production, transport and residential occupation.
The wide variety of schemes and actions adopted by councils is illustrated by the sustainability plans in operation in North Sydney Council as at 2005. These include: 2020 Vision, Footprints Education Program, Towards Sustainability Plan, Water Management, Local Environment Plan 2001, Development Control Plan 2002, Greenhouse Action Plan, Bushland Rehabilitation Plans, Open Space Plans, Social and Community Plans, Environmental Management System (EMS), Sustainable Schools Program, Australian Business Greenhouse Rating Scheme, Bushcare, Vehicle Tariff Scheme, International Council for Local Environmental Initiatives (ICLEI) Cities for Climate Protection (CCP), ICLEI Water Campaign, Sydney Water Every Drop Counts, Go-Get Car Sharing Scheme and the Environmental Levy.
Councils are also trialling innovative programs to address recycling and waste within their own operations, for example Ku-ring-gai Council has implemented paper and ink cartridge recycling and is in the process of investigating recycling options for discarded hardware.
Councils have been active in developing long term management frameworks and goals which assist their communities and council in achieving long-term sustainability outcomes.
13
STATE OF THE ENVIRONMENT REPORT 2005
2Human Settlement
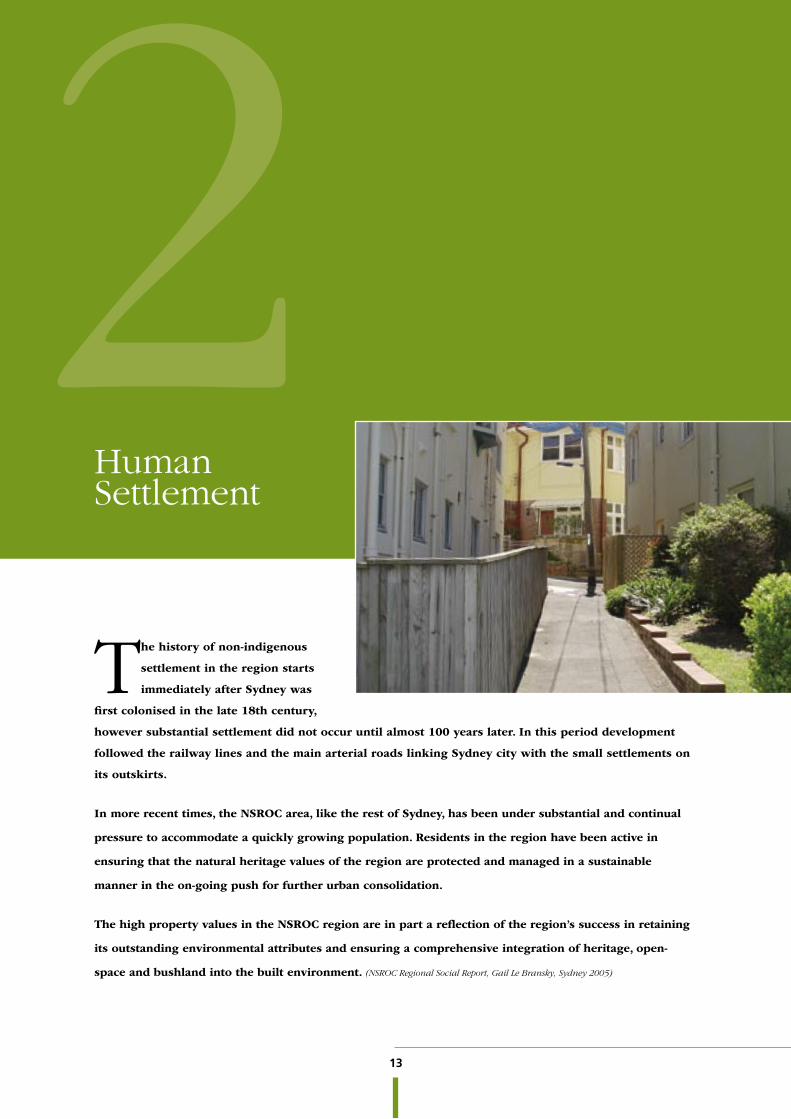
The history of non-indigenous
settlement in the region starts
immediately after Sydney was
first colonised in the late 18th century,
however substantial settlement did not occur until almost 100 years later. In this period development
followed the railway lines and the main arterial roads linking Sydney city with the small settlements on
its outskirts.
In more recent times, the NSROC area, like the rest of Sydney, has been under substantial and continual
pressure to accommodate a quickly growing population. Residents in the region have been active in
ensuring that the natural heritage values of the region are protected and managed in a sustainable
manner in the on-going push for further urban consolidation.
The high property values in the NSROC region are in part a reflection of the region’s success in retaining
its outstanding environmental attributes and ensuring a comprehensive integration of heritage, open-
space and bushland into the built environment. (NSROC Regional Social Report, Gail Le Bransky, Sydney 2005)

14
NORTHERN SYDNEY REGIONAL ORGANISATION OF COUNCILS
URBAN DEVELOPMENTIn the northern and north-western parts of the northern Sydney region, development is constrained by the natural topography and extant bushland preservation areas. Historically, urban development proceeded along the ridgelines, with the steeper areas adjacent to the Hawkesbury River and its tributaries remaining undeveloped except for small residential settlements and commercial hubs supporting water-based commercial activities. While some former rural areas have been developed for residential purposes, large areas within the Hornsby Shire Local Government Area (LGA) have remained primarily rural. The high cost of delivering urban infrastructure, and the importance of maintaining productive agricultural lands are the key impediments to urban growth in these areas.
In the southern parts of the NSROC area the recent property boom has continued the pressure for further urban consolidation in the region and made housing affordability a significant issue. In April 2004 the NSW Premier announced the development of a Metropolitan Strategy to guide Sydney’s growth over the coming 30 years. The Strategy anticipates growth of around 40,600 people a year over this period – two thirds by natural growth, and the remainder by immigration from overseas and interstate. (Le Bransky 2005).
The Pressure of Growth
The NSROC area itself is experiencing unprecedented growth. State strategic land-use policies such as the Metropolitan Strategy appear set to challenge historical growth patterns and values of the region. While actual population growth figures remain speculative, estimates place them between approximately 120,000 and 150,000 people over the next 30 years (Le Bransky 2005).
Under such significant population pressure, urban development must be carefully managed to ensure environmental impacts are managed, and while this will be assisted by a regional plan which posits growth in already developed centres, this remains one of the greatest challenges to the councils of the region.
Urban Development and Construction
Across the northern Sydney region there is a wide diversity of land uses and urban development pressures. In North Sydney there is on-going construction of high rise commercial and residential buildings, while in Hornsby there is pressure on productive rural lands to be developed for new residential subdivisions. Within all councils there is an on-going process of urban consolidation in response to government policy, property prices and population growth.
The nature of housing stock is also changing from traditional large detached dwellings on big leafy blocks, to higher density houses which now take a larger portion of the block. As the size of families decrease and more people live on their own, there has also been a corresponding rise in the number of one-
bedroom and studio apartments. Overall the value of property in the region remains high and housing affordability remains low which is limiting the socio-economic spread within the community.
Much residential intensification that has occurred in the region has taken place in existing commercial zones, especially around rail stations. For example, St Leonards was rezoned in 2001 from a low-scale industrial and commercial centre to a mixed use zone. This brown field rezoning has allowed wholesale redevelopment of the area into a medium to high-rise commercial and residential centre with significant increases in the working and residential populations. Significant urban redevelopments also have occurred adjacent to rail stations in Chatswood and West Ryde.
Hornsby Shire Council
Small farm enterprises in the Hornsby Shire are responsible
for providing about 10 per cent of Sydney’s agriculture
production. Although this is a small component overall,
Hornsby Shire is a leading local government area in the
Sydney region for stone fruit, strawberries, cut flowers and
nursery production.
Urban and rural/residential development in the Hornsby Shire
area is already putting pressure on rural lands and the value
of agricultural production in the region is declining as a result.
Uncertainty about the future of rural lands is encouraging
speculation, raising land prices above agricultural land values
and discouraging new agricultural investment.
Farmers are finding it difficult to make an economic return
from agriculture under the circumstances while agricultural
activities such as spraying and truck movements can be
incompatible with neighbouring residential development.
Hornsby Shire Council has decided not to allow further
subdivision of its rural land. Rather, it is joining with Baulkham
Hills, Campbelltown, Gosford and Penrith Councils in seeking
funding from the Department of Planning for a study.
This would be to identify values for rural lands that should
be protected, and to recommend planning controls and other
incentives to create an environment that is conducive to
facilitating rural viability and maintaining rural amenity. CA
SE S
TUD
Y

15
STATE OF THE ENVIRONMENT REPORT 2005
Council Number of Commercial DAs
Number of Industrial DAs
Number of Residential DAs
Number of Aged Persons Housing DAs
Other
North Sydney 202 0 414 incl in residential 43
Lane Cove 45 10 315 1 1
Hunters Hill 6 0 255 1 10
Ryde 242 33 884 2 74
Ku-ring-gai 52 0 959 8 895
Hornsby Shire No data * No data * No data * No data * 2436
Willoughby 349 63 710 3 57
NSROC region 896 106 3537 15 3516
Figure 1: Number and type of development applications (DAs) in the NSROC area, 2004/05 *Data is unavailable for 2004/05. For historical data on this area please visit www.soe.hornsby.nsw.gov.au
Figure 2: Number of new dwellings in the NSROC region, 2004/05
���
���
���
���
���
���
�
���
���
���
���
���
���
���
������������ ��������� ������������ ���� ����������� ������������� ����������
Figure 3: Average number of people per household in the NSROC region Data from the Australian Bureau of Statistics (ABS) 2001 Census.
�
���
�
���
�
���
�
������������ ��������� ������������ ���� ����������� ������������� ���������� ������������ ������
Council Business Industrial National Park
Open Space
Residential Roads Special Uses
Rural Unzoned Other
North Sydney 6.3 0 0 16.75 44.7 25.15 5.41 0 0 1.7
Lane Cove 2 6 0 15 52 19 6 0 0 0
Hunters Hill 3 0 0 13 50 17 17 0 0 0
Ryde 3 4 6 9 47 18 12 0 1 No data*
Ku-ring-gai 0.56 0 19.72 16.52 43.78 11.5 4.49 0 0 No data*
Hornsby Shire 0.4 0.4 49.9 5.2 9.4 No data* 3.3 15.7 No data* 15.7
Willoughby 2.32 4.08 0.35 20.05 49.41 18.21 4.73 0 0.01 0.85
NSROC region 2.08 2.06 10.85 13.65 42.33 18.31 7.56 2.24 0.17 3.65
Figure 4: Percentage of land use by LGA in the NSROC region, 2004/05 *Data is unavailable for 2004/05. For historical data on this area please visit www.soe.hornsby.nsw.gov.au
NSROC region total = 2029
16
NORTHERN SYDNEY REGIONAL ORGANISATION OF COUNCILS
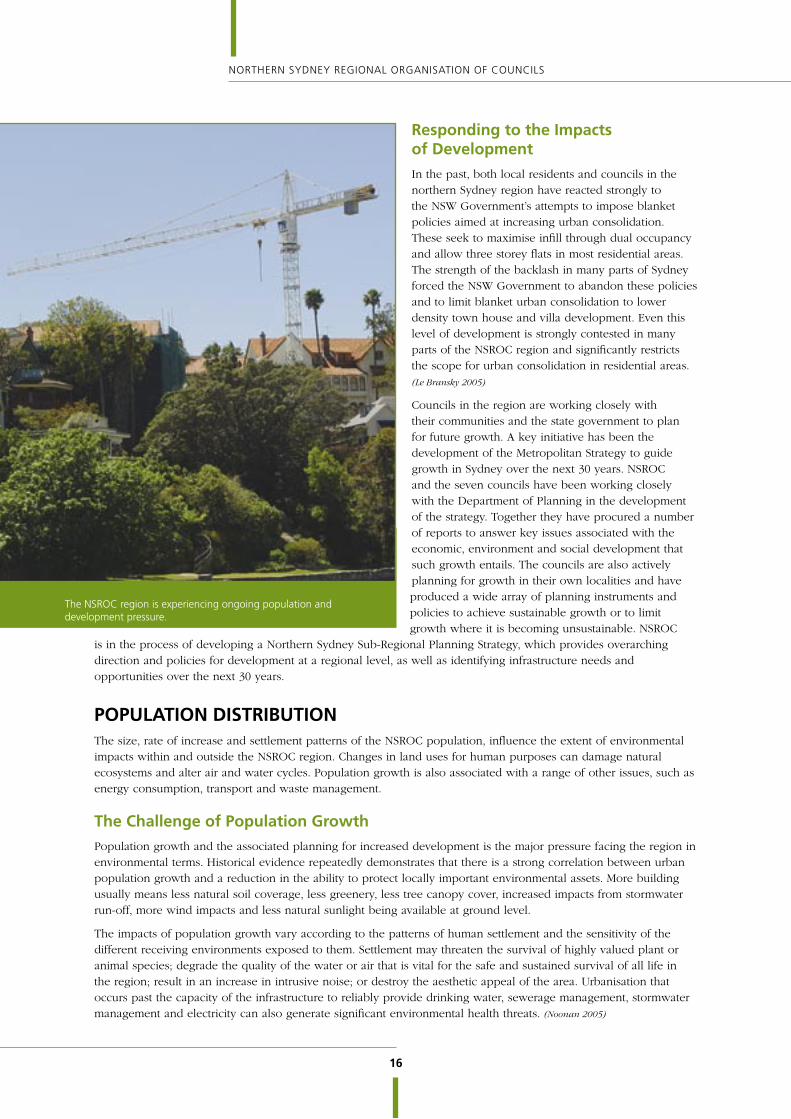
The NSROC region is experiencing ongoing population and development pressure.
Responding to the Impacts of Development
In the past, both local residents and councils in the northern Sydney region have reacted strongly to the NSW Government’s attempts to impose blanket policies aimed at increasing urban consolidation. These seek to maximise infill through dual occupancy and allow three storey flats in most residential areas. The strength of the backlash in many parts of Sydney forced the NSW Government to abandon these policies and to limit blanket urban consolidation to lower density town house and villa development. Even this level of development is strongly contested in many parts of the NSROC region and significantly restricts the scope for urban consolidation in residential areas. (Le Bransky 2005)
Councils in the region are working closely with their communities and the state government to plan for future growth. A key initiative has been the development of the Metropolitan Strategy to guide growth in Sydney over the next 30 years. NSROC and the seven councils have been working closely with the Department of Planning in the development of the strategy. Together they have procured a number of reports to answer key issues associated with the economic, environment and social development that such growth entails. The councils are also actively planning for growth in their own localities and have produced a wide array of planning instruments and policies to achieve sustainable growth or to limit growth where it is becoming unsustainable. NSROC
is in the process of developing a Northern Sydney Sub-Regional Planning Strategy, which provides overarching direction and policies for development at a regional level, as well as identifying infrastructure needs and opportunities over the next 30 years.
POPULATION DISTRIBUTIONThe size, rate of increase and settlement patterns of the NSROC population, influence the extent of environmental impacts within and outside the NSROC region. Changes in land uses for human purposes can damage natural ecosystems and alter air and water cycles. Population growth is also associated with a range of other issues, such as energy consumption, transport and waste management.
The Challenge of Population Growth
Population growth and the associated planning for increased development is the major pressure facing the region in environmental terms. Historical evidence repeatedly demonstrates that there is a strong correlation between urban population growth and a reduction in the ability to protect locally important environmental assets. More building usually means less natural soil coverage, less greenery, less tree canopy cover, increased impacts from stormwater run-off, more wind impacts and less natural sunlight being available at ground level.
The impacts of population growth vary according to the patterns of human settlement and the sensitivity of the different receiving environments exposed to them. Settlement may threaten the survival of highly valued plant or animal species; degrade the quality of the water or air that is vital for the safe and sustained survival of all life in the region; result in an increase in intrusive noise; or destroy the aesthetic appeal of the area. Urbanisation that occurs past the capacity of the infrastructure to reliably provide drinking water, sewerage management, stormwater management and electricity can also generate significant environmental health threats. (Noonan 2005)

17
STATE OF THE ENVIRONMENT REPORT 2005
Population Data for the Region
Below are estimates of the population of the NSROC region based on the figures provided by the Australian Bureau of Statistics.1
�
�����
�����
�����
�����
�����
���
���
���
�
���
���
���� ���� ���� ���� ���� ���� ���� ����
���������������� �����������������
�������������������
��������������������
���������������������
Figure 5: Change in NSROC’s estimated resident population for the year ending June 30, 2005
Responding to the Challenge of Population Growth
As part of the state government’s Metropolitan Strategy, regional strategies are being developed by Regional Organisation of Councils to inform the over-arching policy directions, and to provide substantive detail in regards to housing, employment and infrastructure provision. The NSROC councils have been working together to create a draft Regional Strategy. This identifies the key planning policies and issues in the region and sets them against the context of the proposed employment and housing growth in the area over the next 30 years.
While the process is not yet complete, it is anticipated that a regionally planned approach to population growth, rather than ad-hoc or simplistic approaches used previously, will greatly assist in reducing the impacts from population growth. In a report on the environmental impacts associated with population growth as identified under the Metropolitan Strategy, the consultant concluded:
“Intensification of the population of the NSROC region will unavoidably impact on the key environmental assets that are highly valued by its residents. Some changes will be manageable, but others will be irreversible.” (Noonan 2005)
The challenge for the NSROC councils is to ensure that the irreversible changes are managed as much as possible in an environmentally sustainable manner.
A regionally planned approach to population growth, rather than ad-hoc or simplistic approaches used previously, will greatly assist in reducing the impacts from population growth.
1 Populations are counted and estimated in various ways. The most comprehensive population count available in Australia is derived from the Population and Household Census conducted by the Australian Bureau of Statistics (ABS) every five years. This measure is known as ‘Enumerated Population’ and represents where people were counted on Census night (7 August 2001). This population figure includes overseas visitors but excludes Australians overseas. To provide a more accurate population figure between Censuses, the ABS also produces ‘Estimated Resident Population’ (ERP) numbers. ERPs take into account people who missed the count on Census night including people who were temporarily overseas (or elsewhere on holiday, such as in the snowfields or Queensland). It also takes into account people counted in an area who are usually resident in another area of Australia or overseas.

18
NORTHERN SYDNEY REGIONAL ORGANISATION OF COUNCILS
ABORIGINAL HERITAGEMuch of what we know about the lives and cultures of the people of the Sydney region before British colonisation comes from many sources. There are written descriptions, oral histories, drawn and painted illustrations, objects collected by the earliest colonists and visitors to Port Jackson in the late 18th and early 19th centuries, as well as the archaeological record.
When the British arrived in January 1788, there were more than 1500 Aboriginal people living in the area from Botany Bay to Broken Bay and as far west as Parramatta. They belonged to many clans including the Gadigal, Wangal, Wallumedegal, Boromedegal, Gamaragal, Borogegal, Birrabirragal and Gayamaygal. They spoke languages now known as Darug, Dharawal and possibly Guringai. To the south-west Gundungurra and to the north-west of the Hawkesbury River Darginung was spoken.
The original inhabitants of the NSROC region were people from the Camaraigal, and Gorualgal clans of the Guringai family group and the Wallumedegal clan in the Ryde area. The Guringai people lived largely along the foreshores
of the harbour and river estuaries. Evidence of their living areas occur throughout the region in the form of rock art and rock engravings, middens, artefacts, water holes, ceremonial grounds, carved trees, stone quarries, stone arrangements, ochre quarries and axe grinding grooves.
Threats to Aboriginal Sites
Threats to aboriginal heritage sites come from development, damage due to ignorance of the sites, excessive visitation, vandalism and erosion.
Aboriginal Sites within the NSROC Region
The following figure indicates Aboriginal sites across the region.
Council Identified Aboriginal sites
Registered Aboriginal sites
New sites under investigation
North Sydney 60 60 0
Lane Cove 67 67 0
Hunters Hill 45 45 0
Ryde 62 50 1
Ku-ring-gai 59 100 0
Hornsby Shire 235 235 0
Willoughby 162 162 0
NSROC Region 690 719 1
Figure 6: Aboriginal Sites in the NSROC area, 2005
Preserving and Protecting Aboriginal Sites
NSROC councils have developed a range of strategies aimed at preserving the Aboriginal heritage of the area. Comprehensive registers of sites throughout the region provide information crucial to the management of the sites. North Sydney Council’s register provides specific recommendations regarding conservation and the management of sites. It also includes protocols for council assessment officers in dealing with development applications in the vicinity of an Aboriginal site.
In Hunters Hill two small parcels of crown land currently managed by council are subject to an Aboriginal land claim. In City of Ryde Council’s area, the Local Metropolitan Aboriginal Land Council has expressed interest in a joint project to research an Aboriginal site at Meadowbank Park.
Northern Sydney Aboriginal Heritage Manager
In 2000, three NSROC councils (North Sydney, Lane Cove
and Willoughby City) along with Warringah Council agreed
to jointly fund the position of an Aboriginal Heritage
Manager (AHM). The primary responsibility of the AHM
is to protect Aboriginal sites and heritage, and ensure
compliance with its statutory obligations. The AHM is also
responsible for developing a program to identify and record
Aboriginal cultural sites within the Council boundaries,
and the implementation of a management plan to protect
sites from inadvertent destruction, vandalism,
and encroaching development.
The AHM reviews council policies and procedures,
particularly in relation to development control and
staff professional training. The AHM also develops and
implements public programs, events and school activities
to educate the community in respect to Aboriginal cultural
heritage, and the complexities relating to issues of site
management. Through these educational programs, the
community has the opportunity to become better educated
as to the nature of the sites, respectful of their past and
current significance, and become engaged in the process
of their protection. A Memorandum of Understanding
between the councils in relation to the position was
renewed in 2005 for another five years. CA
SE S
TUD
Y

19
STATE OF THE ENVIRONMENT REPORT 2005
City of Ryde Coucil: contains 174 items protected by the Ryde Planning Scheme ordinance including Aboriginal sites, schools, churches, clock tower, fountains, factories, shops and houses.
NON-ABORIGINAL HERITAGE‘Heritage’ refers to the culture, traditions and national assets conserved from one generation to another. A conservation area is a place of aesthetic, social and historic value to the community. In practical terms, our heritage is all that we value and want to keep for future generations and that goes towards forming our identities as people, communities and nations.
“Heritage is the combination of all those things that make us, as individuals, the people we are and, on a larger scale, make us the nation we are,” writes Geraldine O’Brien. “It can be as small as a baby’s rattle, passed down through generations, a family photograph, books, or a piece of furniture. Or it can be as large as Uluru, the Sydney Opera House or an old harbour ferry.” (www.teachingheritage.nsw.edu.au/1views/identity.html)
A non-Aboriginal heritage item is defined as a building, work, relic, place or tree which is considered to have heritage significance. This can include such things as a house, a factory, a railway, machinery, recreation reserve, cemetery or trees. There are many non-Aboriginal heritage items in the northern Sydney region due to its size, diversity and proximity to the nation’s earliest settlement history.
Threats to Conserving Our Heritage
The major threat to the retention of heritage sites, buildings and locations is the on-going pressure of urban consolidation and redevelopment and occasionally neglect. Continuing development places the following pressures on built heritage including:
• Increasing land values resulting in a push to maximise development potential of sites;
• Development reflecting current trends, rather than existing character;
• Increasing car ownership resulting in garages and carports replacing garden settings.
Heritage Sites in the NSROC Region
The northern Sydney region contains a number significant heritage areas and items. These include large parts of Hunters Hill which have been identified as a conservation area. The following is a summary of heritage areas and sites within each LGA.
North Sydney Council: contains 25 heritage areas with 3,000 items identified within the areas. Protection is given by the North Sydney Local Environmental Plan, 2001. Of particular note are Graythwaite, Luna Park, Brett Whitley’s former home and studio, BHP Tank Farm, and the former Quarantine Boat Depot and former National Maritime Museum Shipyard.
Hunters Hill Council: Hunters Hill is identified as a conservation area by the National Trust, the Heritage Council of Australia and the Australian Heritage Commission. It has been on the register of the National Estate since 1978. It has 522 heritage items listed on Schedule 6 of the Local Environment Plan (LEP) and 588 contributory buildings built prior to 1928.
Lane Cove Council: contains 417 heritage sites with one conservation area. A study has been commissioned into the possible addition of other areas and a Conservation Management Plan is being finalised on the heritage of the Lane Cove River estuary, in conjunction with Hunters Hill Council and funded by the NSW Government. This plan summarises the natural, aboriginal and cultural heritage since European settlement.
Willoughby City Council: contains 12 heritage conservation areas with 4,100 properties. Willoughby City Council has 200 listed items, which include 28 heritage items classified to be of State or Regional Significance. The theme for the council’s Heritage Week Festival was ‘Heritage and Community’, it was marked with the opening of a park on part of the site of the former Mashman and Doulton pottery factory.

20
NORTHERN SYDNEY REGIONAL ORGANISATION OF COUNCILS
Hornsby Shire Council: contains 814 heritage sites and 5 heritage conservation areas. It also has 9 items listed on the State Heritage Register and 23 items listed on the Register of the National Estate.
Ku-ring-gai Council: contains 28 areas classified by the National Trust as Urban Conservation Areas. There are 700 items officially gazetted in Schedule 7 of the Planning Scheme Ordinance, with 600 items registered as locally
significant. Eighteen items are included on the State Heritage Register. Many local residents cherish the heritage character of Ku-ring-gai and identify heritage preservation as a key value.
City of Ryde Coucil: contains 4 heritage conservation areas, with 174 items protected by the Ryde Planning Scheme ordinance. These include Aboriginal sites, schools, churches, clock towers, fountains, factories, shops and houses. There are 11 places within Ryde listed on the State Heritage register. Heritage groups in the area include Ryde District Historical Society and Brush Farm House Historical Society.
Working to Preserve Our Heritage
Councils in the NSROC region continue to work with the community in protecting, managing, maintaining and reviewing their local heritage sites. This is enhanced by the building of heritage information databases and the development and implementation of LEPs and Heritage Conservation Plans.
The northern Sydney councils work together sharing data and resources to maximise the protection of heritage sites. For example a Conservation Management Plan has been prepared on the heritage of the Lane Cove River estuary by Lane Cove and Hunters Hill Councils. This plan will summarise the natural, Aboriginal and cultural heritage since European settlement. The northern Sydney councils also work hand in hand with community heritage groups whose research, activities and commitment continually proves to be invaluable.
URBAN PLANNING/TRANSPORT Widespread media publicity has occurred recently over the growing concerns that the Greater Metropolitan Region of Sydney is facing traffic gridlock in the foreseeable future, initially at peak hours. These stem from extrapolating the association between the rapid growth in private vehicle journeys, the expansion of toll and motorways, and the substantial residential growth within and outside the region. At the same time, there is evidence of an increasing strain on, and decreasing public confidence in, the existing passenger rail system across all of Sydney. Added to this is the increased use of the existing road system for freight, with estimates predicting that the number of heavy vehicle movements across Australia will double by 2015. (Noonan 2005)
Traffic is an environmental, social and economic problem. Environmentally it causes a deterioration in local and regional air quality, contributes to global warming and indirectly impacts on water quality through urban run-off. Socially it creates issues of noise, public health, reduction of local amenity and community safety. Economically it constrains commerce. Through restricted mobility, it delays products and services in reaching markets and creates on-costs for consumers. Reducing traffic congestion therefore remains a key challenge for all levels of government and the community in the northern Sydney region.
Hunters Hill Town Hall
The locality of Hunters Hill is rich in heritage due to its
proximity to the place of European settlement, its rich
maritime history and the preservation of many fine homes
and gardens. One heritage asset that is of particular
importance to the community of Hunters Hill is the
Hunters Hill Town Hall which was constructed of fine
sandstone in 1866.
The Town Hall is located in the original village of Hunters
Hill and was constructed by the first mayor of the
municipality. The building and its context are significant
by national standards and today the area is a place on the
national estate and is protected by the Burra Charter
and council’s LEP. CA
SE S
TUD
Y

21
STATE OF THE ENVIRONMENT REPORT 2005
The Impact of Traffic
Discussions with each of the NSROC councils showed that they rank the current level of traffic congestion high in their list of environmental concerns, and that the problem is becoming progressively worse across the whole region. Considerable attention has recently been given to the severe impacts likely to be created by the traffic congestion in the south and west of Sydney. But it appears that a point will be reached when the impacts will be shared equally across the entire city.
The NSROC region is serviced by five major arterial roads. These are the F3 Freeway from the north, the Pacific Highway, Pennant Hills Road, Lane Cove/Ryde Road, and Epping Road/M2 tollway. Anecdotally, peak hours on most of these roads on weekdays already extends from 6.30am to 9am and 3.30pm to 7pm. A characteristic of each of the roads is that they are not unique to the NSROC region. All are corridors linking Newcastle, the Central Coast or the Northern Beaches to the city and further south (Pennant Hills Rd and Pacific Highway); or the city and Eastern Suburbs to the Western Suburbs and the Blue Mountains (Victoria Rd and Epping Rd); or the south-west region to the north and north east (Lane Cove Rd/Ryde Rd).
It is likely completion of the M7 tollway will exacerbate congestion on Pennant Hills Road and Epping Rd/M2. It also remains to be seen how the new Epping Road Tunnel and the Epping to Chatswood rail link will impact on local and regional traffic. Both of these infrastructure projects are occurring within the context of substantial residential and commercial growth associated with the development of Macquarie Park and the key urban centres of the region. In the longer term, the population of the Central Coast and Hunter Region are also likely continue to swell in parallel with that of the Sydney Basin, be this strategically directed or as a product of market forces.
As the northern Sydney region is a corridor for traffic accessing these regions, it is anticipated that this growth will create additional pressure on the existing infrastructure. Overall, the evidence points to an inescapable move towards severe traffic congestion throughout the northern Sydney region in the medium future, and most likely gridlock during morning and evening peak hours. (Noonan 2005)
Regional Transport Data
The most relevant data available for the region was collected in the traffic survey undertaken during 2002 by the RTA as part of a three year repeating cycle covering the whole of the State of NSW. This recorded the Annual Average Daily Traffic (AADT), which is assessed as the total volume of traffic recorded at a specific road location taken over a calendar year, and divided by the number of days in that year.
The data demonstrated that, of the 19 arterial roads that exceeded this flow throughout all of the Greater Metropolitan Region, eight were in the NSROC region and another three were contiguous with it (i.e. as feeder or off-take roads). That is, half of the most congested traffic thoroughfares throughout Sydney were either in the region or skirted it. The maximum traffic counts recoded on the key roads of interest were:
Epping Rd 76,000 Military Rd 77,000
F3 freeway at Wahroonga 79,000 (feeder road) Pennant Hills Rd 79,000
James Ruse Drive 73,000 (feeder road) Victoria Rd 89,000
Lane Cove / Ryde Rd 77,000 (Noonan 2005)
For comparison purposes, certain roads on the southern side of the Harbour Bridge showed inordinate congestion as well. General Holmes Drive carried 134,000; Southern Cross Drive 119,000, Parramatta Rd 89,000, and the Princes Highway 87,000. The M5 east was not functional when the AADT data was collected but now probably matches the worst of these. (Noonan 2005).
Peak hours on most of the region’s roads on weekdays already extends from 6.30am to 9am and 3.30pm to 7pm.

22
NORTHERN SYDNEY REGIONAL ORGANISATION OF COUNCILS
���������������
������������������
���������
�����
����
�����
���
�������������
�������
�����������
�����
��������������
������������
�����������������������
������������������
����������
� �� �� �� ��
���������������������������������������
Figure 7: Mode of travel to work, in the NSROC region and the Sydney Statistical division, 2001
���������������
������������������
���������
�����
����
�����
���
�������������
�������
�����������
�����
��������������
������������
����������������
������������������
����������
����� ��� � ��� ���� ����
Figure 8: Change in mode of travel to work in the NSROC region, 1996 to 2001

23
STATE OF THE ENVIRONMENT REPORT 2005
Road Daily traffic volume 1996
Daily traffic volume 1999
Daily traffic volume 2002
Pacific Highway at Hornsby 30706 34109 33192
Mona Vale Rd (South Telegraph Rd) No data 63,086 63,557
Pacific Highway at Gordon 49,039 48,876 49,022
Pacific Highway at Boundary Rd, Chatswood 61,827 63,331 47,160
Boundary Rd (South of Clanville Rd) 58,456 60,139 57,398
Pacific Highway at Mowbray Rd, Chatswood 63,017 65,080 67,923
Pacific Highway at Falcon St, Crows Nest 25854 29590 27417
Pacific Highway at North Sydney 21257 26072 21321
Pacific Highway at Longueville Rd, Lane Cove 48857 70616 62694
Victoria Road/Huntleys Point Rd 55,911 57,709 56,593
Victoria Rd/Concord Rd 27668 26217 23405
Church St Ryde, at Ryde Bridge 67601 76452 78796
Pittwater Rd at Buffalo Creek Bridge 16699 17263 18396
Victoria Rd at West Ryde 59051 57590 58335
Military Rd (West of Watson St) No data 76374 77749
Epping Rd (West of Mowbray Rd) 65,329 76,400 75,485
Mowbray Road (West of Penshurst St) 19,324 20,604 17,407
Mowbray Road (East of Fitzsimmons Av) 12,587 16,274 14,118
Centennial Avenue 23,599 22,776 20160
Eastern Valley Way 39,139 40,017 37,351
Boundary Road (West of Clermiston Av) 38,082 38,459 37,919
Pennant Hills Road (South of Edward Rd) 56013 61461 61105
F3 Wahroonga 32937 38456 38912
Pennant Hills Rd, South of Copeland Rd approaching M2 No data 65046 70521
Figure 9: Daily traffic volumes at key locations in the NSROC region, 1996 to 2002
����
����
���
����
����
����
����
����
�
���
���
���
���
���
���
���
���
������������ ��������� ������������ ���� ����������� ������������� ���������� ������������
�������
��������������
Figure 10: Car ownership per capita in the NSROC region, 2001

24
NORTHERN SYDNEY REGIONAL ORGANISATION OF COUNCILS
Meeting the Challenge of Sustainable Transport
The issue of increased private vehicle use in addition to a growing population is one of the major challenges facing the northern Sydney councils. Councils play an important role in educating the community on sustainable transport choices and in encouraging active transport options such as cycling and walking. While major decisions regarding public transport infrastructure provision remain the domain of the state government, the NSROC councils work closely with the transport agencies to ensure that opportunities for active transport and public transport are maximised.
At present a number of train stations and bus interchanges in the region are being upgraded and a new heavy rail line is proposed which will run through north Sydney to the north west of Sydney. Bus reforms are also underway, however councils have not yet had a significant role in the development of the new bus contracts. NSROC has actively been pursuing the appointment of regional transport coordinators in Sydney to match the appointment of coordinators throughout the state. NSROC has recently learnt that two coordinators will be appointed, however they will initially be located in the western part of Sydney.
NSROC has also identified a number of key transport infrastructure requirements for the region and has commenced lobbying the state government to have them considered. These include completion of the M2-F3 orbital link, a strategy for the North Sydney to Macquarie Park corridor, and consideration of light rail options and an integrated cycle network.
The councils of NSROC have also enacted a number of local projects to further encourage the use of public transport and alternative methods of transport to the private motor car. For example Lane Cove and Willoughby Council have both developed Transport Access Guides (TAG) which provide members of the public with concise information on how to reach council venues using low-energy forms of transport such as public transport, walking or cycling. Lane Cove Council recently launched a TAG for its Administration Centre and Willoughby City Council released five TAGs for sites such as the library and community centres.
In response to increased single person vehicle use and ageing populations, Ku-ring-gai and Hornsby Shire Councils are trialling a new shuttle bus service for people who are less mobile. The shuttle provides door to door transport from Berowra to St Ives, stopping in between at Mount Colah, Hornsby Shopping Centre, Hornsby Hospital and Turramurra. Passengers can also request other destinations on the route.
The trial of the shuttle bus service will operate on Fridays and target frail, aged and disabled people and their carers who find it hard to use public transport. This bus will help them regain some of their freedom. Passengers are helped on and off the wheelchair accessible bus, however they must be able to manage by themselves once they reach their destination. The service is a new initiative of Accessible Bridge Services, a consortium of community transport providers in the northern Sydney region.
North Sydney Council has used a combination of signage and maps to encourage walking around the North Sydney area. Distance and times are included on the maps to promote alternatives to cars and encourage a healthy lifestyle. North Sydney Council has also been active in promoting car-sharing and the use of hybrid electric vehicles through purchasing a number for its own use. Many of the NSROC councils have been actively working with Sydney buses in promoting Park’n’Ride facilities.
WASTE MANAGEMENTIncreasingly waste is being viewed as a resource rather than a liability. Waste has the potential to be recycled, re-used or used to generate energy. The manner in which it is managed impacts on human health and contributes to waterway, air and groundwater pollution, the human-induced greenhouse effect and contaminated land.
Waste can have negative impacts on public health, the aesthetics of the environment, the aquatic environment and groundwater. It contributes to greenhouse gas pollution as a result of methane emissions from landfill sites. Also, there is only a finite amount of land that can be used for landfill, therefore it is extremely important to continue to reduce waste.
At present a number of train stations and bus interchanges in the region are being upgraded and bus reforms are also underway.

25
STATE OF THE ENVIRONMENT REPORT 2005
Waste Issues
Councils in the NSROC region face a number of pressures affecting the performance of waste management such as:
• Co-operation and participation of the community in continuing to recycle materials without contaminating the respective waste streams;
• Higher cost in disposal of waste materials due to limited disposal options and transport costs;
• Community consumption patterns;
• Community expectations on service levels;
• Legislative and statutory powers which regulate the management of waste;
• Availability of new alternative technologies to manage waste;
• Declining number of land fill sites.
Solid Waste Disposal and Recycling
In 2004/05 residents of the NSROC region generated 117,587 tonnes of material which went to landfill. A further 65,174 tonnes of material was recovered through recycling systems and an additional average of 57 kilograms of green waste was recycled for each person in the region. In 2004/05 the amount of material diverted from landfill through recycling and green waste collections was 100 kilograms per person.
In total more waste was collected in 2004/05 than in previous years reflecting the growing population of the NSROC region. However the volume and percentage of waste that is being recycled has increased considerably.
Council Total resources to landfill (tonnes)
Total resources recycled (tonnes)
Total resources to landfill per capita (kgs)
Total resources recycled per capita (kgs)
green waste diverted from landfill per person per annum (kgs)
North Sydney 10942 8946 180 150 20
Lane Cove 6814 4041 210 125 45
Hunters Hill 3463 1363 240 95 14
Ryde 30,566 9060 307 91 4
Ku-ring-gai 20,401 15,628 187 143 137
Hornsby Shire 31,090 17,810 202 116 95
Willoughby 14,311 8,326 224 130 87
NSROC 117,587 65,174
Figure 11: The division of landfill and recycled waste by council within the NSROC region, 2004/05
Responding to Waste Issues
NSROC Councils are actively increasing their recycling facilities, reviewing their processes and looking at new technologies to maximise the effectiveness of their waste management services. Councils in the NSROC region also work closely with the community to increase awareness amongst residents of the importance of responsible disposal of waste, and the negative impacts waste has on the environment and public health. A combination of education programs, workshops and events are held within schools and in the community to encourage minimum waste consumption and maximum recycling.
Hunters Hill
In 2004/05 residents of Hunters Hill Municipality generated
3,463 tonnes of material that was disposed of to landfill.
A further 1,362 tonnes of material was recovered through
recycling systems and an additional 207 tonnes of garden
vegetation was recovered from household green waste
collections. In 2004/05 the percentage of material diverted
from landfill through recycling and green waste collections
was 31 per cent.
Compared with previous years waste disposal per person
per year has reduced – 240 kilograms per person was
disposed of in 2004/05 compared with 262 kilograms
in 2003/04. Recycling is down slightly – 95 kilograms
per person in 2004/05 compared with 100 kilograms
per person in 2003/04. Recovered garden organics has
remained steady at 14 kilograms per person in 2004/05.C
ASE
STU
DY
����
����
���
�
���
����
����
����
����
����
����
�������� �������������������������
�����������������
����������������
������
Figure 12: Hunters Hill waste and recovery collection, 2004/2005
26
NORTHERN SYDNEY REGIONAL ORGANISATION OF COUNCILS
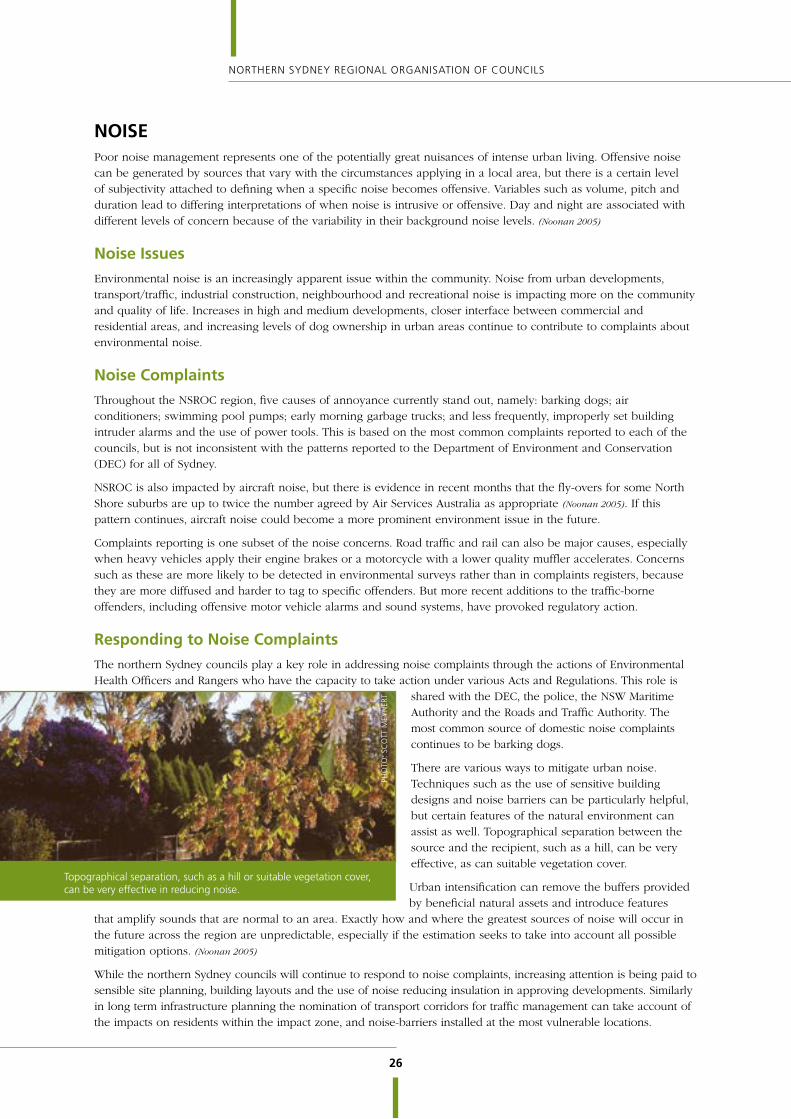
Topographical separation, such as a hill or suitable vegetation cover, can be very effective in reducing noise.
NOISEPoor noise management represents one of the potentially great nuisances of intense urban living. Offensive noise can be generated by sources that vary with the circumstances applying in a local area, but there is a certain level of subjectivity attached to defining when a specific noise becomes offensive. Variables such as volume, pitch and duration lead to differing interpretations of when noise is intrusive or offensive. Day and night are associated with different levels of concern because of the variability in their background noise levels. (Noonan 2005)
Noise Issues
Environmental noise is an increasingly apparent issue within the community. Noise from urban developments, transport/traffic, industrial construction, neighbourhood and recreational noise is impacting more on the community and quality of life. Increases in high and medium developments, closer interface between commercial and residential areas, and increasing levels of dog ownership in urban areas continue to contribute to complaints about environmental noise.
Noise Complaints
Throughout the NSROC region, five causes of annoyance currently stand out, namely: barking dogs; air conditioners; swimming pool pumps; early morning garbage trucks; and less frequently, improperly set building intruder alarms and the use of power tools. This is based on the most common complaints reported to each of the councils, but is not inconsistent with the patterns reported to the Department of Environment and Conservation (DEC) for all of Sydney.
NSROC is also impacted by aircraft noise, but there is evidence in recent months that the fly-overs for some North Shore suburbs are up to twice the number agreed by Air Services Australia as appropriate (Noonan 2005). If this pattern continues, aircraft noise could become a more prominent environment issue in the future.
Complaints reporting is one subset of the noise concerns. Road traffic and rail can also be major causes, especially when heavy vehicles apply their engine brakes or a motorcycle with a lower quality muffler accelerates. Concerns such as these are more likely to be detected in environmental surveys rather than in complaints registers, because they are more diffused and harder to tag to specific offenders. But more recent additions to the traffic-borne offenders, including offensive motor vehicle alarms and sound systems, have provoked regulatory action.
Responding to Noise Complaints
The northern Sydney councils play a key role in addressing noise complaints through the actions of Environmental Health Officers and Rangers who have the capacity to take action under various Acts and Regulations. This role is
shared with the DEC, the police, the NSW Maritime Authority and the Roads and Traffic Authority. The most common source of domestic noise complaints continues to be barking dogs.
There are various ways to mitigate urban noise. Techniques such as the use of sensitive building designs and noise barriers can be particularly helpful, but certain features of the natural environment can assist as well. Topographical separation between the source and the recipient, such as a hill, can be very effective, as can suitable vegetation cover.
Urban intensification can remove the buffers provided by beneficial natural assets and introduce features
that amplify sounds that are normal to an area. Exactly how and where the greatest sources of noise will occur in the future across the region are unpredictable, especially if the estimation seeks to take into account all possible mitigation options. (Noonan 2005)
While the northern Sydney councils will continue to respond to noise complaints, increasing attention is being paid to sensible site planning, building layouts and the use of noise reducing insulation in approving developments. Similarly in long term infrastructure planning the nomination of transport corridors for traffic management can take account of the impacts on residents within the impact zone, and noise-barriers installed at the most vulnerable locations.
PHO
TO: S
CO
TT M
EYN
ERT
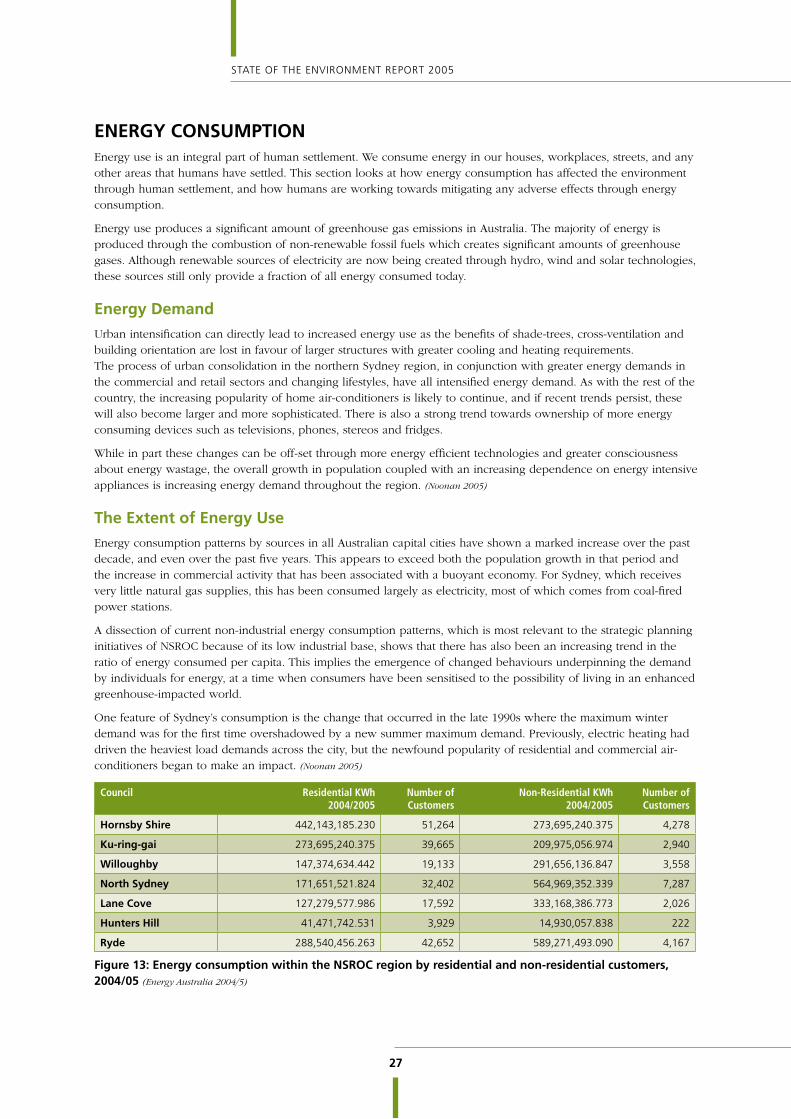
27
STATE OF THE ENVIRONMENT REPORT 2005
ENERGY CONSUMPTIONEnergy use is an integral part of human settlement. We consume energy in our houses, workplaces, streets, and any other areas that humans have settled. This section looks at how energy consumption has affected the environment through human settlement, and how humans are working towards mitigating any adverse effects through energy consumption.
Energy use produces a significant amount of greenhouse gas emissions in Australia. The majority of energy is produced through the combustion of non-renewable fossil fuels which creates significant amounts of greenhouse gases. Although renewable sources of electricity are now being created through hydro, wind and solar technologies, these sources still only provide a fraction of all energy consumed today.
Energy Demand
Urban intensification can directly lead to increased energy use as the benefits of shade-trees, cross-ventilation and building orientation are lost in favour of larger structures with greater cooling and heating requirements. The process of urban consolidation in the northern Sydney region, in conjunction with greater energy demands in the commercial and retail sectors and changing lifestyles, have all intensified energy demand. As with the rest of the country, the increasing popularity of home air-conditioners is likely to continue, and if recent trends persist, these will also become larger and more sophisticated. There is also a strong trend towards ownership of more energy consuming devices such as televisions, phones, stereos and fridges.
While in part these changes can be off-set through more energy efficient technologies and greater consciousness about energy wastage, the overall growth in population coupled with an increasing dependence on energy intensive appliances is increasing energy demand throughout the region. (Noonan 2005)
The Extent of Energy Use
Energy consumption patterns by sources in all Australian capital cities have shown a marked increase over the past decade, and even over the past five years. This appears to exceed both the population growth in that period and the increase in commercial activity that has been associated with a buoyant economy. For Sydney, which receives very little natural gas supplies, this has been consumed largely as electricity, most of which comes from coal-fired power stations.
A dissection of current non-industrial energy consumption patterns, which is most relevant to the strategic planning initiatives of NSROC because of its low industrial base, shows that there has also been an increasing trend in the ratio of energy consumed per capita. This implies the emergence of changed behaviours underpinning the demand by individuals for energy, at a time when consumers have been sensitised to the possibility of living in an enhanced greenhouse-impacted world.
One feature of Sydney’s consumption is the change that occurred in the late 1990s where the maximum winter demand was for the first time overshadowed by a new summer maximum demand. Previously, electric heating had driven the heaviest load demands across the city, but the newfound popularity of residential and commercial air-conditioners began to make an impact. (Noonan 2005)
Council Residential KWh 2004/2005
Number of Customers
Non-Residential KWh 2004/2005
Number of Customers
Hornsby Shire 442,143,185.230 51,264 273,695,240.375 4,278
Ku-ring-gai 273,695,240.375 39,665 209,975,056.974 2,940
Willoughby 147,374,634.442 19,133 291,656,136.847 3,558
North Sydney 171,651,521.824 32,402 564,969,352.339 7,287
Lane Cove 127,279,577.986 17,592 333,168,386.773 2,026
Hunters Hill 41,471,742.531 3,929 14,930,057.838 222
Ryde 288,540,456.263 42,652 589,271,493.090 4,167
Figure 13: Energy consumption within the NSROC region by residential and non-residential customers, 2004/05 (Energy Australia 2004/5)

28
NORTHERN SYDNEY REGIONAL ORGANISATION OF COUNCILS
Responding to Energy Demand and Consumption
The NSW Government introduced the requirement that all new dwellings after 1 July 2004 be designed to achieve a 25 per cent reduction in their energy demand, and included a requirement that this be extended to all new unit developments after 1 July 2005.
While there is very strong support for the introduction of the Building Sustainability Index (BASIX) energy controls by the NSROC councils, there is not a clear picture yet on how effectively or comprehensively the requirements will be enforced before an occupation certificate is granted. BASIX should make an appreciable difference over time to energy consumption as will the energy used to heat hot water due to water restrictions.
Councils above a certain size will also be required to develop Energy Savings Plans by 2006, and work is already underway to audit energy use in council facilities and minimise consumption through purchasing more efficient machinery and changing work habits.
Various initiatives have been undertaken by the NSROC members to reduce energy demand across the region as part of their move towards sustainability and reducing ecological footprints. These include community education programs and the application of energy conservation policies at sites managed by council staff. Cumulatively, these initiatives have the potential to make a substantial saving in consumption over the long-term.
WATER CONSUMPTIONWater consumption is being increasingly identified as a critical issue in Australia and this holds true for the northern Sydney region. Like the rest of Sydney, the region has been affected by recent drought and water restrictions.
Pressure on Water Resources
Sydney’s water resources are under pressure from the increasing demand for, and consumption of, town water supplies by the Sydney community. Population growth, lifestyle changes and the uncertainty of future climate change make the extent of these pressures difficult to measure. The issue of water resources has become
particularly important as Sydney is experiencing a prolonged drought and water reserves are extremely low. While it is difficult to determine the exact nature of on-going climate change, there is a distinct possibility that historical rainfall patterns will not be repeated and that Sydney will instead have more prolonged periods of dry weather and less annual rainfall.
To deal with this pressure the state government is contemplating building a large desalination plant which will have significant environmental consequences. Regardless of the exact repercussions of our intensive use and consumption of Sydney’s water resources, the conservation, protection and
Hornsby Shire Council
Hornsby Shire Council implemented and completed a
number of actions from its Greenhouse Gas Reduction
Strategy during 2004/05 including:
• The monitoring and verification of one of Australia’s
most comprehensive local government Energy
Performance Contracts throughout 150 Council
buildings and parks. This has guaranteed annual savings
of 20 per cent energy, 20 per cent water and a 14 per
cent reduction in greenhouse gas emissions;
• The installation of an innovative cogeneration system at
Hornsby Central Library to produce greener electricity
and free air conditioning;
• A pilot energy audit program for local industries in
partnership with Energy Conservation Systems and the
Australian Greenhouse Office (AGO);
• A pilot retrofit program for housing through funding
from the AGO and retailers;
• The introduction of a Sustainable Energy Policy to reduce
greenhouse gas emissions from all new council buildings. CA
SE S
TUD
Y
The issue of water resources has become particularly important as Sydney is experiencing a prolonged drought and water reserves are extremely low.
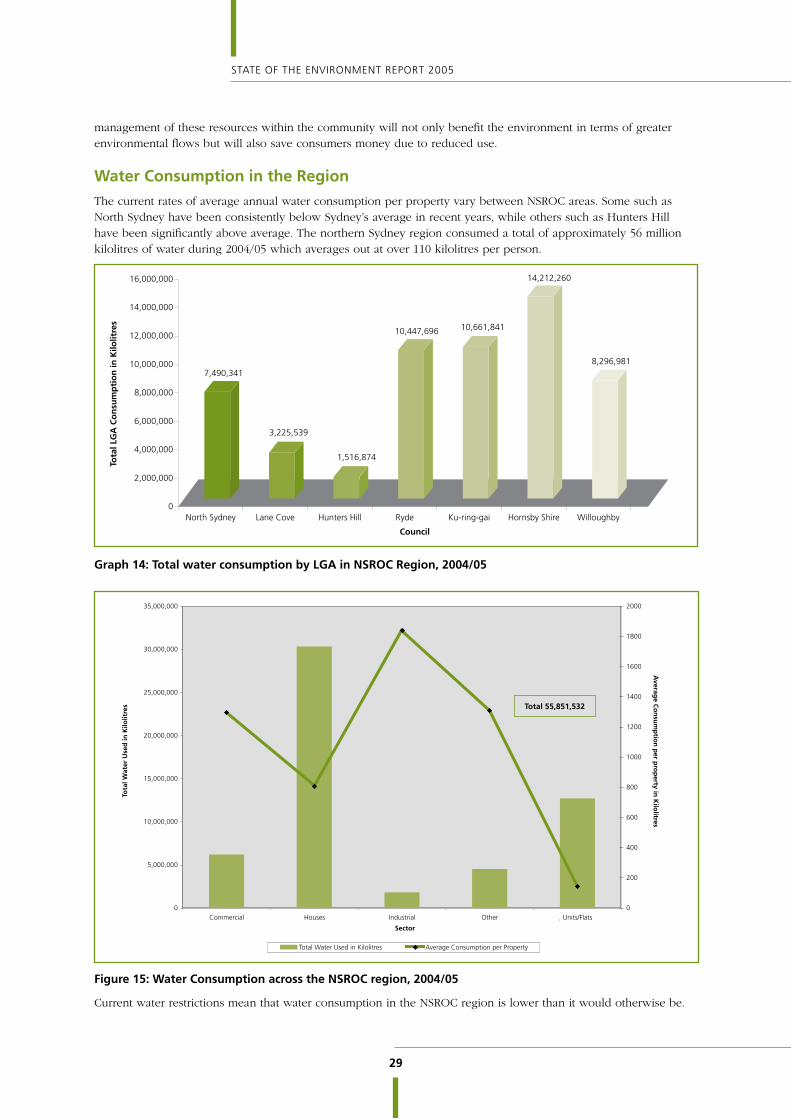
29
STATE OF THE ENVIRONMENT REPORT 2005
management of these resources within the community will not only benefit the environment in terms of greater environmental flows but will also save consumers money due to reduced use.
Water Consumption in the Region
The current rates of average annual water consumption per property vary between NSROC areas. Some such as North Sydney have been consistently below Sydney’s average in recent years, while others such as Hunters Hill have been significantly above average. The northern Sydney region consumed a total of approximately 56 million kilolitres of water during 2004/05 which averages out at over 110 kilolitres per person.
���������
���������
���������
���������� ����������
����������
���������
�
���������
���������
���������
���������
����������
����������
����������
����������
������������ ��������� ������������ ���� ����������� ������������� ����������
�������
�����������������������������������
Graph 14: Total water consumption by LGA in NSROC Region, 2004/05
�
���������
����������
����������
����������
����������
����������
����������
���������� ������ ���������� ����� ������������
���
���
���
���
����
����
����
����
����
����
������������������������������ ��������������������������������
������
�������
�����������������������
������
�������������������
����������
�����������
Figure 15: Water Consumption across the NSROC region, 2004/05
Current water restrictions mean that water consumption in the NSROC region is lower than it would otherwise be.
Total 55,851,532

30
NORTHERN SYDNEY REGIONAL ORGANISATION OF COUNCILS
Meeting the Water Challenge
All Councils have initiated programs to reduce their own water consumption and to educate and assist the community in water conservation measures. Measures include encouraging the installation of water tanks, dual flush toilets, water saving shower heads, and planting of native gardens which require less watering. Significant improvements in water consumption have been achieved from these measures and the introduction of water restrictions across Sydney. For example comparing January to March 2003 to the same period in 2004, Ku-ring-gai and Hornsby Shire residents achieved water savings of over 40 per cent. In the first full year of water restrictions, Ku-ring-gai achieved the biggest fall of water usage (43 per cent) of any Sydney local government area.
All councils will be required to develop water savings plans by 2006 which will require water saving measures to be identified and implemented in council buildings and infrastructure. Some examples of the initiatives that NSROC members have adopted to promote water conservation include:
• Hornsby Shire, North Sydney, Willoughby City and Hunters Hill Councils are members of the International Council of Local Environmental Initiatives (ICLEI) Water Campaign to achieve tangible targets in the sustainable use of fresh water.
• All the NSROC councils are members of the Sydney Water Every Drop Counts Program, auditing council facilities and developing plans to achieve tangible water savings.
• Hornsby Shire has implemented water conservation measures in all its building and parks to achieve 20 per cent water savings per year, and has installed a stormwater reuse system at its nursery in Pennant Hills.
• City of Ryde, Willoughby City and Hunters Hill Councils have actively encouraged the installation of rainwater tanks by residents.
• Ku-ring-gai Council has received substantial funding to establish a stormwater harvesting facility at St Ives which would serve as a model for application in other parts of the region.
• Hunters Hill has adopted a water saving Development Control Plan.
Hornsby Shire Council Water Management Plan
Hornsby Shire council is currently saving 40 million litres of
water a year – or the equivalent of 25 Olympic swimming
pools. Council has introduced its own initiatives to save
our most valuable natural resource. Thirty five million litres
of water is being saved a year as a result of water saving
devices in council buildings and stormwater reuse in parks.
Council buildings have been fitted with dual flush toilets
and taps are regularly checked to make sure they do not
leak. Council has used the Catchments Remediation Rate to
build infrastructure to collect stormwater so it can be reused
on playing fields and parks. Five million litres of water is
being saved each year as a result of the treatment and reuse
of water from aquatic centres and former landfills. CA
SE S
TUD
Y

31
STATE OF THE ENVIRONMENT REPORT 2005
COMMUNITY HEALTHIncreasingly councils are becoming involved in community health activities in recognition of the necessity to provide a comprehensive range of services that benefit all elements of their communities. Particular attention is paid to the more vulnerable sectors of society such as children, the aged and the mentally ill. Councils recognise the interdependency of a healthy and happy community and work towards promoting healthy lifestyles amongst its residents.
Community Health Issues
The population in the northern Sydney region is steadily increasing and is also ageing. Supporting a larger population, particularly with increasing dependents, can put pressure on health services and community groups. A growth in population also results in increased pollutants in the environment caused by increased traffic, energy and waste consumption. Pressures on community health include life-style related diseases such as obesity, stress and smoking-related diseases (declining in real terms).
The Environment and Health
It is difficult to demonstrate direct causality between environmental impacts and community health in a broad context. While specific pollution incidences such as chemical spills, exposure to asbestos, and heavy metal poisoning can have significant community health impacts, many health impacts are only discernable over time and after considerable or repetitive exposure. Councils are not frontline agencies in managing community health. However, they do have a significant role in managing the environment so it minimises the impacts on the community, and in working with health agencies and services to educate the community on health related issues.
The councils at present do not collate robust data on community health issues and must rely on secondary sources to make the link between environmental conditions and the health of their communities. One indicator identified by the NSROC councils is the number of asthma cases reported in the region as an indicator of air quality, as it is generally perceived that there is a direct link between the two.
Total % Female % Male %
2002 2003 2004 2002 2003 2004 2002 2003 2004
Hornsby Shire 19.7 9.6 10.5 10.3 10.3 17.1 15.3 9.9 13.3
Hunters Hill 0 12.5 0 0 0 0 0 6.7 0
Ku-ring-gai 10.4 8.1 7.7 5.7 15.9 8.3 8.4 11.3 8
Lane Cove 14.3 15.8 11.8 8.3 0 16.7 10.5 8.6 13
North Sydney 8 10.9 0 0 4.5 0 4.7 8.8 0
Ryde 10.9 15 18.5 0 2.9 10.5 5.8 10.6 15.2
Willoughby 14.8 16.2 14.3 12 4.3 7.7 13.5 11.7 11.8
NSROC 13.8 11.8 10.3 6.4 7.8 11.6 10.3 10.2 10.8
Figure 16: Prevalence of Asthma in the community, 2002 to 2004
(Strategic Research and Development Branch, Centre for Chronic Disease Prevention and Health Advancement, NSW Health Department.)
While specific pollution incidences such as chemical spills, exposure to asbestos, and heavy metal poisoning can have significant community health impacts, many health impacts are only discernable over time and after considerable or repetitive exposures.

32
NORTHERN SYDNEY REGIONAL ORGANISATION OF COUNCILS
Ryde Council Immunisation Program
• The City of Ryde’s Immunisation Program has assisted
in keeping the immunised rate in the community of
Ryde at 93 per cent in the past few years.
• The program has increased in popularity with 2,474
children in attendance during the year. This shows an
increase of 379 children from 2003/04.
• During the year, 6,443 vaccinations were administered
including Triple Antigen combined with Hepatitis B,
Polio, Haemophilus Influenza, Measles/Mumps/ Rubella,
Pneumococcal, Meningitis C and Chicken Pox.
• The program is being held up as a ‘Flagship’ to other
council’s in both country and city areas. The program
won a Local Government Managers Association merit
award of excellence for 2004/05 for Service to the
Community within Local Government.
CA
SE S
TUD
Y
Helping Our Communities Stay Healthy
Councils in the NSROC region work closely with the community to provide services, information, education and areas for relaxation to encourage and maintain a healthy and active population. The councils in NSROC often take a co-ordination, support and referral role in the provision of services to the elderly, disabled and mentally ill. For example Ku-ring-gai Council has organised Seniors Week Activities and a Senior Seminar Program in the past year.
Attention is paid to both health issues in the home and in the workplace. Councils provide staff and premises for some health programs and activities in full. For instance, North Sydney Council is in the process of reinstating an immunisation clinic targeting the 0-5 age group.
Councils also assist in the management and funding of a number of community organisations. Ku-ring-gai Council is actively involved with Ku-ring-gai Meals on Wheels, Ku-ring-gai Neighbourhood Centre and Easy Care Gardening. These organisations provide home and community support services that enable Ku-ring-gai residents to remain in their own home.
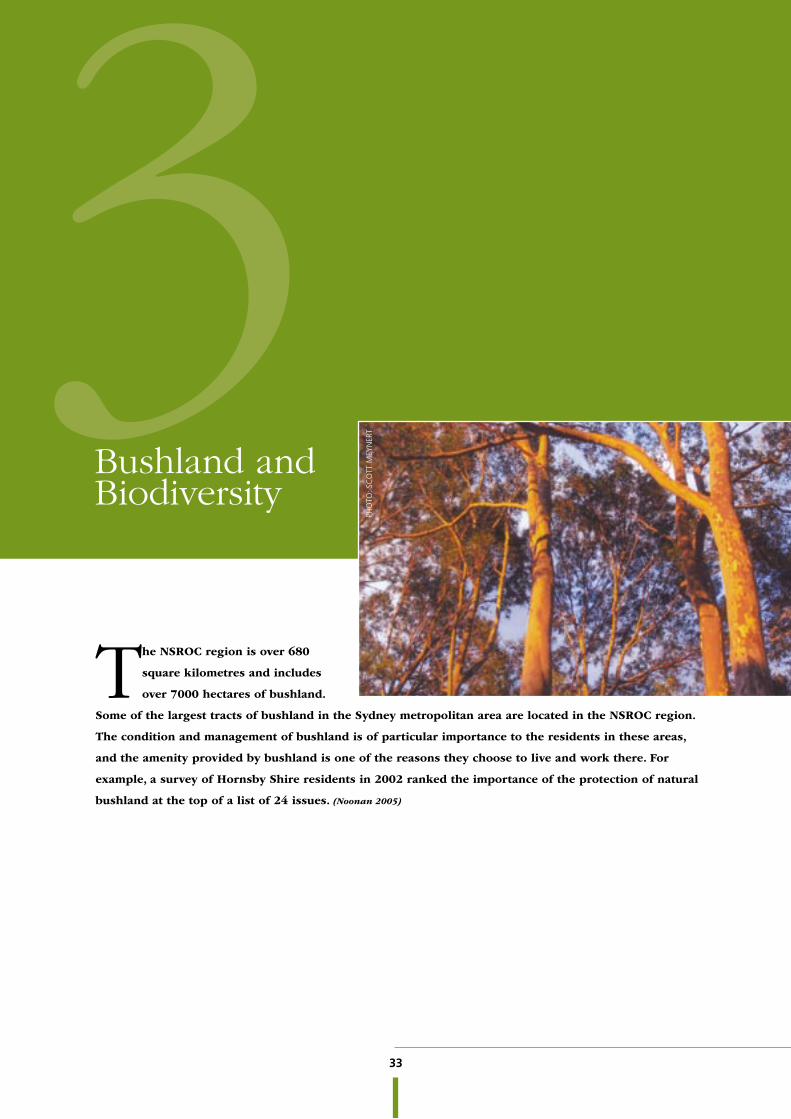
33
STATE OF THE ENVIRONMENT REPORT 2005
The NSROC region is over 680
square kilometres and includes
over 7000 hectares of bushland.
Some of the largest tracts of bushland in the Sydney metropolitan area are located in the NSROC region.
The condition and management of bushland is of particular importance to the residents in these areas,
and the amenity provided by bushland is one of the reasons they choose to live and work there. For
example, a survey of Hornsby Shire residents in 2002 ranked the importance of the protection of natural
bushland at the top of a list of 24 issues. (Noonan 2005)
3Bushland and Biodiversity
PHO
TO: S
CO
TT M
EYN
ERT

34
NORTHERN SYDNEY REGIONAL ORGANISATION OF COUNCILS
BUSHLAND MANAGEMENTNorthern Sydney is privileged to be surrounded by national parks such as the extensive Ku-ring-gai and Murramurra National Parks to the north, and includes important areas of native bushland within its borders. Native bushland is highly valued by the community for its cultural, recreational and aesthetic values. It contributes to air and water quality and provides unique habitats which are essential for the preservation of native flora and fauna species. The conservation of bushland is critical to the protection of biodiversity – the variety of different plants, animals and micro-organisms, their genes and the ecosystems of which they are a part. Bushland’s economic value includes its significant contribution to local economies through tourism and leisure related activities.
The Challenge of Conserving Bushland
Native plants and animals, and the remnant bushland are visible signs of the ecosystem functioning in urban areas. To protect this local biodiversity it is critical to conserve native vegetation and wildlife. Some of the pressures on the bushland vegetation and wildlife in the NSROC area include:
• Clearing of bushland for housing, roads and industrial developments;
• Adverse human impacts – weeds, rubbish dumping, encroachments, impacts of pets;
• Structural changes to the bushland – decreased species diversity including tree death, removal of habitat, changes to fire regime, increased soil nutrient levels;
• Changes in drainage – stormwater runoff;
• Destabilisation of water courses – erosion, scouring flows, increased sediment loads and nutrient pollution.
Urban development has impacted severely on bushland areas and on biodiversity in the Sydney metropolitan area with only around 12 per cent of the original bushland remaining. The Metropolitan Strategy currently being developed by the state government has recognised biodiversity conservation as one of the key environmental challenges to be faced. This is critical in the planning for continued urban growth to provide for Sydney’s expanding population.
The Threatened Species Conservation Act 1995 protects all threatened plants and animals native to NSW (with the exception of fish and marine plants). It recognises clearing of native vegetation as a major factor contributing to loss of biological diversity. The NSW Scientific Committee established by the Act identifies the following impacts of clearing native vegetation on biodiversity:
• Fragmentation of areas of native vegetation separating contiguous areas of habitat and reducing gene flow between populations;
• Deterioration of water quality, sedimentation and reduction in aquatic biodiversity following clearing of riparian native vegetation;
• Increased greenhouse gas emissions;
• Establishment and spread of weeds and other exotic species;
Sydney Turpentine-Ironbark Forest
Sydney Turpentine-Ironbark Forest is found on shale derived
soils overlaying Hawkesbury sandstone within the Sydney
Basin including Ryde, Hunters Hill, Ku-ring-gai and Hornsby
Shire Council areas. The pre-European extent of the Sydney
Turpentine-Ironbark Forest is estimated at 13,000 hectares.
The estimated current extent of the community is 29
hectares or less than one per cent of its previous coverage.
Threats to its existence include clearing for agriculture and
urban development, physical damage from recreational
activities, rubbish dumping, grazing, mowing and weed
invasion. In view of the small size of existing remnants
and the factors threatening their existence, the Scientific
Community is of the opinion that Sydney Turpentine-
Ironbark Forest will become extinct in the Sydney Basin
unless the pressures they face cease.
The Ku-ring-gai community has been successful in
achieving Federal listing and protection for the Sydney
Turpentine-Ironbark Forest under the Environment
Protection and Biodiversity Conservation Act 1999 as a
critically endangered ecological community. CA
SE S
TUD
Y
PHO
TO: L
ES IR
WIG
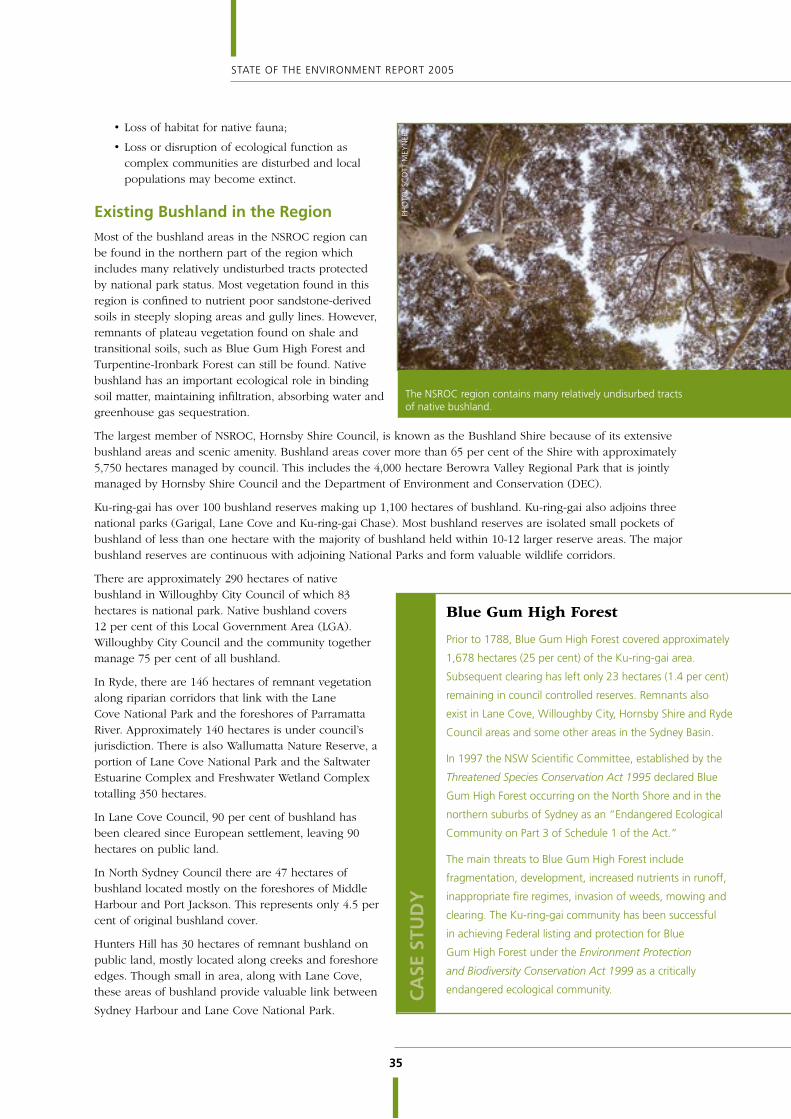
35
STATE OF THE ENVIRONMENT REPORT 2005
• Loss of habitat for native fauna;
• Loss or disruption of ecological function as complex communities are disturbed and local populations may become extinct.
Existing Bushland in the Region
Most of the bushland areas in the NSROC region can be found in the northern part of the region which includes many relatively undisturbed tracts protected by national park status. Most vegetation found in this region is confined to nutrient poor sandstone-derived soils in steeply sloping areas and gully lines. However, remnants of plateau vegetation found on shale and transitional soils, such as Blue Gum High Forest and Turpentine-Ironbark Forest can still be found. Native bushland has an important ecological role in binding soil matter, maintaining infiltration, absorbing water and greenhouse gas sequestration.
The largest member of NSROC, Hornsby Shire Council, is known as the Bushland Shire because of its extensive bushland areas and scenic amenity. Bushland areas cover more than 65 per cent of the Shire with approximately 5,750 hectares managed by council. This includes the 4,000 hectare Berowra Valley Regional Park that is jointly managed by Hornsby Shire Council and the Department of Environment and Conservation (DEC).
Ku-ring-gai has over 100 bushland reserves making up 1,100 hectares of bushland. Ku-ring-gai also adjoins three national parks (Garigal, Lane Cove and Ku-ring-gai Chase). Most bushland reserves are isolated small pockets of bushland of less than one hectare with the majority of bushland held within 10-12 larger reserve areas. The major bushland reserves are continuous with adjoining National Parks and form valuable wildlife corridors.
There are approximately 290 hectares of native bushland in Willoughby City Council of which 83 hectares is national park. Native bushland covers 12 per cent of this Local Government Area (LGA). Willoughby City Council and the community together manage 75 per cent of all bushland.
In Ryde, there are 146 hectares of remnant vegetation along riparian corridors that link with the Lane Cove National Park and the foreshores of Parramatta River. Approximately 140 hectares is under council’s jurisdiction. There is also Wallumatta Nature Reserve, a portion of Lane Cove National Park and the Saltwater Estuarine Complex and Freshwater Wetland Complex totalling 350 hectares.
In Lane Cove Council, 90 per cent of bushland has been cleared since European settlement, leaving 90 hectares on public land.
In North Sydney Council there are 47 hectares of bushland located mostly on the foreshores of Middle Harbour and Port Jackson. This represents only 4.5 per cent of original bushland cover.
Hunters Hill has 30 hectares of remnant bushland on public land, mostly located along creeks and foreshore edges. Though small in area, along with Lane Cove, these areas of bushland provide valuable link between
Sydney Harbour and Lane Cove National Park.
The NSROC region contains many relatively undisurbed tracts of native bushland.
Blue Gum High Forest
Prior to 1788, Blue Gum High Forest covered approximately
1,678 hectares (25 per cent) of the Ku-ring-gai area.
Subsequent clearing has left only 23 hectares (1.4 per cent)
remaining in council controlled reserves. Remnants also
exist in Lane Cove, Willoughby City, Hornsby Shire and Ryde
Council areas and some other areas in the Sydney Basin.
In 1997 the NSW Scientific Committee, established by the
Threatened Species Conservation Act 1995 declared Blue
Gum High Forest occurring on the North Shore and in the
northern suburbs of Sydney as an “Endangered Ecological
Community on Part 3 of Schedule 1 of the Act.”
The main threats to Blue Gum High Forest include
fragmentation, development, increased nutrients in runoff,
inappropriate fire regimes, invasion of weeds, mowing and
clearing. The Ku-ring-gai community has been successful
in achieving Federal listing and protection for Blue
Gum High Forest under the Environment Protection
and Biodiversity Conservation Act 1999 as a critically
endangered ecological community. CA
SE S
TUD
Y
PHO
TO: S
CO
TT M
EYN
ERT
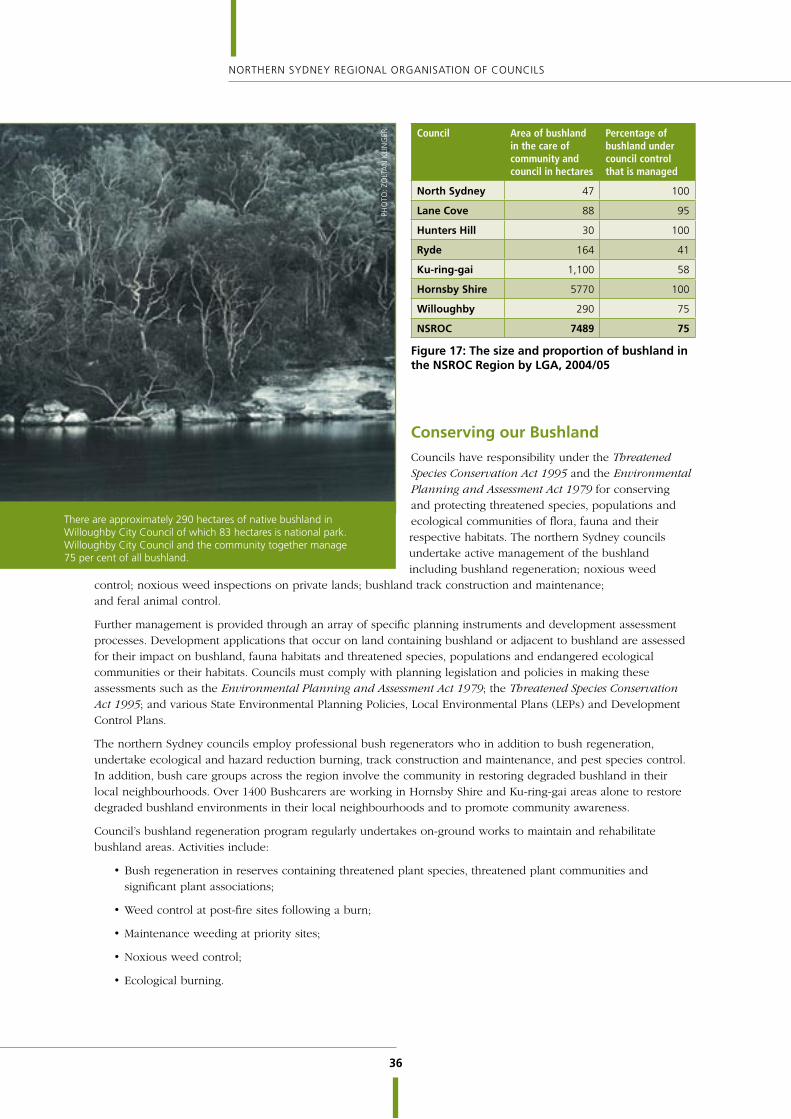
36
NORTHERN SYDNEY REGIONAL ORGANISATION OF COUNCILS
Council Area of bushland in the care of community and council in hectares
Percentage of bushland under council control that is managed
North Sydney 47 100
Lane Cove 88 95
Hunters Hill 30 100
Ryde 164 41
Ku-ring-gai 1,100 58
Hornsby Shire 5770 100
Willoughby 290 75
NSROC 7489 75
Figure 17: The size and proportion of bushland in the NSROC Region by LGA, 2004/05
Conserving our Bushland
Councils have responsibility under the Threatened Species Conservation Act 1995 and the Environmental Planning and Assessment Act 1979 for conserving and protecting threatened species, populations and ecological communities of flora, fauna and their respective habitats. The northern Sydney councils undertake active management of the bushland including bushland regeneration; noxious weed
control; noxious weed inspections on private lands; bushland track construction and maintenance; and feral animal control.
Further management is provided through an array of specific planning instruments and development assessment processes. Development applications that occur on land containing bushland or adjacent to bushland are assessed for their impact on bushland, fauna habitats and threatened species, populations and endangered ecological communities or their habitats. Councils must comply with planning legislation and policies in making these assessments such as the Environmental Planning and Assessment Act 1979; the Threatened Species Conservation Act 1995; and various State Environmental Planning Policies, Local Environmental Plans (LEPs) and Development Control Plans.
The northern Sydney councils employ professional bush regenerators who in addition to bush regeneration, undertake ecological and hazard reduction burning, track construction and maintenance, and pest species control. In addition, bush care groups across the region involve the community in restoring degraded bushland in their local neighbourhoods. Over 1400 Bushcarers are working in Hornsby Shire and Ku-ring-gai areas alone to restore degraded bushland environments in their local neighbourhoods and to promote community awareness.
Council’s bushland regeneration program regularly undertakes on-ground works to maintain and rehabilitate bushland areas. Activities include:
• Bush regeneration in reserves containing threatened plant species, threatened plant communities and significant plant associations;
• Weed control at post-fire sites following a burn;
• Maintenance weeding at priority sites;
• Noxious weed control;
• Ecological burning.
There are approximately 290 hectares of native bushland in Willoughby City Council of which 83 hectares is national park. Willoughby City Council and the community together manage 75 per cent of all bushland.
PHO
TO: Z
OLT
AN
KLI
NG
ER

37
STATE OF THE ENVIRONMENT REPORT 2005
OPEN SPACEThe NSROC region offers a wide range of open space and recreational facilities. There a number of sporting and leisure facilities of regional standing. These include: North Sydney Oval, Ryde Aquatic Centre, Willoughby Leisure Centre, North Sydney Pool and Luna Park. There are also extensive natural areas within the Lane Cove, Ku-ring-gai Chase, Garrigal and Murramurra National Parks
Outdoor sporting facilities within the NSROC region tend to be multi-purpose and cater for more than one sport. They contribute to the network of open space, provide relief from the urban environment and cater for passive recreational opportunities.
Open Space Demand
Demand for outdoor sporting facilities in most parts of the NSROC region exceeds supply during peak playing periods such as Saturdays. Some of the schools in the area have no or limited sporting fields and rely on public facilities.
On-going population growth is expected to exacerbate supply problems by increasing the overall numbers in the population wishing to access open space. The reliance on public sporting facilities by schools is also expected to increase as school populations grow. There is limited opportunity for future development of new open space sites within the northern Sydney region. This is due to existing urban development, prohibitive costs of purchasing new sites, topography, adjacent bushland and natural areas. Ongoing requirements for sports ground rectification, upgrading and maintenance, as well as water restrictions, put other pressures on the ability of sports fields to carry additional utilisation.
Managing Our Open Space
Councils in the NSROC region work in consultation with the community to maintain a significant amount of open space to provide recreational opportunities for its residents and to ensure that the region remains a safe, healthy and attractive place to live. Within the NSROC region there is 5230 hectares of council managed open space. This amounts to about 76 square metres per person.
�
���
�����
�����
�����
�����
�����
������������ ��������� ������������ ���� ����������� ������������� �����������
��
��
��
��
���
���
���
���
���
��������������������������������������������������������
�����������������������������������������������
�������
������������������������������������
������
���� �
�������
��������������
�������������
������
������
Figure 18: The total volume of open space and volume of space per capita for councils within the NSROC region, 2004/05

38
NORTHERN SYDNEY REGIONAL ORGANISATION OF COUNCILS
Responding to Community Needs for Open Space
The communities of NSROC place high importance on the effective management and retention of open space. Councils in the region have developed plans of management for their significant open space assets and these are regularly reviewed in conjunction with the community. Additionally councils continue to upgrade areas of open space with the help of state and federal government grants such as the NSW Greenspace Program and the Sharing Sydney Harbour Access Program.
Despite limited capacity for new or extended open space, work is done within NSROC councils to upgrade existing facilities for both active and passive recreation, including playground and picnic facilities. Maintenance and upgrading is carried out to improve the functional and aesthetic qualities of council’s developed open space but particular attention is paid to safety.
FIRE MANAGEMENTAlthough Australia’s ecosystems have evolved in the presence of fire, there is very little information on the impacts of altered fire regimes on the biodiversity in New South Wales. (Department of Environment and Conservation, 2000) Fire has a complex effect on native ecosystems and communities depending on the season, the frequency and the intensity of the fire regime, while different ecosystems react differently to fire and reactions vary according to the regime imposed. Hazard reduction burns are an important fire regime tool used to ensure that when a spontaneous bushfire does occur, the risk to human life and property is minimised.
The Bushfire Threat
On-going residential development and climate change provide significant pressures on the fire management regimes of the NSROC councils, particularly Hornsby Shire and Ku-ring-gai councils. In the NSROC region much bushland borders onto private property. The possibility of bushfires is therefore a significant concern especially for owners of properties edging onto bushland. Maintaining a balance between protecting property and life, and maintaining biodiversity is difficult, especially as the best fire regime for maintaining biodiversity in each plant community is not well understood.
Bushfire Risk in the Region
In the northern part of the NSROC region, bushland abuts a number of private properties and the possibility of bushfires provides a constraint for new development and redevelopment. In Hornsby Shire Council for example, large areas of land interfacing residential development and bushland have been assessed as medium to high bushfire hazard. The Rural Fires and Environmental Assessment Act 2002 requires local government to record on maps the land identified by the Commissioner of the NSW Rural Fire Service as bush fire prone land. Councils are required to prevent Development Consent being granted for certain purposes on bush fire prone land, unless the consent authority is satisfied that the development conforms to documented bush fire protection specifications or has consulted with the Commissioner.
Council Number of sites of hazard reduction burns
By hectare
North Sydney 7 2
Lane Cove 1 2
Hunters Hill 1 <1
Ryde 6 0.6
Ku-ring-gai 4 7.1
Hornsby Shire 31 231
Willoughby 3 3.5
NSROC 53 247.2
Figure 19: Fire management by LGA in the NSROC region, 2005
Maintaining a balance between protecting property, life and biodiversity is difficult, especially as the best fire regime for maintaining biodiversity in each plant community is not well understood.
PHO
TO: L
ES IR
WIG

39
STATE OF THE ENVIRONMENT REPORT 2005
Hazard Reduction in the NSROC Region
Fire management is undertaken in cooperation with the DEC, community fire units, local bushfire brigades, the NSW Fire Brigades and the NSW Rural Fire Service. Bushfire control measures are undertaken including hazard reduction burns. These protect property from bushfire hazards but at the same time can impact on biodiversity. Controlled burns change the natural bushfire regime in terms of frequency, season and intensity. This can effect the capacity of native species grow, flower and produce seeds and of the seeds to germinate. Willoughby City Council manages controlled burns as ecological burns, for which the preparation is undertaken years in advance of the actual burn to get the right ecological outcomes. (Noonan 2005)
Hazard reduction is done by hand at bushfire sites to remove fallen branches, leaf litter and large amounts of green waste, old timber and other rubbish dumped in the reserves by neighbouring residents. Some tree trimming is also done on public land, including where tree branches are overhanging buildings.
Controlled burns are used to keep the fuel load down so that if a fire is accidentally lit, it will be easier to control. The issue with controlled burns is that they change the fire regime in terms of intensity, frequency and season, and can affect a species capacity to regenerate.
Four of the NSROC councils have joined together to form the Hunters Hill/Lane Cove/Ryde/Willoughby Bush Fire Management Committee, which has prepared a Bush Fire Risk Management Plan and Plan of Operations in accordance with the Rural Fires Act 1997. Specific initiatives included a brochure Preparing your property in times of bushfire which was sent out to all new residents next to bushland as part of the new residents pack.
In the north of NSROC, Hornsby Shire and Ku-ring-gai Councils have joined together to develop the Hornsby Shire – Ku-ring-gai’s Bush Fire Risk Management Plan that has been prepared in accordance with the Rural Fires Act 1997. This plan identifies the level of bush fire risk across the Hornsby Shire and Ku-ring-gai LGAs and establishes strategies that relevant land managers will implement to manage bush fire risks.
INTRODUCED FLORA AND FAUNAFeral animals and free ranging pets disturb and prey on native marsupials, birds, reptiles and amphibians. They also use habitat that would otherwise be utilised by native species and may be responsible for spreading disease to native animal populations. Native fauna is also at risk from death or injury on roads from vehicles.
Feral Animals, Pests and Invasive Weeds
Introduced species can displace native species, reduce biodiversity and contribute to land degradation. Weed infestation is a major problem in bushland in the NSROC region. For example, in Hornsby Shire there are 46 species on the noxious weed list including the common lantana, pampas grass, castor oil plant and blackberry along with aquatic plants alligator weed, water hyacinth and salvinia. Weed invasion threatens the Blue Gum High Forest and Sydney Turpentine-Ironbark threatened plant communities in Ku-ring-gai.
Status of Introduced Species
Introduced species displace native species, reduce biodiversity, reduce farm and forest productivity, affect human and animal health and contribute significantly to land degradation. The introduction of feral animal species, in particular, foxes and cats, has led to the decline of native mammals, birds, reptiles and frogs through predation and competition for food and habitat. Introduced plant species or weeds compete with native plants for sunlight and space and reduce natural vegetation, which can impact food and habitat availability for native fauna.
Controlled burns are used to keep the fuel load down so that if a fire is accidentally lit, it will be easier to control. The issue with controlled burns is that they change the fire regime in terms of intensity, frequency and season, and can affect a species capacity to regenerate.
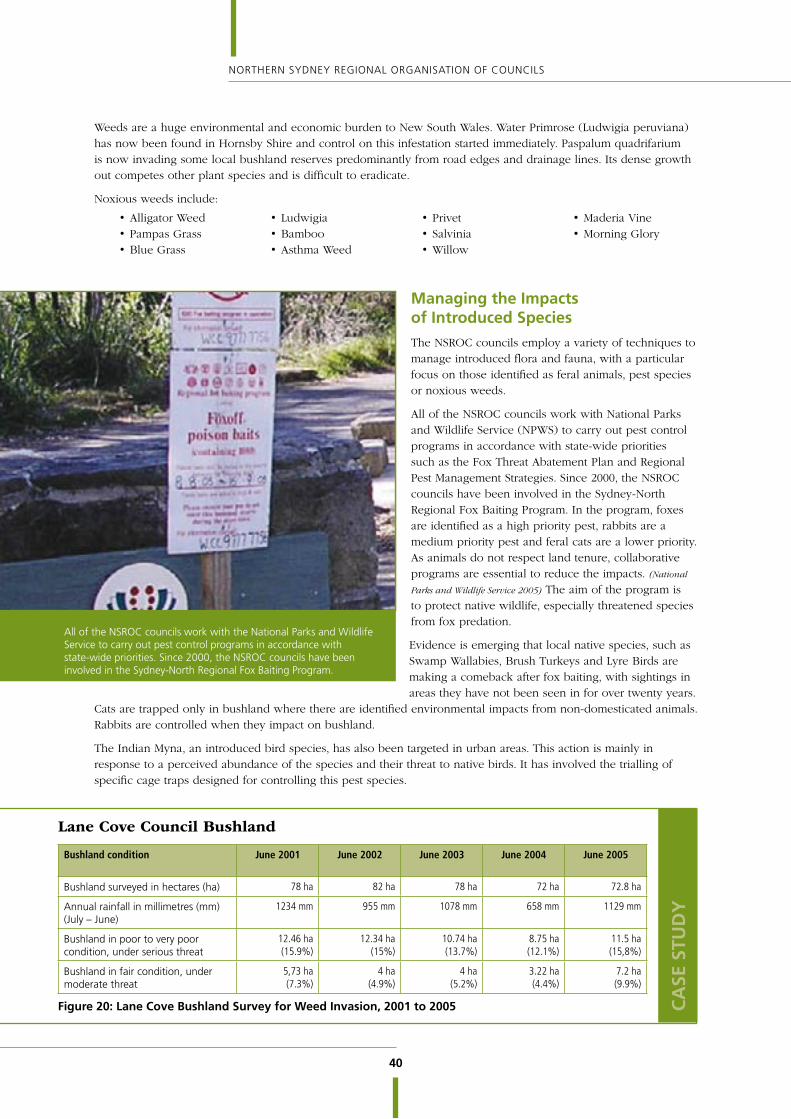
40
NORTHERN SYDNEY REGIONAL ORGANISATION OF COUNCILS
Weeds are a huge environmental and economic burden to New South Wales. Water Primrose (Ludwigia peruviana) has now been found in Hornsby Shire and control on this infestation started immediately. Paspalum quadrifarium is now invading some local bushland reserves predominantly from road edges and drainage lines. Its dense growth out competes other plant species and is difficult to eradicate.
Noxious weeds include:
• Alligator Weed• Pampas Grass• Blue Grass
• Ludwigia• Bamboo• Asthma Weed
• Privet• Salvinia• Willow
• Maderia Vine• Morning Glory
Managing the Impacts of Introduced Species
The NSROC councils employ a variety of techniques to manage introduced flora and fauna, with a particular focus on those identified as feral animals, pest species or noxious weeds.
All of the NSROC councils work with National Parks and Wildlife Service (NPWS) to carry out pest control programs in accordance with state-wide priorities such as the Fox Threat Abatement Plan and Regional Pest Management Strategies. Since 2000, the NSROC councils have been involved in the Sydney-North Regional Fox Baiting Program. In the program, foxes are identified as a high priority pest, rabbits are a medium priority pest and feral cats are a lower priority. As animals do not respect land tenure, collaborative programs are essential to reduce the impacts. (National
Parks and Wildlife Service 2005) The aim of the program is to protect native wildlife, especially threatened species from fox predation.
Evidence is emerging that local native species, such as Swamp Wallabies, Brush Turkeys and Lyre Birds are making a comeback after fox baiting, with sightings in areas they have not been seen in for over twenty years.
Cats are trapped only in bushland where there are identified environmental impacts from non-domesticated animals. Rabbits are controlled when they impact on bushland.
The Indian Myna, an introduced bird species, has also been targeted in urban areas. This action is mainly in response to a perceived abundance of the species and their threat to native birds. It has involved the trialling of specific cage traps designed for controlling this pest species.
Lane Cove Council Bushland
Bushland condition June 2001 June 2002 June 2003 June 2004 June 2005
Bushland surveyed in hectares (ha) 78 ha 82 ha 78 ha 72 ha 72.8 ha
Annual rainfall in millimetres (mm)(July – June)
1234 mm 955 mm 1078 mm 658 mm 1129 mm
Bushland in poor to very poor condition, under serious threat
12.46 ha(15.9%)
12.34 ha(15%)
10.74 ha(13.7%)
8.75 ha(12.1%)
11.5 ha(15,8%)
Bushland in fair condition, under moderate threat
5,73 ha(7.3%)
4 ha(4.9%)
4 ha(5.2%)
3.22 ha(4.4%)
7.2 ha(9.9%)
Figure 20: Lane Cove Bushland Survey for Weed Invasion, 2001 to 2005 CA
SE S
TUD
Y
All of the NSROC councils work with the National Parks and Wildlife Service to carry out pest control programs in accordance with state-wide priorities. Since 2000, the NSROC councils have been involved in the Sydney-North Regional Fox Baiting Program.
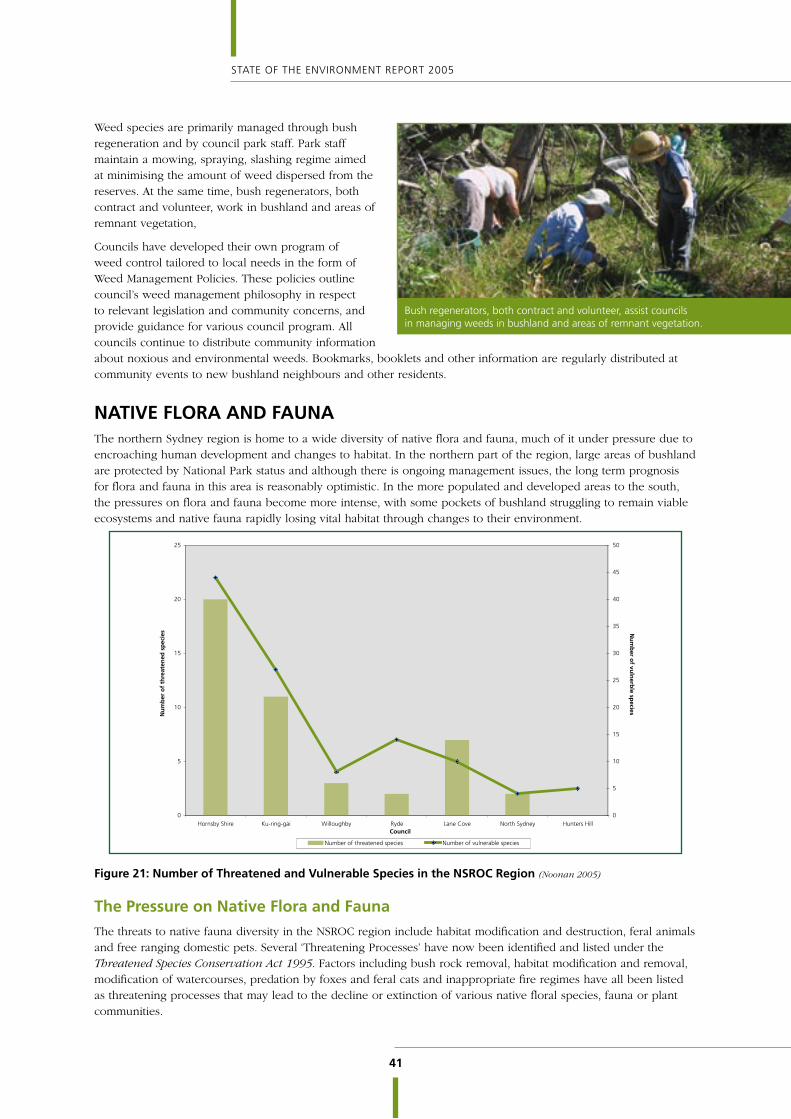
41
STATE OF THE ENVIRONMENT REPORT 2005
Weed species are primarily managed through bush regeneration and by council park staff. Park staff maintain a mowing, spraying, slashing regime aimed at minimising the amount of weed dispersed from the reserves. At the same time, bush regenerators, both contract and volunteer, work in bushland and areas of remnant vegetation,
Councils have developed their own program of weed control tailored to local needs in the form of Weed Management Policies. These policies outline council’s weed management philosophy in respect to relevant legislation and community concerns, and provide guidance for various council program. All councils continue to distribute community information about noxious and environmental weeds. Bookmarks, booklets and other information are regularly distributed at community events to new bushland neighbours and other residents.
NATIVE FLORA AND FAUNAThe northern Sydney region is home to a wide diversity of native flora and fauna, much of it under pressure due to encroaching human development and changes to habitat. In the northern part of the region, large areas of bushland are protected by National Park status and although there is ongoing management issues, the long term prognosis for flora and fauna in this area is reasonably optimistic. In the more populated and developed areas to the south, the pressures on flora and fauna become more intense, with some pockets of bushland struggling to remain viable ecosystems and native fauna rapidly losing vital habitat through changes to their environment.
�
�
��
��
��
��
������������� ����������� ���������� ���� ��������� ������������ �������������
�
��
��
��
��
��
��
��
��
��
���������������������������� ����������������������������
�������
���������������������������� �
�������
���������
����������
Figure 21: Number of Threatened and Vulnerable Species in the NSROC Region (Noonan 2005)
The Pressure on Native Flora and Fauna
The threats to native fauna diversity in the NSROC region include habitat modification and destruction, feral animals and free ranging domestic pets. Several ‘Threatening Processes’ have now been identified and listed under the Threatened Species Conservation Act 1995. Factors including bush rock removal, habitat modification and removal, modification of watercourses, predation by foxes and feral cats and inappropriate fire regimes have all been listed as threatening processes that may lead to the decline or extinction of various native floral species, fauna or plant communities.
Bush regenerators, both contract and volunteer, assist councils in managing weeds in bushland and areas of remnant vegetation.
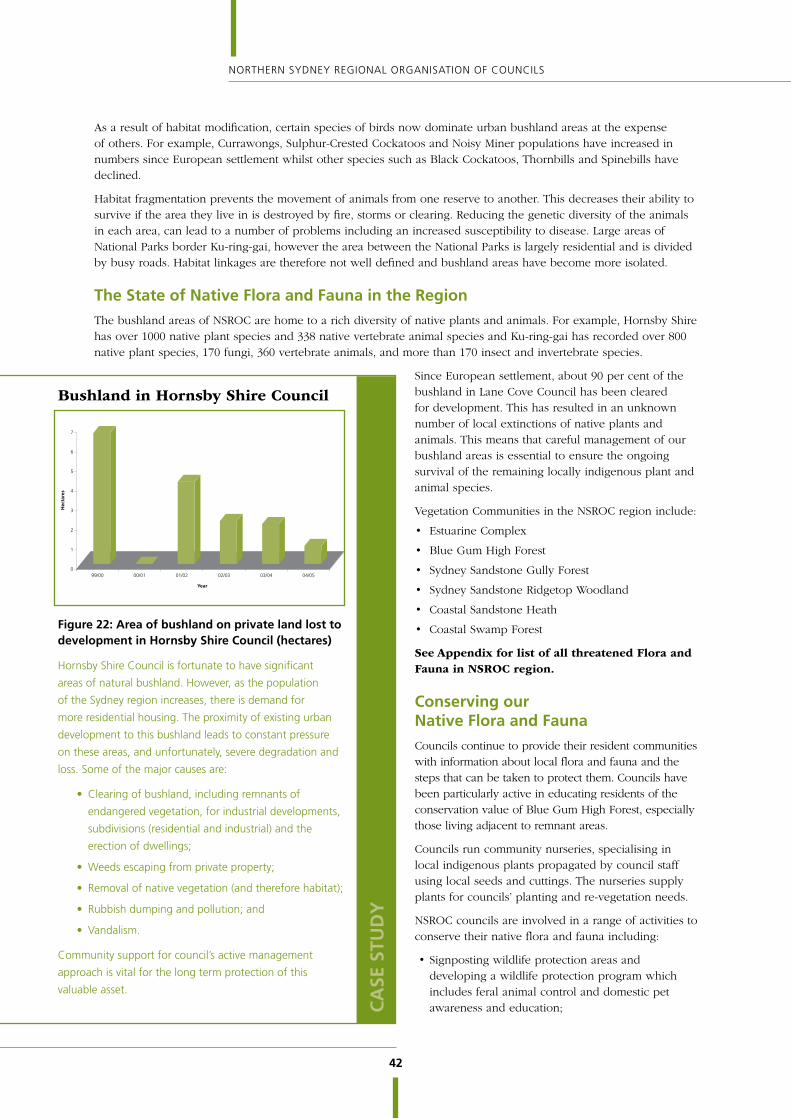
42
NORTHERN SYDNEY REGIONAL ORGANISATION OF COUNCILS
As a result of habitat modification, certain species of birds now dominate urban bushland areas at the expense of others. For example, Currawongs, Sulphur-Crested Cockatoos and Noisy Miner populations have increased in numbers since European settlement whilst other species such as Black Cockatoos, Thornbills and Spinebills have declined.
Habitat fragmentation prevents the movement of animals from one reserve to another. This decreases their ability to survive if the area they live in is destroyed by fire, storms or clearing. Reducing the genetic diversity of the animals in each area, can lead to a number of problems including an increased susceptibility to disease. Large areas of National Parks border Ku-ring-gai, however the area between the National Parks is largely residential and is divided by busy roads. Habitat linkages are therefore not well defined and bushland areas have become more isolated.
The State of Native Flora and Fauna in the Region
The bushland areas of NSROC are home to a rich diversity of native plants and animals. For example, Hornsby Shire has over 1000 native plant species and 338 native vertebrate animal species and Ku-ring-gai has recorded over 800 native plant species, 170 fungi, 360 vertebrate animals, and more than 170 insect and invertebrate species.
Since European settlement, about 90 per cent of the bushland in Lane Cove Council has been cleared for development. This has resulted in an unknown number of local extinctions of native plants and animals. This means that careful management of our bushland areas is essential to ensure the ongoing survival of the remaining locally indigenous plant and animal species.
Vegetation Communities in the NSROC region include:
• Estuarine Complex
• Blue Gum High Forest
• Sydney Sandstone Gully Forest
• Sydney Sandstone Ridgetop Woodland
• Coastal Sandstone Heath
• Coastal Swamp Forest
See Appendix for list of all threatened Flora and Fauna in NSROC region.
Conserving our Native Flora and Fauna
Councils continue to provide their resident communities with information about local flora and fauna and the steps that can be taken to protect them. Councils have been particularly active in educating residents of the conservation value of Blue Gum High Forest, especially those living adjacent to remnant areas.
Councils run community nurseries, specialising in local indigenous plants propagated by council staff using local seeds and cuttings. The nurseries supply plants for councils’ planting and re-vegetation needs.
NSROC councils are involved in a range of activities to conserve their native flora and fauna including:
• Signposting wildlife protection areas and developing a wildlife protection program which includes feral animal control and domestic pet awareness and education;
Bushland in Hornsby Shire Council
�
�
�
�
�
�
�
�
����� ����� ����� ����� ����� �����
����
��������
Figure 22: Area of bushland on private land lost to development in Hornsby Shire Council (hectares)
Hornsby Shire Council is fortunate to have significant
areas of natural bushland. However, as the population
of the Sydney region increases, there is demand for
more residential housing. The proximity of existing urban
development to this bushland leads to constant pressure
on these areas, and unfortunately, severe degradation and
loss. Some of the major causes are:
• Clearing of bushland, including remnants of
endangered vegetation, for industrial developments,
subdivisions (residential and industrial) and the
erection of dwellings;
• Weeds escaping from private property;
• Removal of native vegetation (and therefore habitat);
• Rubbish dumping and pollution; and
• Vandalism.
Community support for council’s active management
approach is vital for the long term protection of this
valuable asset.
CA
SE S
TUD
Y
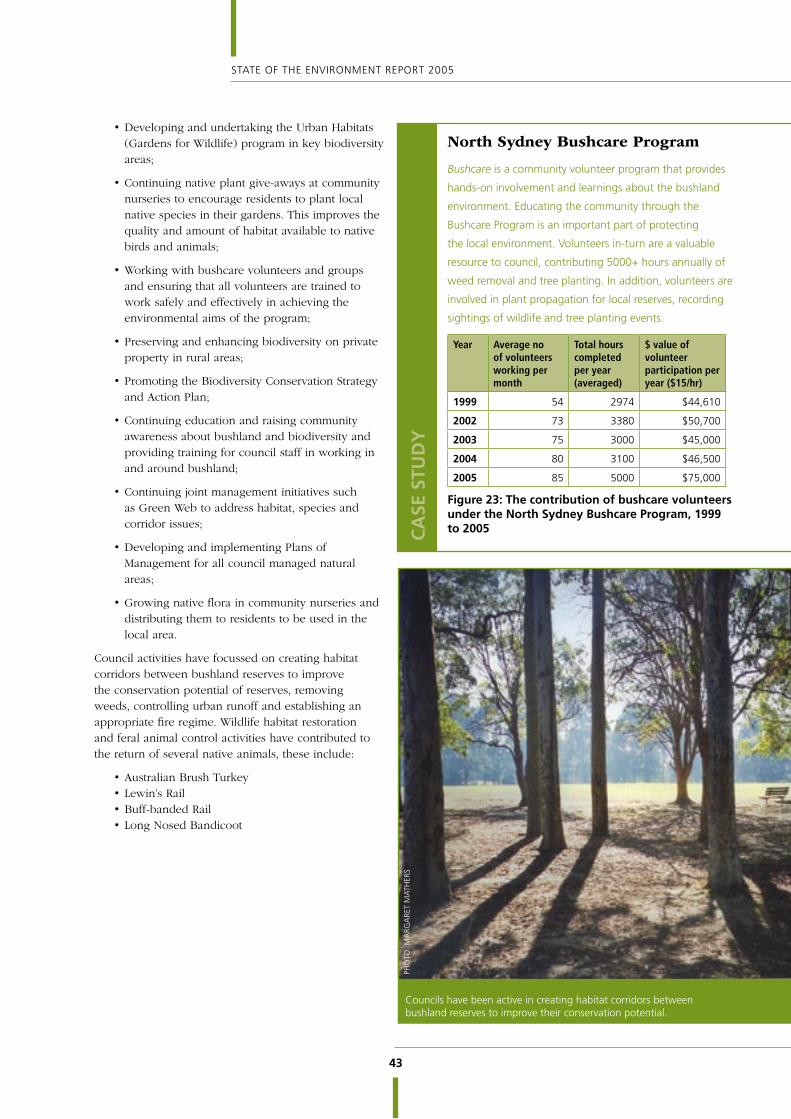
43
STATE OF THE ENVIRONMENT REPORT 2005
Councils have been active in creating habitat corridors between bushland reserves to improve their conservation potential.
• Developing and undertaking the Urban Habitats (Gardens for Wildlife) program in key biodiversity areas;
• Continuing native plant give-aways at community nurseries to encourage residents to plant local native species in their gardens. This improves the quality and amount of habitat available to native birds and animals;
• Working with bushcare volunteers and groups and ensuring that all volunteers are trained to work safely and effectively in achieving the environmental aims of the program;
• Preserving and enhancing biodiversity on private property in rural areas;
• Promoting the Biodiversity Conservation Strategy and Action Plan;
• Continuing education and raising community awareness about bushland and biodiversity and providing training for council staff in working in and around bushland;
• Continuing joint management initiatives such as Green Web to address habitat, species and corridor issues;
• Developing and implementing Plans of Management for all council managed natural areas;
• Growing native flora in community nurseries and distributing them to residents to be used in the local area.
Council activities have focussed on creating habitat corridors between bushland reserves to improve the conservation potential of reserves, removing weeds, controlling urban runoff and establishing an appropriate fire regime. Wildlife habitat restoration and feral animal control activities have contributed to the return of several native animals, these include:
• Australian Brush Turkey• Lewin’s Rail• Buff-banded Rail• Long Nosed Bandicoot
North Sydney Bushcare Program
Bushcare is a community volunteer program that provides
hands-on involvement and learnings about the bushland
environment. Educating the community through the
Bushcare Program is an important part of protecting
the local environment. Volunteers in-turn are a valuable
resource to council, contributing 5000+ hours annually of
weed removal and tree planting. In addition, volunteers are
involved in plant propagation for local reserves, recording
sightings of wildlife and tree planting events.
Year Average no of volunteers working per month
Total hours completed per year (averaged)
$ value of volunteer participation per year ($15/hr)
1999 54 2974 $44,610
2002 73 3380 $50,700
2003 75 3000 $45,000
2004 80 3100 $46,500
2005 85 5000 $75,000
Figure 23: The contribution of bushcare volunteers under the North Sydney Bushcare Program, 1999 to 2005C
ASE
STU
DY
PH
OTO
: MA
RGA
RET
MA
THER
S
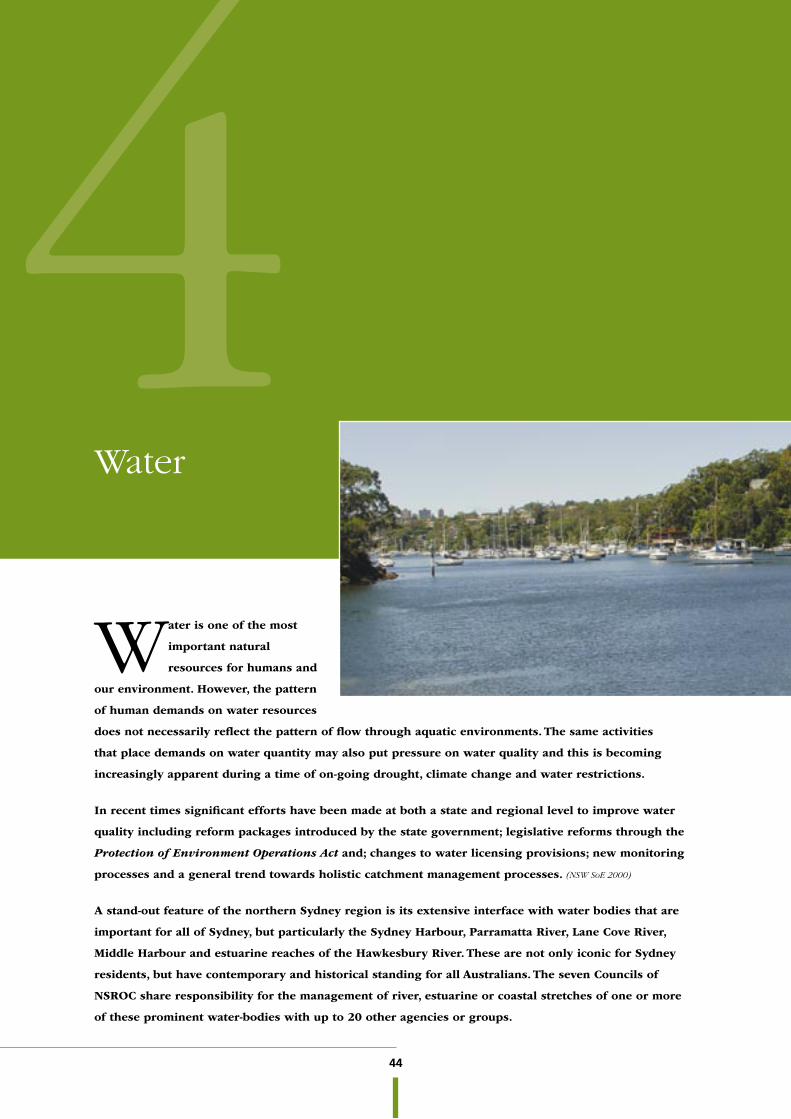
44
NORTHERN SYDNEY REGIONAL ORGANISATION OF COUNCILS
Water is one of the most
important natural
resources for humans and
our environment. However, the pattern
of human demands on water resources
does not necessarily reflect the pattern of flow through aquatic environments. The same activities
that place demands on water quantity may also put pressure on water quality and this is becoming
increasingly apparent during a time of on-going drought, climate change and water restrictions.
In recent times significant efforts have been made at both a state and regional level to improve water
quality including reform packages introduced by the state government; legislative reforms through the
Protection of Environment Operations Act and; changes to water licensing provisions; new monitoring
processes and a general trend towards holistic catchment management processes. (NSW SoE 2000)
A stand-out feature of the northern Sydney region is its extensive interface with water bodies that are
important for all of Sydney, but particularly the Sydney Harbour, Parramatta River, Lane Cove River,
Middle Harbour and estuarine reaches of the Hawkesbury River. These are not only iconic for Sydney
residents, but have contemporary and historical standing for all Australians. The seven Councils of
NSROC share responsibility for the management of river, estuarine or coastal stretches of one or more
of these prominent water-bodies with up to 20 other agencies or groups.
4Water
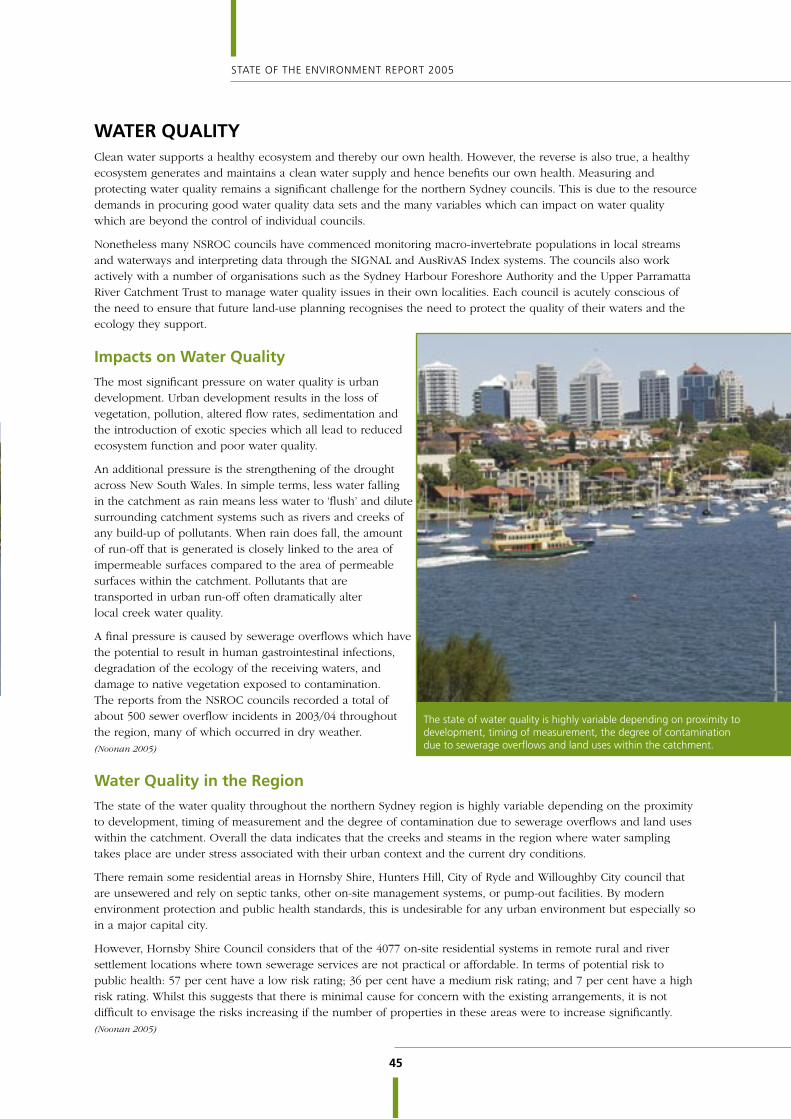
45
STATE OF THE ENVIRONMENT REPORT 2005
WATER QUALITYClean water supports a healthy ecosystem and thereby our own health. However, the reverse is also true, a healthy ecosystem generates and maintains a clean water supply and hence benefits our own health. Measuring and protecting water quality remains a significant challenge for the northern Sydney councils. This is due to the resource demands in procuring good water quality data sets and the many variables which can impact on water quality which are beyond the control of individual councils.
Nonetheless many NSROC councils have commenced monitoring macro-invertebrate populations in local streams and waterways and interpreting data through the SIGNAL and AusRivAS Index systems. The councils also work actively with a number of organisations such as the Sydney Harbour Foreshore Authority and the Upper Parramatta River Catchment Trust to manage water quality issues in their own localities. Each council is acutely conscious of the need to ensure that future land-use planning recognises the need to protect the quality of their waters and the ecology they support.
Impacts on Water Quality
The most significant pressure on water quality is urban development. Urban development results in the loss of vegetation, pollution, altered flow rates, sedimentation and the introduction of exotic species which all lead to reduced ecosystem function and poor water quality.
An additional pressure is the strengthening of the drought across New South Wales. In simple terms, less water falling in the catchment as rain means less water to ‘flush’ and dilute surrounding catchment systems such as rivers and creeks of any build-up of pollutants. When rain does fall, the amount of run-off that is generated is closely linked to the area of impermeable surfaces compared to the area of permeable surfaces within the catchment. Pollutants that are transported in urban run-off often dramatically alter local creek water quality.
A final pressure is caused by sewerage overflows which have the potential to result in human gastrointestinal infections, degradation of the ecology of the receiving waters, and damage to native vegetation exposed to contamination. The reports from the NSROC councils recorded a total of about 500 sewer overflow incidents in 2003/04 throughout the region, many of which occurred in dry weather. (Noonan 2005)
Water Quality in the Region
The state of the water quality throughout the northern Sydney region is highly variable depending on the proximity to development, timing of measurement and the degree of contamination due to sewerage overflows and land uses within the catchment. Overall the data indicates that the creeks and steams in the region where water sampling takes place are under stress associated with their urban context and the current dry conditions.
There remain some residential areas in Hornsby Shire, Hunters Hill, City of Ryde and Willoughby City council that are unsewered and rely on septic tanks, other on-site management systems, or pump-out facilities. By modern environment protection and public health standards, this is undesirable for any urban environment but especially so in a major capital city.
However, Hornsby Shire Council considers that of the 4077 on-site residential systems in remote rural and river settlement locations where town sewerage services are not practical or affordable. In terms of potential risk to public health: 57 per cent have a low risk rating; 36 per cent have a medium risk rating; and 7 per cent have a high risk rating. Whilst this suggests that there is minimal cause for concern with the existing arrangements, it is not difficult to envisage the risks increasing if the number of properties in these areas were to increase significantly. (Noonan 2005)
The state of water quality is highly variable depending on proximity to development, timing of measurement, the degree of contamination due to sewerage overflows and land uses within the catchment.
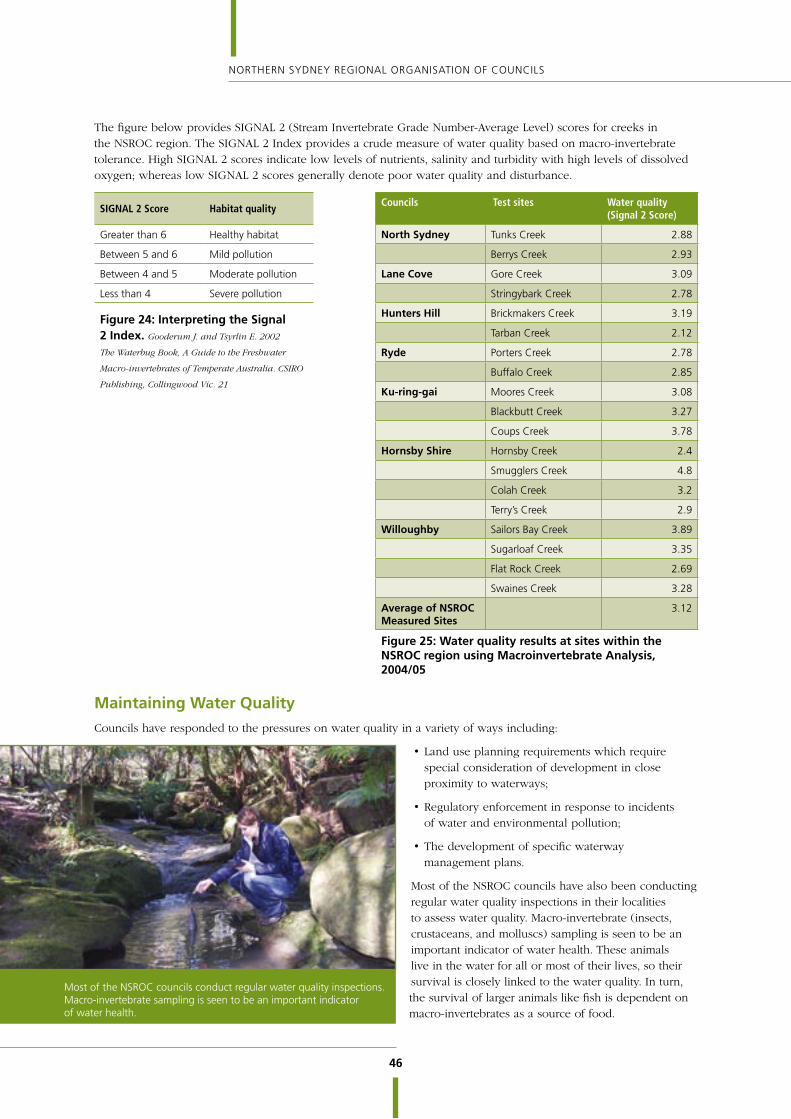
46
NORTHERN SYDNEY REGIONAL ORGANISATION OF COUNCILS
The figure below provides SIGNAL 2 (Stream Invertebrate Grade Number-Average Level) scores for creeks in the NSROC region. The SIGNAL 2 Index provides a crude measure of water quality based on macro-invertebrate tolerance. High SIGNAL 2 scores indicate low levels of nutrients, salinity and turbidity with high levels of dissolved oxygen; whereas low SIGNAL 2 scores generally denote poor water quality and disturbance.
SIGNAL 2 Score Habitat qualityCouncils Test sites Water quality
(Signal 2 Score)
Greater than 6 Healthy habitat North Sydney Tunks Creek 2.88
Between 5 and 6 Mild pollution Berrys Creek 2.93
Between 4 and 5 Moderate pollution Lane Cove Gore Creek 3.09
Less than 4 Severe pollution Stringybark Creek 2.78
Figure 24: Interpreting the Signal 2 Index. Gooderum J. and Tsyrlin E. 2002
The Waterbug Book, A Guide to the Freshwater
Macro-invertebrates of Temperate Australia. CSIRO
Publishing, Collingwood Vic. 21
Hunters Hill Brickmakers Creek 3.19
Tarban Creek 2.12
Ryde Porters Creek 2.78
Buffalo Creek 2.85
Ku-ring-gai Moores Creek 3.08
Blackbutt Creek 3.27
Coups Creek 3.78
Hornsby Shire Hornsby Creek 2.4
Smugglers Creek 4.8
Colah Creek 3.2
Terry’s Creek 2.9
Willoughby Sailors Bay Creek 3.89
Sugarloaf Creek 3.35
Flat Rock Creek 2.69
Swaines Creek 3.28
Average of NSROC Measured Sites
3.12
Figure 25: Water quality results at sites within the NSROC region using Macroinvertebrate Analysis, 2004/05
Maintaining Water Quality
Councils have responded to the pressures on water quality in a variety of ways including:
• Land use planning requirements which require special consideration of development in close proximity to waterways;
• Regulatory enforcement in response to incidents of water and environmental pollution;
• The development of specific waterway management plans.
Most of the NSROC councils have also been conducting regular water quality inspections in their localities to assess water quality. Macro-invertebrate (insects, crustaceans, and molluscs) sampling is seen to be an important indicator of water health. These animals live in the water for all or most of their lives, so their survival is closely linked to the water quality. In turn, the survival of larger animals like fish is dependent on macro-invertebrates as a source of food.
Most of the NSROC councils conduct regular water quality inspections. Macro-invertebrate sampling is seen to be an important indicator of water health.
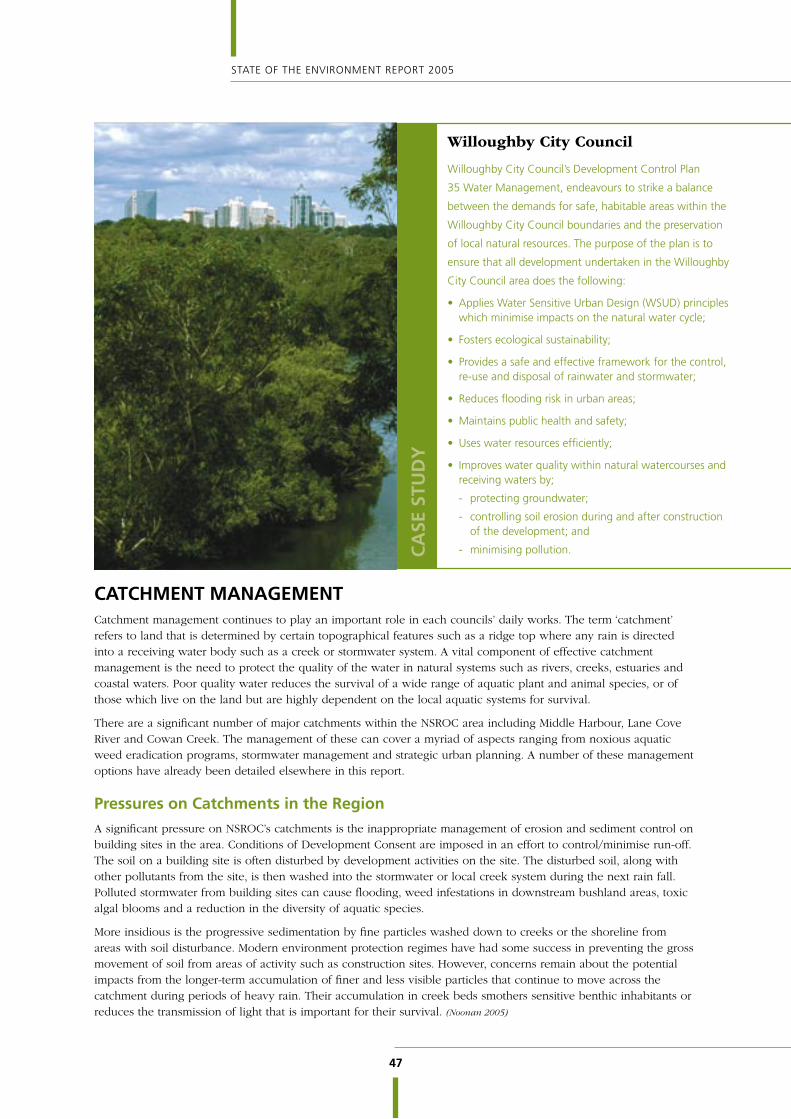
47
STATE OF THE ENVIRONMENT REPORT 2005
CATCHMENT MANAGEMENTCatchment management continues to play an important role in each councils’ daily works. The term ‘catchment’ refers to land that is determined by certain topographical features such as a ridge top where any rain is directed into a receiving water body such as a creek or stormwater system. A vital component of effective catchment management is the need to protect the quality of the water in natural systems such as rivers, creeks, estuaries and coastal waters. Poor quality water reduces the survival of a wide range of aquatic plant and animal species, or of those which live on the land but are highly dependent on the local aquatic systems for survival.
There are a significant number of major catchments within the NSROC area including Middle Harbour, Lane Cove River and Cowan Creek. The management of these can cover a myriad of aspects ranging from noxious aquatic weed eradication programs, stormwater management and strategic urban planning. A number of these management options have already been detailed elsewhere in this report.
Pressures on Catchments in the Region
A significant pressure on NSROC’s catchments is the inappropriate management of erosion and sediment control on building sites in the area. Conditions of Development Consent are imposed in an effort to control/minimise run-off. The soil on a building site is often disturbed by development activities on the site. The disturbed soil, along with other pollutants from the site, is then washed into the stormwater or local creek system during the next rain fall. Polluted stormwater from building sites can cause flooding, weed infestations in downstream bushland areas, toxic algal blooms and a reduction in the diversity of aquatic species.
More insidious is the progressive sedimentation by fine particles washed down to creeks or the shoreline from areas with soil disturbance. Modern environment protection regimes have had some success in preventing the gross movement of soil from areas of activity such as construction sites. However, concerns remain about the potential impacts from the longer-term accumulation of finer and less visible particles that continue to move across the catchment during periods of heavy rain. Their accumulation in creek beds smothers sensitive benthic inhabitants or reduces the transmission of light that is important for their survival. (Noonan 2005)
Willoughby City Council
Willoughby City Council’s Development Control Plan
35 Water Management, endeavours to strike a balance
between the demands for safe, habitable areas within the
Willoughby City Council boundaries and the preservation
of local natural resources. The purpose of the plan is to
ensure that all development undertaken in the Willoughby
City Council area does the following:
• Applies Water Sensitive Urban Design (WSUD) principles which minimise impacts on the natural water cycle;
• Fosters ecological sustainability;
• Provides a safe and effective framework for the control, re-use and disposal of rainwater and stormwater;
• Reduces flooding risk in urban areas;
• Maintains public health and safety;
• Uses water resources efficiently;
• Improves water quality within natural watercourses and receiving waters by;
- protecting groundwater;
- controlling soil erosion during and after construction of the development; and
- minimising pollution. CA
SE S
TUD
Y

48
NORTHERN SYDNEY REGIONAL ORGANISATION OF COUNCILS
Condition of the NSROC Catchments
The National Land and Water Resources Audit of 2002 assessed the overall riverine ecosystem health of the waters throughout NSW. It based its findings on the macro-invertebrate data collected in the National River Health Program between 1994 and 1999, as well as other data available on catchment and riverine habitat condition, hydrological disturbance and water quality. The Audit’s main findings were:
• NSW has the poorest aquatic biota condition of any Australian state or territory, with macro-invertebrate communities impaired along 50 per cent of the length of rivers assessed.
• The environmental condition of 97 per cent of the assessed river length in NSW had been modified, resulting in catchment disturbance from nutrients (especially total phosphorus) and suspended sediments in 97 per cent; altered hydrologic regimes in 87 per cent; and modified aquatic habitat in 70 per cent of the assessed river length.
Of particular relevance to NSROC was that the most severely impaired sites were close to urban areas including the Parramatta and Lane Cove Rivers.
An analysis of faecal coliform pollution on the waterways around the NSROC region shows a high degree of compliance although this is in part due to low rainfall conditions (see below). In harbour sites in the lower Parramatta River and in Darling Harbour remain problematic due to historic and current industrial activity.
Year Season Faecal Coliform Seasonal Compliance
Enterococci Seasonal Compliance
Site Name Area / Waterway
2004-05 Summer 100 90 Tambourine Bay Lower Lane Cove River
2004-05 Winter 100 91 Tambourine Bay Lower Lane Cove River
2004-05 Summer 100 90 Woodford Bay Lower Lane Cove River
2004-05 Winter 100 100 Woodford Bay Lower Lane Cove River
2004-05 Summer 100 97 Woolwich Baths Lower Lane Cove River
2004-05 Winter 100 100 Woolwich Baths Lower Lane Cove River
2004-05 Summer 100 84 Cabarita Beach Lower Parramatta River
2004-05 Winter 100 91 Cabarita Beach Lower Parramatta River
2004-05 Summer 84 84 Chiswick Baths Lower Parramatta River
2004-05 Winter 100 91 Chiswick Baths Lower Parramatta River
2004-05 Summer 23 35 Darling Harbour Lower Parramatta River
2004-05 Winter 41 32 Darling Harbour Lower Parramatta River
2004-05 Summer 100 87 Dawn Fraser Pool Lower Parramatta River
2004-05 Winter 91 91 Dawn Fraser Pool Lower Parramatta River
2004-05 Summer 100 87 Greenwich Baths Lower Parramatta River
2004-05 Winter 100 91 Greenwich Baths Lower Parramatta River
2004-05 Summer 100 100 Henley Baths Lower Parramatta River
2004-05 Winter 100 100 Henley Baths Lower Parramatta River
2004-05 Summer 100 100 Clontarf Pool Middle Harbour
2004-05 Winter 100 91 Clontarf Pool Middle Harbour
2004-05 Summer 100 100 Edwards Beach Middle Harbour
2004-05 Winter 100 100 Edwards Beach Middle Harbour
2004-05 Summer 100 94 Gurney Crescent Baths Middle Harbour
2004-05 Winter 100 91 Gurney Crescent Baths Middle Harbour
2004-05 Summer 90 77 Northbridge Baths Middle Harbour
2004-05 Winter 100 100 Northbridge Baths Middle Harbour
2004-05 Summer 100 100 Clifton Gardens Port Jackson
2004-05 Winter 100 100 Clifton Gardens Port Jackson
2004-05 Summer 97 87 Hayes Street Beach Port Jackson
2004-05 Winter 100 100 Hayes Street Beach Port Jackson
2004-05 Summer 97 23 Little Sirius Cove Port Jackson
2004-05 Winter 100 100 Little Sirius Cove Port Jackson
Figure 26: Incidences of pollution at NSROC Beaches, 2005 (Beachwatch 2005)
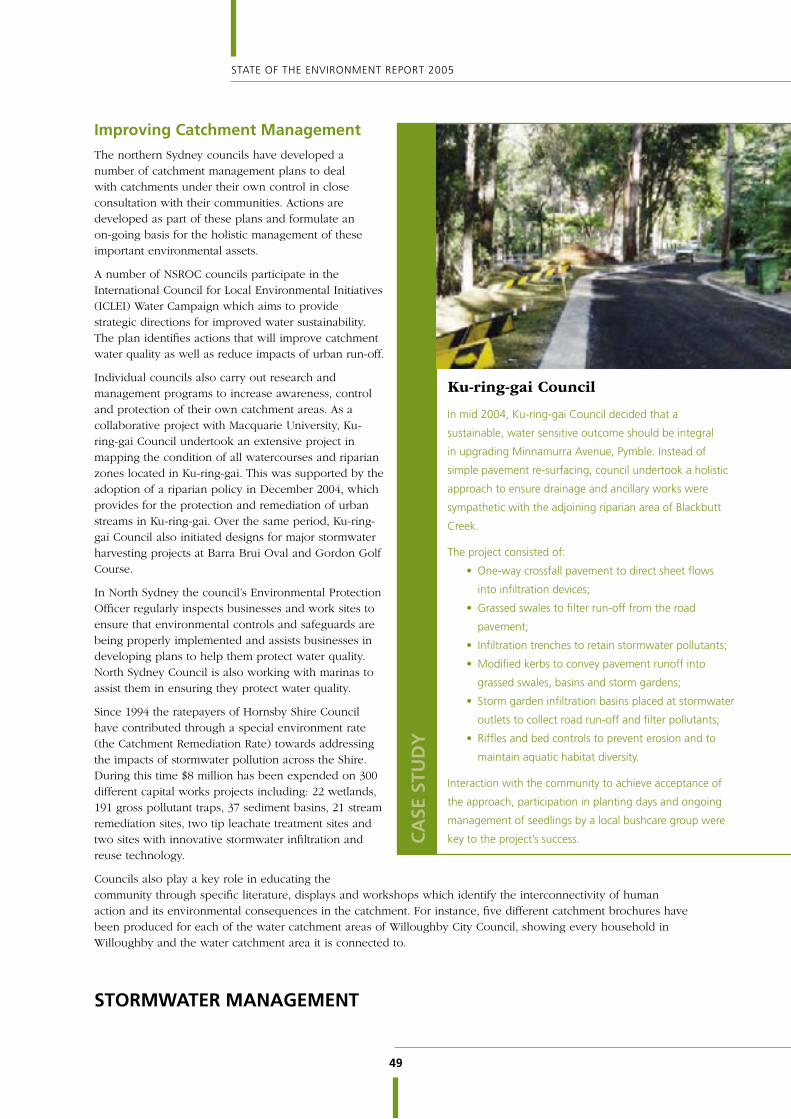
49
STATE OF THE ENVIRONMENT REPORT 2005
Improving Catchment Management
The northern Sydney councils have developed a number of catchment management plans to deal with catchments under their own control in close consultation with their communities. Actions are developed as part of these plans and formulate an on-going basis for the holistic management of these important environmental assets.
A number of NSROC councils participate in the International Council for Local Environmental Initiatives (ICLEI) Water Campaign which aims to provide strategic directions for improved water sustainability. The plan identifies actions that will improve catchment water quality as well as reduce impacts of urban run-off.
Individual councils also carry out research and management programs to increase awareness, control and protection of their own catchment areas. As a collaborative project with Macquarie University, Ku-ring-gai Council undertook an extensive project in mapping the condition of all watercourses and riparian zones located in Ku-ring-gai. This was supported by the adoption of a riparian policy in December 2004, which provides for the protection and remediation of urban streams in Ku-ring-gai. Over the same period, Ku-ring-gai Council also initiated designs for major stormwater harvesting projects at Barra Brui Oval and Gordon Golf Course.
In North Sydney the council’s Environmental Protection Officer regularly inspects businesses and work sites to ensure that environmental controls and safeguards are being properly implemented and assists businesses in developing plans to help them protect water quality. North Sydney Council is also working with marinas to assist them in ensuring they protect water quality.
Since 1994 the ratepayers of Hornsby Shire Council have contributed through a special environment rate (the Catchment Remediation Rate) towards addressing the impacts of stormwater pollution across the Shire. During this time $8 million has been expended on 300 different capital works projects including: 22 wetlands, 191 gross pollutant traps, 37 sediment basins, 21 stream remediation sites, two tip leachate treatment sites and two sites with innovative stormwater infiltration and reuse technology.
Councils also play a key role in educating the community through specific literature, displays and workshops which identify the interconnectivity of human action and its environmental consequences in the catchment. For instance, five different catchment brochures have been produced for each of the water catchment areas of Willoughby City Council, showing every household in Willoughby and the water catchment area it is connected to.
STORMWATER MANAGEMENT
Ku-ring-gai Council
In mid 2004, Ku-ring-gai Council decided that a
sustainable, water sensitive outcome should be integral
in upgrading Minnamurra Avenue, Pymble. Instead of
simple pavement re-surfacing, council undertook a holistic
approach to ensure drainage and ancillary works were
sympathetic with the adjoining riparian area of Blackbutt
Creek.
The project consisted of:
• One-way crossfall pavement to direct sheet flows
into infiltration devices;
• Grassed swales to filter run-off from the road
pavement;
• Infiltration trenches to retain stormwater pollutants;
• Modified kerbs to convey pavement runoff into
grassed swales, basins and storm gardens;
• Storm garden infiltration basins placed at stormwater
outlets to collect road run-off and filter pollutants;
• Riffles and bed controls to prevent erosion and to
maintain aquatic habitat diversity.
Interaction with the community to achieve acceptance of
the approach, participation in planting days and ongoing
management of seedlings by a local bushcare group were
key to the project’s success. CA
SE S
TUD
Y
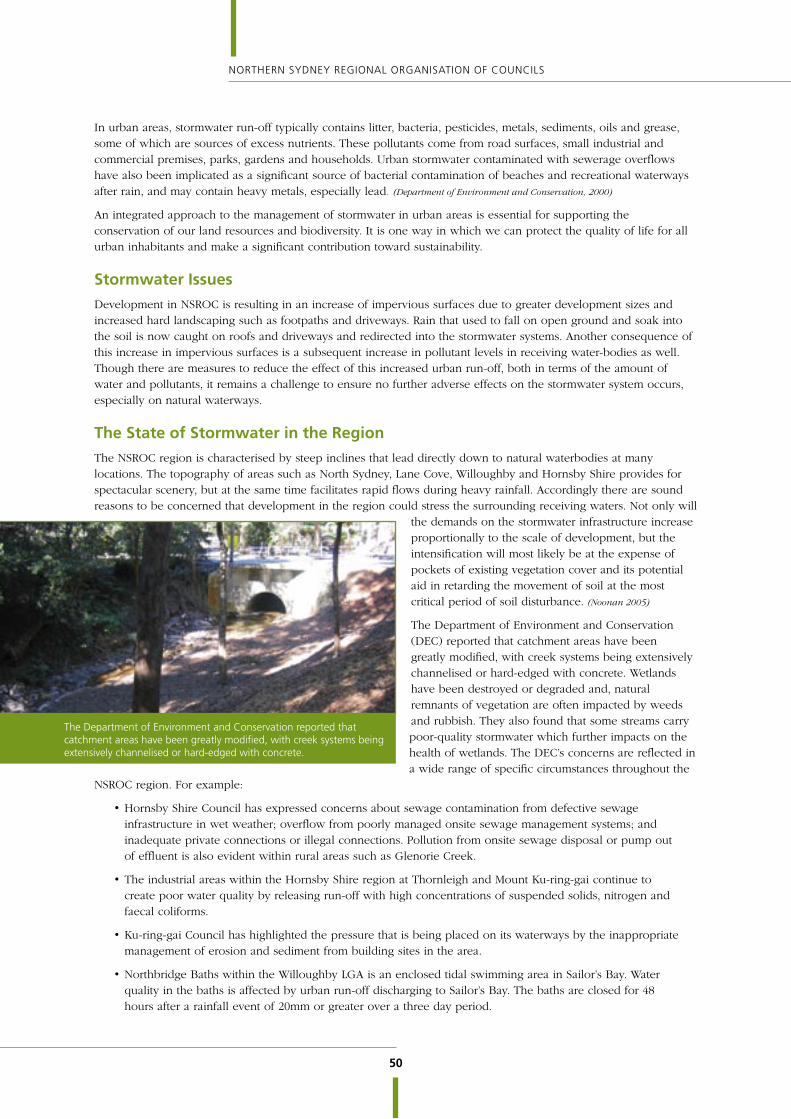
50
NORTHERN SYDNEY REGIONAL ORGANISATION OF COUNCILS
In urban areas, stormwater run-off typically contains litter, bacteria, pesticides, metals, sediments, oils and grease, some of which are sources of excess nutrients. These pollutants come from road surfaces, small industrial and commercial premises, parks, gardens and households. Urban stormwater contaminated with sewerage overflows have also been implicated as a significant source of bacterial contamination of beaches and recreational waterways after rain, and may contain heavy metals, especially lead. (Department of Environment and Conservation, 2000)
An integrated approach to the management of stormwater in urban areas is essential for supporting the conservation of our land resources and biodiversity. It is one way in which we can protect the quality of life for all urban inhabitants and make a significant contribution toward sustainability.
Stormwater Issues
Development in NSROC is resulting in an increase of impervious surfaces due to greater development sizes and increased hard landscaping such as footpaths and driveways. Rain that used to fall on open ground and soak into the soil is now caught on roofs and driveways and redirected into the stormwater systems. Another consequence of this increase in impervious surfaces is a subsequent increase in pollutant levels in receiving water-bodies as well. Though there are measures to reduce the effect of this increased urban run-off, both in terms of the amount of water and pollutants, it remains a challenge to ensure no further adverse effects on the stormwater system occurs, especially on natural waterways.
The State of Stormwater in the Region
The NSROC region is characterised by steep inclines that lead directly down to natural waterbodies at many locations. The topography of areas such as North Sydney, Lane Cove, Willoughby and Hornsby Shire provides for spectacular scenery, but at the same time facilitates rapid flows during heavy rainfall. Accordingly there are sound reasons to be concerned that development in the region could stress the surrounding receiving waters. Not only will
the demands on the stormwater infrastructure increase proportionally to the scale of development, but the intensification will most likely be at the expense of pockets of existing vegetation cover and its potential aid in retarding the movement of soil at the most critical period of soil disturbance. (Noonan 2005)
The Department of Environment and Conservation (DEC) reported that catchment areas have been greatly modified, with creek systems being extensively channelised or hard-edged with concrete. Wetlands have been destroyed or degraded and, natural remnants of vegetation are often impacted by weeds and rubbish. They also found that some streams carry poor-quality stormwater which further impacts on the health of wetlands. The DEC’s concerns are reflected in a wide range of specific circumstances throughout the
NSROC region. For example:
• Hornsby Shire Council has expressed concerns about sewage contamination from defective sewage infrastructure in wet weather; overflow from poorly managed onsite sewage management systems; and inadequate private connections or illegal connections. Pollution from onsite sewage disposal or pump out of effluent is also evident within rural areas such as Glenorie Creek.
• The industrial areas within the Hornsby Shire region at Thornleigh and Mount Ku-ring-gai continue to create poor water quality by releasing run-off with high concentrations of suspended solids, nitrogen and faecal coliforms.
• Ku-ring-gai Council has highlighted the pressure that is being placed on its waterways by the inappropriate management of erosion and sediment from building sites in the area.
• Northbridge Baths within the Willoughby LGA is an enclosed tidal swimming area in Sailor’s Bay. Water quality in the baths is affected by urban run-off discharging to Sailor’s Bay. The baths are closed for 48 hours after a rainfall event of 20mm or greater over a three day period.
The Department of Environment and Conservation reported that catchment areas have been greatly modified, with creek systems being extensively channelised or hard-edged with concrete.
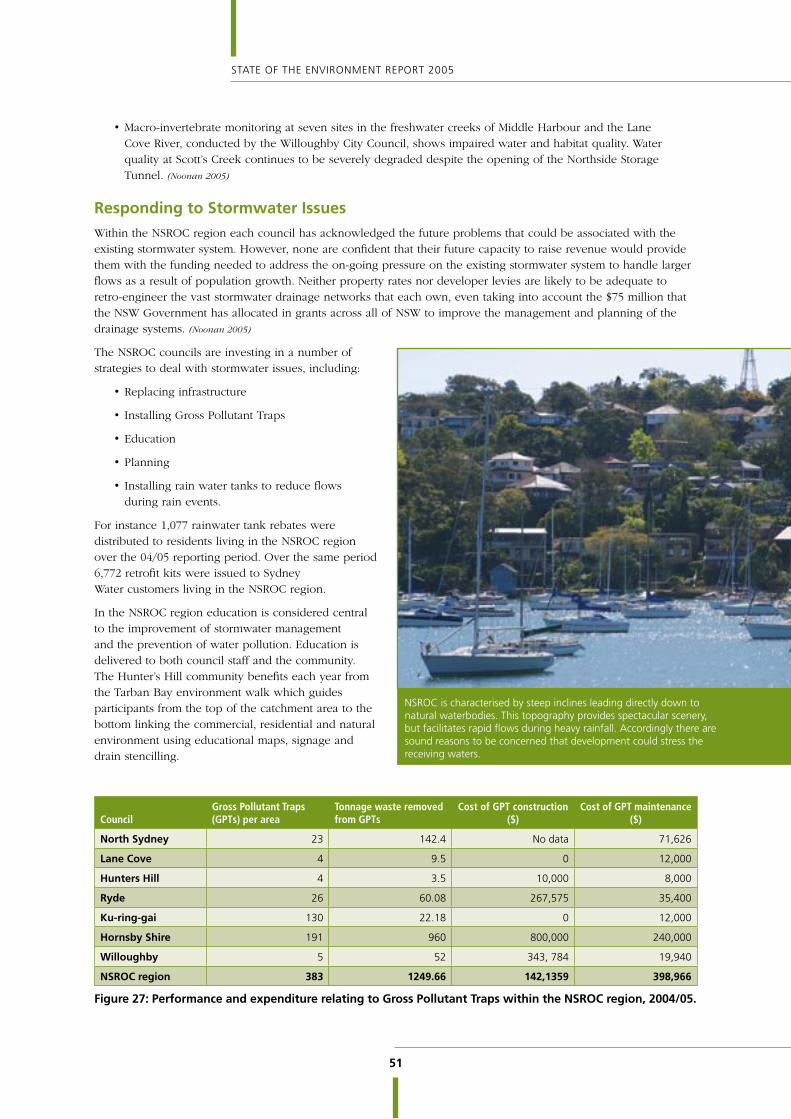
51
STATE OF THE ENVIRONMENT REPORT 2005
• Macro-invertebrate monitoring at seven sites in the freshwater creeks of Middle Harbour and the Lane Cove River, conducted by the Willoughby City Council, shows impaired water and habitat quality. Water quality at Scott’s Creek continues to be severely degraded despite the opening of the Northside Storage Tunnel. (Noonan 2005)
Responding to Stormwater Issues
Within the NSROC region each council has acknowledged the future problems that could be associated with the existing stormwater system. However, none are confident that their future capacity to raise revenue would provide them with the funding needed to address the on-going pressure on the existing stormwater system to handle larger flows as a result of population growth. Neither property rates nor developer levies are likely to be adequate to retro-engineer the vast stormwater drainage networks that each own, even taking into account the $75 million that the NSW Government has allocated in grants across all of NSW to improve the management and planning of the drainage systems. (Noonan 2005)
The NSROC councils are investing in a number of strategies to deal with stormwater issues, including:
• Replacing infrastructure
• Installing Gross Pollutant Traps
• Education
• Planning
• Installing rain water tanks to reduce flows during rain events.
For instance 1,077 rainwater tank rebates were distributed to residents living in the NSROC region over the 04/05 reporting period. Over the same period 6,772 retrofit kits were issued to Sydney Water customers living in the NSROC region.
In the NSROC region education is considered central to the improvement of stormwater management and the prevention of water pollution. Education is delivered to both council staff and the community. The Hunter’s Hill community benefits each year from the Tarban Bay environment walk which guides participants from the top of the catchment area to the bottom linking the commercial, residential and natural environment using educational maps, signage and drain stencilling.
Council Gross Pollutant Traps (GPTs) per area
Tonnage waste removed from GPTs
Cost of GPT construction ($)
Cost of GPT maintenance ($)
North Sydney 23 142.4 No data 71,626
Lane Cove 4 9.5 0 12,000
Hunters Hill 4 3.5 10,000 8,000
Ryde 26 60.08 267,575 35,400
Ku-ring-gai 130 22.18 0 12,000
Hornsby Shire 191 960 800,000 240,000
Willoughby 5 52 343, 784 19,940
NSROC region 383 1249.66 142,1359 398,966
Figure 27: Performance and expenditure relating to Gross Pollutant Traps within the NSROC region, 2004/05.
NSROC is characterised by steep inclines leading directly down to natural waterbodies. This topography provides spectacular scenery, but facilitates rapid flows during heavy rainfall. Accordingly there are sound reasons to be concerned that development could stress the receiving waters.
52
NORTHERN SYDNEY REGIONAL ORGANISATION OF COUNCILS
The Earth’s atmosphere consists
of nitrogen (78.1 per cent) and
oxygen (20.9 per cent), with
small amounts of argon (0.9 per cent),
carbon dioxide (variable, but around
0.035 per cent), water vapour, and other gases. The atmosphere protects life on Earth by absorbing
ultraviolet solar radiation and reducing temperature extremes between day and night. Seventy five per
cent of the atmosphere exists within 11 kilometres of the planetary surface.
The atmosphere regulates the Earth’s temperature through a phenomenon called the Greenhouse
Effect. However, with an increase in human activity, the Greenhouse Effect is being enhanced causing
accelerated Global Warming. Global Warming can cause severe weather patterns including droughts,
floods and severe storms and also climate zone shifts causing polar ice melts and rising sea levels.
Atmosphere
5PH
OTO
: MA
RGA
RET
MA
THER
S

53
STATE OF THE ENVIRONMENT REPORT 2005
AIR QUALITY The processes, phenomena and management approaches that affect regional air quality do not operate on just one scale. The air around us is a mobile and dynamic resource and therefore we usually do not think of air quality on a local or even a catchment scale but at a regional level. The quality of the atmosphere can be affected by natural events including bushfires and dust storms, and human induced activities including motor vehicle emissions, coal-fired electricity generation and fuel burning for home heating. Poor air quality is usually associated with heavily populated areas where motor vehicle use is high and a high prevalence of industry and solid fuel burning heaters in homes.
Community attitude surveys on environmental issues in urban areas of Australia repeatedly demonstrate the high value that is placed on access to clean air. Poor air quality has a direct impact on our health and wellbeing. High air pollution levels have been linked to health problems including asthma and angina. Associations are also being demonstrated between air pollution and chronic health problems, such as lung cancer, bronchitis cardiovascular disease and mortality. Keeping the air quality at an acceptable level can prevent health and environmental effects associated with poor air quality conditions. (Noonan 2005)
Carbon monoxide(CO)
Hydrocarbons(HC)
Oxides of nitrogen(NOx)
Particulates(< 10microns)
70-95% 40-50% 70-80% 10-50%
Figure 28: Contribution of motor vehicles to air emissions in major Australian cities, 2005 (Noonan 2005)
Pressure on Air Quality
As population density in NSROC increases, the incidence of vehicle usage will increase which has the potential to create more frequent high pollution days within the region. Natural processes can also increase high pollution days with higher air pollution levels across Sydney being more likely to occur on cooler, clearer nights. This is because temperature inversions restrain the air pollution from dispersing.
Councils, the National Parks and Wildlife Service (NPWS) and the Rural Fire Service conducts hazard reduction burns of local bushland to reduce the risks to people, property and the environment from wild fires, this activity also has the potential to impact on local air quality. Bushfires (i.e. wildfires) also impact on air quality in a similar way and usually to a greater extent.
Air Quality in the Region
Over the last two decades, air quality has improved significantly with reductions in carbon monoxide, nitrogen dioxide, sulphur dioxide and lead. However, photochemical oxidants and particle pollution still remain above air quality standards. Emissions are mainly from motor vehicles and while new cars produce less emissions, increased ownership of cars offsets any improvements. (Department of Environment and Conservation, 2003)
NSROC has a strong interest in ensuring that a significant population increase in its region does not lead to deterioration in the air quality overall. Its major difficulty is that its councils have very limited influence over problems of this type because, when they do occur, they are rarely limited to a single part of Sydney. Episodes where the air quality is poor are more likely to be experienced across a wide area of Sydney, so there are very few steps that even groups of councils can take collectively to address the cause.
There is only one regional air quality monitoring station in the NSROC region located at Lindfield in the grounds of the CSIRO Division of Radio Physics. It is situated in close proximity to Lane Cove National Park at an elevation of 60 metres in a residential area that represents part of the DEC East Sydney air quality reporting region. Data relating to the 20004/05 reporting period indicates that no high pollution days were recorded at the Lindfield monitoring station. However, due to nearby construction, the monitoring station was disengaged in early February 2005, and is not expected to be re-activated until later this year. Local monitoring is conducted by Willoughby City Council (see case study) and additional monitoring stations in the Lane Cove vicinity will commence operations once the Lane Cove Tunnel opens in December 2006.

54
NORTHERN SYDNEY REGIONAL ORGANISATION OF COUNCILS
Responding to Air Quality Issues
Councils have a limited ability to respond to air quality issues in an immediate manner. This is due to limited data on the extent and nature of the pollution events, difficulty in identifying the exact sources of air pollution, and the fact that licensing and regulation of polluting industries is a state rather than a local responsibility. Councils endeavour to assist the state government with regard to individual events. But aside from long term planning decisions regarding where industry should be located and regulation of their own controlled-burning activities, councils primary response in this area relates to the following issue of greenhouse gas emissions.
GREENHOUSE GAS EMISSIONSGlobally and nationally there is a widespread acceptance that climate change is being impacted by greenhouse gas emissions and that this process is set to continue for the near future. While at a national level Australia is one of the few countries in the world not to have signed the Kyoto Treaty on greenhouse gases, much work is being done at a state and local government level, and at a community level, to try and reduce green gas emissions through educational programs and the introduction of energy conservation measures. There is widespread acceptance in this country of the threats posed by climate change globally, and to Australia in particular.
Although there is differing opinions on the need to respond to greenhouse issues, many organisations in Australia are already participating in programs to reduce their emissions. The councils which form NSROC have placed a high priority on this issue within their overall concerns about the future environment of the region. (Noonan 2005)
Willoughby City Council
CA
SE S
TUD
Y
���������
�������
���������
���������
���������
���������
���������
����������
����������
����������
����������
����������
����������
����������
����������
����������
����������
����������
���������
����������
����������
����������
����������
����������
�
��
��
��
��
��
The air monitoring station in Memorial Gardens
Chatswood measures fine particulates less than 10
microns (PM10). Particle pollution often visible as a
brown haze can be the result of motor vehicles, industrial
processes, bushfires etc. Studies have shown that fine
particles can lead to cardiovascular and respiratory
diseases. The monitoring station at Chatswood was
decommissioned in February 2005 as a result of nearby
construction work associated with the Chatswood
to Epping Rail Link interfering with ambient results.
Measurements at Chatswood are well below the National
Environment Protection Measure (NEPM) for ambient air
quality.
Figure 29: Air quality in the Willoughby City Council area, 2004/5

55
STATE OF THE ENVIRONMENT REPORT 2005
Greenhouse Gas Issues
The weight of recent published evidence is that fossil fuels will continue to dominate as the source of our energy past 2020, and these will be largely coal-based. Energy-production efficiencies are expected from the extensive research underway in clean coal technologies occurring in the US and Australia, and this should produce greenhouse benefits. But the growth of energy consumption patterns in areas such as northern Sydney is nevertheless likely to be inextricably linked to additional carbon dioxide generation somewhere in the production or transmission chain that supplies energy to the region.
NSROC’s growing population and associated urban consolidation is likely to generate increased greenhouse gas emissions due to the following:
• Increased demand for air-conditioning due to a reduction in the tree canopy and for construction of higher buildings with greater direct sun exposure;
• Increased traffic congestion resulting in less efficient consumption of fossil fuels; and
• Increased ownership of energy consuming appliances.
The introduction of the energy conservation opportunities proposed in schemes like the State Government’s Building Sustainability Index (BASIX) should eventually show a positive impact. The timing of this support will be influenced by the proportional change in the residential dwellings that incorporate improved performance features. This will not be as fast in the NSROC region as it will be in new greenfield development areas.
Greenhouse Gas Emissions in the Region
Initial estimates of greenhouse gas emissions in 2004/05 generated from the region indicate 1.57 million tonnes from the residential sector and 2.4 million tonnes from non-residential sources. Approximately 30 per cent of the greenhouse gas emissions generated by the domestic sector come from heating and cooling inside the home.
While all of the councils are committed to reducing greenhouse gas emissions, councils are only just beginning to audit their own facilities against industry standards to determine the amount of greenhouse gases they create. All councils have joined the Cities for Climate Protection (CCP) Program and some have commenced purchasing ‘green energy’ which is produced from greenhouse friendly sources. While councils also run a number of education programs in this area, the total impact of council in reducing greenhouse gas emissions in the broader populace is unknown and difficult to disaggregate from state and federal initiatives.
Responding to Greenhouse Emissions
The northern Sydney councils have responded in a wide variety of ways to the issue of climate change and greenhouse gas emissions. Whilst they continue to play an educative role with their communities, the NSROC councils have concentrated on leading by example through implementing programs and actions within their own facilities to reduce energy consumption and greenhouse gas creation. The NSROC councils have been assisted in this process by membership of the CCP Program and by the recent introduction of guidelines for the development of Energy Savings Plans. It should be noted that further work needs to be done within the community once the more obvious energy savings have been obtained, but these future savings will come at an increasing implementation cost.
Councils have shown considerable innovation in this area as demonstrated by Willoughby City Council which has entered into an Energy Performance Contract (EPC) as a way to reduce both energy and water consumption. Energy Performance Contracting is about reducing energy consumption by investing in proven and cost effective energy-saving technologies, systems and procedures.
Responses to the issue of climate change and greenhouse gas emissions include undertaking energy performance contracts, using hybrid petrol/electric vehicles for council’s fleet and tree planting.
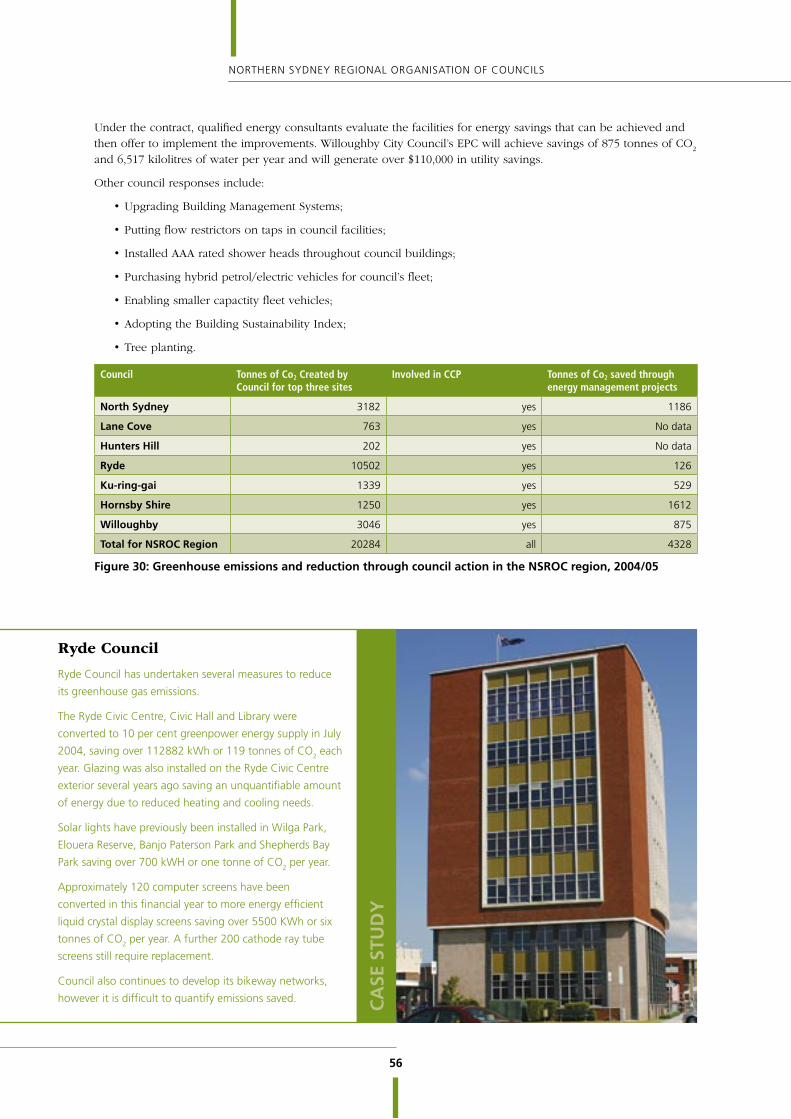
56
NORTHERN SYDNEY REGIONAL ORGANISATION OF COUNCILS
Under the contract, qualified energy consultants evaluate the facilities for energy savings that can be achieved and then offer to implement the improvements. Willoughby City Council’s EPC will achieve savings of 875 tonnes of CO
2
and 6,517 kilolitres of water per year and will generate over $110,000 in utility savings.
Other council responses include:
• Upgrading Building Management Systems;
• Putting flow restrictors on taps in council facilities;
• Installed AAA rated shower heads throughout council buildings;
• Purchasing hybrid petrol/electric vehicles for council’s fleet;
• Enabling smaller capactity fleet vehicles;
• Adopting the Building Sustainability Index;
• Tree planting.
Council Tonnes of Co2 Created by Council for top three sites
Involved in CCP Tonnes of Co2 saved through energy management projects
North Sydney 3182 yes 1186
Lane Cove 763 yes No data
Hunters Hill 202 yes No data
Ryde 10502 yes 126
Ku-ring-gai 1339 yes 529
Hornsby Shire 1250 yes 1612
Willoughby 3046 yes 875
Total for NSROC Region 20284 all 4328
Figure 30: Greenhouse emissions and reduction through council action in the NSROC region, 2004/05
Ryde Council
Ryde Council has undertaken several measures to reduce
its greenhouse gas emissions.
The Ryde Civic Centre, Civic Hall and Library were
converted to 10 per cent greenpower energy supply in July
2004, saving over 112882 kWh or 119 tonnes of CO2 each
year. Glazing was also installed on the Ryde Civic Centre
exterior several years ago saving an unquantifiable amount
of energy due to reduced heating and cooling needs.
Solar lights have previously been installed in Wilga Park,
Elouera Reserve, Banjo Paterson Park and Shepherds Bay
Park saving over 700 kWH or one tonne of CO2 per year.
Approximately 120 computer screens have been
converted in this financial year to more energy efficient
liquid crystal display screens saving over 5500 KWh or six
tonnes of CO2 per year. A further 200 cathode ray tube
screens still require replacement.
Council also continues to develop its bikeway networks,
however it is difficult to quantify emissions saved. CA
SE S
TUD
Y
57
STATE OF THE ENVIRONMENT REPORT 2005
The clearing of native vegetation,
agricultural and urban
development and irrigation have
all contributed towards land degradation
in Australia. The change in land uses
brought about by European settlement has resulted in acidification of soils, rises in the watertable,
increased soil salinity levels and erosion (Department of Environment and Conservation, 2000)
The landscape in the northern Sydney region varies from highly urbanised environments to relatively
undisturbed tracts of native bushland. It includes coastal estuaries, escarpments, steep ridgelines and
farmed rural lands. The landscape has been undeniably altered through the process of human settlement
and this change has accelerated from the period of European settlement until the present day through
land clearing, urban development and consolidation.
Due to the steep inclines, gullies and undulating terrain of the NSROC region, and the presence of
numerous natural water bodies contiguous to this terrain, the region is particularly vulnerable to
accelerated erosion, nutrient run-off, flooding, sedimentation and the associated decrease in water
quality.
Soil Landscape
6PH
OTO
: RIC
HA
RD W
ATE
RFIE
LD

58
NORTHERN SYDNEY REGIONAL ORGANISATION OF COUNCILS
ACID SULFATE SOILS Acidic soils have developed naturally on sandstone parent materials in a number of locations in the Sydney Basin. In coastal areas land disturbance can uncover naturally occurring sediments and soils containing iron sulfides which when exposed to oxygen can develop into sulfuric acid. This has the potential to alter the physical structure of the soil and damage vegetation growing in the soil. If the acid finds its way into water bodies it can have significant impacts on riverine and estuarine ecologies (causing fish kills for example), as well as corroding man-made structures such as bridges and boats.
Disturbing Acid Sulphate Soils
The disturbance of potential acid sulfate soils associated with development activities such as excavation, drainage systems, piling, dredging and road causeway is a significant and dynamic pressure on the ongoing development of actual acid sulfate soils. Many residents in the northern Sydney region seek greater access and utility of low-lying coastal areas in which acid sulfate soils might exist. Development in these areas must be carefully managed and known repositories of sediments rich in iron sulfides must be carefully mapped.
Acid Sulphate Soils in the Region
��
��
�
��
��
� ����������������
�
��
��
��
��
��
��
��
��
��
���
������������ ��������� ������������ ���� ����������� ������������� ����������
�������
���������������
Figure 31: Known potential area of acid sulfate soil sites in the NSROC region, 2005
Managing Acid Sulphate Soils
Extensive mapping of acid sulfate soils has already been completed by the state government. More detailed local mapping is still being completed by some of the councils in conjunction with the Department of Lands. The councils belonging to NSROC have prepared, or are in the process of preparing, the appropriate planning instruments to ensure disruption of acid sulphate soils is minimised. Some councils have adopted acid sulphate soils management plans in the event that acid run-off occurs as a result of soil disturbance.
SOIL EROSIONSoil erosion is a natural process that is caused by the action of wind and water which is accelerated by human activities and is a major problem throughout Australia. The slow rate of soil formation in Australia means that soil is effectively a non-renewable resource. Erosion has the effect of reducing the soil’s nutrient levels and its ability to retain moisture for plant growth. Increased rates of erosion can also have an adverse impact on water quality in streams and rivers. (Department of Environment and Conservation, 2000)
NSROC region total = 179

59
STATE OF THE ENVIRONMENT REPORT 2005
Causes of Erosion
The common causes of soil erosion in NSROC are the loss of vegetation cover, modification of the soil landscape (by earthworks or compacting), and increases in surface run-off from impervious surfaces such as roofs, roads and footpaths.
Erosion is a particular concern around the many development sites in the NSROC region, where vegetation removal and earthworks expose and disturb soil layers. Erosional processes, such as wind and water run-off, transport soil particles through street gutters to local creeks where they can block drains, cause creek siltation, land instability and facilitate weed invasions and deadly algal blooms.
Another impact of urban development is the replacement of natural, water-absorbing surfaces with impermeable concrete. This enhances flow velocities and the erosional force of water flowing off the site and onto adjoining areas increasing the rate of soil loss. Finally, increasingly poor weather conditions, including storms, high winds and drought, culminate in dieback of vegetation required to stabilise soils.
Erosion in the Region
According to Soil Landscapes of the Sydney 1:100,000 Sheet (1989) most of the soils in the northern Sydney region are derived from Hawkesbury sandstone. These soils are often on very steep topography, and have a high soil erosion hazard. Areas on the steeper land around the foreshores have an extreme soil erosion hazard. In areas where the soil is highly erodible, disturbance should be kept at a minimum. These areas should be protected by ground covers as soon as possible.
The amount of soil lost to erosion is extremely difficult to quantify and most reporting on erosion is observational and anecdotal unless it damages infrastructure or results in specific flood events. NSROC councils are seeking to develop indicators in this area, notwithstanding the inherent difficulty in quantifying erosion over such a large and diverse terrain.
Managing Erosion
Councils work actively to minimise erosion impacts through a mixture of land use planning, development controls, water management practices, education and regulatory enforcement. Due to the region’s variable terrain and abundance of natural water courses and water bodies, particular care is taken in zoning land for development to ensure that erosion and erosion-related impacts do not significantly impact on the environment. Where major development does occur, the use of sediment and erosion controls are required with controls specified on development consents and enforced by council’s Regulatory Officers or Rangers.
The NSROC councils have introduced a number of development controls to reduce the impact on the local waterways including requiring and enforcing the use of sediment controls on building sites, setting maximum site coverage limits, and promoting the installation of rainwater tanks or the provision of storage to delay the release of stormwater (onsite storage devices). Councils have also been active in rehabilitating areas where stormwater drains enter creeks and providing rock
Hornsby Shire Council
Soil erosion pressures are being addressed through the
Urban Fringe Stormwater Management Program aimed at
improving the environmental and stormwater management
of private holdings on the urban rural fringe. Hornsby Shire
Council is coordinating this program in partnership with
the Department of Environment and Conservation (DEC),
rural landholders and other local councils. The program
focuses not only on commercial activities such as nurseries,
poultry, and horticultural pursuits, but also includes larger
residential holdings.
Dedicated council officers continue to enforce development
consent conditions pertaining to sediment and erosion
control, ensuring best practice is adhered to on
construction and development sites throughout the Shire.
Between 1 July 2004 and 1 June 2005, 1,441 sites were
inspected for sediment and erosion controls resulting in
248 breaches being identified.CA
SE S
TUD
Y
The common causes of soil erosion in NSROC are the loss of vegetation cover, modification of the soil landscape and increases in surface run-off from impervious surfaces.
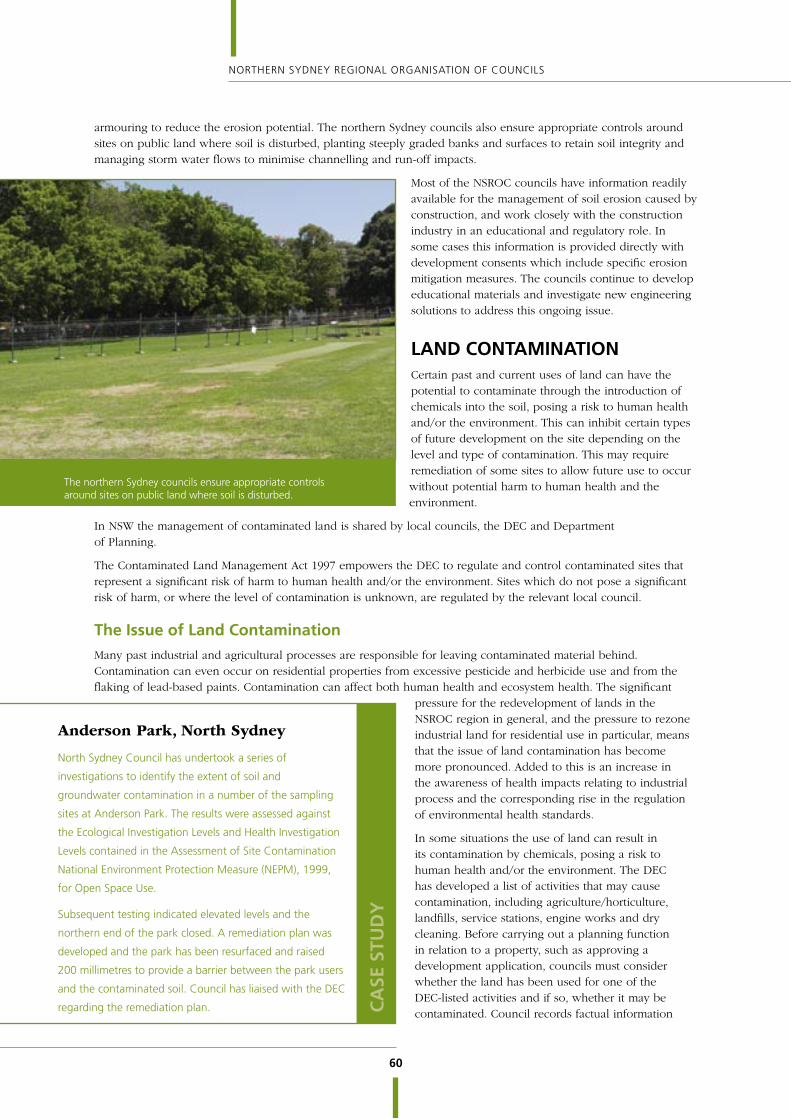
60
NORTHERN SYDNEY REGIONAL ORGANISATION OF COUNCILS
armouring to reduce the erosion potential. The northern Sydney councils also ensure appropriate controls around sites on public land where soil is disturbed, planting steeply graded banks and surfaces to retain soil integrity and managing storm water flows to minimise channelling and run-off impacts.
Most of the NSROC councils have information readily available for the management of soil erosion caused by construction, and work closely with the construction industry in an educational and regulatory role. In some cases this information is provided directly with development consents which include specific erosion mitigation measures. The councils continue to develop educational materials and investigate new engineering solutions to address this ongoing issue.
LAND CONTAMINATIONCertain past and current uses of land can have the potential to contaminate through the introduction of chemicals into the soil, posing a risk to human health and/or the environment. This can inhibit certain types of future development on the site depending on the level and type of contamination. This may require remediation of some sites to allow future use to occur without potential harm to human health and the environment.
In NSW the management of contaminated land is shared by local councils, the DEC and Department of Planning.
The Contaminated Land Management Act 1997 empowers the DEC to regulate and control contaminated sites that represent a significant risk of harm to human health and/or the environment. Sites which do not pose a significant risk of harm, or where the level of contamination is unknown, are regulated by the relevant local council.
The Issue of Land Contamination
Many past industrial and agricultural processes are responsible for leaving contaminated material behind. Contamination can even occur on residential properties from excessive pesticide and herbicide use and from the flaking of lead-based paints. Contamination can affect both human health and ecosystem health. The significant
pressure for the redevelopment of lands in the NSROC region in general, and the pressure to rezone industrial land for residential use in particular, means that the issue of land contamination has become more pronounced. Added to this is an increase in the awareness of health impacts relating to industrial process and the corresponding rise in the regulation of environmental health standards.
In some situations the use of land can result in its contamination by chemicals, posing a risk to human health and/or the environment. The DEC has developed a list of activities that may cause contamination, including agriculture/horticulture, landfills, service stations, engine works and dry cleaning. Before carrying out a planning function in relation to a property, such as approving a development application, councils must consider whether the land has been used for one of the DEC-listed activities and if so, whether it may be contaminated. Council records factual information
Anderson Park, North Sydney
North Sydney Council has undertook a series of
investigations to identify the extent of soil and
groundwater contamination in a number of the sampling
sites at Anderson Park. The results were assessed against
the Ecological Investigation Levels and Health Investigation
Levels contained in the Assessment of Site Contamination
National Environment Protection Measure (NEPM), 1999,
for Open Space Use.
Subsequent testing indicated elevated levels and the
northern end of the park closed. A remediation plan was
developed and the park has been resurfaced and raised
200 millimetres to provide a barrier between the park users
and the contaminated soil. Council has liaised with the DEC
regarding the remediation plan. CA
SE S
TUD
Y
The northern Sydney councils ensure appropriate controls around sites on public land where soil is disturbed.

61
STATE OF THE ENVIRONMENT REPORT 2005
about possible contamination or actual contamination on property Planning Certificates.
Contaminated Sites in the Region
The number of contaminated land sites in the NSROC region during the 2004/05 reporting period is as follows:
Council No of Sites
North Sydney 2
Lane Cove 1
Hunters Hill 2
Ryde 0
Ku-ring-gai 3
Hornsby Shire 0
Willoughby 2
NSROC region 10
Figure 32: Number of declared contaminated land sites in the NSROC region, 2005
Responding to Land Contamination
All Councils continue to monitor development activity in relation to contaminated sites on an on-going basis. Councils work closely with the DEC to ensure that the Contaminated Land Record is accurate and up-to-date. In addition, councils take the following steps to ensure land contamination is managed appropriately in the region by:
• Including information about land contamination on Section 149 Planning Certificates;
• Considering land contamination when assessing rezoning and development applications, and imposing conditions requiring remediation of land where appropriate;
• Developing a Contaminated Land Management Policy.
Many past industrial and agricultural processes are responsible for leaving contaminated material behind. Contamination can even occur on residential properties from excessive pesticide and herbicide use and from the flaking of lead-based paints.
62
NORTHERN SYDNEY REGIONAL ORGANISATION OF COUNCILS
Appendices
7Key:
The Atlas of NSW Wildlife is the NSW Department of Environment and Conservation’s database of fauna and flora records. The following lists include entries in the Atlas marked as:
V – Vulnerable (Threatened Species Conservation Act, 1995)
E1 – Endangered (Threatened Species Conservation Act, 1995)
E2 – Endangered (Threatened Species Conservation Act, 1995)
The Atlas states that the data it contains, while extensive, is by definition patchy. It will not provide full distribution of a species. Except in areas where comprehensive survey information has been incorporated into the database, the search results for a particular area are based on a mix of reported sightings
LIST OF THREATENED SPECIES IN THE NSROC REGION FROM THE ATLAS OF NSW WILDLIFE

63
STATE OF THE ENVIRONMENT REPORT 2005
LGA – Hornsby Shire Fauna Threatened SpeciesScientific Name Common Name Legal Status
Pandion haliaetus Osprey V
Ixobrychus flavicollis Black Bittern V
Callocephalon fimbriatum Gang Gang Cockatoo Population, Hornsby Shire & Ku-ring-gai LGAs
E2
Calyptorhynchus lathami Glossy Black-Cockatoo V
Climacteris picumnus Brown Treecreeper V
Ptilinopus superbus Superb Fruit-Dove V
Stagonopleura guttata Diamond Firetail V
Falco hypoleucos Grey Falcon V
Xanthomyza phrygia Regent Honeyeater E1
Pomatostomus temporalis temporalis Grey-crowned Babbler (eastern subsp.) V
Macronectes giganteus Southern Giant-Petrel E1
Neophema pulchella Turquoise Parrot V
Ninox connivens Barking Owl V
Ninox strenua Powerful Owl V
Tyto novaehollandiae Masked Owl V
Tyto tenebricosa Sooty Owl V
Litoria aurea Green and Golden Bell Frog E1
Heleioporus australiacus Giant Burrowing Frog V
Pseudophryne australis Red-crowned Toadlet V
Eubalaena australis Southern Right Whale V
Cercartetus nanus Eastern Pygmy-possum V
Dasyurus maculatus Spotted-tailed Quoll V
Mormopterus norfolkensis Eastern Freetail-bat V
Isoodon obesulus obesulus Southern Brown Bandicoot (eastern) E1
Phascolarctos cinereus Koala V
Phascolarctos cinereus Koala in the Pittwater LGA E2
Pteropus poliocephalus Grey-headed Flying-fox V
Miniopterus schreibersii oceanensis Eastern Bent-wing Bat V
Myotis adversus Large-footed Myotis V
Dermochelys coriacea Leathery Turtle V
Varanus rosenbergi Rosenberg’s Goanna V

64
NORTHERN SYDNEY REGIONAL ORGANISATION OF COUNCILS
LGA – Hornsby Shire Flora Threatened SpeciesScientific Name Common Name Legal Status
Olearia cordata V
Epacris purpurascens var. purpurascens V
Acacia bynoeana Bynoe’s Wattle E1
Acacia gordonii E1
Grammitis stenophylla E1
Haloragis exalata V
Haloragis exalata subsp. exalata V
Pilularia novae-hollandiae Austral Pillwort E1
Callistemon linearifolius V
Darwinia biflora V
Darwinia fascicularis subsp. oligantha Darwinia fascicularis subsp. oligantha population in the Baulkham Hills and Hornsby Shire Local Government Areas
E2
Darwinia peduncularis V
Eucalyptus camfieldii Heart-leaved Stringybark V
Eucalyptus scoparia E1
Kunzea rupestris V
Leptospermum deanei V
Melaleuca deanei V
Micromyrtus blakelyi V
Syzygium paniculatum V
Caladenia tessellata Thick Lip Spider Orchid E1
Genoplesium baueri V
Ancistrachne maidenii V
Grevillea parviflora V
Grevillea parviflora subsp. supplicans E1
Persoonia hirsuta E1
Persoonia mollis subsp. maxima E1
Galium australe Tangled Bedstraw E1
Asterolasia elegans E1
Zieria involucrata E1
Lasiopetalum joyceae V
Pimelea curviflora var. curviflora V
Tetratheca glandulosa V
LGA – Hunters Hill Fauna Threatened SpeciesScientific Name Common Name Legal Status
Ninox connivens Barking Owl V
Ninox strenua Powerful Owl V
Pseudophryne australis Red-crowned Toadlet V
LGA – Hunters Hill Flora Threatened SpeciesScientific Name Common Name Legal Status
Darwinia biflora V
Genoplesium baueri V

65
STATE OF THE ENVIRONMENT REPORT 2005
LGA – Ku-ring-gai Fauna Threatened SpeciesScientific Name Common Name Legal Status
Nettapus coromandelianus Cotton Pygmy-Goose E1
Botaurus poiciloptilus Australasian Bittern V
Callocephalon fimbriatum Gang Gang Cockatoo Population, Hornsby Shire & Ku-ring-gai LGAs
E2
Calyptorhynchus lathami Glossy Black-Cockatoo V
Ptilinopus superbus Superb Fruit-Dove V
Haematopus fuliginosus Sooty Oystercatcher V
Haematopus longirostris Pied Oystercatcher V
Xanthomyza phrygia Regent Honeyeater E1
Lathamus discolor Swift Parrot E1
Polytelis swainsonii Superb Parrot V
Limicola falcinellus Broad-billed Sandpiper V
Ninox connivens Barking Owl V
Ninox strenua Powerful Owl V
Litoria aurea Green and Golden Bell Frog E1
Heleioporus australiacus Giant Burrowing Frog V
Pseudophryne australis Red-crowned Toadlet V
Cercartetus nanus Eastern Pygmy-possum V
Dasyurus maculatus Spotted-tailed Quoll V
Saccolaimus flaviventris Yellow-bellied Sheathtail-bat V
Mormopterus norfolkensis Eastern Freetail-bat V
Isoodon obesulus obesulus Southern Brown Bandicoot (eastern) E1
Phascolarctos cinereus Koala V
Pteropus poliocephalus Grey-headed Flying-fox V
Chalinolobus dwyeri Large-eared Pied Bat V
Miniopterus schreibersii oceanensis Eastern Bent-wing Bat V
Dermochelys coriacea Leathery Turtle V
Varanus rosenbergi Rosenberg’s Goanna V
LGA – Ku-ring-gai Flora Threatened SpeciesScientific Name Common Name Legal Status
Epacris purpurascens var. purpurascens V
Acacia bynoeana Bynoe’s Wattle E1
Grammitis stenophylla E1
Haloragodendron lucasii E1
Darwinia biflora V
Eucalyptus camfieldii Heart-leaved Stringybark V
Melaleuca deanei V
Syzygium paniculatum V
Deyeuxia appressa E1
Persoonia mollis subsp. maxima E1
Tetratheca glandulosa V
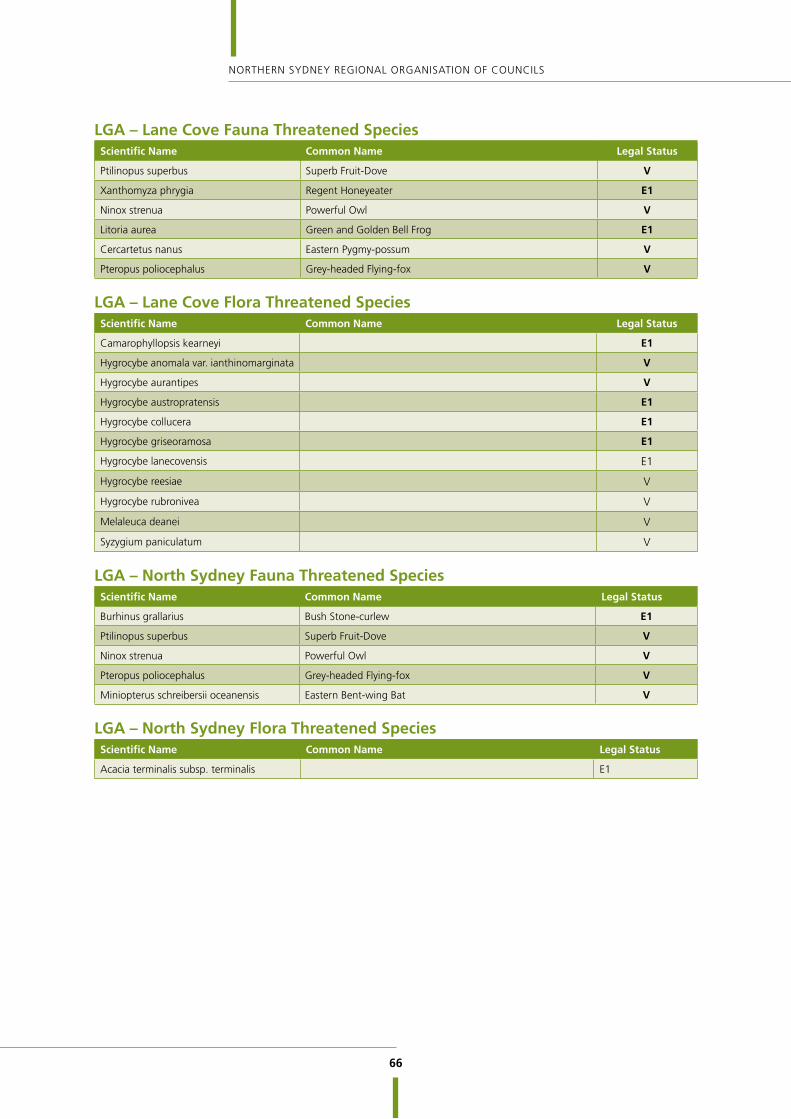
66
NORTHERN SYDNEY REGIONAL ORGANISATION OF COUNCILS
LGA – Lane Cove Fauna Threatened SpeciesScientific Name Common Name Legal Status
Ptilinopus superbus Superb Fruit-Dove V
Xanthomyza phrygia Regent Honeyeater E1
Ninox strenua Powerful Owl V
Litoria aurea Green and Golden Bell Frog E1
Cercartetus nanus Eastern Pygmy-possum V
Pteropus poliocephalus Grey-headed Flying-fox V
LGA – Lane Cove Flora Threatened SpeciesScientific Name Common Name Legal Status
Camarophyllopsis kearneyi E1
Hygrocybe anomala var. ianthinomarginata V
Hygrocybe aurantipes V
Hygrocybe austropratensis E1
Hygrocybe collucera E1
Hygrocybe griseoramosa E1
Hygrocybe lanecovensis E1
Hygrocybe reesiae V
Hygrocybe rubronivea V
Melaleuca deanei V
Syzygium paniculatum V
LGA – North Sydney Fauna Threatened SpeciesScientific Name Common Name Legal Status
Burhinus grallarius Bush Stone-curlew E1
Ptilinopus superbus Superb Fruit-Dove V
Ninox strenua Powerful Owl V
Pteropus poliocephalus Grey-headed Flying-fox V
Miniopterus schreibersii oceanensis Eastern Bent-wing Bat V
LGA – North Sydney Flora Threatened SpeciesScientific Name Common Name Legal Status
Acacia terminalis subsp. terminalis E1

67
STATE OF THE ENVIRONMENT REPORT 2005
LGA – Ryde Fauna Threatened SpeciesScientific Name Common Name Legal Status
Pandion haliaetus Osprey V
Ixobrychus flavicollis Black Bittern V
Callocephalon fimbriatum Gang Gang Cockatoo Population, Hornsby Shire & Ku-ring-gai LGAs
E2
Limosa limosa Black-tailed Godwit V
Ninox strenua Powerful Owl V
Litoria aurea Green and Golden Bell Frog E1
Pseudophryne australis Red-crowned Toadlet V
Petaurus australis Yellow-bellied Glider V
Pteropus poliocephalus Grey-headed Flying-fox V
Miniopterus schreibersii oceanensis Eastern Bent-wing Bat V
LGA – Ryde Flora Threatened SpeciesScientific Name Common Name Legal Status
Epacris purpurascens var. purpurascens V
Callistemon linearifolius V
Darwinia biflora V
Leptospermum deanei V
Melaleuca deanei V
Tetratheca glandulosa V
LGA – Willoughby Fauna Threatened SpeciesScientific Name Common Name Legal Status
Ptilinopus superbus Superb Fruit-Dove V
Xanthomyza phrygia Regent Honeyeater E1
Ninox strenua Powerful Owl V
Pseudophryne australis Red-crowned Toadlet V
Cercartetus nanus Eastern Pygmy-possum V
Dasyurus maculatus Spotted-tailed Quoll V
Pteropus poliocephalus Grey-headed Flying-fox V
LGA – Willoughby Flora Threatened SpeciesScientific Name Common Name Legal Status
Acacia bynoeana Bynoe’s Wattle E1
Eucalyptus camfieldii Heart-leaved Stringybark V
Caladenia tessellata Thick Lip Spider Orchid E1
Tetratheca glandulosa V

Hunters Hill, Hornsby Shire, Ku-ring-gai, Lane Cove, North Sydney, City of Ryde and Willoughby City Councils
48 Longueville RoadLane Cove NSW 2066
PO Box 20Lane Cove NSW 1595
Tel/Fax: 9911 3595DX 23307, Lane Cove