NSP Network Services Platform Release 19.9 Service ...
38
NSP Network Services Platform Release 19.9 Service Supervision Application Help 3HE-15169-AAAC-TQZZA Issue 1 September 2019
Transcript of NSP Network Services Platform Release 19.9 Service ...
NSPNetwork Services PlatformRelease 19.9
Service Supervision ApplicationHelp
3HE-15169-AAAC-TQZZA
Issue 1
September 2019

Legal notice
Nokia is a registered trademark of Nokia Corporation. Other products and company names mentioned herein may be trademarks or
tradenames of their respective owners.
The information presented is subject to change without notice. No responsibility is assumed for inaccuracies contained herein.
© 2019 Nokia.
NSP
3HE-15169-AAAC-TQZZA
Release 19.9September 2019
2 Issue 1
Contents1 Service Supervision.......................................................................................................................................5
1.1 Why use Service Supervision? ...........................................................................................................5
1.2 What if I don’t see anything in Service Supervision? ..........................................................................5
1.3 Summary view.....................................................................................................................................6
1.4 How do I see the services list for a supervision group? ......................................................................6
1.5 Services list .........................................................................................................................................7
1.6 How do I manage the Services list contents? .....................................................................................7
1.7 How do I investigate a service? ..........................................................................................................8
1.8 How do I monitor a service?................................................................................................................8
1.9 How do I view the sites for a specific service?....................................................................................8
1.10 How do I make changes to a service? ................................................................................................9
1.11 SDP Bindings list.................................................................................................................................9
1.12 How do I manage the SDP Bindings list contents?.............................................................................9
1.13 How do I investigate an SDP binding?................................................................................................9
1.14 SAP list..............................................................................................................................................10
1.15 How do I manage the SAP list contents?..........................................................................................10
1.16 How do I investigate a SAP?.............................................................................................................10
1.17 How do I copy a service object? .......................................................................................................10
1.18 Sites list .............................................................................................................................................11
1.19 How do I manage the Site list contents? ...........................................................................................11
1.20 How do I investigate a service site? ..................................................................................................11
1.21 Event Timeline...................................................................................................................................11
1.22 IGP map ............................................................................................................................................12
1.23 How do I show SDP binding traffic flows on the IGP map?...............................................................13
1.24 Alarm list ...........................................................................................................................................13
1.25 How do I change supervision group KPI color thresholds?...............................................................14
1.26 How do I change trend arrow time setting?.......................................................................................14
1.27 How do I change the maximum number of tiles in the Summary view?............................................14
1.28 How do I change Event Timeline settings? .......................................................................................14
1.29 How do I change map label settings? ...............................................................................................15
2 Service Supervision use cases...................................................................................................................17
2.1 Routine service maintenance with Service Supervision....................................................................17
2.2 Fault Identification in Service Supervision ........................................................................................25
2.3 OAM testing in Service Supervision..................................................................................................32
Contents NSP
Release 19.9September 2019Issue 1 33HE-15169-AAAC-TQZZA

Contents NSP
3HE-15169-AAAC-TQZZA
Release 19.9September 2019
4 Issue 1
1 Service Supervision
1.1 Why use Service Supervision?
The Service Supervision application allows you to monitor the health of services using KPIs, and
monitor the fault status of a network. Service Supervision uses supervision groups, which can
belong to one or more views.
A supervision group is a logical set of monitored services that is specified by user-defined filters.
Supervision groups can be used to partition services into distinct categories, and are associated
with views. There is no limit to the number of supervision groups to which a service can belong.
Up to 50 000 services can be included in a supervision group. VLL, VPLS, MVPLS, IES, and VPRN
services can be included.
The criteria for monitored objects in a supervision group are based on inclusion filters. The inclusion
filter is the rule on whether to include an object in a supervision group. For example, for the
Wireless Supervision application, the inclusion filters used to specify the eNodeBs in a supervision
group must exclude pre-provisioned NEs and all other non-eNodeB NE types to avoid misleading
alarms and KPI numbers.
A view is a collection of one or more supervision groups that provides a high-level view of a group
of services.
When NSP is deployed with the NSD module and the Service Fulfillment application, the Service
Supervision application monitors services provisioned by the Service Fulfillment application and/or
other management applications, such as the NFM-P service manager. The Supervision Manager is
used to configure and manage supervision views and groups for the Service Supervision
application.
1.2 What if I don’t see anything in Service Supervision?
If you’ve opened Service Supervision and see only a blank GUI, you need to select a summary
view. The information that appears in Service Supervision is organized under summary views.
• Click More , Summary View and choose a summary view.
If there aren’t any summary views available, your system administrator must create a summary
view in the Supervision Manager application.
Configure a summary view in Supervision Manager
You can launch the Supervision Manager directly from Service Supervision. You must have
administrative access rights to access the Supervision Manager.
• Click More , Supervision Manager.
The Supervision Manager opens on a separate browser tab.
• Configure a summary view. For information on configuring views and groups, click Help
in the Supervision Manager GUI.
Service SupervisionWhy use Service Supervision?
NSP
Release 19.9September 2019Issue 1 53HE-15169-AAAC-TQZZA
When you are finished, the new summary view appears in Service Supervision under the More
, Summary View menu.
1.3 Summary view
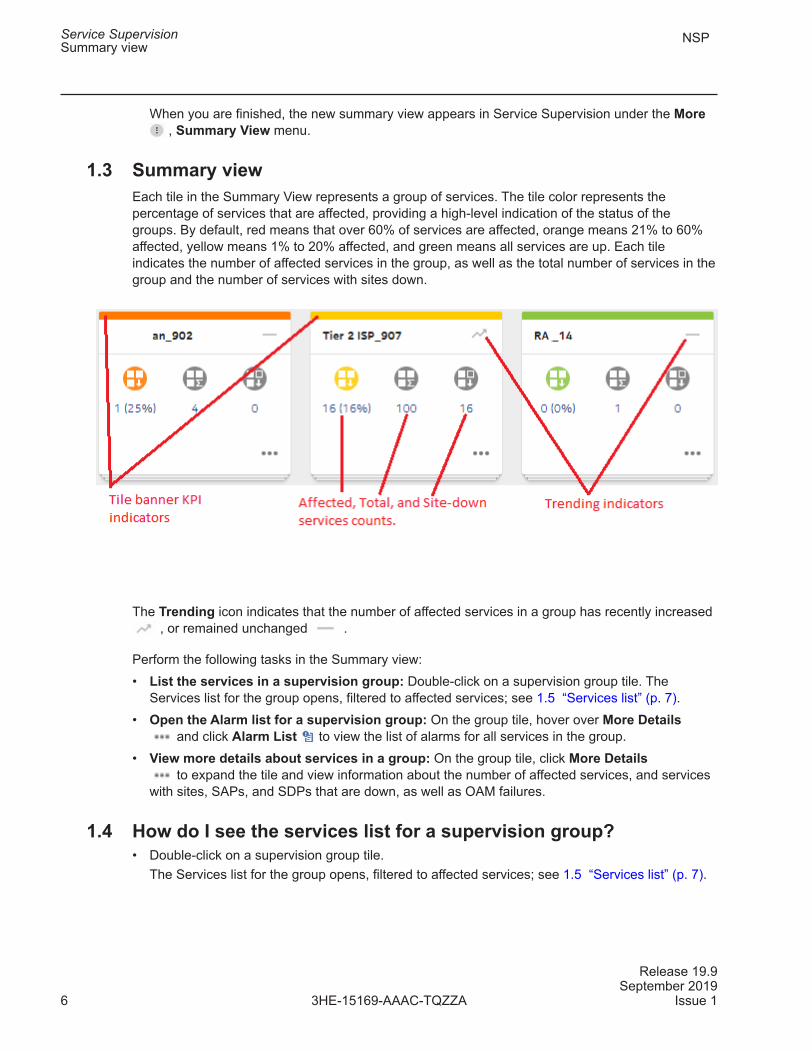
Each tile in the Summary View represents a group of services. The tile color represents the
percentage of services that are affected, providing a high-level indication of the status of the
groups. By default, red means that over 60% of services are affected, orange means 21% to 60%
affected, yellow means 1% to 20% affected, and green means all services are up. Each tile
indicates the number of affected services in the group, as well as the total number of services in the
group and the number of services with sites down.
The Trending icon indicates that the number of affected services in a group has recently increased
, or remained unchanged .
Perform the following tasks in the Summary view:
• List the services in a supervision group: Double-click on a supervision group tile. The
Services list for the group opens, filtered to affected services; see 1.5 “Services list” (p. 7).
• Open the Alarm list for a supervision group: On the group tile, hover over More Details
and click Alarm List to view the list of alarms for all services in the group.
• View more details about services in a group: On the group tile, click More Details
to expand the tile and view information about the number of affected services, and services
with sites, SAPs, and SDPs that are down, as well as OAM failures.
1.4 How do I see the services list for a supervision group?
• Double-click on a supervision group tile.
The Services list for the group opens, filtered to affected services; see 1.5 “Services list” (p. 7).
Service SupervisionSummary view
NSP
3HE-15169-AAAC-TQZZA
Release 19.9September 2019
6 Issue 1
1.5 Services list
The Service list can display all services in a supervision group, only services in the supervision
group that recently had configuration changes, or only services in the supervision group that are
affected by recent network events. You change the contents of the Services list by applying a filter.
You can reduce the list contents further by filtering under a specific column with a text string or filter
option.
Service status is indicated by the following icons:
• Service operational state is Up
• Service operational state is Down
• Service operational state is Partially Down
• Service operational state is Unknown
Service KPI information is indicated by the following icons, for a variety of service objects:
• Service object admin state is Up
• Service object admin state is Down
• Service object is misconfigured
• No such object on service
1.6 How do I manage the Services list contents?
The Services list has a variety of tools available to help you control what you see, including sorting
and filtering options:
• Control what I see in the Services list: The list is filtered to affected services by default. If
there are no affected services in the group, the list is empty. Change the filter to All Services.
Click on the Filter menu and select All Services, Affected Services, or Recently
Changed Services.
• Filter the Services list under a specific column: Type a text string in the text field or select a
filter option at the top of a column and press Enter. Click Clear Filter to clear column filters.
• Sort the Services list under a specific column: Click on a column header to sort the list under
that column. Click the column header a second time to toggle the sort order (ascending/
descending), as indicated by an Up or Down arrow.
• Refresh the list: On the application toolbar, click Refresh List to update the services list
contents.
• Export the Services list: On the application toolbar, click More , Export to export the
current page or selected rows to a CSV file.
Service SupervisionServices list
NSP
Release 19.9September 2019Issue 1 73HE-15169-AAAC-TQZZA
1.7 How do I investigate a service?
From an individual Service list item, you can open a variety of diagnostic views that display the
service in terms of its position in the network, its associated objects, and recent alarm messages
and events. You can also view test results for a service. You access the diagnostic views by
hovering over a list item and then clicking on the option buttons that appear on the right side of the
item.
• View a service in the IGP map: On the right side of a Service list item, click Highlight on IGP
Map to open the IGP map with the service sites and SDP bindings highlighted; see 1.22 “IGP
map” (p. 12).
• List the service sites that host a service: Double-click on a service item in the list. The
Services list opens, displaying all sites associated with the service; see 1.18 “Sites list” (p. 11).
• List the SAPs or SDP bindings for a service: On the right side of a Service list item, click SDP
Bindings or SAPs to view a list of all of the SDP bindings or SAPs on the service; see
1.14 “SAP list” (p. 10) or 1.11 “SDP Bindings list” (p. 9).
• View service alarms: On the right side of a Service list item, click More , Alarms.
View historical alarms: On the right side of a Service list item, click More , Historical
Alarms.
• View service events: On the right side of a Service list item, click More , Event Timeline.
See 1.21 “Event Timeline” (p. 11) for more information.
• View OAM test results for a service: On the right side of a Service list item, click More
, OAM Test Results to view the latest OAM tests results for scheduled test suites for which
the selected service is defined as a test entity.
• Run Analytics reports on a service: On the right side of a Service list item, click More
, Analytics Reports to launch the Analytics Reports dashboard.
You must have the appropriate AA license to run Analytics reports.
1.8 How do I monitor a service?
If you want to keep a close eye on a particular service to monitor its KPI performance, you can add
it to the Watch Drawer. The Watch Drawer can be docked to the side of the Service Supervision
GUI so that you can always see the services listed in it, and monitor the services for KPI changes
as you troubleshoot your network.
• On the right side of a Service list item, click More , Add to Watch View.
1.9 How do I view the sites for a specific service?
• Double-click on a Service list item. The Sites list opens with a list of sites that host the service;
see 1.18 “Sites list” (p. 11).
Service SupervisionHow do I investigate a service?
NSP
3HE-15169-AAAC-TQZZA
Release 19.9September 2019
8 Issue 1
1.10 How do I make changes to a service?
If you decide that you need to make configuration changes to a service to fix a problem, you can
open the service in its management application.
• On the right side of a Service list item, click More , View Properties.
The management application launches and opens the service for configuration changes.
1.11 SDP Bindings list
The SDP Bindings list displays all SDP bindings associated with a service. You can reduce the list
contents by filtering under a specific column with a text string or filter option.
SDP binding status is indicated by the following icons:
• SDP binding operational state is Up
• SDP binding operational state is Down
• SDP binding operational state is Partially Down
• SDP binding operational state is Unknown
1.12 How do I manage the SDP Bindings list contents?
The SDP Bindings list has a variety of tools available to help you control what you see, including
sorting and filtering options:
• Filter the SDP Bindings list under a specific column: Type a text string in the text field or
select a filter option at the top of a column and press Enter. Click Clear Filter to clear
column filters.
• Sort the SDP Bindings list under a specific column: Click on a column header to sort the list
under that column. Click the column header a second time to toggle the sort order (ascending/
descending), as indicated by the Up or Down arrow.
• Refresh the list: On the application toolbar, click Refresh List to update the list contents.
• Export the SDP Bindings list: On the application toolbar, click More , Export to export the
current page or selected rows to a CSV file.
1.13 How do I investigate an SDP binding?
From an individual SDP binding list item, you can open a variety of diagnostic views that display its
recent alarm messages, events, or test results.
• View SDP binding alarms On the right side of an SDP Bindings list item, click Alarms
.
• View SDP binding events On the right side of an SDP Bindings list item, click Event Timeline
.
See 1.21 “Event Timeline” (p. 11) for more information.
• View OAM test results for an SDP binding On the right side of an SDP Bindings list item, click
OAM Tests .
Service SupervisionHow do I make changes to a service?
NSP
Release 19.9September 2019Issue 1 93HE-15169-AAAC-TQZZA
1.14 SAP list
The SAP list displays all SAPs associated with a service. You can reduce the list contents by
filtering under a specific column with a text string or filter option.
SAP status is indicated by the following icons:
• SAP operational state is Up
• SAP operational state is Down
• SAP operational state is Partially Down
• SAP operational state is Unknown
1.15 How do I manage the SAP list contents?
The SAP list has a variety of tools available to help you control what you see, including sorting and
filtering options:
• Filter the SAP list under a specific column: Type a text string in the text field or select a filter
option at the top of a column and press Enter. Click Clear Filter to clear column filters.
• Sort the SAP list under a specific column: Click on a column header to sort the list under that
column. Click the column header a second time to toggle the sort order (ascending/descending),
as indicated by the Up or Down arrow.
• Refresh the list: On the application toolbar, click Refresh List to update the list contents.
• Export the SAP list: On the application toolbar, click More , Export to export the current
page or selected rows to a CSV file.
1.16 How do I investigate a SAP?
From an individual SAP list item, you can open a variety of diagnostic views that display its recent
alarm messages, events, or test results.
• View SAP alarms: On the right side of a SAP list item, click Alarms .
• View SAP events: On the right side of a SAP list item, click Event Timeline . You can open
the Event Timeline for multiple SAPs by selecting two or more SAPs and clicking Event
Timeline.
See 1.21 “Event Timeline” (p. 11) for more information.
• View OAM test results for a SAP: Select two or more SAP list items and click OAM Tests
on the toolbar.
1.17 How do I copy a service object?
You can open a service, SDP binding, or SAP object in a separate window and then copy its site
and KPI data to the clipboard for transfer to a text file or other application.
• On the right side of a service or SDP binding list item, click More , Open in Copy Window.
• On the right side of a SAP list item, click Open in Copy Window .
Service SupervisionSAP list
NSP
3HE-15169-AAAC-TQZZA
Release 19.9September 2019
10 Issue 1
1.18 Sites list
The Sites list displays all sites associated with a service. Each site displays basic status information
and alarm counts.
Site status is indicated by the following icons:
• Site operational state is Up
• Site operational state is Down
• Site operational state is Partially Down
• Site operational state is Unknown
1.19 How do I manage the Site list contents?
The Site list has a variety of tools available to help you control what you see, including sorting and
filtering options:
• Filter the Site list under a specific column: Type a text string in the text field or select a filter
option at the top of a column and press Enter. Click Clear Filter to clear column filters.
• Sort the Site list under a specific column: Click on a column header to sort the list under that
column. Click the column header a second time to toggle the sort order (ascending/descending),
as indicated by the Up or Down arrow.
• Refresh the list: On the application toolbar, click Refresh List to update the list contents.
• Export the Site list: On the application toolbar, click More , Export to export the current
page or selected rows to a CSV file.
1.20 How do I investigate a service site?
From an individual service site list item, you can open a variety of diagnostic views that display the
site in terms of its associated objects, and recent alarm messages and events. You access the
diagnostic views by hovering over a list item and then clicking on the option buttons that appear on
the right side of the item.
Perform the following tasks in the Sites list:
• List SAP and SDP bindings on a site: On the right side of a service site list item, click SDP
Bindings or SAPs to view a list of all of the SDP bindings or SAPs on the site; see
1.14 “SAP list” (p. 10) or 1.11 “SDP Bindings list” (p. 9).
• Event Timeline: Open the event timeline for the site by clicking Event Timeline on the right side
of a row.
• View service site alarms: On the right side of a service site list item, click More , Alarms.
1.21 Event Timeline
The Event Timeline records events related to alarms, configuration, OAM test failures and state
change notifications, to help determine the root cause. The timeline is displayed along the bottom,
Service SupervisionSites list
NSP
Release 19.9September 2019Issue 1 113HE-15169-AAAC-TQZZA
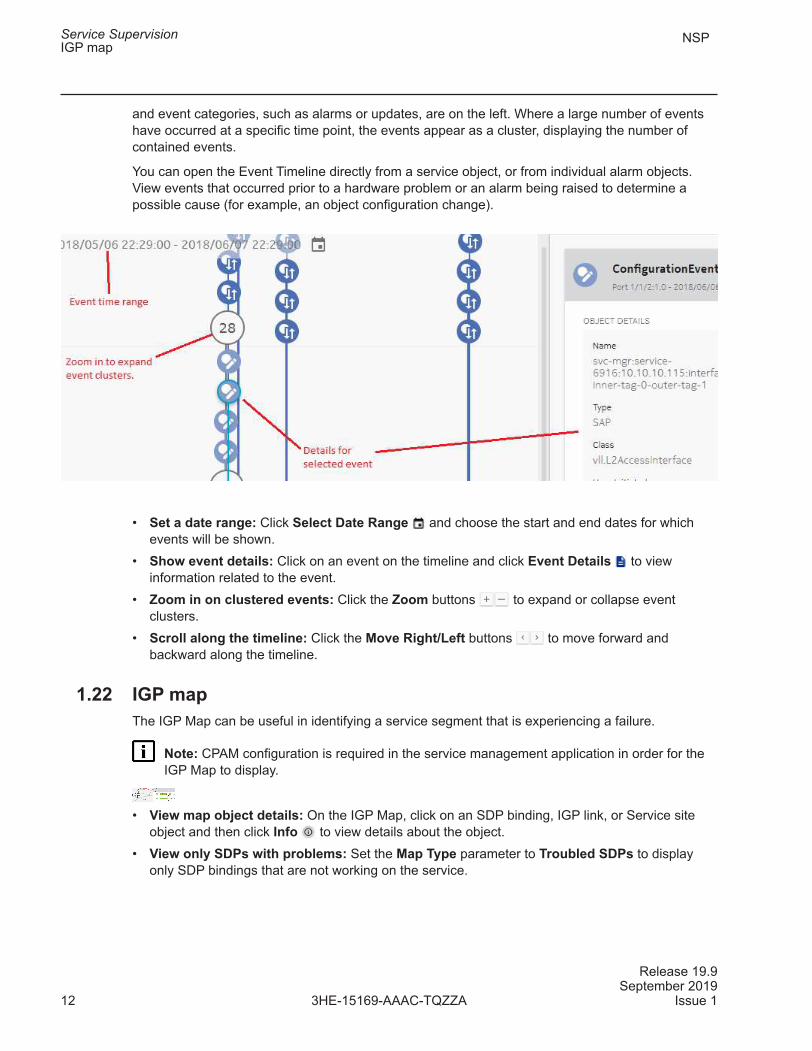
and event categories, such as alarms or updates, are on the left. Where a large number of events
have occurred at a specific time point, the events appear as a cluster, displaying the number of
contained events.
You can open the Event Timeline directly from a service object, or from individual alarm objects.
View events that occurred prior to a hardware problem or an alarm being raised to determine a
possible cause (for example, an object configuration change).
• Set a date range: Click Select Date Range and choose the start and end dates for which
events will be shown.
• Show event details: Click on an event on the timeline and click Event Details to view
information related to the event.
• Zoom in on clustered events: Click the Zoom buttons to expand or collapse event
clusters.
• Scroll along the timeline: Click the Move Right/Left buttons to move forward and
backward along the timeline.
1.22 IGP map
The IGP Map can be useful in identifying a service segment that is experiencing a failure.
Note: CPAM configuration is required in the service management application in order for the
IGP Map to display.
• View map object details: On the IGP Map, click on an SDP binding, IGP link, or Service site
object and then click Info to view details about the object.
• View only SDPs with problems: Set the Map Type parameter to Troubled SDPs to display
only SDP bindings that are not working on the service.
Service SupervisionIGP map
NSP
3HE-15169-AAAC-TQZZA
Release 19.9September 2019
12 Issue 1
1.23 How do I show SDP binding traffic flows on the IGP map?
1
Click on an SDP binding object on the map.
2
On the right side of the GUI, click Info to view details about the SDP binding.
3
On the Info panel, next to an SDP binding list item, click More , Highlight SDP Binding
SPF and/or Highlight SDP Binding.
Traffic flows appear as colored arrows, indicating traffic direction through service tunnels
between SDPs.
4
To hide traffic flows, click View Options . Uncheck the traffic flow item whose color matches
the traffic flow you want to hide.
END OF STEPS
1.24 Alarm list
The Alarm list presents all alarms against services in your network. The list can be filtered and
sorted in a variety of ways to reduce the number of visible alarm messages to a manageable
number. Open an alarm list from a specific service to view alarms only for that service. Open the
general Alarm List view to see alarms for your entire network.
Manage the order and content of the Alarm list using the following tasks:
• Configure an advanced filter for the Alarm List. Click Filter and select Advanced Filter.
In the Advanced Filter form, specify a name and configure one or more filter criteria. Enable the
Public option to make the filter available to other users, and accessible for alarm e-mail policies.
Save the filter and click Apply to apply it immediately. A chip filter appears at the top of the list.
Click Clear Filter to remove the filter.
• Filter the Alarm list under a specific column. Type a text string in the text field at the top of a
column and press Enter, or use the date picker or drop-down menu (where available) and press
Enter. Click Clear Filter to clear column filters.
• Sort the alarm list under a specific column. Click on a column header to sort the list under
that column. Click the column header a second time to toggle the sort order (ascending/
descending), as indicated by the Up/Down arrow.
• Refresh the alarm list manually. Click Refresh .
• Configure columns. Right-click on a column header and choose Columns from the menu. A list
of column names appears.
Click on the names of the columns that you want to display. Click above the column headers on
the list to close the column selector and refresh the view.
Service SupervisionHow do I show SDP binding traffic flows on the IGP map?
NSP
Release 19.9September 2019Issue 1 133HE-15169-AAAC-TQZZA
• Configure column sorting. Right-click on a column header and choose Configure Sort from
the menu.
In the Configure Sort form, click Add Level and choose the first column on which to sort, in
ascending or descending order. You can continue to choose columns to sort the list under.
In the Configure Sort form, you can also copy, delete, and re-order selected entries.
1.25 How do I change supervision group KPI color thresholds?
The color of a supervision group tile object header gives you a rough idea of the number of alarm-
affected services in the group. You can change the alarm count thresholds at which the colors
change.
1. Click More , Group KPI Threshold Settings.
2. In the Group KPI Threshold Settings form, use the sliding bar to set the threshold for each
range that you want to apply.
1.26 How do I change trend arrow time setting?
The trend arrow that appears at the top-right corner of each supervision group matrix tile changes
its appearance in the event of a KPI change within the group over the preset time frame. You can
change the duration of that time frame.
1. Click More , User Preferences.
2. In the User Preferences form, choose a trend time setting from the drop-down menu and click
Save.
1.27 How do I change the maximum number of tiles in the Summaryview?
You can change the maximum number of supervision group tile objects that appear in the Summary
view to a maximum of 200 supervision groups. A larger number of groups may take longer to load
onto the page.
1. Click More , User Preferences.
2. In the User Preferences form, specify the maximum number of groups and click Save.
1.28 How do I change Event Timeline settings?
You can enable or disable event recording and specify the network objects you want to record
events for on the timeline.
1. Click More , Timeline Settings.
2. In the Timeline Settings form:
• Enable or disable the Enable Event Recording check box.
• Enable the check box for each object you want to record events for on the timeline.
3. Click Save.
Service SupervisionHow do I change supervision group KPI color thresholds?
NSP
3HE-15169-AAAC-TQZZA
Release 19.9September 2019
14 Issue 1
1.29 How do I change map label settings?
You can change the information that appears in static labels for various map object types, or
suppress map labels altogether.
Note: Mouse-over map object labels always appear, regardless of these settings.
1. Click More , Map Label Settings.
2. In the Map Label Settings form, specify the kind of information you want to appear in labels for
service sites, routers, and subnets. If you select None for a specific object type, the label does
not appear.
3. Click Save.
Service SupervisionHow do I change map label settings?
NSP
Release 19.9September 2019Issue 1 153HE-15169-AAAC-TQZZA

Service SupervisionHow do I change map label settings?
NSP
3HE-15169-AAAC-TQZZA
Release 19.9September 2019
16 Issue 1
2 Service Supervision use cases
2.1 Routine service maintenance with Service Supervision
Purpose
This article shows you how to use the Service Supervision application to monitor the status of the
services running in your network and to locate and troubleshoot problems.
Starting points for troubleshooting monitored services
Changes to services manifest themselves through trending arrows on group tiles, and through
changes to KPI icon color on service objects.
Any of the following events could indicate that you need to troubleshoot your services:
• One or more KPI icons turn red on services in the Watch view.
To add services to the Watch view, hover over a service item in the Service list and click More
, Add To Watch Drawer.
• A Trending Arrow appears on a tile, or the tile changes color as services are impacted by
new issues.
• A service item in the Service list shows problems with service objects: service site down, SAP
down, SDP binding down, and/or OAM test validation failure.
Triaging steps for a group
1
Select an affected group tile in the view.
2
Determine the number of affected services and services with sites down for the group.
Service Supervision use casesRoutine service maintenance with Service Supervision
NSP
Release 19.9September 2019Issue 1 173HE-15169-AAAC-TQZZA
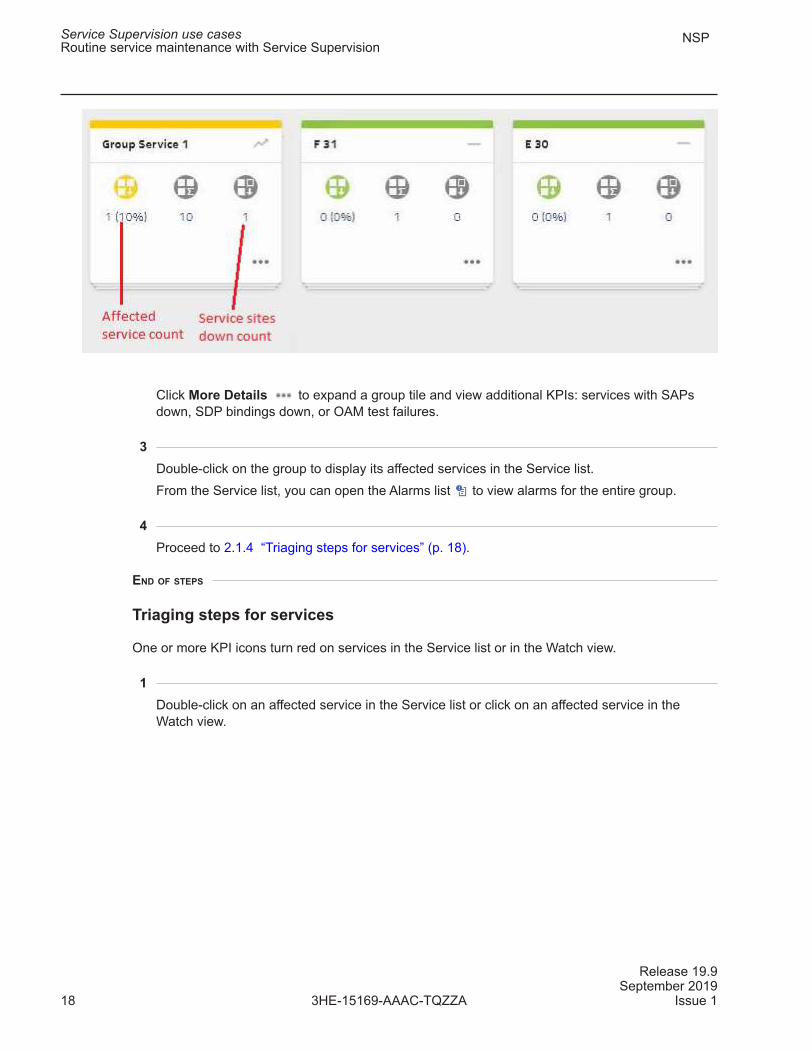
Click More Details to expand a group tile and view additional KPIs: services with SAPs
down, SDP bindings down, or OAM test failures.
3
Double-click on the group to display its affected services in the Service list.
From the Service list, you can open the Alarms list to view alarms for the entire group.
4
Proceed to 2.1.4 “Triaging steps for services” (p. 18).
END OF STEPS
Triaging steps for services
One or more KPI icons turn red on services in the Service list or in the Watch view.
1
Double-click on an affected service in the Service list or click on an affected service in the
Watch view.
Service Supervision use casesRoutine service maintenance with Service Supervision
NSP
3HE-15169-AAAC-TQZZA
Release 19.9September 2019
18 Issue 1
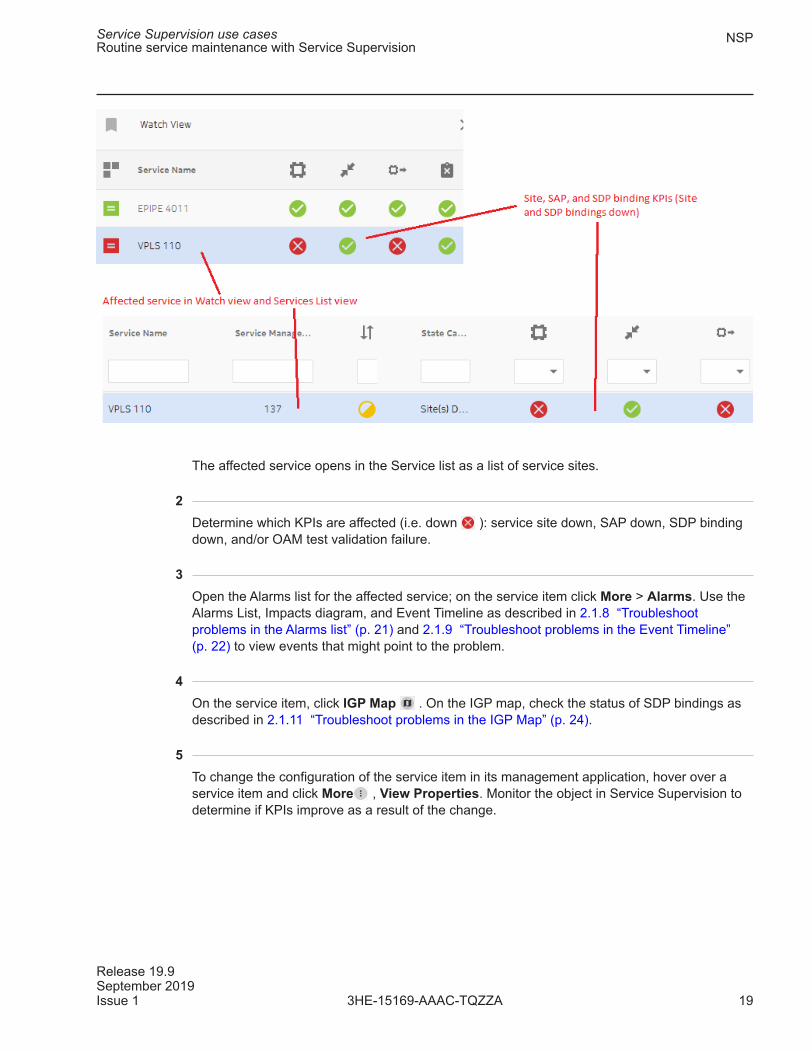
The affected service opens in the Service list as a list of service sites.
2
Determine which KPIs are affected (i.e. down ): service site down, SAP down, SDP binding
down, and/or OAM test validation failure.
3
Open the Alarms list for the affected service; on the service item click More > Alarms. Use the
Alarms List, Impacts diagram, and Event Timeline as described in 2.1.8 “Troubleshoot
problems in the Alarms list” (p. 21) and 2.1.9 “Troubleshoot problems in the Event Timeline”
(p. 22) to view events that might point to the problem.
4
On the service item, click IGP Map . On the IGP map, check the status of SDP bindings as
described in 2.1.11 “Troubleshoot problems in the IGP Map” (p. 24).
5
To change the configuration of the service item in its management application, hover over a
service item and click More , View Properties. Monitor the object in Service Supervision to
determine if KPIs improve as a result of the change.
Service Supervision use casesRoutine service maintenance with Service Supervision
NSP
Release 19.9September 2019Issue 1 193HE-15169-AAAC-TQZZA
6
After troubleshooting, verify that all alarms and KPIs have cleared and run OAM tests to prove
that traffic can flow.
END OF STEPS
Triaging steps for a service site
For a selected service item in the Service list, the Service Site KPI is Down.
1
Double-click on the service item to drill down to a list of all sites for the service.
2
Open the Alarms list for the affected service site; on the site item, click More , Alarms.
3
Use the Alarms List and Impacts diagram as described in 2.1.8 “Troubleshoot problems in the
Alarms list” (p. 21) to view events that might point to the problem.
4
On the service item, click Event Timeline . Use the Event Timeline as described in
2.1.9 “Troubleshoot problems in the Event Timeline” (p. 22) to view events that might point to
the problem.
5
Select multiple affected service site item(s) and click OAM Test . Perform OAM tests as
described in 2.1.10 “Troubleshoot problems with OAM tests” (p. 23) .
END OF STEPS
Triaging steps for a SAP
For a selected service item in the Service list, the SAP KPI is Down.
1
On the service item, click on the SAP icon to drill down to a list of SAPs on the service.
2
On an affected SAP item, click Alarms . Use the Alarms List and Impacts diagram as
described in 2.1.8 “Troubleshoot problems in the Alarms list” (p. 21) to view events that might
point to the problem.
Service Supervision use casesRoutine service maintenance with Service Supervision
NSP
3HE-15169-AAAC-TQZZA
Release 19.9September 2019
20 Issue 1
3
On an affected SAP item, click Event Timeline . Use the Event Timeline as described in
2.1.9 “Troubleshoot problems in the Event Timeline” (p. 22) to view events that might point to
the problem.
4
Select multiple affected SAP item(s) and click OAM Test . Perform OAM tests as described
in 2.1.10 “Troubleshoot problems with OAM tests” (p. 23) .
END OF STEPS
Triaging steps for an SDP binding
For a selected service item in the Service list, the SDP Binding KPI is Down.
1
On the service item, click the SDP Binding icon to drill down to a list of SDP bindings on the
service.
2
On an affected SDP binding item, click Alarms . Use the Alarms List and Impacts diagram
as described in 2.1.8 “Troubleshoot problems in the Alarms list” (p. 21) to view events that
might point to the problem.
3
On an affected SDP binding item, click Event Timeline . Use the Event Timeline as
described in 2.1.9 “Troubleshoot problems in the Event Timeline” (p. 22) to view events that
might point to the problem.
4
Select one or more affected SDP binding item(s) and click OAM Test . Perform OAM tests
as described in 2.1.10 “Troubleshoot problems with OAM tests” (p. 23) .
END OF STEPS
Troubleshoot problems in the Alarms list
Click on an alarm message in the list to display complete details of the alarm, including descriptive
and remedial information.
If you suspect that the affected object for the selected alarm is a cause of the current problem, you
can open the affected object in its management application directly from the Alarms list. On the
Service Supervision use casesRoutine service maintenance with Service Supervision
NSP
Release 19.9September 2019Issue 1 213HE-15169-AAAC-TQZZA
selected alarm item, click More →Show Affected Object. Make configuration changes to the
affected object while monitoring the object in Service Supervision to determine if KPIs improve as a
result of the change.
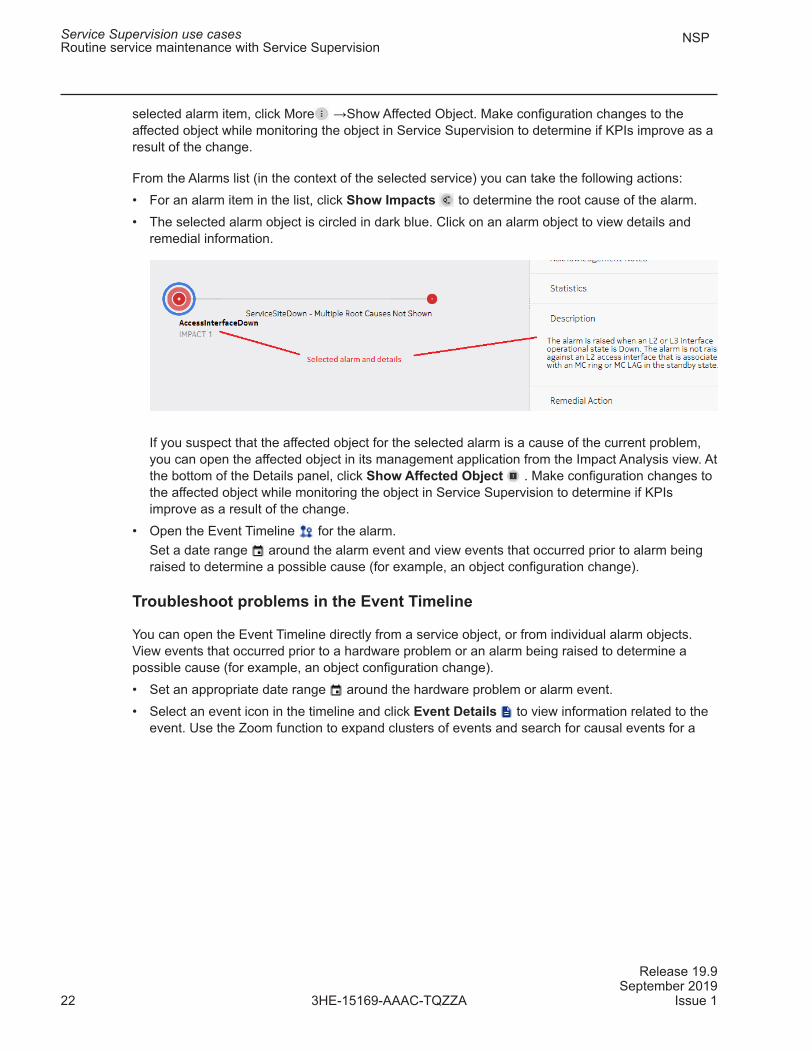
From the Alarms list (in the context of the selected service) you can take the following actions:
• For an alarm item in the list, click Show Impacts to determine the root cause of the alarm.
• The selected alarm object is circled in dark blue. Click on an alarm object to view details and
remedial information.
If you suspect that the affected object for the selected alarm is a cause of the current problem,
you can open the affected object in its management application from the Impact Analysis view. At
the bottom of the Details panel, click Show Affected Object . Make configuration changes to
the affected object while monitoring the object in Service Supervision to determine if KPIs
improve as a result of the change.
• Open the Event Timeline for the alarm.
Set a date range around the alarm event and view events that occurred prior to alarm being
raised to determine a possible cause (for example, an object configuration change).
Troubleshoot problems in the Event Timeline
You can open the Event Timeline directly from a service object, or from individual alarm objects.
View events that occurred prior to a hardware problem or an alarm being raised to determine a
possible cause (for example, an object configuration change).
• Set an appropriate date range around the hardware problem or alarm event.
• Select an event icon in the timeline and click Event Details to view information related to the
event. Use the Zoom function to expand clusters of events and search for causal events for a
Service Supervision use casesRoutine service maintenance with Service Supervision
NSP
3HE-15169-AAAC-TQZZA
Release 19.9September 2019
22 Issue 1
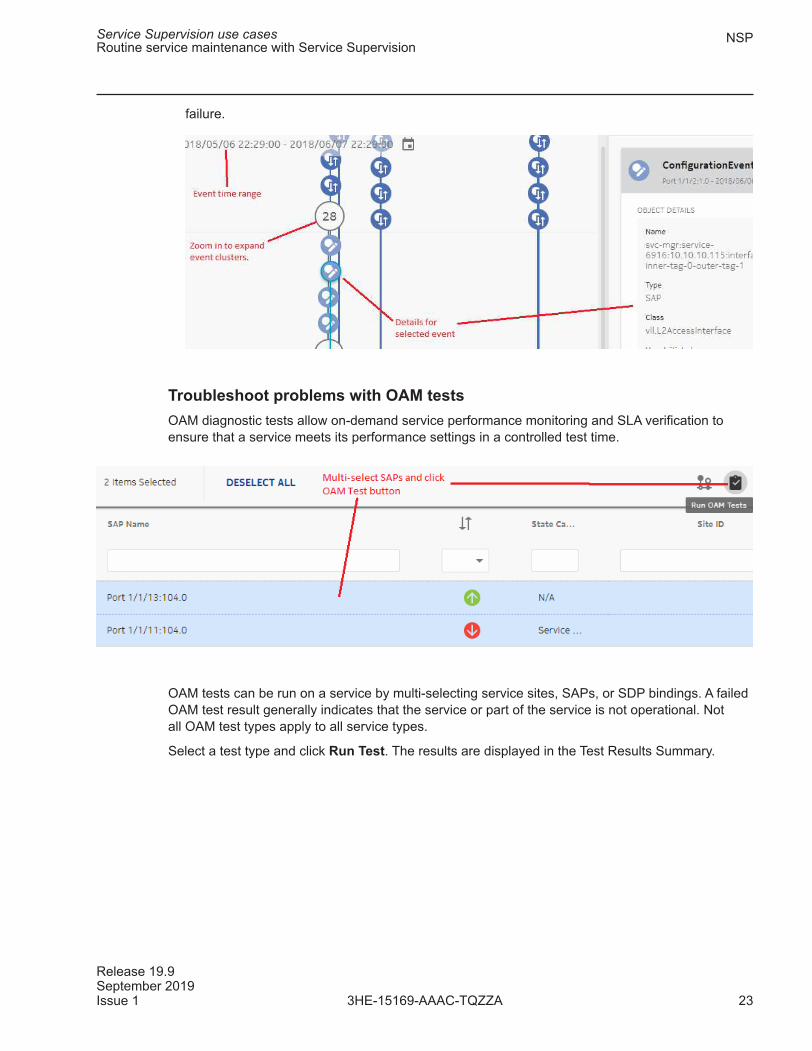
failure.
Troubleshoot problems with OAM tests
OAM diagnostic tests allow on-demand service performance monitoring and SLA verification to
ensure that a service meets its performance settings in a controlled test time.
OAM tests can be run on a service by multi-selecting service sites, SAPs, or SDP bindings. A failed
OAM test result generally indicates that the service or part of the service is not operational. Not
all OAM test types apply to all service types.
Select a test type and click Run Test. The results are displayed in the Test Results Summary.
Service Supervision use casesRoutine service maintenance with Service Supervision
NSP
Release 19.9September 2019Issue 1 233HE-15169-AAAC-TQZZA
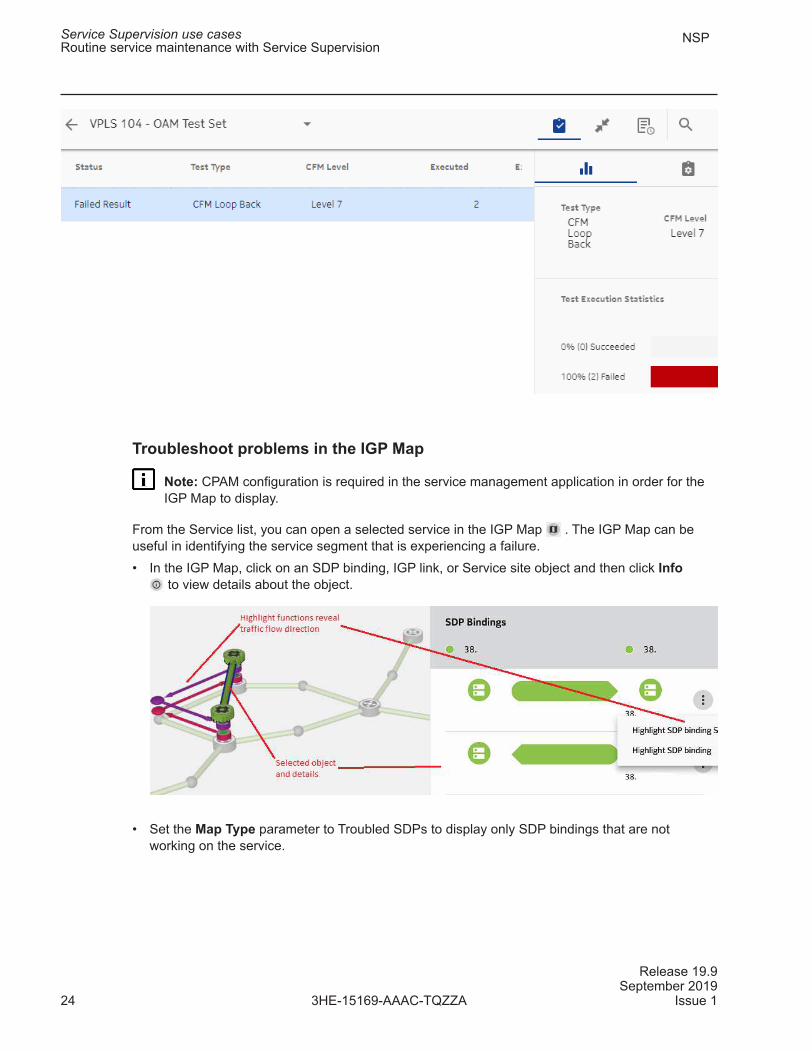
Troubleshoot problems in the IGP Map
Note: CPAM configuration is required in the service management application in order for the
IGP Map to display.
From the Service list, you can open a selected service in the IGP Map . The IGP Map can be
useful in identifying the service segment that is experiencing a failure.
• In the IGP Map, click on an SDP binding, IGP link, or Service site object and then click Info
to view details about the object.
• Set the Map Type parameter to Troubled SDPs to display only SDP bindings that are not
working on the service.
Service Supervision use casesRoutine service maintenance with Service Supervision
NSP
3HE-15169-AAAC-TQZZA
Release 19.9September 2019
24 Issue 1
2.2 Fault Identification in Service Supervision
This article shows how to use the Service Supervision application to identify faults and reduce time
to resolve those faults, including using the Event Timeline to troubleshoot issues.
Let’s go
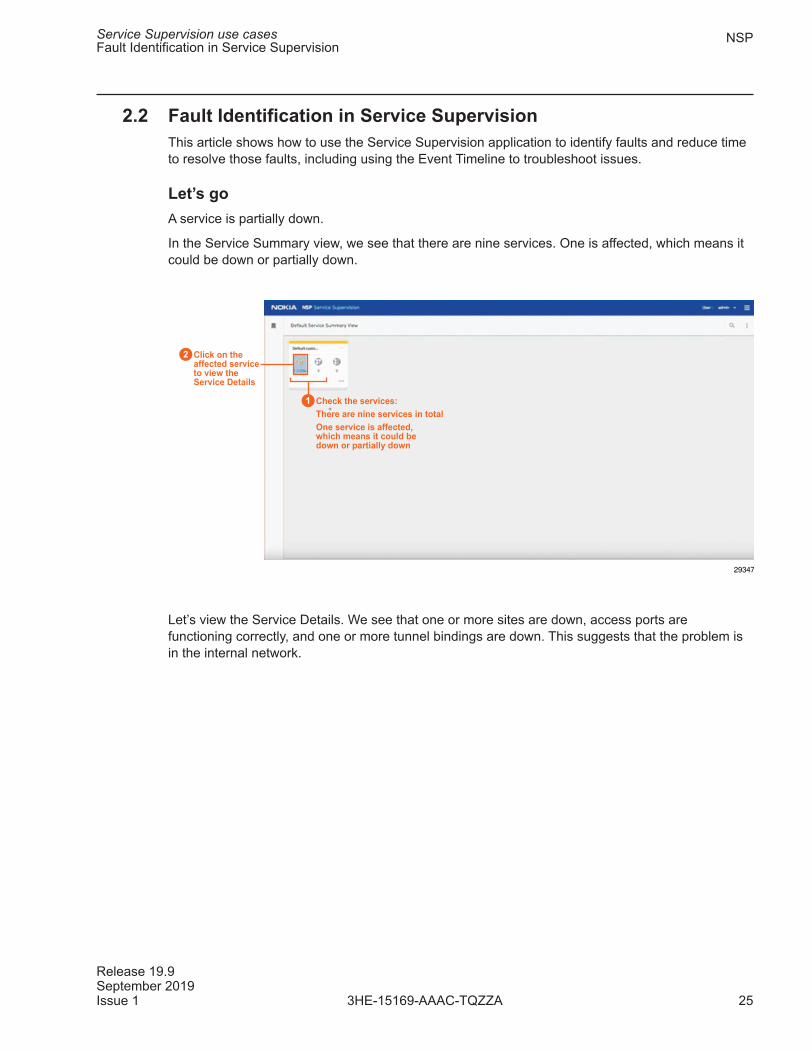
A service is partially down.
In the Service Summary view, we see that there are nine services. One is affected, which means it
could be down or partially down.
Let’s view the Service Details. We see that one or more sites are down, access ports are
functioning correctly, and one or more tunnel bindings are down. This suggests that the problem is
in the internal network.
1 Check the services:
There are nine services in total
One service is affected,which means it could bedown or partially down
2 Click on theaffected serviceto view theService Details
29347
Service Supervision use casesFault Identification in Service Supervision
NSP
Release 19.9September 2019Issue 1 253HE-15169-AAAC-TQZZA
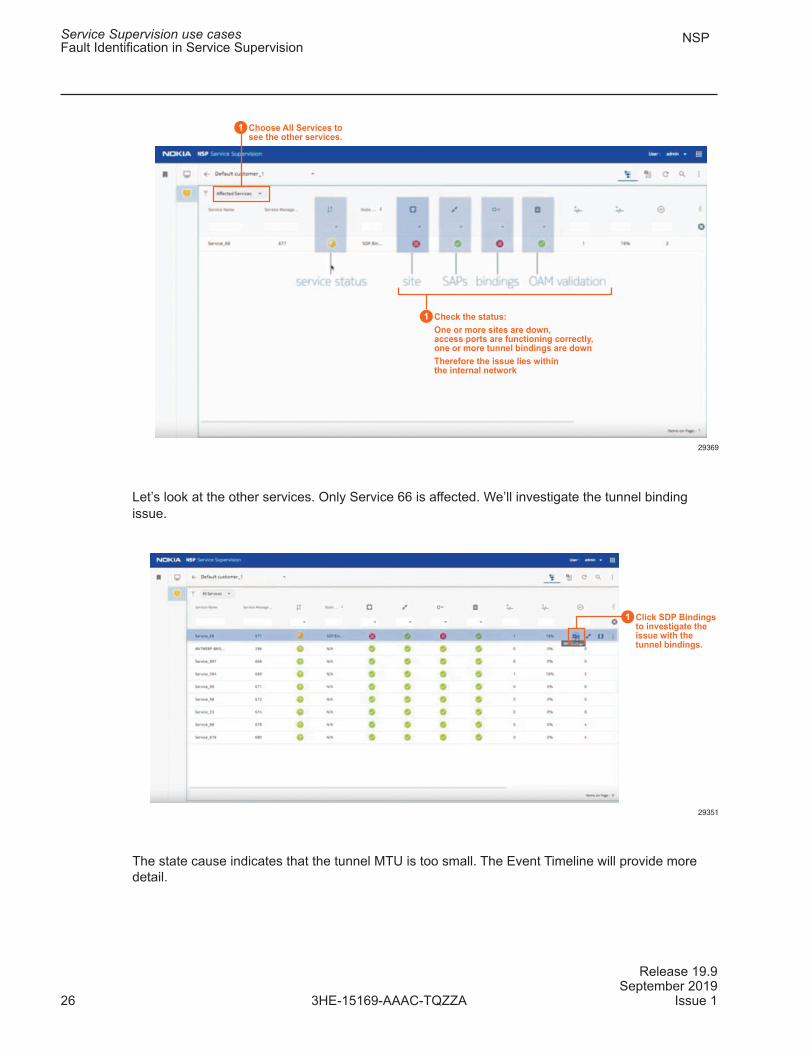
Let’s look at the other services. Only Service 66 is affected. We’ll investigate the tunnel binding
issue.
The state cause indicates that the tunnel MTU is too small. The Event Timeline will provide more
detail.
1 Choose All Services tosee the other services.
1 Check the status:
One or more sites are down,access ports are functioning correctly,one or more tunnel bindings are down
Therefore the issue lies withinthe internal network
29369
1 Click SDP Bindingsto investigate theissue with thetunnel bindings.
29351
Service Supervision use casesFault Identification in Service Supervision
NSP
3HE-15169-AAAC-TQZZA
Release 19.9September 2019
26 Issue 1
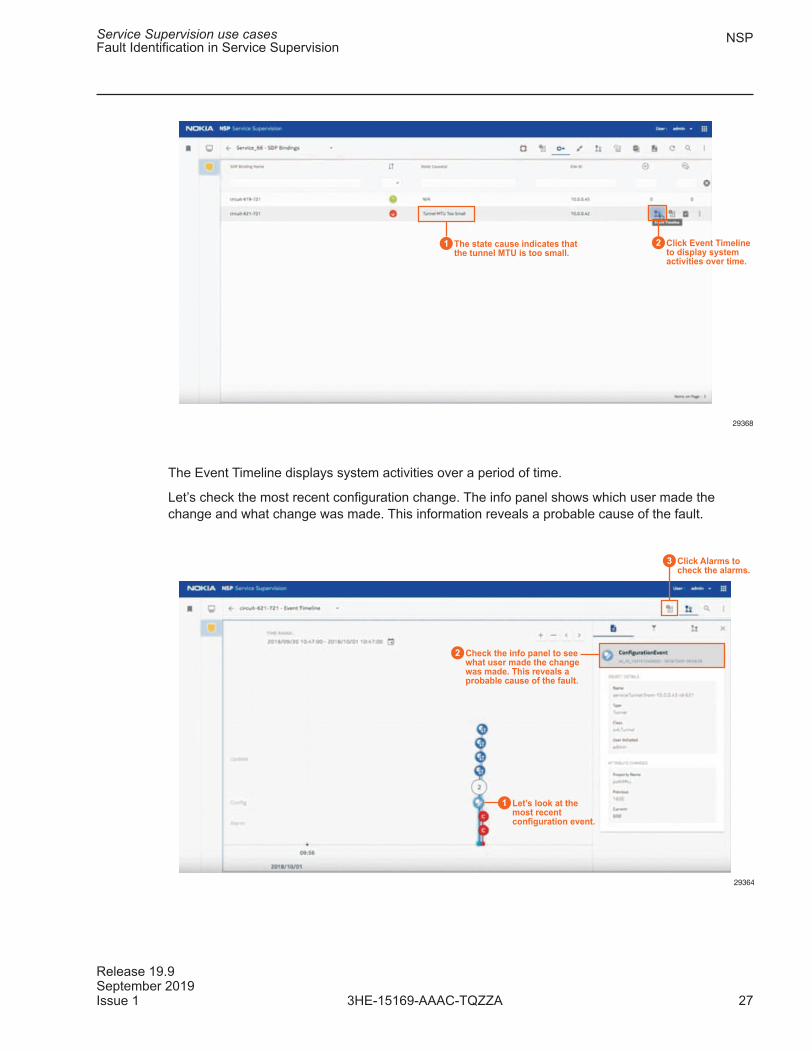
The Event Timeline displays system activities over a period of time.
Let’s check the most recent configuration change. The info panel shows which user made the
change and what change was made. This information reveals a probable cause of the fault.
1 The state cause indicates thatthe tunnel MTU is too small.
2 Click Event Timelineto display systemactivities over time.
29368
1
3 Click Alarms tocheck the alarms.
2 Check the info panel to seewhat user made the changewas made. This reveals aprobable cause of the fault.
Let’s look at themost recentconfiguration event.
29364
Service Supervision use casesFault Identification in Service Supervision
NSP
Release 19.9September 2019Issue 1 273HE-15169-AAAC-TQZZA
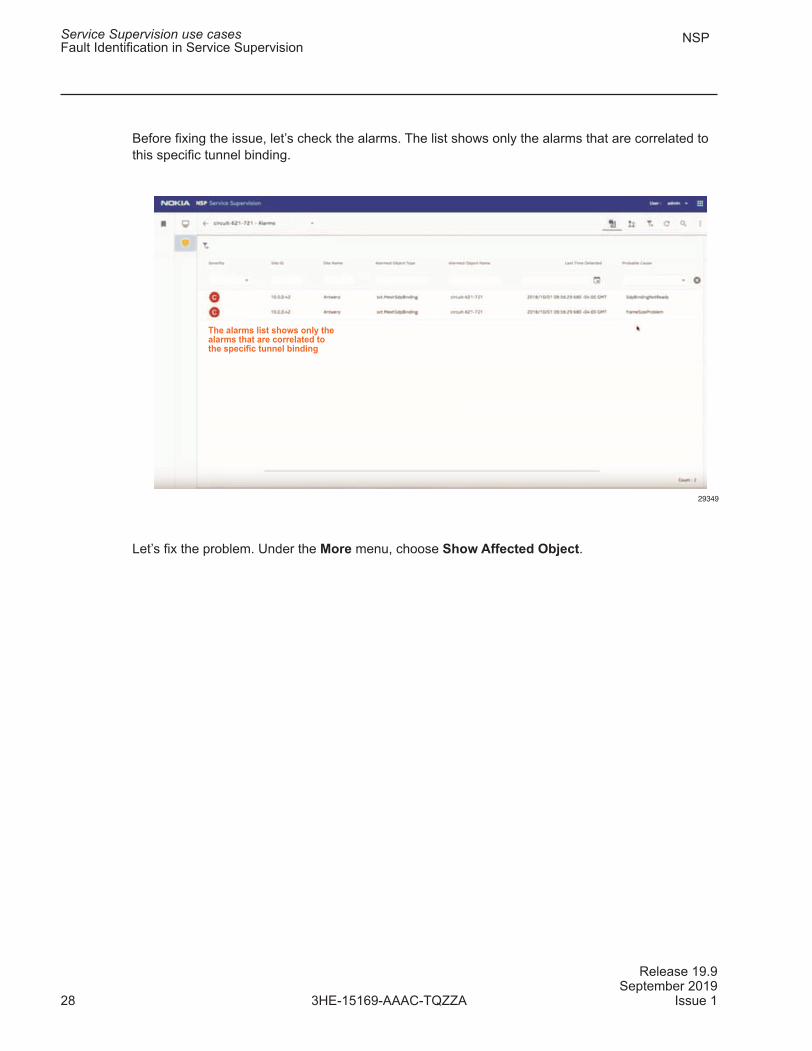
Before fixing the issue, let’s check the alarms. The list shows only the alarms that are correlated to
this specific tunnel binding.
Let’s fix the problem. Under the More menu, choose Show Affected Object.
The alarms list shows only thealarms that are correlated tothe specific tunnel binding
29349
Service Supervision use casesFault Identification in Service Supervision
NSP
3HE-15169-AAAC-TQZZA
Release 19.9September 2019
28 Issue 1
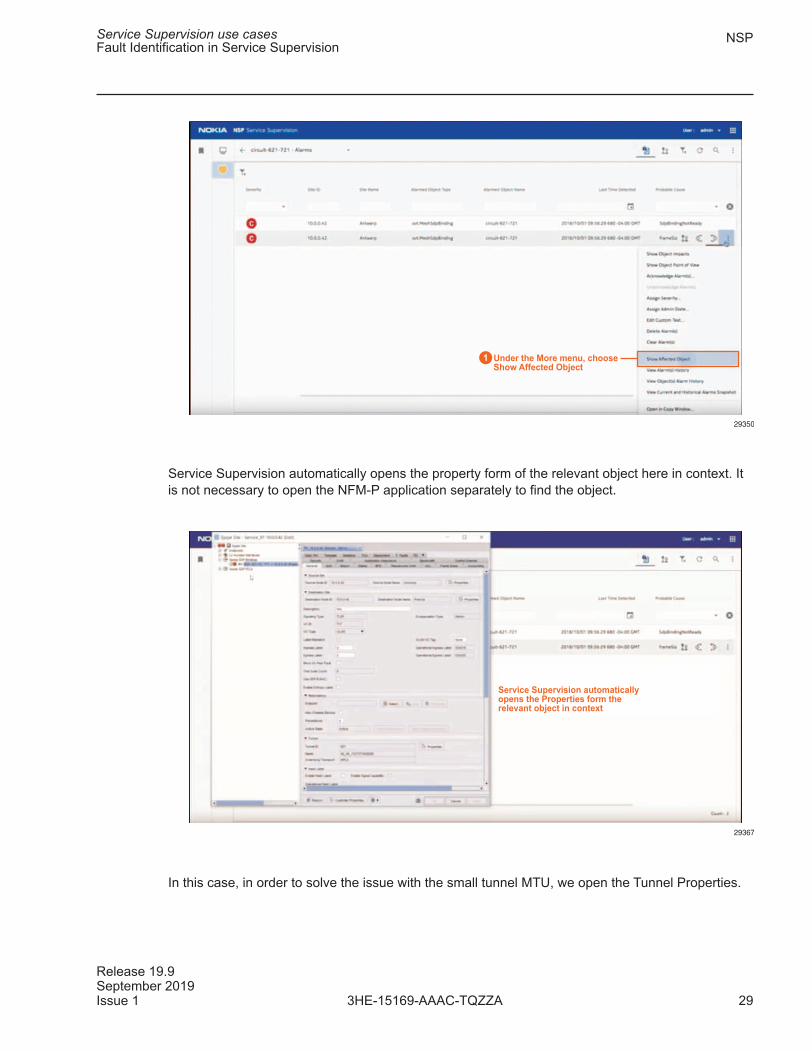
Service Supervision automatically opens the property form of the relevant object here in context. It
is not necessary to open the NFM-P application separately to find the object.
In this case, in order to solve the issue with the small tunnel MTU, we open the Tunnel Properties.
1 Under the More menu, chooseShow Affected Object
29350
Service Supervision automaticallyopens the Properties form therelevant object in context
29367
Service Supervision use casesFault Identification in Service Supervision
NSP
Release 19.9September 2019Issue 1 293HE-15169-AAAC-TQZZA
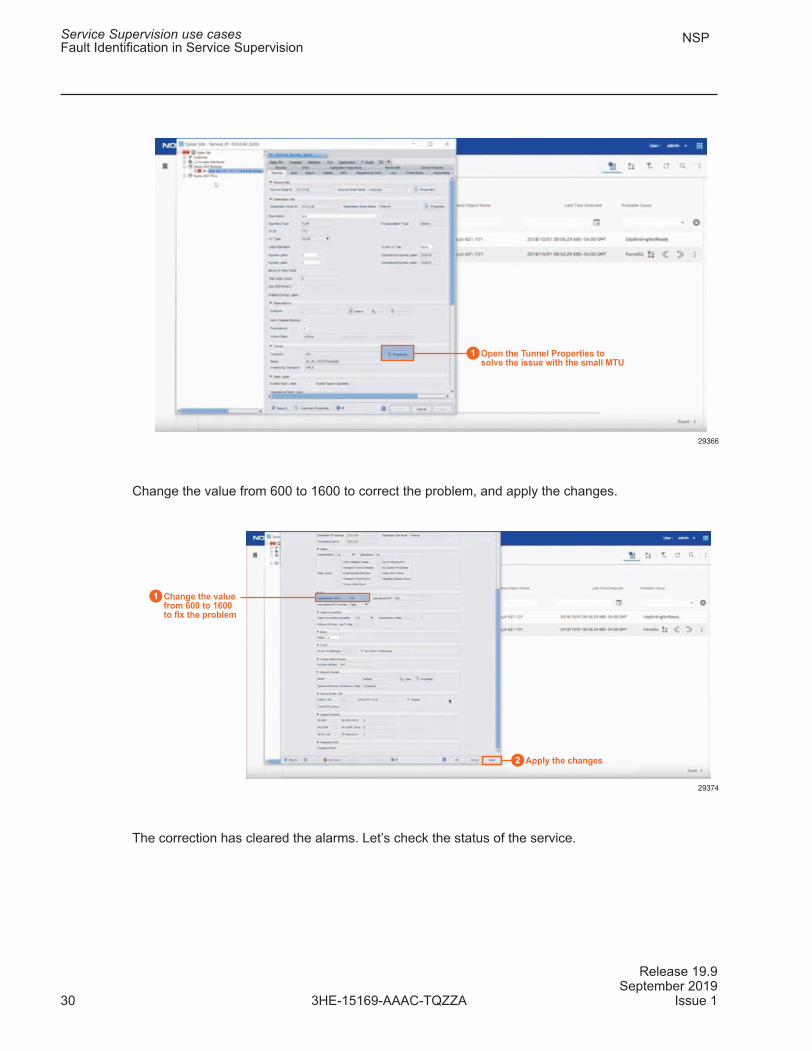
Change the value from 600 to 1600 to correct the problem, and apply the changes.
The correction has cleared the alarms. Let’s check the status of the service.
1 Open the Tunnel Properties tosolve the issue with the small MTU
29366
1 Change the valuefrom 600 to 1600to fix the problem
2 Apply the changes
29374
Service Supervision use casesFault Identification in Service Supervision
NSP
3HE-15169-AAAC-TQZZA
Release 19.9September 2019
30 Issue 1
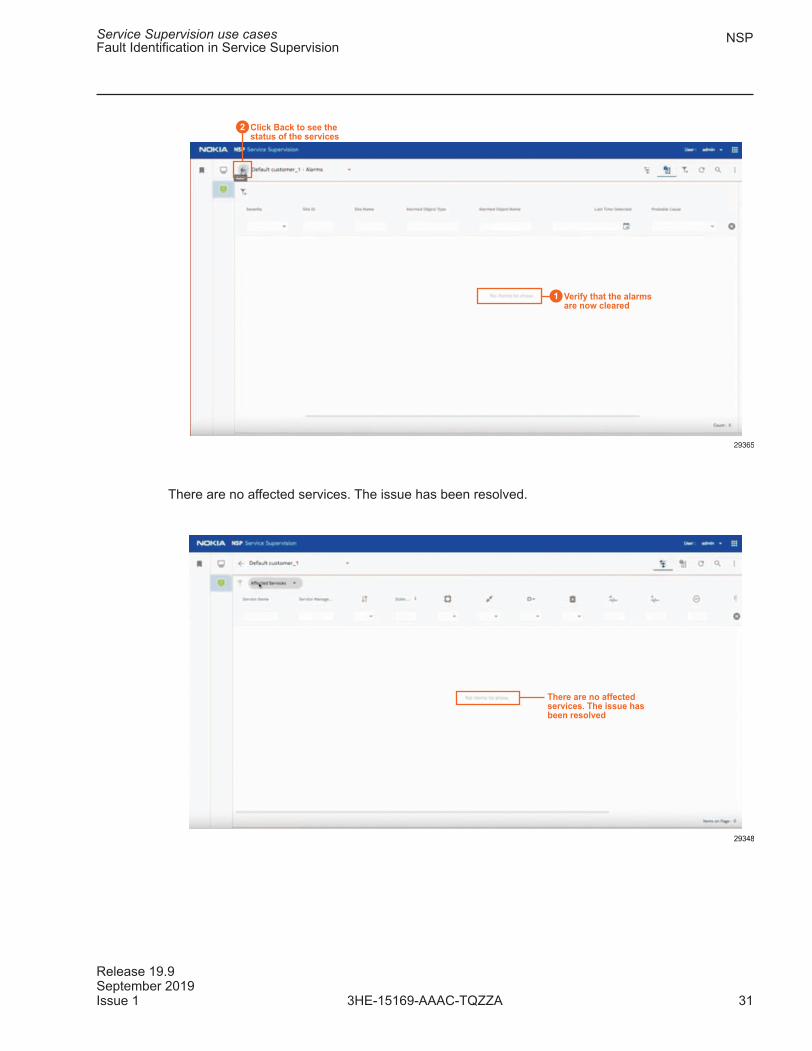
There are no affected services. The issue has been resolved.
1 Verify that the alarmsare now cleared
2 Click Back to see thestatus of the services
29365
There are no affectedservices. The issue hasbeen resolved
29348
Service Supervision use casesFault Identification in Service Supervision
NSP
Release 19.9September 2019Issue 1 313HE-15169-AAAC-TQZZA
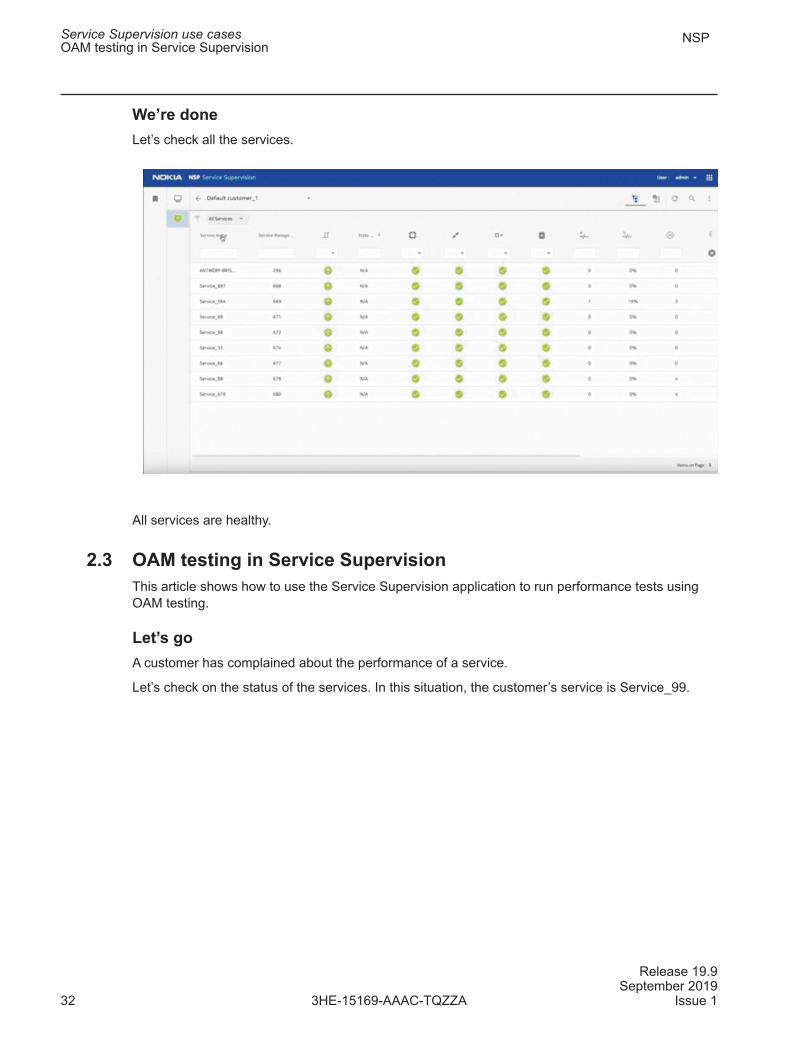
We’re done
Let’s check all the services.
All services are healthy.
2.3 OAM testing in Service Supervision
This article shows how to use the Service Supervision application to run performance tests using
OAM testing.
Let’s go
A customer has complained about the performance of a service.
Let’s check on the status of the services. In this situation, the customer’s service is Service_99.
Service Supervision use casesOAM testing in Service Supervision
NSP
3HE-15169-AAAC-TQZZA
Release 19.9September 2019
32 Issue 1
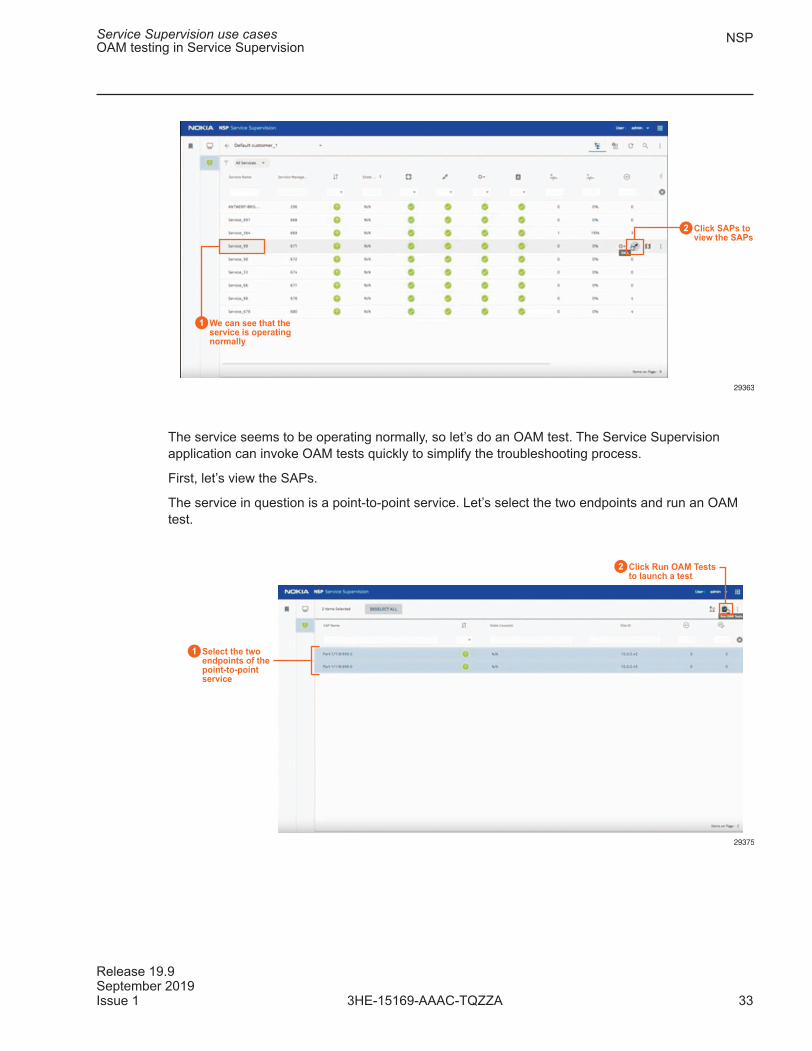
The service seems to be operating normally, so let’s do an OAM test. The Service Supervision
application can invoke OAM tests quickly to simplify the troubleshooting process.
First, let’s view the SAPs.
The service in question is a point-to-point service. Let’s select the two endpoints and run an OAM
test.
2 Click SAPs to view the SAPs
1 We can see that theservice is operatingnormally
29363
1 Select the twoendpoints of thepoint-to-pointservice
2 Click Run OAM Teststo launch a test
29375
Service Supervision use casesOAM testing in Service Supervision
NSP
Release 19.9September 2019Issue 1 333HE-15169-AAAC-TQZZA
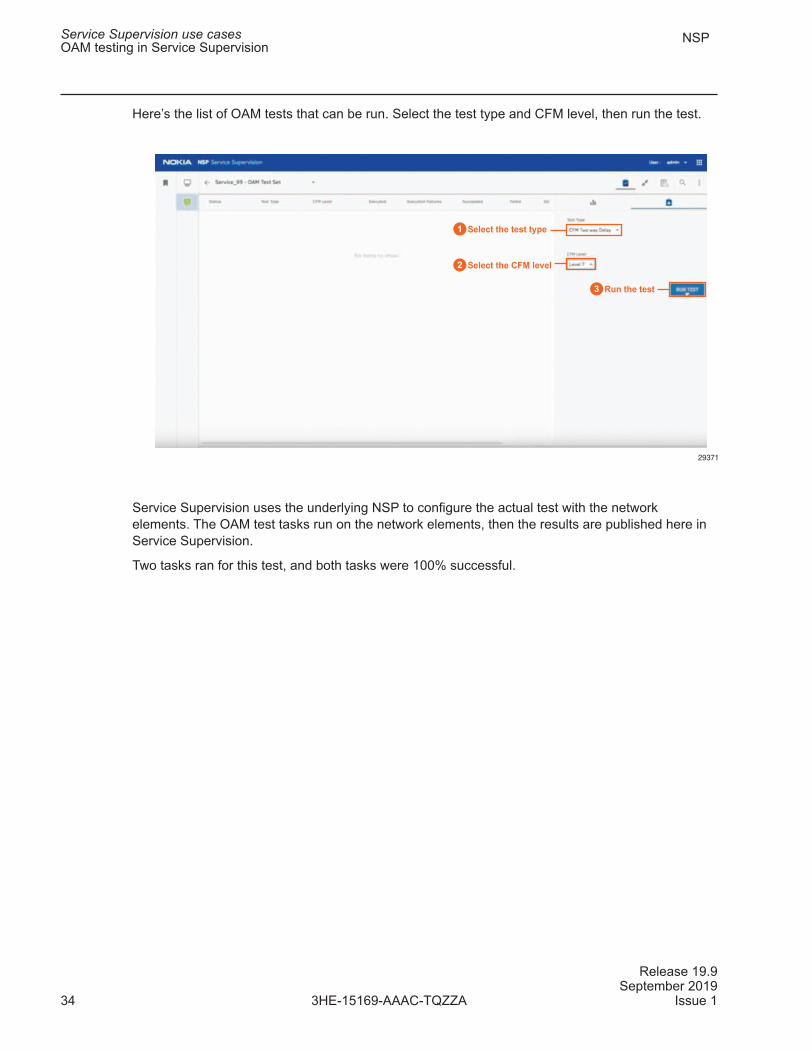
Here’s the list of OAM tests that can be run. Select the test type and CFM level, then run the test.
Service Supervision uses the underlying NSP to configure the actual test with the network
elements. The OAM test tasks run on the network elements, then the results are published here in
Service Supervision.
Two tasks ran for this test, and both tasks were 100% successful.
1 Select the test type
2 Select the CFM level
3 Run the test
29371
Service Supervision use casesOAM testing in Service Supervision
NSP
3HE-15169-AAAC-TQZZA
Release 19.9September 2019
34 Issue 1
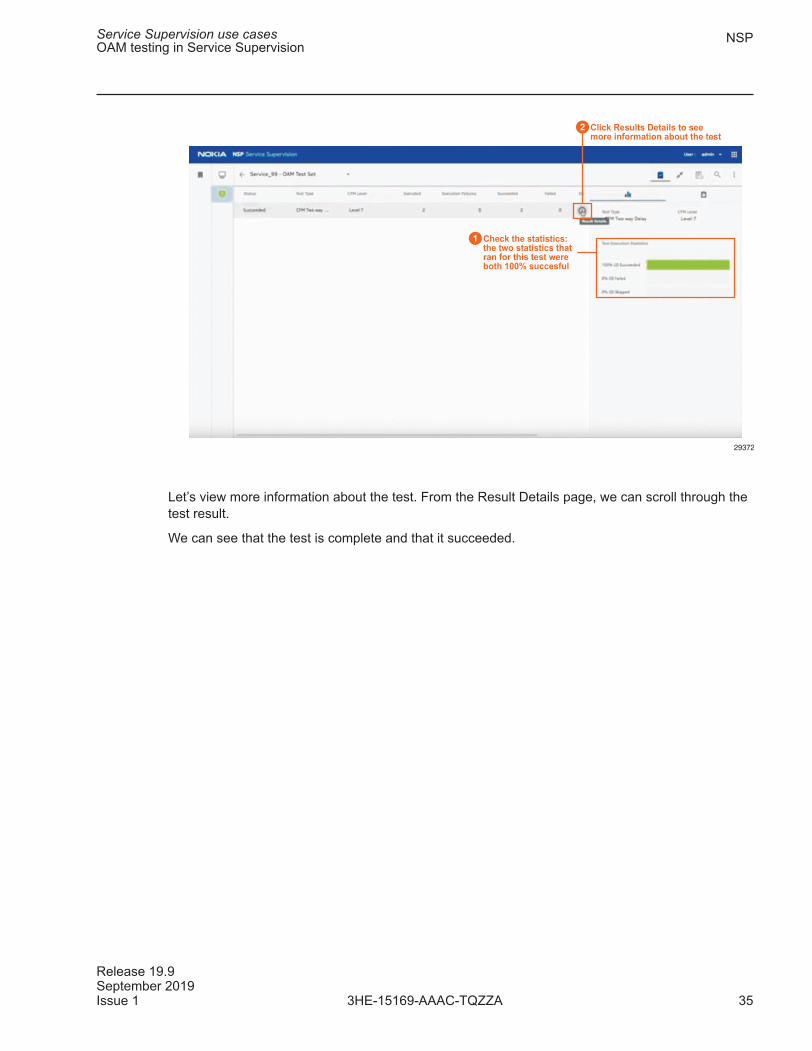
Let’s view more information about the test. From the Result Details page, we can scroll through the
test result.
We can see that the test is complete and that it succeeded.
1 Check the statistics:the two statistics thatran for this test wereboth 100% succesful
2 Click Results Details to seemore information about the test
29372
Service Supervision use casesOAM testing in Service Supervision
NSP
Release 19.9September 2019Issue 1 353HE-15169-AAAC-TQZZA
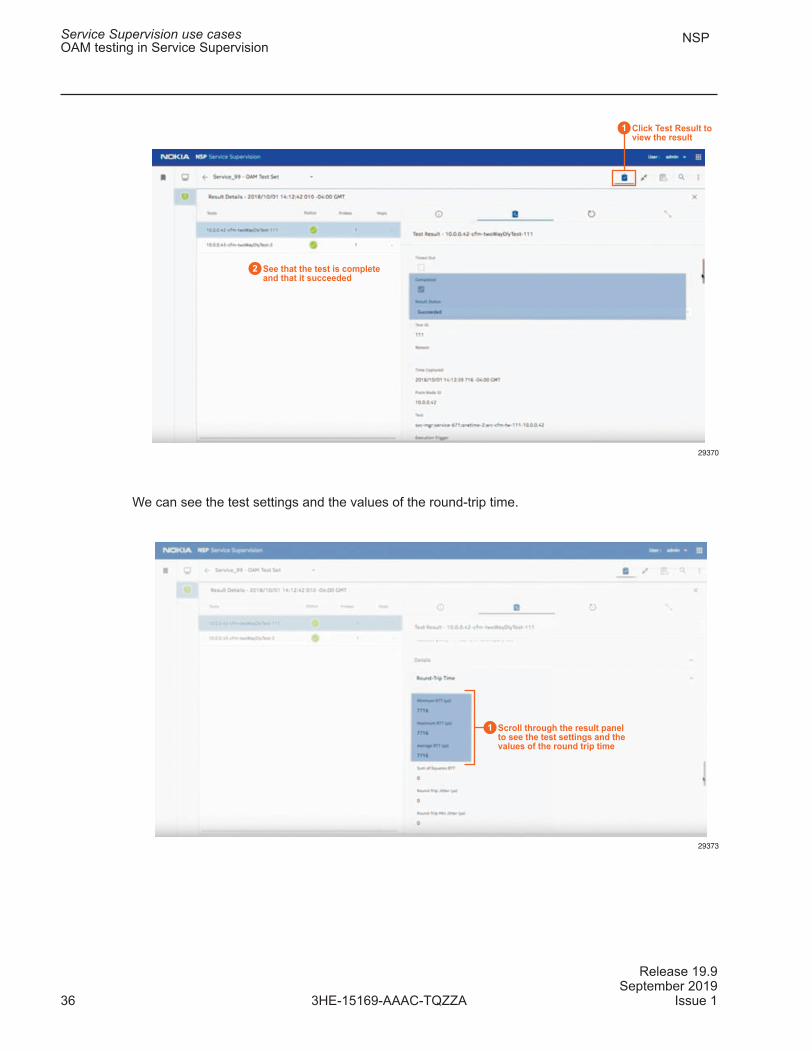
We can see the test settings and the values of the round-trip time.
1 Click Test Result toview the result
2 See that the test is completeand that it succeeded
29370
1 Scroll through the result panelto see the test settings and thevalues of the round trip time
29373
Service Supervision use casesOAM testing in Service Supervision
NSP
3HE-15169-AAAC-TQZZA
Release 19.9September 2019
36 Issue 1
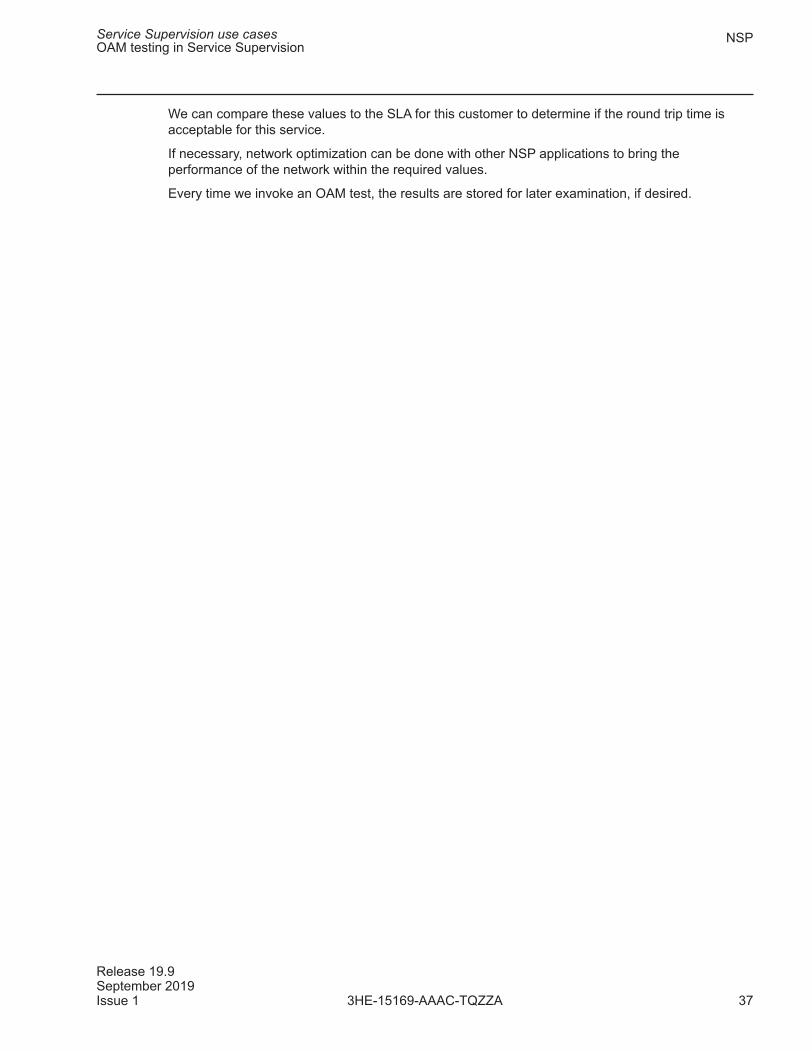
We can compare these values to the SLA for this customer to determine if the round trip time is
acceptable for this service.
If necessary, network optimization can be done with other NSP applications to bring the
performance of the network within the required values.
Every time we invoke an OAM test, the results are stored for later examination, if desired.
Service Supervision use casesOAM testing in Service Supervision
NSP
Release 19.9September 2019Issue 1 373HE-15169-AAAC-TQZZA

Service Supervision use casesOAM testing in Service Supervision
NSP
3HE-15169-AAAC-TQZZA
Release 19.9September 2019
38 Issue 1