Nsight Systems Introduction - Indico
60
Nsight Systems Introduction Holly Wilper - December 9, 2020
Transcript of Nsight Systems Introduction - Indico
Nsight Systems Introduction
Holly Wilper - December 9, 2020

2
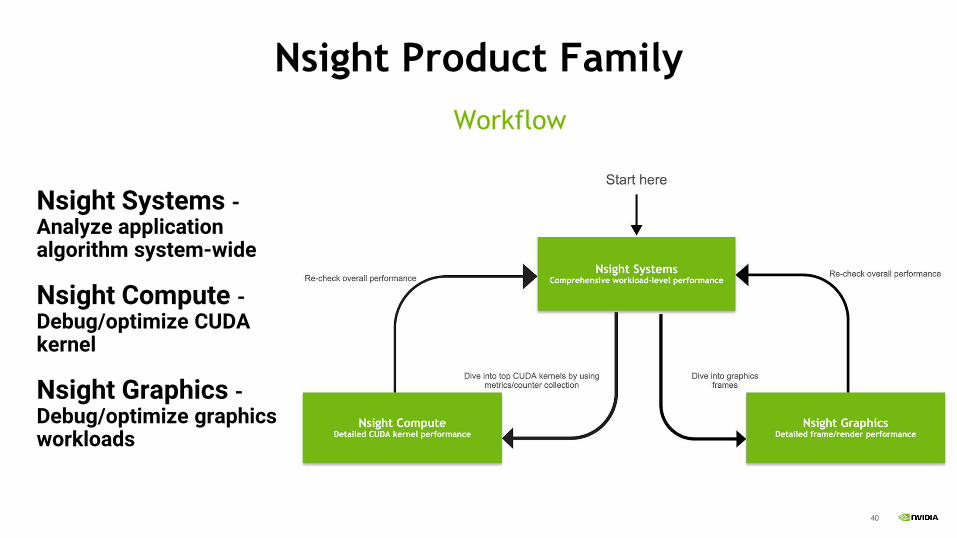
Nsight Product Family
Nsight Systems -Analyze application algorithm system-wide
Nsight Compute -Debug/optimize CUDA kernel
Nsight Graphics -Debug/optimize graphics workloads
Workflow
3
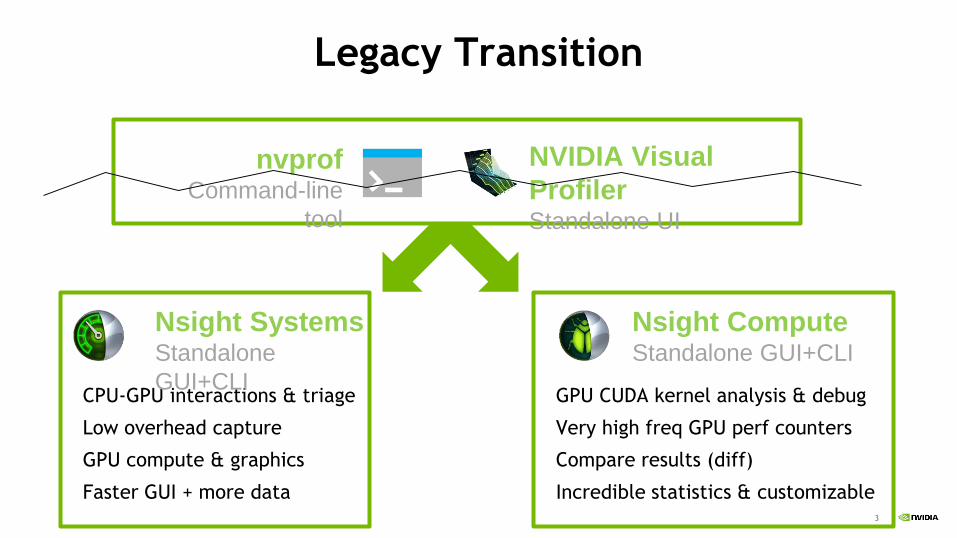
Legacy Transition
CPU-GPU interactions & triage
Low overhead capture
GPU compute & graphics
Faster GUI + more data
GPU CUDA kernel analysis & debug
Very high freq GPU perf counters
Compare results (diff)
Incredible statistics & customizable
NVIDIA Visual
ProfilerStandalone UI
nvprofCommand-line
tool
Nsight SystemsStandalone
GUI+CLI
Nsight ComputeStandalone GUI+CLI
4
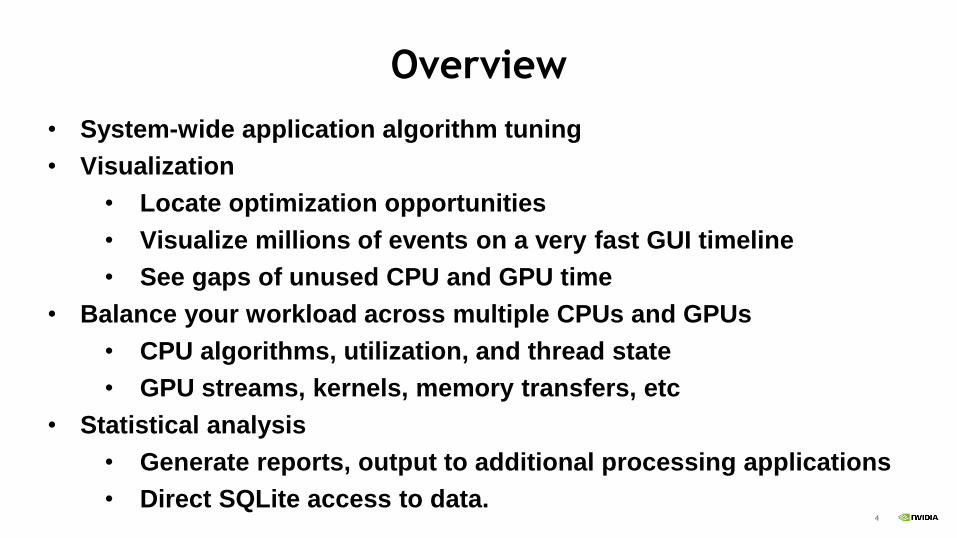
• System-wide application algorithm tuning
• Visualization
• Locate optimization opportunities
• Visualize millions of events on a very fast GUI timeline
• See gaps of unused CPU and GPU time
• Balance your workload across multiple CPUs and GPUs
• CPU algorithms, utilization, and thread state
• GPU streams, kernels, memory transfers, etc
• Statistical analysis
• Generate reports, output to additional processing applications
• Direct SQLite access to data.
Overview
5
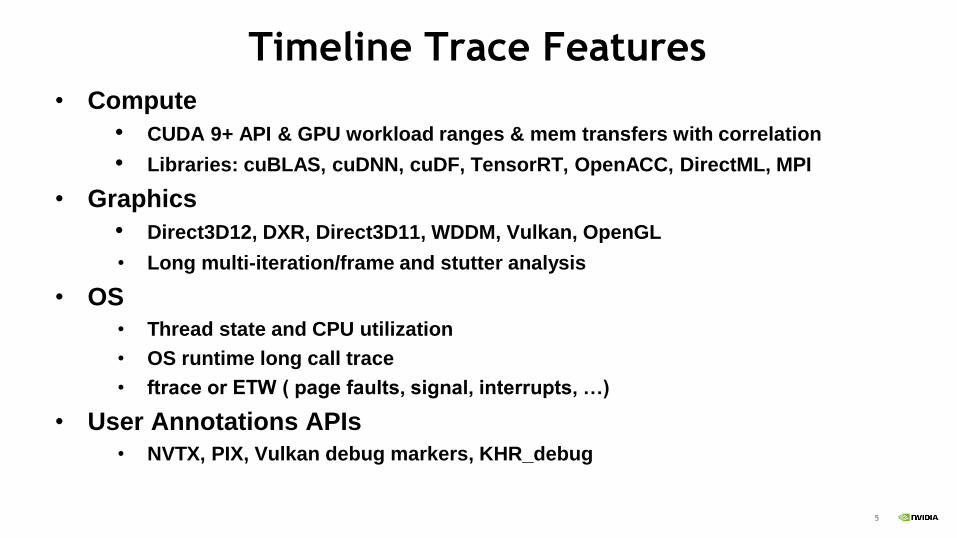
• Compute
• CUDA 9+ API & GPU workload ranges & mem transfers with correlation
• Libraries: cuBLAS, cuDNN, cuDF, TensorRT, OpenACC, DirectML, MPI
• Graphics
• Direct3D12, DXR, Direct3D11, WDDM, Vulkan, OpenGL
• Long multi-iteration/frame and stutter analysis
• OS
• Thread state and CPU utilization
• OS runtime long call trace
• ftrace or ETW ( page faults, signal, interrupts, …)
• User Annotations APIs
• NVTX, PIX, Vulkan debug markers, KHR_debug
Timeline Trace Features
6
• Thread call-stack periodic sampling
• Backtraces via hardware LBRs, frame pointers, or dwarf
unwind
• Hot functions
• Profiling start/stop using delay, duration, cudaProfilerStart/Stop
API, NVTX annotations, or hot keys.
• Command Line Interface (CLI)
• No host PC required to record
• Works in containers, VMs, and systems with access
limitations
• Scriptable / interactive modes
• Multiple profiling sessions can be run at once
• Multiple report segments available.
Other Key Features

7
Available Platforms
OS/Arch Host/GUI Localhost Target CLI
MacOS x
Windows x x x x
Linux x86 x x x x
Linux Power x x
Linux ARM
Server
x x
L4T/QNX for
Tegra
x x
Demo
Feature HighlightsCPU and General

10
Processes
and
threads
CUDA and
OpenGL API trace
Multi-GPU
Kernel and memory
transfer activities
cuDNN and
cuBLAS trace
Thread/core
migration
Thread state

11
User annotations APIs for CPU & GPUNVTX, OpenGL, Vulkan, and Direct3D performance markers
Example: Visual Molecular Dynamics (VMD) algorithms visualized with NVTX on CPU

12
NVTX Domains - Hoisting & Hierarchies Look like APIs and ‘/’ forms hierarchy

13
OS runtime trace (OSRT)Includes backtraces of long running functions

14
OS Runtime API Trace
Example:Mask-RCNN
Map/unmap hiccups
Mitigate by pipelining
● Map 1 batch ahead● Unmap last batch● Swap pointers here instead

15
Function table shows statistics from periodic call-stack backtraces

16Event Table

17
FTrace Example demonstrates interrupts
18
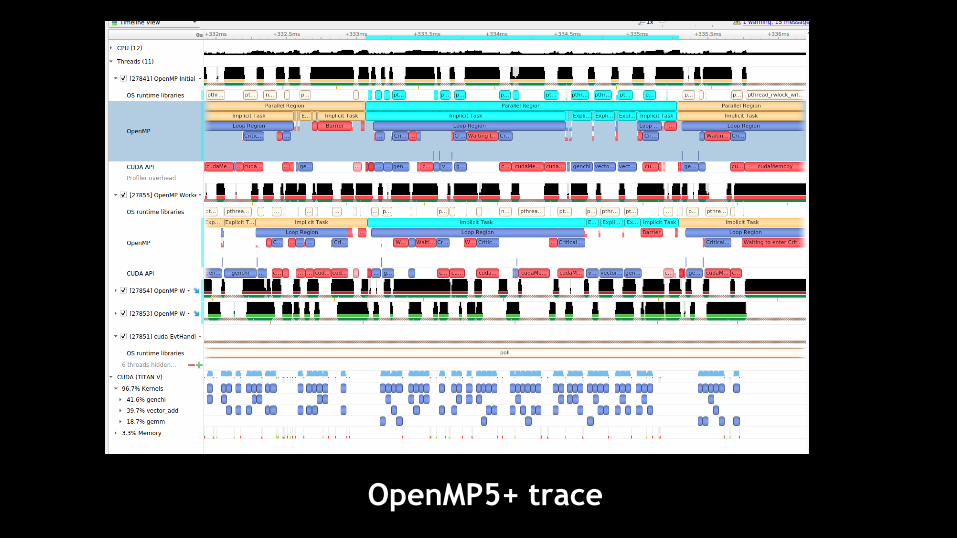
OpenMP5+ trace

19
MPI trace
20
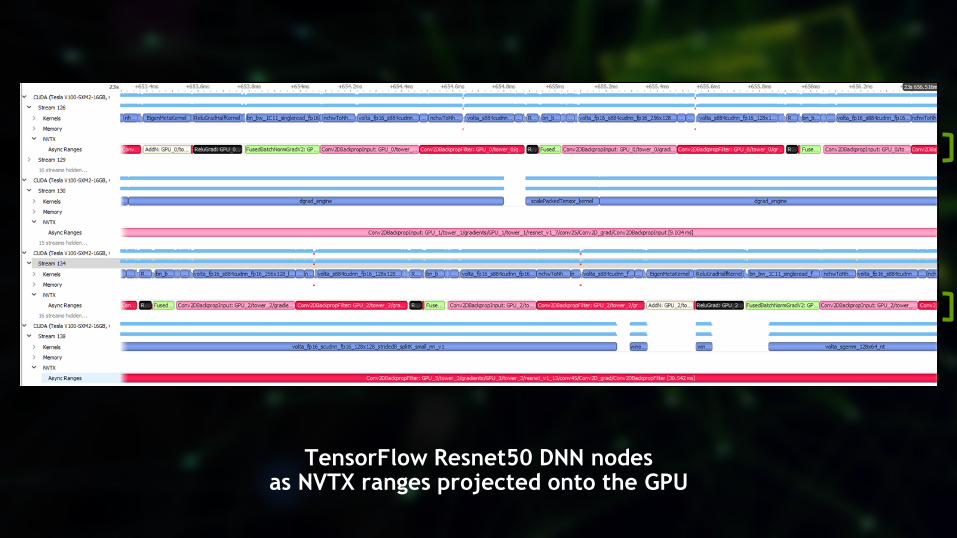
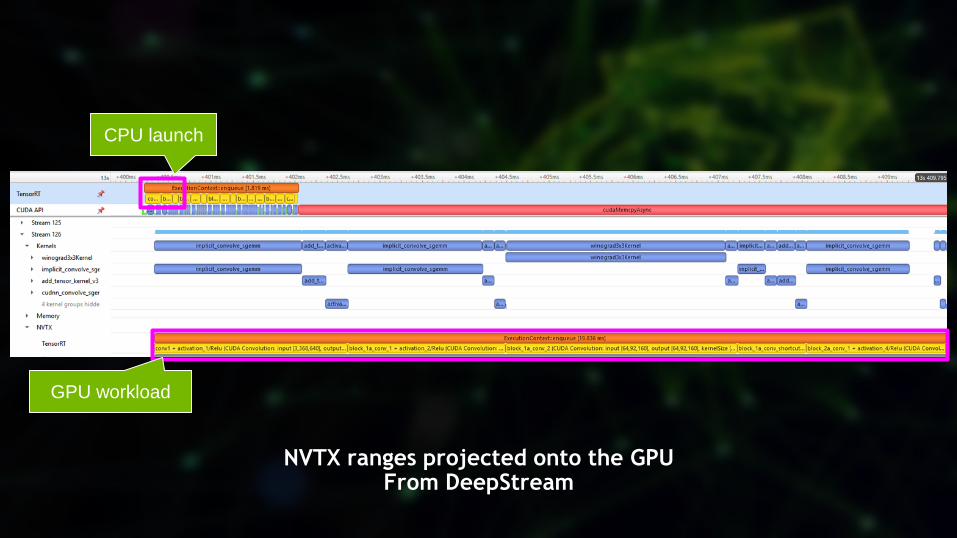
TensorFlow Resnet50 DNN nodes as NVTX ranges projected onto the GPU

Feature HighlightsCompute Applications
22
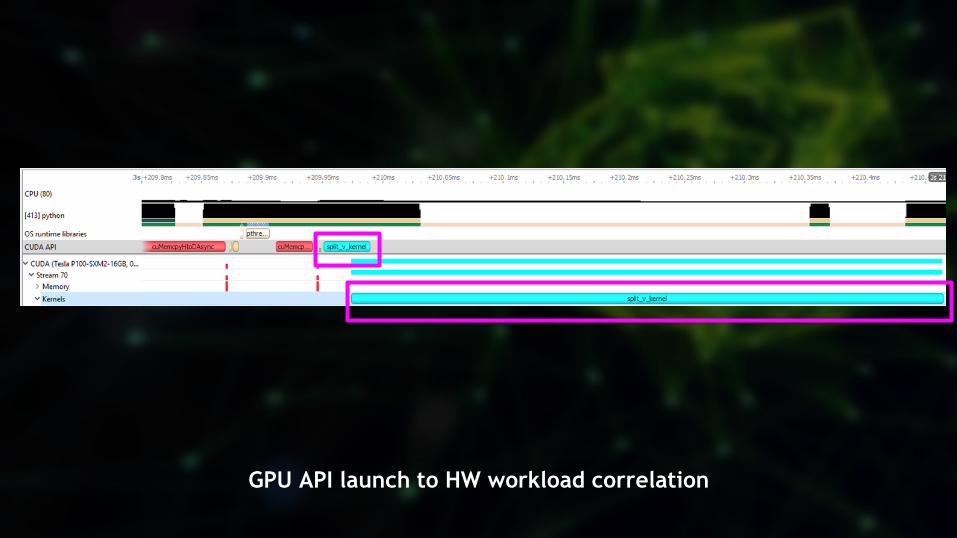
GPU API launch to HW workload correlation

Correlation Highlights in ruler Hidden to right
Hidden below
Hidden in
sub-row
Row has
highlights
CPU-GPU correlation & location assistance

24
CUDA graph launches show all related GPU rangesNVTX around nodes is also projected onto the GPU CUDA stream

25
cudaLaunchCooperativeKernelMultiDeviceFrom Caffe2 Resnet50 within a container on a DGX-2
CPU launch
Multi-GPU
workload

26
Zooming in reveals gaps where there were valleys
GPU utilization based on percentage time coverage

27
CUDA memory transfer color pallette show direction and pageable memory hazards

28
CUDA unified virtual memory (UVM) transfers

29
CUDA library trace such as cuDNN and cuBLAS

30
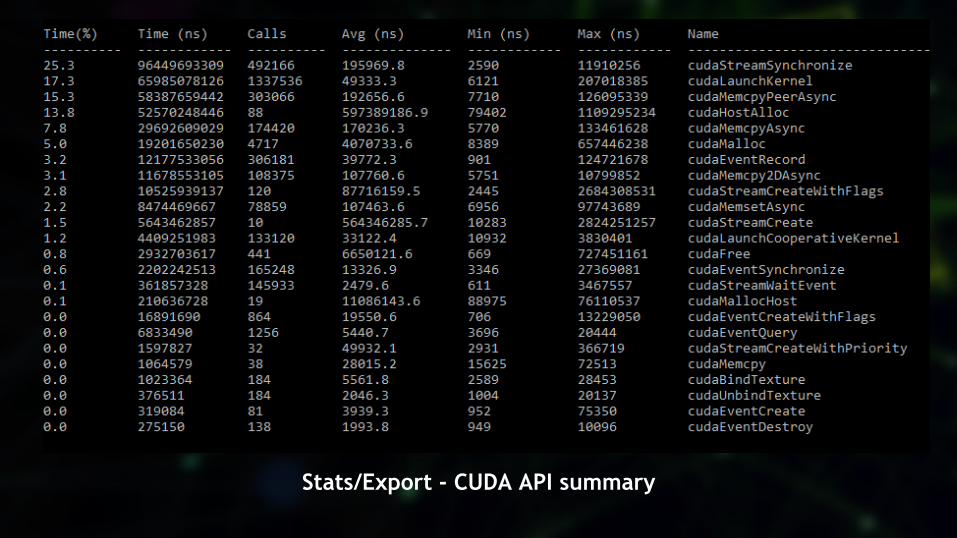
CLI statistics and export(SQLite & JSON)
31
Stats/Export - CUDA API summary
32
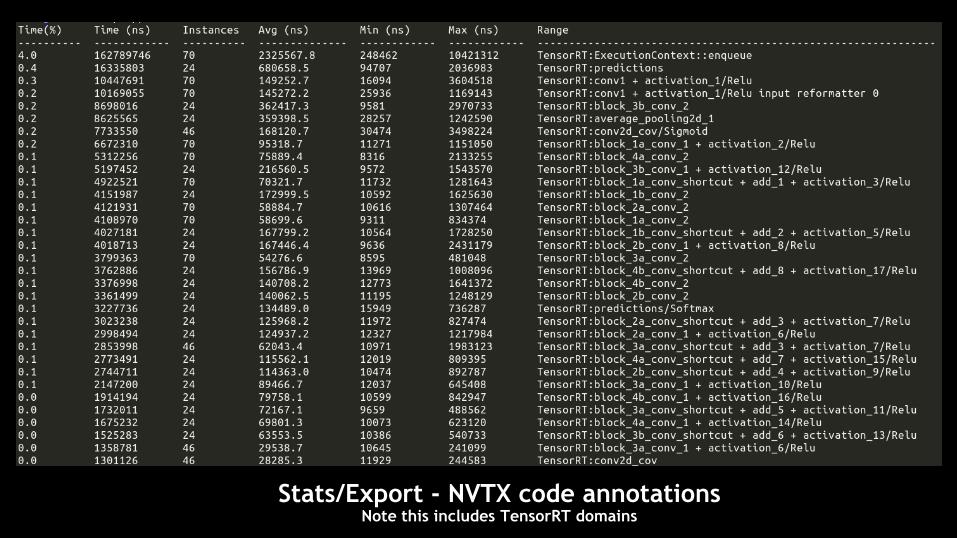
Stats/Export - NVTX code annotations Note this includes TensorRT domains

Spotting Common Issues

34
GPU idle and low utilization level of detail
35
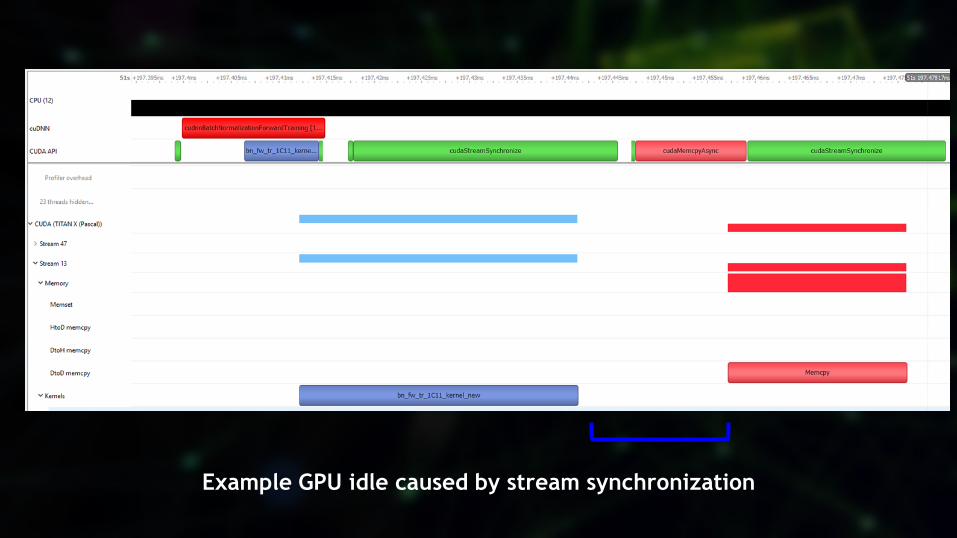
Example GPU idle caused by stream synchronization

36
cudaMemcpyAsync behaving synchronousDevice to host pageable memory
Mitigate with pinned memory
~150us
~1.2us

37
Fusion opportunitiesCPU launch cost + small GPU work size ≈ GPU sparse idle
This can apply to DNN nodes/layers
38
NVTX ranges projected onto the GPUFrom DeepStream
CPU launch
GPU workload

39
Windows DirectMLSee graphics applications for more related info
40
Nsight Product Family
Nsight Systems -Analyze application algorithm system-wide
Nsight Compute -Debug/optimize CUDA kernel
Nsight Graphics -Debug/optimize graphics workloads
Workflow
41
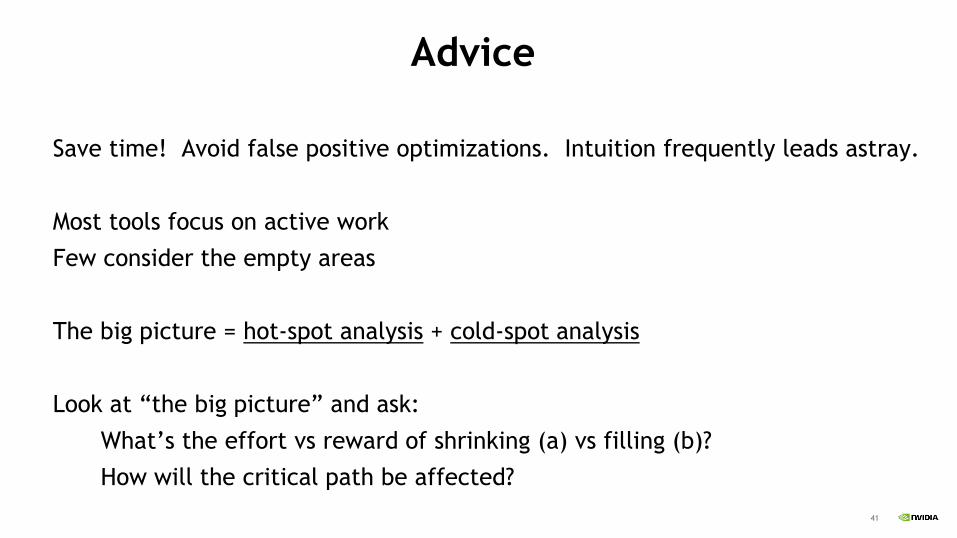
Advice
Save time! Avoid false positive optimizations. Intuition frequently leads astray.
Most tools focus on active work
Few consider the empty areas
The big picture = hot-spot analysis + cold-spot analysis
Look at “the big picture” and ask:
What’s the effort vs reward of shrinking (a) vs filling (b)?
How will the critical path be affected?

42
Download https://developer.nvidia.com/nsight-systems
NOTE: Website versions newer than CUDA Toolkit
Forums https://devtalk.nvidia.com
Email [email protected]
THANK YOU!
Backup
44
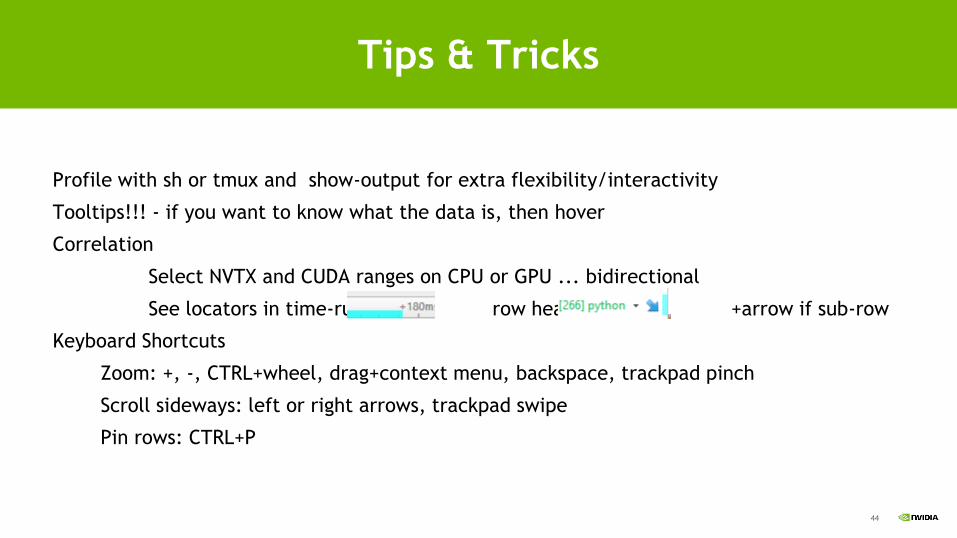
Tips & Tricks
Profile with sh or tmux and show-output for extra flexibility/interactivity
Tooltips!!! - if you want to know what the data is, then hover
Correlation
Select NVTX and CUDA ranges on CPU or GPU ... bidirectional
See locators in time-ruler, row header +arrow if sub-row
Keyboard Shortcuts
Zoom: +, -, CTRL+wheel, drag+context menu, backspace, trackpad pinch
Scroll sideways: left or right arrows, trackpad swipe
Pin rows: CTRL+P
45
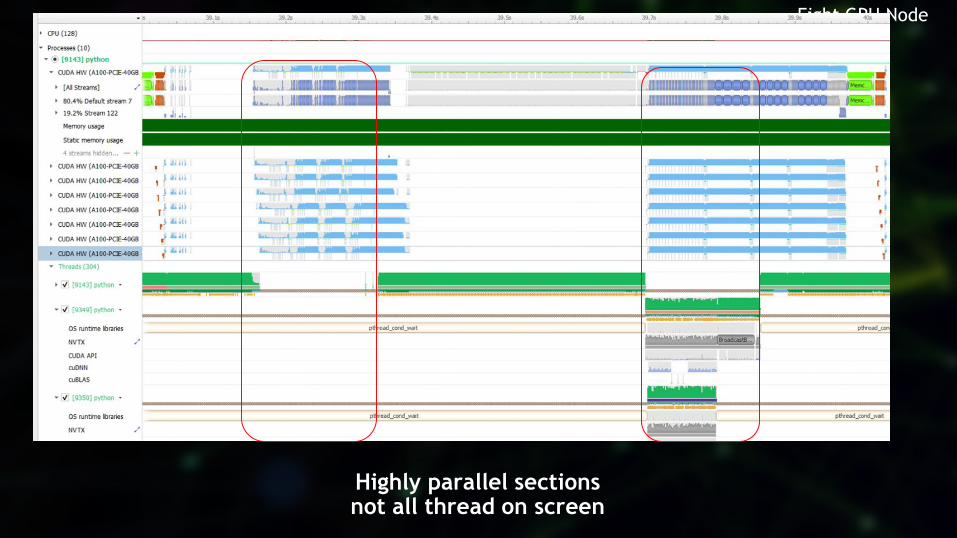
Highly parallel sectionsnot all thread on screen
Eight GPU Node

46
Overhead?
Yes, but can’t quantify with one number, as it depends on features and app behavior
We all know that even the OS systems such as perf, ftrace, ETW are not free
Each feature enabled == more data!
So nsys allows you to control it, and you could multi-pass
Sampling overhead is typically consistent
Trace overhead varies by how many events are generated, but is parallelized
Ex: NVTX (in our next release v2020.2 + always improving)
~180-190ns when recording
~25-30ns when launched but not recording range
Misc overheads for some features
Startup
Recording start or end
Periodic flush

47
Graphics Applications
48
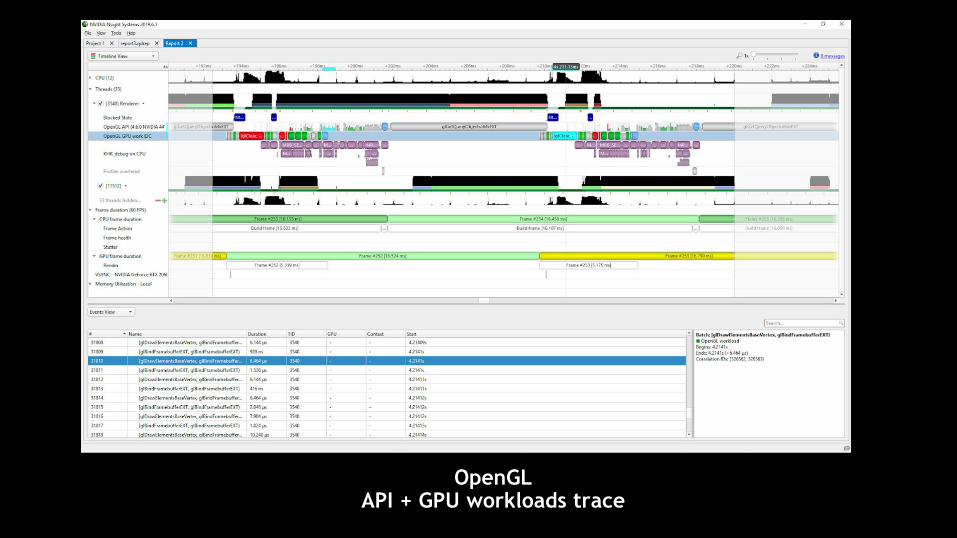
OpenGLAPI + GPU workloads trace

49
Vulkan API + GPU command buffer workload trace
Example: Quake2RTX on Linux

50
Vulkan Pipeline Creation Details
51
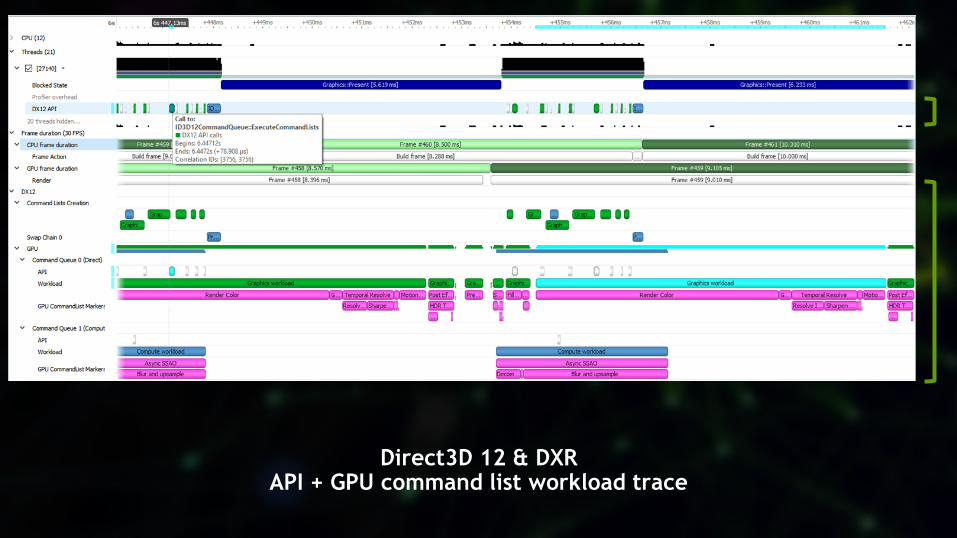
Direct3D 12 & DXRAPI + GPU command list workload trace
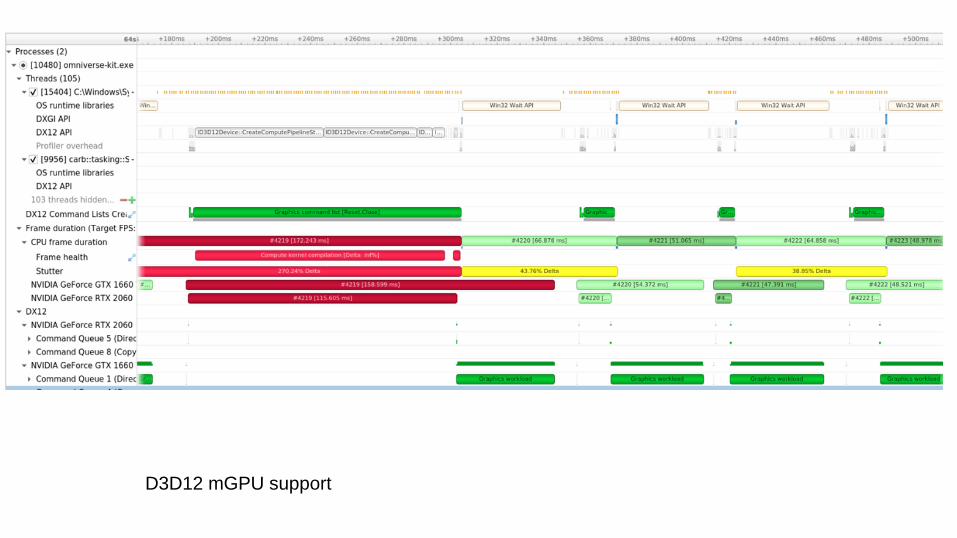
D3D12 mGPU support

D3D12 mGPU support

PIX marker times on the GPU
55
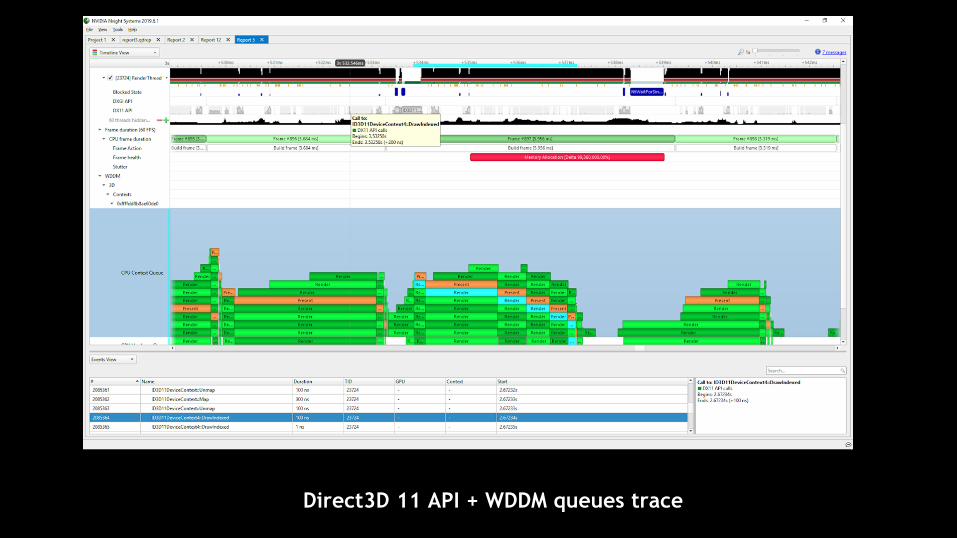
Direct3D 11 API + WDDM queues trace

56
A deeper understanding of what’s in your WDDM ranges

57
Frame timing for graphics APIs

58
Stutter analysis for graphics APIsLocal stutter and frame health
59
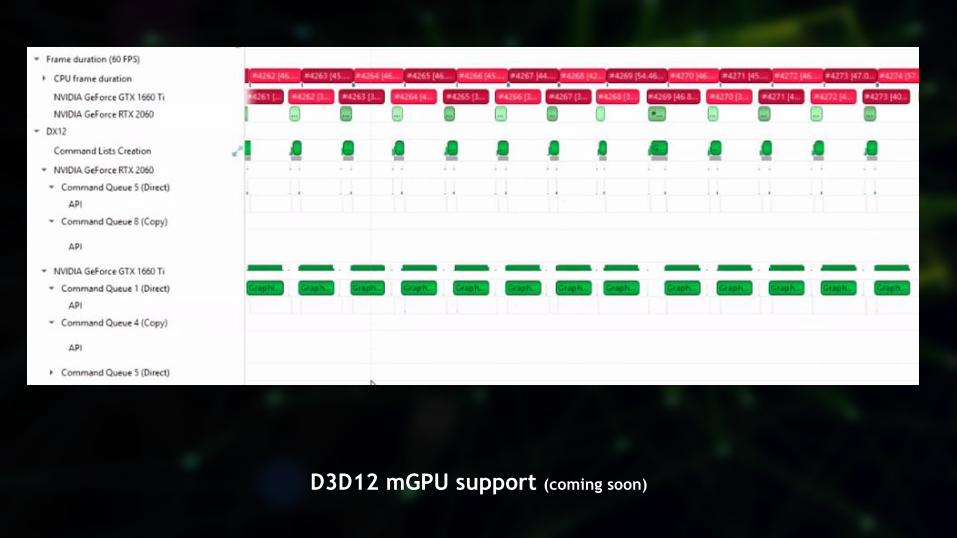
D3D12 mGPU support (coming soon)

60
OptiX trace