NSIAD-87-50 Government Contracting: Assessment of the … · · 2011-09-29GOVERNMENT CONTRACTING...
126
. , GA!0 -- ---~- United Sdates General Accounting Office /saYi * Report to Congressional Requesters December i 98i-r _ ---_--------~ GOVERNMENT CONTRACTING Assessment of the Study of Defense Contractor Profitability ----- 0317ci35 GAO/NSIAD-87-50
Transcript of NSIAD-87-50 Government Contracting: Assessment of the … · · 2011-09-29GOVERNMENT CONTRACTING...

. ,
GA!0 -- ---~-
United Sdates General Accounting Office /saYi *
Report to Congressional Requesters
December i 98i-r _ ---_ --------~
GOVERNMENT CONTRACTING
Assessment of the Study of Defense Contractor Profitability
----- 0317ci35 GAO/NSIAD-87-50


GA!!0 United States General Accounting Office Washington, D.C. 20548
National &curity and International Affairs Division
B-224639
December 23, 1986
The Honorable William V. Roth, Jr. Chairman, Committee on Governmental
Affairs United States Senate
The Honorable Jack Brooks Chairman, Committee on Government
Operations House of Representatives
This report was prepared at your request and addresses DOD'S Defense Financial and Investment Review (DFAIR). The report addresses the completeness, accuracy, and adequacy of DFAIR, the validating of its findings and the appropriateness of its recommendations
This report contains a recommendation in chapter 7 to the Congress concerning the estabhshment of a legislative requirement for a Profitability Reporting Program and periodic profit studies.
We are sending copies of this report to interested congressional committees and to the Secretary of Defense.
Frank C. Conahan Assrstant Comptroller General

Executive Summary
In August 1986, the Department of Defense (DOD) released its Defense Financial and Investment Review (DFAIR) report, which recommended changes in DOD'S policies concerning contractors’ profits.
The Chairman, Senate Committee on Governmental Affairs, requested that GAO evaluate the adequacy of the report, the validity of its findings, and the appropriateness of its recommendations. GAO also received a similar request from the Chairman, House Committee on Government Operations.
Bhkground DOD'S profit policy provides its contracting officers a structured approach to calculating prenegotiation profit objectives through weighted guidelmes. The profit objectives determined through weighted guidelines, coupled with the government’s estimate of contract cost, pro- duces the government’s “target” price used by the contracting officer m negotiating with a potential contractor.
Over the past 10 years, the Office of the Secretary of Defense and the military services have done ad hoc profit studies each using different methodologies. DOD'S Profit ‘76 study based its analyses on return on assets-income divided by assets (less progress payments and cash). The Air Forces’s Profit ‘82 study based its analyses primarily on return on sales and profit negotiation objectives. DFAIR based its analyses on return on assets-income divided by total assets (including progress payments but less cash). The use of inconsistent methodologies has been a major weakness in the ad hoc approach to reviewing profit.
Results in Brief GAO agrees with the DFAIR report that contract pricing, financing, and profit policies are related and should be examined on an integrated basis.
In its study, DFAIR used a methodology which permitted it to conclude that since 1970 the profitability of defense business was roughly com- parable to commercial business except for the time period 1980-83. GAO found that the use of conventional methodology results in the conclusion that during the entire period the profitability of defense business was substantially greater than commercial business.
DFAIR also concluded that a 1980 change to DOD profit policy resulted in a 0.6 to 1 percent unintended increase in profit objectives. GAO believes that the unintended increase was larger than 1 percent. Although DFAIH'S
Page2 GAO/NSIADW-6ODFAIR

Executlie Summary
recommended changes to the weighted guidelines were designed to do away with this unintended increase, GAO found that they would not. In fact, had the combination of all DFAIR recommendations been imple- mented, GAO estimates they would have produced profit objectives about 26 percent more than intended by DFAIR.
More importantly, while GAO does not take a position on what defense business profits should be, achieving rough comparability between defense and commercial business will require more than a 1 percent reduction m profit objectives because actual defense business profits have been substantially greater than those calculated by DFMR.
DOD recently established an interim profit policy which was based on DFAIR data and analysis. In GAO'S view, the interim policy will not achieve the appropriate profit reductions because it uses as a baseline the flawed data analyses contained m the DFAIR report.
Principal Findings
Comparative Profitability In calculating return on assets- the ratio of income to aSSetS-DFAIR increased the asset base by adding government progress payments to contractor inventories. In a separate action, DFAIR adjusted income by using a unique calculation of “economic profit.” These two actions reduced the apparent return on assets for defense business and led to an understatement of its profitability.
Based on this understatement, DFAIR concluded that profits on defense business were very similar to those of commercial manufacturers except during 1980433. GAO'S analysis of the DFAIR data-using conventional methodology-showed that defense contractors were 36 percent more profitable than commercial manufacturers during 1970-79 and 120 per- cent more profitable during 1980-83. In addition, GAO'S analysis of publi- tally available data indicates that defense business was substantially more profitable than comparable nondefense firms during the period 1976 to 1983.
.
DFAIR concluded that the defense sector has become more capitalized in the last 9 years. GAO analysis shows that defense contractor investment has increased during the period 1976 to 1983. However, when growth in
Page3 GAO/NSIAD87doDF~

Executive Summary
investment is measured by the increase m capital intensity as repre- sented by a capital to labor ratio, defense contractors’ rate of invest- ment growth lagged behind the rate for nondefense firms.
Weighted Guidelines Changes
To reduce negotiated profit ObJeCtiVeS by 0.6 to 1 percent, DFAIR recom- mended several changes in the weighted guidelines policy. Its analysis showed that the recommendations would reduce profit objectives from 12.3 to 11.6 percent of total cost.
GAO analyses of the same DOD data showed that the recommended changes would not reduce profit objectives. Using a broader data base and considering the effects of all the DFAIR recommendations, the profit objectives could range as high as 12.7 percent of total cost.
Contractor Financing Further, in evaluating contractor financing costs, DFAIR developed a “typical” contract model for a $10 million contract. From the model, it concluded that contractors historically incurred a cost equal to 2 percent of the total contract cost ($176,323 on the $10 million model contract) to finance their working capital requirements GAO questions the validity of this conclusion because historic data indicates that these cost are less than 2 percent.
The effect of related DFAIR recommendations, particularly the establish- ment of interim/milestone payments, would be to provide almost all of contractor working capital needs. But in addition to making interim/ milestone payments, DFAIR recommended that contractors receive 2 per- cent of contract cost as profit to cover working capital costs. As a result, based on DFAIR'S model contract with costs of $10 mllhon, a contractor would get $200,000 in profit as compensation for its working capital . financing costs when those costs had been substantially reduced by interim/milestone payments.
Stibsequent Profit Policy Proposals
DFAIR was issued in August 1986. The September 18, 1986, Federal Reg- lster contained a new DOD proposed profit policy to become effective January 1,1987.
On November 14, 1986, DOD published a new interim policy retroactively effective for all solicitations issued on or after October 18, 1986. The interim policy- like the policy proposed in September 1986-1s designed to reduce profit ObJectives to bring defense profitability into
Page4 GAO/NSIAD-S7-IODFAIR
Executive Summary
line with comparable durable goods manufacturers. The DOD briefing that accompanied the announcement of the initial policy stated that this reduction would cause profit objectives to go from 12.3 percent to 11.3 percent. However, subsequent DOD analyses shows that average DOD profit objectives were about 13.7 percent in 1986. Therefore a 1 percent reduction would result in profit objectives of 12.7 percent-not 11.3 percent.
ProfItability Reporting The DFAIH report is based on data that was submitted voluntarily by con- tractors, was reviewed by the contractor’s public accounting firms (app.VII) but not by the government, and was not retained after being summarized by Touche Ross and Company. A Profitability Reporting Program that provides verifiable data would improve the credibility of future profit studies and policy changes. Such a program would require a central authority, appointed by the President, to implement and administer the program, act as a repository for the data, and periodi- cally conduct profit studies on a consistent basis.
, Recommendations GAO recommends that the Secretary of Defense
l initiate, on an expedited basis, new analyses using conventional methods to evaluate profitability;
l based on these analyses make appropriate modifications as soon as pos- sible to the interim profit policy; and
9 develop a means to show, in contract negotiations, the effect of govern- ment contract financing (for example, rate of progress payments, pay- ment frequency, speed of payment, etc.) and the use of interim/ milestone payments on contractors’ return on assets.
. GAO also recommends that the Congress establish a legislative require- ment for a Profitability Reportmg Program and periodic profit studies which should help assure fair and reasonable profit in the negotiation of government contracts.
Agrency Comments DOD generally disagreed with all of GAO'S findings, conclusions, and rec- ommendations concerning DFAIR. DOD was particularly concerned that GAO'S report did not discuss actions taken by DOD subsequent to the DFAIR report.
GAO'S recommendations have been modified to recognize these actions.
Page 5 GAO/NSlADS7-50 DFAIR

contents
ktter 1
Executive Summary
Chapter 1 Introduction
Chapter 2
DOD’s Current Profit Policy Objectives, Scope, and Methodology
The DFAIR Study DFAIR Recognized That Contractor Investment in
Provides a Good IBasis Working Capital Contract Financing and Profit Policy Were Related
18
for Profit Policy Evaluation
ROA Was Used to Compare Profitability Reporting and Evaluating Government Contractor
Profitabihty Can and Should Be Done on a Recurring Basis
Other DFAIR Recommendations
19 19
20
Chapter 3 22
DFAIR Understated the DFAIR’s Calculation of ROA Understated Profitability of 22
Piofitability of Defense Defense Contracting Our Analysis Shows Higher Contractor Profitability 31
Cqntracting Navy Study Indicated Higher Contractor Profitability 36 Conclusions 37
Chapter 4 DkAIR Recommendations to Reduce Lkintended Increases in Profit Negotiation Objectives Will Not Meet That Goal
DFAIR Assumed Low Profit Objectives Would Be Used- History Proves Otherwise
40 . 41
Related Recommendation Was Not Considered DFAIR’s Recommended Profit Policy Is Complex and
Sensitive to Changes in Input Variables DFAIR Did Not Clearly Relate Profit Policy to Contractor
Profitability Conclusions
42 43
44
46
Page 6 GAO/NSlAD437-60 DFAIR

Chapter 5 46
DFAIR’s Historic Data Dispute DFAIR’s Estimate of Contractor 46
Recommendations Financing Needs Contract Model Did Not Consider Related 47
Could Overcompensate Recommendations
Contractors for Conclusions 60
Financing Costs
Chapter 6 62
Defense Contractor Conclusions 64
Investment and Efficiency
Chapter 7 Conclusions, Conclusions
Recommendations, and Recommendation to the Congress
Agency Comments Recommendations to the Secretary of Defense Agency Comments
Appendixes Appendix I: Comments From the Assistant Secretary of Defense and Our Response
Appendix II: Request Letter Dated April 3, 1984, From the Chairman, Senate Committee on Governmental Affairs
Appendix III: Request Letter Dated September 17, 1986, From the Chairman, House Committee on Government Operations
Appendix IV: Economic Analysis-Profitability Appendix V: Defense Contractor Investment Appendix VI: Touche Ross and Company Return on
Assets Analyses Appendix VII: Touche Ross and Company Data
Verification Appendix VIII: Deputy Secretary of Defense, May 27,
1986, Memorandum: Findings, Recommendations, and Decisions
Appendix IX. GAO Comments on the September 18,1986, Proposed DOD Profit Policy
66 66 68 68 68
60
79
81
.
82 93
102
103
106
116
Page 7 GAO/NSIAD-S7-50 DFAIR

Tables Table 3.1: DFAIR’s ROA Process (Step 1) Table 3.2: DFAIR’s ROA Process (Step 2) Table 3.3: Touche Ross and Company’s Calculation of
ROA for 1976-1983 Table 3.4: DFAIR’s ROA Process by Time Period (Step 2) Table 3.6: DFAIR’s ROA Process by Time Per-rod (Step 4) Table 3.6: DFAIR’s ROA Process by Time Period (Step 6) Table 3.7: Effect of DFAIR Assumptions and Methodology
for 1986 in Millions of Dollars Table 3.8: Our Comparison of Firm Level/Overall
Profitability (1976-1983) Table 3.9: Our Werghted Average Comparison of Overall
Profitability (1976-1983) Table 3.10: Comparison of Firm Level Profitability (1976-
79) Table 3.11. Our Comparison of Segment Level
Profitability (1979-1984) Table 3.12: Risk Measures for Defense Firms Versus
Commercial Firms Table 3.13: Comparison of Profitability Considering Tax
Effect (1976-1983) Table 3 14: Navy Study ROA Results for 1984 Table 3.16: ROA Table 4.1: DFAIR Methodology Effect on Labor Profit
Negotiation Factor Table 4.2: Comparison of DFAIR and Our Estimates of
Recommended Profit Policy Results Table 4.3: Firm Fixed-Price Contracts as a Percent of
Total Prime Contract Awards Table 6.1: Effect of DFAIR’s Proposed Profit Policy
Changes on Its Typical Contract Model Table 6.1: Capital/Labor Ratios Table 6.2: Capital/Labor Ratios for Defense Firms Table 6.3: Capital/Sales Ratios Table IV. 1: Rates of Return for Commercial and Defense
Firms Table IV.2: Profitability Results (1976-83) (Weighted
Average by Firm Size) Table IV.3: Profitability Results-With and Without Tax
Deferrals Table IV.4: Profitability as a Percentage of Total Sales
27 28 28
28 29 29 30
33
33
33
34
36
36
36 37 41
43
44
63 64 64 86
87
88
89
Page 8 GAO/NSIAD-8750 DFAIR

Content8
Table IV.6: Profitability at the Segment Level for 84 Defense Firms (1979-1984)
Table IV.6: LMI Risk Measures (Standard Deviation) Table IV.7: Risk Measures (Standard Deviation) Table IV.8: Relative Profitability of Defense Versus
Commercial Firms Table V. 1: Facilities Capital Employed/ Sales (DFAIR
Study) Table V.2: LMI’s Facilities Capital Employed/Sales Table V-3: Capital/Labor Ratios (1976-1983) Table V.4: Capital/Labor Ratios for Defense Firms Table V-6: Capital/Sales Ratios for 1976-1983 Table VI. 1: Exhibit VI-7 Operating Profit to Total Assets
(Assets Reduced by Progress Payments) Table VI.2: Exhibit VI-2 Operating Profit to Total Assets
(Assets Not Reduced by Progress Payments) Table VIII 1: Profit on Facilities Capital Employed
89
90 90 91
96
96 100 100 101 102
102
112
Abbreviations
DFAIR Defense Financial and Investment Review DOD Department of Defense GAO General Accounting Office Lhll Logistics Management Institute QFR Quarterly Financial Report ROA return on assets ROE return on equity ROS return on sales
Page 9 GAO/NSIAD8750 DFAIR

Chapter 1
htroduction
The Department of Defense (DOD) made its Defense Financial and Invest- ment Review (DFAIR) to (1) determine if contract pricing, financing, and profit policies provided for effective and efficient spending of public funds and the viability of the defense industrial base and (2) make rec- ommendations for improvements The DFAIR report was released m August 1986.
The decade between the last similar study-Profit ‘76-and the DFAIR
study was one of change, and DFAIR was to evaluate DOD profit policy and the defense industry in light of those changes. Smce Profit ‘76, DOD’S
policy has undergone several changes: adjustments to the profit policy, development of a policy covering contractor investment incentives, changes in progress payment policy, and various changes in cost allowa- bility rules. Shifts in the economic environment have also affected the defense contracting and commercial manufacturing segments of the economy. Rapid inflation and high interest rates affected all segments of the economy in the late 1970s. The defense industry has benefited from an increase in defense outlays while, according to the DFAIR report, com- mercial manufacturers have experienced a severe recession.
To evaluate the effect of those changes on its profit policies, DFAIR ana- lyzed data submitted voluntarily by 76 contractors, the DOD Form 1499’ data base, and the Quarterly Financial Reports developed by the Com- merce Department’s Bureau of the Census. Outside studies done by Touche Ross and Company, the Logistics Management Institute, and the Conference Board were used as well. DFAIR also conducted opinion surveys of contractors and DOD procurement personnel.
From its evaluation DFAIR concluded that, in general, the current con- tract pricing, financing, and markup policies are balanced economically, are protecting the interests of the taxpayer, and are enabling U.S. I
industry to achieve an equitable return for its involvement in defense business
MD’s Current Profit Policy
lines-a method of computing a profit objective A profit objective is the part of the estimated contract price that, m the contracting officer’s judgment, is an appropriate profit for use in the negotiation process. Because of the give and take of the negotiation process, the amount of
‘The DOD Form 1499, Report of Individual Contract Profit Plan, is prepared for negotiated contrac- tual actions with cost and profit that together amount to at least $600,000
Page 10 GAO/NSIAD437-50 DFAIR

chapter 1 Introduction
profit negotiated for a contract generally falls between the computed profit objective and the amount initially requested by the contractor. DFAIR shows that the profit negotiated tracks closely with the profit objective.
A profit objective has historically been based on estimated cost. How- ever, in 1976 Defense Procurement Circular 76-3 made a major revision to the profit policy and the method of calculating profit. Profit on facility capital employed-a measure of investment-was introduced into the weighted guidelines method of computing a profit objective. At that time, DOD believed that adding investment to the calculation of a profit objective would help remove disincentives for contractor facility investments and would reduce reliance on cost as a basis for estimating profit. It was felt that facility capital investments by contractors would, m turn, reduce production costs and thus reduce the overall cost to the government. At the same time that DOD was revising its policy to include profit on investment, it already was giving additional profit for cost risk and was recognizing cost of money as an allowable cost.
Under the current weighted guidelines method, a profit objective is determined for several factors, including (1) estimated cost, (2) cost risk, (3) facility capital investment, and (4) cost of money. The sum of the profit objectives for these factors plus special profit factors which vary by contract, represents the overall profit objective for a contract.
One of DOD’S primary goals in revising its profit policy in 1976 was to reduce emphasis on cost as a profit determinant and at the same time increase the incentive for investment in facilities by rewarding contrac- tors who made such investments. To ensure that overall profits would not increase, DOD developed an offset factor to be applied to the profit objective based on estimated contract cost. The sum of individual profit objectives for estimated cost is multiplied by 0.7 (the 30percent offset factor) to arrive at the reduced profit objective on estimated cost. This reduction of profit on estimated cost, plus the deletion of profit on past performance,2 was intended to offset (1) the increased profit for risk, (2) newly recognized profit on facility capital investment, and (3) the recog- nition of cost of money as an allowable element of the cost of capital.
2Ekfore rewsmg the profit policy under Defense Procurement Circular 76-3 a profit obJectwe exwted for past performance Historically it had represented a relatively small pomon of overall profit ObJec- twes Under Defense Procurement Circular 76-3 ths profit obJective was deleted
Page 11 GAO/NSIAD47-5O DPAIR

~--- Chapter 1 Introduction
In February 1980, under Defense Acquisition Circular 76-23, DOD revised its profit policy It provided new weighted guidelines for labor-intensive research and development and service contracts. Adjustments were made for profit on risk, and the profit range for facility capital employed was increased from 6 to 10 percent to 16 to 20 percent on manufacturing contracts, This change more than doubled profit for con- tractors’ facility capital employed on manufacturing contracts but nothing was done to reduce the profit objective based on cost. The overall effect was a substantial increase in manufacturing contract profit objectives and, ultimately, an unintended increase in negotiated profits.
Based on its study, DFAIR concluded that the implementation of Defense Acquisition Circular 76-23 had resulted in a 0.6 to 1 percent unintended increase in overall contract profit objectives. The conclusion that profit objectives were higher than intended is consistent with the findings of our March 14, 1986, report3
Objectives, Scope, and The Chairman, Senate Committee on Governmental Affairs, requested
Methodology us to evaluate the adequacy of the DFAIR study, the validity of its fmd- ings, and the appropriateness of its recommendations, (See app. II ) The Chairman, aware that a comprehensive review of defense contract pay- ment and profit policies had not been made since 1976, expressed a belief that the DFAIR study would greatly affect DOD’S future contract financing policies. We also received a similar request from the Chairman of the House Committee on Government Operations. (See app. III.)
We began our review in August 1986 and completed field work in March 1986. The DFAIR report was released in August 1986. On May 27,1986, the Deputy Secretary of Defense issued a memorandum that adopted b many of the DFAIR recommendations. We sent a draft of this report to DOD for its review and comment on July 24, 1986. Subsequent to that date, DOD issued two profit policy proposals. The first was published in the September 18, 1986, Federal Register and was to be effective on Jan- uary 1,1987. We provided comments to that proposal on November 14, 1986. (See appendix IX.) On November 14,1986, DOD published a new interim policy retroactively effective to all solicitations issued on or after October 18, 1986.
3Cost Accountmg Standard 414-1~ Relationship to DOD Profit Pohcy (GAO/NSIAD-86-66, Mar 14, 1986)
Page 12 GAO/NSIAD-S7UODFAIR

\ .
Chapter 1 Introduction
Economic Issues Although we did not have access to the segment4 data gathered from 76 contractors and developed for DFAIR by Touche Ross and Company, we did have access to the summary data. The raw data was submitted to Touche Ross and Company on a voluntary basis, by 76 of the 126 con- tractors surveyed. The primary reason why the remaining contractors did not submit data was concern over the time and cost involved in pre- paring their responses. To protect the confidentiality of the data, Touche Ross and Company returned the raw data to the contractors at the end of the study. We initially requested access to the raw data but we decided not to pursue this request in order to encourage contractor participation in the DFAIR study. Although we would have preferred access to the raw data so that it could be verified, we were satisfied that the Touche Ross data was useful and valuable after comparing the results of analyses based on the Touche Ross data to the results of anal- yses based on other data sources.
Due to the nature of the data available publicly, our analyses are dif- ferent from the DFAIR analyses. We were forced to use different data bases over different time periods. Although the results of our analyses using publicly available data are not exactly the same as our analyses using the aggregated Touche Ross data, the trends shown by both kinds of analyses are similar and support our overall conclusions.
Our analyses of economic issues are based on the Touche Ross aggre- gated data and financial data obtained from the COMPUSTAT data base at the company level and segment level (the defense and nondefense segments of defense firms). The financial data from COMPUSTAT are taken from audited financial reports incorporated in company annual reports and Form 10K reports filed with the Securities Exchange Com- mission. Although we performed some computer checks of the data we did not verify the accuracy of the computerized data, provided by COM- PUSTAT by comparing them to the original source documents. Our COM- PUSTAT analysis at the company level included 84 defense firms and 228 commercial firms.
.
For various measures of profitability, we compared our samples of defense and nondefense firms for the period 1975-1983. In a further
4The Cost Accountmg Standards Board defuntlon of segment rs “Segment One of two or more divl- sions, product departments, plants or other subdivisions of an orgamzation reporting directly to a home office, usually identified with responslblllty for profit and/or producing a product or service The term includes Government-owned contractoroperated facihties, and Jomt ventures and subside- anes (domestic and foreign) m which the organmatron has a mqority ownership The term also mcludes those Joint ventures and subsidiarres (domestic and foreign) m which the organization has less than a maJonty of ownership, but over which it exercises control ”
Page 13 GAO/NSJAD47-60 DFAIR

-- chapter 1 Introduction
attempt to determine the influence of defense business on profitability, we also stratified the defense firms we selected by the percentage of total sales attributed to defense. We used six measures of return
. Net income return on assets (RQA). l Net income return on stockholders’ equity (ROE). l Net income return on sales (ROS). . Cash flow ROA. l Cash flow return on stockholders’ equity. 9 Market return6
We measured the RQA and ROE at the firm level, with and without adjust- ments for the effect of tax deferrals. We evaluated the R06 and ROA for the defense and nondefense segments of the 84 defense firms in our sample, and evaluated the risk of defense business compared with that of commercial manufacturing. We also evaluated the relative levels of investment of defense firms and nondefense firms for the period 1975 1983 (See chs. 3 and 6 and apps. IV and V.)
Wkighted Guidelines Policy We examined the proposed changes to the DOD profit policy and to the weighted guidelines used to implement that policy, to obtain a thorough understanding of the changes and their effect on defense contract prof- itability. For reporting purposes, DFAIR included cost of money in negoti- ated profits. We also treated cost of money as though it were part of profit. Our review included an examination of profit objectives as reported in the DOD Form 1499 data system, not negotiated profit or realized profit.
We used the same DOD Form 1499 (Report of Individual Contract Profit Plan) data files used by DFAIR to support its conclusion that the profit . policy alternatives it suggested would reduce contractor profits. We included in our analysis shipbuilding industry contracts which are a part of the available data files. As discussed in chapter 4, DFAIR treated shipbuilding separately. The data files we reviewed included prenegotia- tion profit ObJectives and cost of money for about 6,600 Army, Navy, and Air Force contract actions from 1981 through 1983. The data files also included approximately 6,200 nonshipbuildmg contracts and about
“Market return 19 the stock pnce at the end of the year nunus the stock pnce at the beguuung of the year plus any dividends ptud dunng the year This quantity B then diwded by the stock pnce of the beginrung of the year to get a percentage of return
Page 14 GAO/NSIAD-S7-60 DFAlR

Chapter 1 Introduction
260 shipbuilding contracts with a total estimated cost of $61 billion and $12 billion, respectively.
We reviewed the DFAIR analysis of the DOD Form 1499 data to determine how DFAIR used the data to estimate the effect of its proposed profit policy changes on contractor profits We followed the DFAIR methodology and converted the historical DOD Form 1499 data to the proposed weighted guidelines format. We computed weighted average profit rates and applied these rates to the proposed profit (weight) ranges. We also analyzed data by kind of contract (e.g; manufacturing, research and development, and service contracts) and by type of contract (e.g., firm fixed price, fixed-price incentive, etc ).
To make our analysis comparable to DFAIR'S analysis, we analyzed the data using the DFAIR assumptions, including
l the distribution of facility capital to land, buildings, and equipment of 8, 34, and 68 percent, respectively;
l the lengths of contracts of 40 months for manufacturing, 24 months for research and development, and 12 months for service contracts;
. over-target cost-sharing ratios of SO/SO for fixed-price incentive con- tracts and 90/10 for cost-plus-incentive-fee contracts; and
l a progress payment rate of 86 percent and a prime interest rate of 10.8 percent.
In certain instances, we varied these assumed factors to determine their effect, if any, on projected defense contractor profits.
We reviewed reports and documents relative to the current profit policy as implemented by Defense Procurement Circulars 76-3 and 76-12 and Defense Acquisition Circular 76-23.
Contract Financing Issues The objectives of this segment of our review were to (1) test and vah- date the DFAIR conclusions regarding contract financing and its effect on profitability and (2) determine the appropriateness of DFAIR'S recommendations.
We included in our review data from previous DOD profit reviews, DOD regulations and policies on contract financing, aggregated data obtained by DFAIR from defense contractors, and the models and methodology used by DFAIR to develop its conclusions and recommendations.
Page 15 GAO/NSlAD-87-SO DFMR

chapter 1 Introduction
-
We did a review of the DFAIR report chapter on contract financing and interviewed the chapter’s authors in an effort to obtain an under- standing of the chapter and the data used in the chapter. We visited the headquarters of a defense contractor that was a source for data used in the DFAIR study and obtained similar data and an explanation of the methods used to develop the data. We also obtained, from the Defense Contract Audit Agency, contract financing data on the defense contrac- tors that provided these data for the DFAIR study.
Using the DFAIR contract financing model, methodology, and assumptions concerning contractor costs for capital invested in a defense contract, we tested the validity of DFAIR'S conclusions and the results of its recom- mended changes to contract financing policies. (See ch. 6.)
Page16 GAO/NSL4D475ODFAIR

Page 17 GAO/NSIAD-S7-50 DFMR

Chapter 2 -
The DFAIR Study Provides a Good Basis for Profit Policy Evaluation
Several aspects of the DFAIR study are valuable for evaluating DOD profit policy.
. The study recognized the interrelationship among contractor investment in working capital, contract financing, and profit policy.
. It relied on ROA'S to measure comparative profitability. 9 It showed that relevant financial data on defense business could be
gathered from a contractor’s segment or division level.
DFAIR Recognized That Contractor Investment in Working Capital Contract F$nancing and Profit Policy Were Related
DFAIR'S discussion of contractors’ contract financing costs recognized the relationship among the contractors’ investment in working capital, DOD contract financing policies in terms of progress payment rates, payment policy in general, interest rates, and DOD'S profit negotiation policy. Although DFAIR'S assessment of profit policy and its relationship to short-term assets-working capital-is valuable, we believe DFAIR'S methodology is deficient in that it does not directly link changes in DOD’s
profit policy to the contractors’ profitability as measured by ROA.
As discussed in chapter 6, DFAIR developed a model of a “typical” con- tract to use in calculating contractors’ contract financing costs for working capital. This model included a calculation of the contract costs in excess of the assumed progress payment rate, the amount of interest the contractor would have to pay if it were required to bear all those costs, and the effect of payment delays and cost float? on contractor financing costs. From this model, DFAIR concluded that contractors his- torically incurred a cost equal to approximately 2 percent of the total contract cost to finance a government contract.
To address this contract financing cost, DFAIR recommended establishing a profit negotiation factor based on the progress payment rate, the b length of the contract, and the prime interest rate. Thus, DFAIR linked contractor investment in working capital, contract financing policies (i.e., progress payment rate), interest rates, and DOD'S contract profit policy. We believe it is important to note, however, that contract financing costs could be reimbursed through an increase in the progress payment rate rather than through an additional profit factor.
As discussed in the next section, although DFAIR evaluates contractor profit, DFMR does not directly link DOD'S contract profit policy to con- tractor profitability as measured by RCA.
‘Cost float-the term “float” refers to the delay m transfer of value from the payer to the payee
Page 18 GAO/NSJAD-S'I-SODFAIR

Chapter 2 The DFAIR Study ProvIdeo a Good Ba& for Rant Policy Evaluation
ROA Was Used to DFAIR determined that return on capital and ROE were not practical meas-
Compare Profitability ures of the profitability of defense contractors’ business segments, It concluded that the remaining option, RQA, would provide an appropriate comparison of defense contractor and commercial manufacturer profit- ability at the segment level. We agree. However, as discussed in chapter 3, we disagree with DFMR'S calculation of “economic” profit as well as with its calculation of the RQA base.
We agree with DFAIR'S choice of RQA as its measure of profitability at the segment level. We also agree that ROE is a useful measure at the firm level. But since DFAIR'S analyses are at the segment level, and it is very difficult to determine the amount of equity to assign to each segment, we believe it is not practical to use ROE at this level of analysis.
ROS is another alternative. However, Rot3 is a measure that is based on output, not input or how effectively a firm invests its capital. A rate of ROS is less likely to be related to a return on an investor’s capital but more to the products being sold, or the specific industry. Thus, an Ro6 comparison across industries is of questionable value. Because our objective is to measure profitability as it relates to a firm’s investment in its business, RQA appears to be the measure that best meets that objective.
I
Reporting and In chapters 3 and 7 of this report we point out the need for periodic
Eva/uating profit reporting by government contractors. We believe the reporting of verifiable, auditable data is fundamental to meaningful profit studies.
Government We also believe that the contractor response rate to DFAIR'S request for
Contractor data-76 responses from the 126 contractors surveyed-demonstrated
Profitability Can and that the data needed to analyze the profitability of government contrac- tors can be obtained on a regular basis. The length of time separating .
Should Be Done on a major studies, the voluntary participation of contractors, and the incon-
Recurring Basis sistent analytical methodology applied to contractor data by DOD'S most recent study, highlight the need for a more structured and more accountable system of determining the effect of government profit policy. We believe DFAIR should be the last agency directed ad hoc attempt to evaluate profitability of voluntarily participating govern- ment contractors. Future studies should be done as a result of legislation that establishes a mandatory government contractor profit reporting program. The studies must be done on a consistent basis and in such a fashion that the results are fully creditable to the Congress, the execu- tive branch, and the public. We believe, as a minimum, the statutory program should require:
Page 19 GAO/NSIAD-!37-6O DFAIR

Chapter 2 The DFAIR Study Provides a Good J&&I for Front Policy Evaluation
. major government contractors report annually, by segment, auditable and verifiable data needed to analyze profitability and some elements of efficiency;
. an Office of Profit Studies and Analysis designated by the President, develop regulations to implement and administer the profitability reporting program;
. the Office of Profit Studies and Analysis develop adequate safeguards for the data provided by contractors to prevent unauthorized disclosure of proprietary and confidential information;
. the Office of Profit Studies and Analysis or its representatives, must have the expertise needed to perform studies of the data provided annu- ally by the contractors; and
. every 3 years, using data covering at least a 3-year period, the Office of Profit Studies and Analysis prepares reports so as not to disclose indi- vidual company, but aggregated data to demonstrate the general profit- ability of government contractors. The reports should include, but not be limited to (1) calculations of profitability using the ROA of the busi- ness segments comprising the reporting universe, (2) profitability com- parisons between types of government business and other business as well as a comparison with the general line profitability of other compa- nies in the private sector for similar goods and services, and (3) an anal- ysis of whether variations between levels of profitability are reasonable under the circumstances and an evaluation of whether profit policy is motivating cost efficiency and investment.
The legislation establishing the profitability reportmg program should include authorization for the Office of Profit Studies and Analysis and the Comptroller General to access all papers, documents, and records of the agency used in conducting the study, and of the company and its certified independent public accountant used in providing the annual data report. Our draft report, GAO/NSIAD 87-462 provides the framework A for, and proposed legislation to implement, a mandatory profit reporting program. The report is currently out for comment.
Other DFAIR Recommendations
There are a number of recommendations in the DFAIR report that appear to be independent of the profitability analysis done in the DFAIR study. It appears possible to implement these recommendations without explicit approval of the DFAIR study or adapting the remainder of the profit
2Govemment Contractmg A Proposal For a Program to Study the Profitablllty of Government Con- tracts (GAO/N&W 87-46, November 1986).
Page 20 GAO/NSIAD-S750 DFAIR

Chapter 2 The DFAIR Study Providem a Qood Bulr for Profit Polky Evaluation
policy recommended by DFAIR. We did not analyze these recommenda- tions, and therefore, we have no comment on them. They are
l Making the progress payment rate for foreign military sales contracts conform to the rate of other DOD prime contracts. DFAIR stated there is little evidence that indicates current profit policy is preventing adequate foreign military sales profits.
. Continuing the efforts to motivate contractor productivity on an extra contractual, plant-wide basis. DFAIR determined that the industrial mod- ernization incentives program is moving in the right direction and should continue to receive top management support.
. DFAIR recommended that DOD better define critical needs of the subcon- tracting base and provide productivity enhancing incentives directly to critical subcontractors and ensure that prime contractors are doing so.
. Strengthen the DOD Form 1499 reporting system. DFAIR found the DOD Form 1499 reports to be invaluable in doing its study and believes they are vital as a management tool. However, DFAIR encountered maJor reporting system weaknesses during its study and said it expended a great deal of effort to ensure the data base provided a reliable basis for comparison.
. Report actual results achieved under DOD contracts. DFAIR concluded that profit studies like DFAIR can be successful only if access to actual con- tractor results are available.
9 The Navy’s profit policy should be consistent with DFAIR'S proposed overall DOD profit policy. DFAIR believes shipbuilding contracts should be priced on the same basis as other contracts, and with the adoption of its recommendations, DFAIR believes there ~111 no longer be a need for the unique shipbuilding contract pricing approach.
Page 2 1 GAO/NSIAD437-50 DFAIR

DFAlR Understated the Profitability of Defense Contracting
Because DFAIR'S methods of asset valuation and profit calculation were not consistent with conventional accounting and finance methods, it understated the profitability of defense contracting. While we agree with DFAIR’s decision to use the ROA-the ratio of operating profit to total assets-to measure profitability at the segment level, we do not agree with the assumptions and methodology used to calculate ROA. DFAIR made two significant assumptions m its calculations which dra- matically reduced defense contracting’s apparent RoA:
1. It included in the contractor’s asset base the amount of inventory con- sidered to belong to the government through progress payments.
2. It developed its own defmition of profit called “economic profit.”
By making the ad,mstments referred to above, DFAIR concludes that defense contracting’s profits were very similar to those of commercial business except for the “abnormal” period of 1980-83. DFAIR stated that, in general, the current contract pricing, financing, and mark-up policies are balanced economically, are protecting the interests of the taxpayer, and are enabling US. industry to achieve an equitable return for its involvement in defense industry.
We disagree with DFAIR’S conclusion. Our analysis of DFAIR’S data showed that defense contracting was 35 percent more profitable than commer- cial manufacturing from 1970 to 1979, and 120 percent more profitable from 1980 to 1983.
DFAIR’s Calculation of As discussed in chapter 2, DFAIR decided to use ROA to compare the prof-
RDA Understated itability of defense contracting to that of commercial manufacturing We agree with that decision, however, we disagree with DFAIR’S treatment of b
Profitability of Defense progress payments and with its definition of economic profit. We also
Contracting believe the imputed interest factor DFAIR added to its economic profit was inadequate and does not fully represent the benefits contractors get from the interest free financing provided through progress payments. These items cause DFAIR’S calculation of defense contracting’s ROA to be understated which leads to an inaccurate conclusion regarding defense contracting’s profitability.
Page 22 GAO/NSLUM7-60 DFAIR

Chapter 8 DFAIB Understated the PmfltabiUty of Defense Contracting
Progress Payments Were Included in Asset Base
Assuming that progress payments are a form of financing and should be treated as a liability, DFAIR added the payments to the amount contrac- tors showed as total assets. This procedure is inconsistent with conven- tional financial analysis, generally accepted accounting practices, government contract provision, and the Profit ‘76 study, which all indi- cate that progress payments should be subtracted from assets to deter- mine the asset base in making any RQA calculation.
Conventional Financial Analysis In conventional financial analysis, RClA is considered a measure of man- agement’s efficiency in using the company’s capital. To measure this efficiency, the company’s operating income is divided by the assets the company owns.
When DFAIR increased contractors’ assets by the cost of inventories which are applicable to government progress payments, it increased the amount of assets used in the ROA calculation which reduced defense con- tracting’s apparent ROA. Understating RQA results is an inaccurate indica- tion of a company’s profitability and management efficiency.
DFAIR contended that to compare the profitability of defense contracting with that of commercial manufacturing, an adjustment must be made to consider the effect of progress payments. DFAIR increased the asset base and partially offset this with an increase to income. DFAIR failed to rec- ognize that conventional financial analysis and generally accepted accounting practices have already made the necessary adjustment - reducing inventory by progress payments This is especially important because progress payments equal about 66 percent of defense contractor assets, but about only 4 percent of nondefense firms’ assets.
Gekm&~y Accepted Accounting ,
Data available through the American Institute of Certified Public Accountants shows that a commonly accepted practice for accounting for progress payments is to show them as reducing inventories. The financial statements of the contractors participating in the DFAIR study-available through the Institute’s National Accounting Research System-showed that none of the 36 firms whose accounting treatment could be identified increased their inventories by government progress payments as DFAIR did.
Page 23 GAO/NSIAD-87-SO DFAIR
chapter a DFAIB Undemtated the Profltabillty of Defeme Contracting
For long-term contracts, contractors set up profit centers to which they charge costs and expected revenues. This can be done through a combi- nation of accounts receivable and inventory accounts. Progress pay- ments are then charged against those accounts-reducing their balance. The contractor is exchanging one asset for another. It generally exchanges inventory for the cash paid in the progress payment,
Therefore, the preferred treatment of progress payments is not to show them as liabilities, as DFAIR would, but as reimbursements to the con- tractor for expenses incurred. These reimbursements would offset inventories and accounts receivable and show contractors’ total asset figures at appropriate levels.
DFAIR cites the Bureau of Census Quarterly Financial Report (QFR) as one reason for including progress payments in the assets of the contractor They correctly point out, that the QFR treats progress payments as con- tractor liabilities. The Commerce Department acknowledged that this treatment of assets was not consistent with generally accepted financial reporting. However, the reason for such different treatment was clear. The Bureau of Economic Analysis needs to know the total level of inven- tories in the United States at any given time. According to a Bureau offi- cial, if reported inventories were reduced by the amount of inventory transferred to the government through progress payments, those trans- ferred inventories would be lost to the view of the Bureau. Therefore, so that the Bureau can track all inventories for its overall national produc- tivity analysis, the normal fmancial reporting rules are changed and contractors are directed to include, for QFR reporting, progress payments as liabilities. However, we believe that this treatment of progress pay- ments for a specific national statistical analysis should not affect the method of calculating financial rates of return for individual companies.
Government Contract Provision As stated earlier, data from the American Institute of Certified Public Accountants showed that none of the 36 firms whose accounting treat- ment could be identified increased their inventories by government progress payments as DFAIR did. The reason usually cited for this prac- tice is that government contracts provide that upon the contractor’s receipt of progress payments, title to inventories associated with such payments is vested in the United States government. Section 52.23216 of the Federal Acquisition Regulation requires that fixed price contracts contain a clause which gives the government title to property, including inventories, associated with the progress payments.
Page 24 GAO/NSIAD-87-50 DFAIR

Chapter 3 DFAIR Understated the Pmfitability of Defense Contracthg
DFAIR’S methodology ignored this contractor practice and calculated ROA using assets that were no longer regarded as belonging to the contrac- tors. Such practice is the consequence of government required contract provisions concerning progress payments,
Previous DOD Study DFAIR’S treatment of progress payments is not consistent with the prog- ress payment treatment of DOD’S previous profit study-Profit ‘76. Profit ‘76 subtracted progress payments from assets to calculate the denominator of its ROA equation. In the Profit ‘76 ROA calculations, the denominator consisted of total assets minus cash minus progress pay- ments, DFAIR did not subtract progress payments from total assets.
We believe DFAIR should have treated progress payments in a manner consistent with the Profit ‘76 treatment. We see no rationale that sup- ports the very significant change made in DFAIR. The lack of consistent methodology in DOD’s profit studies points out the need for regular, recurring studies done on a consistent basis using generally accepted methodology.
Economic Profit In addition to including progress payments m the asset base, DFAIR devel- oped a measure it called “economic profit” that reduced the apparent profitability of both defense busmess and commercial manufacturing. It calculated “economic profit” by subtracting the following items from commercial and defense sales figures.
l Allowable costs. . Unallowable costs-other than interest. . Imputed interest on fixed assets. . Imputed interest on working capital.’
DFAIR substituted imputed interest for actual interest. It calculated the imputed interest on fixed assets by multiplying the average net book value of fixed assets by the interest rate developed by the Treasury for Cost Accounting Standard 414 purposes. It calculated the imputed interest on working capital by multiplying the average gross value of inventories and accounts receivable by the short-term commercial loan rate.
‘DIJAIR defines working capital as the average gross value of mventones and accounts receivable
Page 25 GAO/NSIADS7-50 DFAIR

Chapter 3 DFAIR Undemtnted the Profitability of Defense Contracting
DFAIR’S calculation of economic profits introduces a new set of numbers based on a rarely used concept, without producing any significant change in the relationship between defense and nondefense profits. While economic profit may be valuable from a theoretical standpoint, given the data available, DFAIR’S calculation of economic profit introduces arbitrary assumptions that are unnecessary. A proper calcu- lation of economic profit would vary with each firm as that firm’s debt/ equity ratio, and therefore its cost of capital varies. DFAIR did not con- sider this in their calculation.
In a calculation of economic profit, the normal rate of return necessary to attract capital into that industry is subtracted as a cost Therefore, it is expected that the results of the economic profit calculation will iW?I%@? zero for all firms. A positive result-DFAIR calculated 4.73 per- cent for defense contracting in 1980~83-indicates that firms are making more than is necessary to attract capital. The negative result DFAIR calculated for durable goods manufacturers-a mmus 3.65 percent for 1980~83-indicates that during 1980-83 these firms did not make a return that was adequate to sustain their busmess. Because DFAIR’S cal- culation of economic profit merely reduces the level, not the disparity between defense contracting’s and durable goods’ profits, we believe that it adds no new information to the profitability comparison and con- fuses more than it clarifies. We believe that since accounting data is available, is regularly used in ROA calculations, and is not dependent on DFAIR’S multiple assumptions, then accounting data should be used in profitability analyses that compare the profits of defense contracting and durable goods manufacturing.
DFAIR’S “economic profit” also subtracts unallowable costs from profit. While this may be appropriate for analyses that simply compare ROA for defense business and commercial manufacturmg, we believe it is inap- b propriate for a comparison that is intended to establish DOD profit policy. By calculating R~A after subtracting out unallowable costs, DFAIII would establish a profit policy that will allow defense contractors to be paid profit on costs which are unallowable. This overriding of public policy is accomplished by the use of DFAIR’S unique “economic profit” to determine comparable profitabihty. This would put DOD m the position of subsidizing contractors’ unallowable cost by providing profits m excess of those necessary to provide a comparable profit when only allowable costs are incurred.
Page 26 GAO/NSIAD87-50 DFAIR

L - -_ -
Chapter 8 DFAIR Undemtated the PmfltabiUty of Defelue Contracting
DFAIR’s Process for Adjusting ROA
DFAIR went through a five step process to convert conventional ROAS to the ROA DFAIR used m its analysis. The information on conventional ROAS was provided to DFAIR by Touche Ross and Company and is contained in appendix I to the DFAIR study. As shown in this section, DFAIR'S five step process included its adjustments for progress payments and economic profit.
Starting Point:
step 1.
The voluntary data collected from 76 defense contractors by Touche Ross and Company showed that defense contracting has an ROA (oper- ating profit to assets net of progress payments) of 22.6 percent. The QFR data shows commercial manufacturing had an ROA of 12.9 percent. This was the average for the 9 year period 1976 to 1983
DFAIR added 6 years to the comparison by including the data developed for the Profit ‘76 study. As shown in table 3.1, and in exhibit 14 of chapter 6 of DFAIR, this reduced the average ROA (over 14 years) for defense contractmg to 20.6 percent, and increased the ROA for commer- cial manufacturing to 13.3 percent. Since the DFAIR study’s objective was to evaluate profit policy in the time period after Profit ‘76, we do not believe it was appropriate to include this data in the DFAIR analyses. Including the earlier data obscures the effect of profit policy and eco- nomic changes since the Profit ‘76 study.
Table 3 1: DFAIR’o ROA Process (Step 1) Figures In percent --
Touche 8 Ross
DFAIR (ides Result ----~-
Defense contracting 22 6 -2 1 20 5 -____ Commercbal manufactunna 129 +04 133
step 2 DFAIR'S methodology included progress payments as a form of financing for defense contractors. DFAIR increased total assets by the amount of the progress payments (i.e., progress payments are not netted against inventories). To complete the logic of the assumption, DFAIR attempted to adjust for the increase in the asset base by adding an imputed interest factor to the operating profit. This factor was calculated by multiplying the amount of the progress payments by the short-term commercial loan rate. The result was to dramatically raise the denominator (assets), moderately raise the numerator (operating profits), and, as shown in table 3.2, significantly lower the R~A ratio.
Page 27 GAO/NSIAD-87-50 DFAIB

Chapter 3 DPAIR Understated the Profltabiltty of Defense Contracting
Table 3.2: DFAIR’s ROA Procerr (Step 2) Figures In percent _. -_---.-. ---_ -- ----.
Result After Effect of - (step one) (step Two) Result
Defense contracting 20 5 -41. - 164 --~ ~-~. Commercial manufactunng 133 . 133
The data Touche Ross provided to DFXIR-shown in table 3.3-isolates the effect of adding progress payments back into assets before the ear- lier 6 years of data from Profit ‘76 is included in the sample. Our anal- ysis of that data shows that by adding progress payments into assets DFAIR cuts defense contracting’s ROA by 66 percent while commercial manufacturing’s ROA is cut by only 4 percent.
Tatjle 3.3: Touche Ross and Company’s Calculation of ROA for 1975-l 983 Figures In percent - ___.---_
Defen8e -- Commercial contracting manufacturing _----~
Progress payments treated normally 22 6 129 --~ DFAIR treatment of progress payments 100 124
Re$ult of Step 2 by Time Period Table 3.4 shows the results of DFAIR'S step 2 on the data related to the periods 1970-79 and 1980-83.
Table 3.4: DFAIR’s ROA Process by Time Period (Step 2) Figures In percent - --.- _.-_--_---- -___---
Defense contracting
Commercial manufacturing
~- ---- .-- Total
1970-79 1980-83 1970-1983 -.- _--- - -. ~ 152 194 164
143 107 133 b
step 3. DFAIR then developed the “economic profit” and substituted it for oper- ating profit in the ROA comparisons. It calculated economic profit by sub- tracting four items from the annual sales figures reported through Touche Ross and Company.
l Allowable cost l Unallowables other than interest l DFAIR’S imputed interest on fixed assets l DFAIR’S imputed interest on working capital
Page 28 GAO/NSlAD47-60 DFAIR

Chapter 3 DFAIB Undermtded the ProfWabUtty of Defenee cOntmctlng
step 4: DFAIR then substituted economic profit for operating profit in its RoA cal- culation DFAIR added an imputed interest factor to the economic profit to compensate for the larger asset base-this parallels step 2. DFAIk then computed the ratio of economic profit to assets.
Result of Step 4 by Tnne Period The result of step 4 was to reduce defense contracting’s R&I for 1970-79 from 16.2 percent to 6.52 percent, and to reduce commercial manufac- turing’s ROA from 14.3 percent to 5.76 percent. For 1980-83, the ROA for defense contracting was reduced from 19.4 percent to 4.73 percent, and the ROA for commercial manufacturing was reduced from 10.7 percent to a negative 3.66 percent, as shown table 3.6.
Table 3.9: DFAIR’s ROA Procers by Time Peiiod (Step 4) Figures In percent --~-- ~______
Defense contracting -.- ___-- Commercial manufacturlna
-- 1970-79 1980-N
Result Effect Result Result Effect Result after of step after after of step after
step 2 4 step 4 step 2 4 step 4 152 -666 6 52 194 -14 67 4 73
143 -6 54 5 76 107 -14 35 -3 65
step 5, DFAIR used its ratio of economic profit to gross assets less cash to present its final results which are shown in table 3.6 under DFAIR ROA. DFAIR con- cluded that these final results show that profitability for DoD business was very similar to that of durable goods manufacturers when the “abnormal” 1980-83 period is excluded from the comparison.
Table 3.6: DFAh’s ROA Process by Time Pekiod (Step 5) Figures In percent __--__---~
DFAIR ROA Conventional ROA b 1970-79 1980-83 1970-79 1980-83 -----
Defense contracting 6 52 4 73 194 23 3
Commercial manufacturing --~ - ----.-____.
5 76 -3 65 144 106
We, however, would conclude from DFAIR’S “conventional” ROA analysis (shown in table 3.6) that defense contracting has been consistently more profitable than commercial manufacturing-35 percent more profitable during the 1970s and 120 percent more profitable from 1980 to 1983.
Page 29 GAO/NSlAD-97-60 DFAIR

Chapter 3 DFAIB Underawed the Profltabillty of Defeme Contrecting
Example of Effect of DFAIR To provide an example of the effects of DFAIR'S assumptions and meth- Assumptions and odology, we applied them to the 1986 financial statements of one major
Methodology defense contractor. Table 3.7 shows that DFAIR'S methodology would cut the contractor’s conventional ROA from 16 percent to a DFAIR ROA of 5 2 percent. This points out the effects of DFAIR'S treatment of progress pay- ments and its economic profit on ROA. The imputed interest values used for economic profit have a significant effect in this case-imputing interest costs of $647.1 million when a net interest expense of 8 17.2 mll- lion was the contractor’s actual experience
Table 3.7: Effect of DFAIR Assumptions and Methodology for 1985 in Mllllons of Balance sheet Dollars
_________ ___- Assets Liabilities -___- -- - Current assets Current liablllties $1,867 2 --__
Cash and equivalents $134 Noncurrent llabllltles 1,245 1 -_____ ____- -~- -~~ Net contracts In
1,181 Shareholders’ equity
process 9 1,335 8 _-__ ..- ___~~ -. Inventories 529 9 -- --- Other current assets 452 4 --
Property, plant, equipment 1,173 1
&her noncurrent assets 1.097 4 .- __. Total
.-~ $4.440.1 Total $4.448.1
Income statement Net sales
Operating costs & expenses
Operating earnings Interest (net) -- __ Other Income (net)
Income before taxes
$8,163 8 _ _-.----. .~ ~___ 7,495 8
668 0 (17 2>
36 $654.4
Conventional analysis:
ROA = Operating earnings 668.0 = 15.0% Total a88ets XGI-82
Economic profit Sales .---
Less -allowable cost and unallowable costs other than interest 7,495-i _-----~ . -imputed interest on average fixed assets 99 3 --Imputed interest on average working capital 547 8
Economic proflt $20.9
Page 30 GAO/NSLAD-87-60 DFAIR

Chapter 3 DFAIR Understated the ProfitabIlity of Defense Contracting
------- --____ Asset base _ __- _-. ~____ -- --~ ~-~- -~ ~- Net current assets -~ -___- Net property, plant & equipment -- --___- .---_-
Plus progress payments
Less cash
DFAIR analysis:
$2,177 6
1,173 1
5,936 6 134
$9,27&Q
ROA= economic profit &?I imputed interest on proareas payments Net property plant and equipment + net current aaseta + progress payment-cash0
ROA = 20.9 + (.077) (5936.6) = 5.2% 1 .
BCash IS subtracted from the denominator of this equation to dupkate DFAIR’s segment level analysis Cash would normally not be subtracted In a firm level analysis The difference In ROA IS small-5 147% when cash IS not subtracted, 5 154% when cash IS subtracted
Our Analysis Shows Highp Contractor ProfNtability
Because we did not have access to the raw data collected by Touche Ross and, therefore could not audit and verify the data we could not, with confidence, draw conclusions based on analyses of those data. We feel this hmitation underscores the need for the Profitability Reporting Program.
We were forced to use publicly available data which limited the range and precision of our comparisons. However, our conclusions based on public data are consistent with our conclusions based on the aggregated Touche Ross data. While this may allow us to consider the Touche Ross data to be representative of the actual experience of defense contrac- tors, we cannot, because of the limitations mentioned above, evaluate the accuracy and validity of the Touche Ross data.
As discussed earlier, the aggregated data available through Touche Ross shows defense contractors were consistently more profitable than com- mercial manufacturers. It was DFAIR'S adjustments of these data that made defense contractors’ profitability appear somewhat more profit- able than commercial business in 1970-79 but substantially more profit- able m 1980433. Our comparisons show that
l at the firm level, as well as the segment level, defense business is more profitable than commercial business (see app. IV),
. defense contractors were more profitable than commercial manufac- turers during 1975-79 as well as in 1980433 (see app. IV),
Page 31 GAO/NSIAD-S75O DFAIR

Chapter 3 DFAIR Understated the ProfkabUrty of Defense C4mtracting
9 defense contracting is generally no riskier than commercial manufac- turing (see app. IV), and
. many defense contractors take greater advantage of favorable federal income tax treatment than commercial manufacturers-DFAIR’s calcula- tions did not consider this.
Our total company comparisons were done using data available through the COMPUSTAT data base for 84 defense firms and 228 commercial firms. Fifty-nine of the 84 defense firms participated in the DFAIR study. Of the remaining 26 firms in our sample, 23 were part of the original 126 DFAIR sample firms but declined to participate in the DFAIR study. The time period for our total company level comparison’s was 1975 to 1983, which is the same period used by Touche Ross, but not the same as used by DFAIR (1970 to 1983).
Our segment level analyses compared the profitability of defense and nondefense segments of the 84 defense firms in our sample. Segment level data was available only for the period from 1979 to 1984. Also, COMPUSTAT does not provide detailed data regarding the amount of defense and commercial business within a segment-Touche Ross col- lected such detailed data. Therefore we assumed that segment level data-taken from COMPUSTAT-is less precise than the Touche Ross data.
Most of our analyses are done using data which relates to the business firms as a whole. We refer to this data as firm level data. We also did a profitability analysis on the segments of the 84 defense firms in our example. These segments are subunits within the firm that are used by the firms to comply with the Securities Exchange Commission 10-K reporting requirement. We refer to our analyses using data from these subunits as segment level analyses. Because of limitations of segment b
data, certain calculations were not performed at the segment level. For example, figures for equity, after-tax income and market return are available only at the firm level. Allocation of these amounts to the seg- ments would be arbitrary at best. Therefore, comparisons are only made for overall profitability, risk and after tax income at the firm level and of profitability at the segment level.
Ptofitability at the Firm Level
As shown in table 3.8, the 84 defense firms showed higher returns than the 228 commercial firms for all 6 measures used by the Logistics Man- agement Institute &MI)-DFAIR'S consultant -except the market return.
Page 32 GAO/NSIABS7-50 DFAJR

Chapter 8 DFAIR Understated the Pro!Wabfflty of Defenne C4mtracting
Table 3.6: Our Compsrlson of Firm Level/Overall Profltability ( 1975 1983) Figures In percent
Net income ROA -- - .- -.~__ Net income return on stockholders’ equiiy -. - __----__.-_ ~ Net Income ROS - ---- -- ---_-_ Cash flow ROA - -- - ---- C&h flow return on stockholders’ equity _- .- Market return once aotxeclatlon DIUS dlvldends
Commercial Defense firms firms
51 -- 50 -~-- 99 128
40 -52 94 119 _____-
20 0 26 4 -- 165 159
We also computed a weighted average ROA, stockholders’ equity, and sales for each year. The results, presented in table 3.9, show that defense firm profitability exceeded the return to commercial firms for all three measures.
Table 3.9: Our Weighted Average Compsr)ron of Overall Profltability (19751?3)
Figures In percent
Commercial firms
Defense firms
ROA 67 83
I
- -- ------ -_ --. --___ Return on stockholders’ equity
- -- --______-__.__c- - - _ ----. 104 127 _ __ - -_--.--- -------.
ROS 37 54
One of DFAIH'S conclusions was that defense contracting and commercial manufacturing were equally profitable during 1970-79. Our analysis covered half of this period-1975 to 1979
Table 3.10 shows, again, the profltablhty of defense firms exceeded that of commercial firms for each of the three measures m 197579. Our anal- ysls for the period 197579 does not support the DFAIR conclusion that defense contracting was about as profitable as comparable commercial manufacturing during the 1970s.
Table 3.10: Comparison of Firm Level Profitability (1975 79) Figures In percent -. - .- ---_______
l?OA - _._. - ___ -_ -- - --_
Return 6; st&kholders’ equity _ - ---- -. ROS
Page 33 GAO/NSIAD-87-50 DFAIR

Chapter 8 DFAIR Undermtrtsd the ProflMvjlIty of Defenm c!attmctlng
Profitability of Firms’ Defense and Nondefense Segments
We also compared the profitability of the defense and nondefense seg- ments of the 84 defense firms in our sample. Because of reduced data availability, the time period for the segment analysis was limited to 1979-1984. As shown in table 3.11, the defense segments’ ROA was 17.6 percent, which is approximately 67 percent higher than the commercial segments’ RQA. Although table 3.11 shows commercial segments to have higher ROS we believe ROA is the preferable measure of profitability.
Table 3.11: Our Comparlaon of Segment Level ProfItabIlIty (1979-l 984) Figures in percent
Commercial Defense segments segments
ROA 112 176
ROS 102 85
We would expect the segment level ROA shown in table 3.11 to be higher than the firm level ROA shown in table 3.10 for several reasons. First, the analysis at the firm level is done after taxes, whereas the analysis at the segment level is done using profit before taxes. Second, the profit used for the firm level ROA is reduced by corporate overhead expense while at the segment level no portion of corporate overhead would have been deducted from income. The Touche Ross and Company data did allocate corporate overhead to segments and this is another reason why the Touche Ross data should provide more precise R~AS for defense business and commercial manufacturing. (See table 3.3.) In addition, it should be noted that tables 3.9 and 3.11 use different data bases and different time periods.
Riskiness of Defense Versus DFAIR, through LMI, evaluated the riskiness of defense business by ana- Commercial Firms lyzing six measures of rate of return for defense contractors and com- .
mercial manufacturers. Risk was measured by the variability of returns over time based on the standard deviation about the mean rate of return. As shown in table 3.12 LMI found that defense contractors faced less risk for all measures except ROS, where DFAIR claims they were com- parable to commercial firms.
We also evaluated risk using the standard deviation3 measure. (See table 3.12.) Cur results generally support DFAIR’S conclusion. Because the
%andard deviation is a measure of dlspenion in a frequency distnbution equal to the square root of the mean of the squares of the dewatlons from the anthmetic mean of the distnbutlon
Page 34 GAO/NSIAD-87.SO DFAIR

chapter 8 DPAIB Undemtated the Profitability of Dcfeme Contracting
standard deviations for the defense sample are below those for the com- mercial firms, defense firms are less risky than commercial firms for all measures, including ~0s.
Table 3.12: Ri8k Mearures for Defense Flrma Verlrur Commercial Firms F&lures In percent
-.z- ---~
LMI analyrir (1974-1994) Our analvrls (1975-1983) Commercial Defenre Commercial Defense
- -.~ Net income on assets --~ Net Income return on stockholders’ equity Net Kome on sales -- -.. ~ ~. .- Cash flow ROA
firms 56
189 20 4
55
firms 2.9
79 21 7
29
firms firma 32 22
122 51 26 21 32 22
Cash flow return on stockholders’ equity ---- .-- Market returna
184 75 112 40
62 7 49 2 37 8 31 6
‘Market return IS the stock pnce at end of the year minus the stock pnce at the beginning of the year plus any dlvldends paid during the year This quantity IS then divided by the stock price of the begin- ning of the year to get a percentage return The market return measure IS for the period 1965 to 1965
Income Tax Treatment
I
DFAIR did not perform an after-tax analysis or make an evaluation of the tax treatment used by defense contractors. DFAIR stated that making an allocation of federal income taxes to negotiated contracts would have been exceedingly difficult, if not impossible, and that requesting such data may have reduced contractor participation in the study. DFAIR also stated that it has long been DOD'S policy to maintain a neutral stance on tax laws applicable to the economy as a whole.
We agree that allocating federal income taxes to contracts, or even to segments, would have been difficult or arbitrary at best. We note, how- ever, that defense contractors use favorable federal income tax treat- ments that should have been given some consideration by DFAIR. To compare profitability across industries, it is important to calculate rates of return after taxes. This after-tax rate of return (or what a firm gets to keep) determines the firm’s ability to pay dividends to shareholders or retain earnings for future investment and expenses,
A recent report issued by the Joint Economic Committee of Congress indicates that defense firms, on the average, pay a much lower effective income tax rate than firms in most other industries. The principal expla- nation for this outcome is the use of the completed contract method of accounting, which defense contractors use to defer income tax liabilities
Page 35

Chapter 3 DFAIR Understated the Profltability of Defense Cmtractlng
to a much greater extent than commercial firms We believe that because of the deferred taxes resulting from the tax treatments used by defense contractors, it is important to use after-tax rates of return when calcu- lating profitability ratios.
Table 3.13 shows that if an adjustment for tax deferral is made, the effect on rates of return is larger for defense firms than for commercial firms, which results in an increase in defense firms’ relative profit- ability. The terms used in the table are defined below.
R0.A (tax) = (net income + (l-t) interest + tax deferral) assets
t = total taxes - deferred taxes pretax income
HOE (tax) = net income + tax deferral stockholders’ equity
The tax deferral was calculated by the amount of change in the annual tax deferral amounts shown on the firm’s financial statements.
I Taqle 3.13: Compariron of Profitabillty Conridering lax Effect (1975-1983) Figures In percent
ROA ROA(tax) ROE ROE(tax) Defense firms - 03 98 --- 127 ----157 ---- ---- Commercial firms 67 74 104 -ii-2
Navy Study Indicated- The Assistant Secretary of the Navy for Shipbuilding and Logistics com-
Higher Contractor Profitability 1
missioned a study, Financial Analysis of Major Defense Contractors, by RRG Associates. The study, published August 20, 1986, analyzed the b
annual reports and Form 10-K data for 22 defense contractors. The report showed the following RQA rates for 1984.
Table 3.14: Navy Study ROA Result8 for 1994 Figures In percent -~.--
ROA ---- --. ____-- Composite ROA for all U 5 government only segmentsa 26 7
Composite ROA for mixed U S government/ commercial segments 15 1
ComDoslte ROA for selected commercial seaments 113
Tontractor business segments with sales, the study’s authors determined, primarily to the U S govern- ment
Page 36 GAO/NSIAD-S7-60 DFAIR

Chapter 3 DFAIR Understated the Profitability of Defense Contracting
The Navy study also stated that the ROA for government business seg- ments was higher than that for eommerclal business segments from 1977 to 1984. According to the Navy study, the government business ROA was over 1 4 times the commercial ROA even in the best years for commercial RoA.
A review of data collected from the contractors of the DFAIR study indi- cates a close correlation between the Touche Ross ROA data unadjusted for progress payments and the ROA data in the Navy study as shown in table 3.16.
Table 3.15: ROA Flaures In Dercent
Defense Selected Dc!!:
Non- segments Defense Defense commercial defense
(Navy (Touche segments segments (GAO) (Navy Study)
(Touche Study) Ross)
segments Ross) (GAO) __--
1975 . 189 . . r- .
--__ ~ 1976 . 20 7 . . 165 .
- -
1977 238 236 . 156 182--------- iii78
-___ --- -- 234 132 . 158 175 -- .
--__- __-- 1979 225 208 165 155 146 131 198Of -----iii
__-.- -___ --___ 188 156 138 110 101
1981 --____ 233 227 191 98 124------ 105
1982 225 250 178 79 86 103 1983
__- -___. 264 288 186 79 102 112 --~ __~~
1984 267 . 173 11 3 . 125 .~__I_--~__ -__ Average 23.7 22.6. 17.6 12.2 12.w 11.2
aThese averages were calculated by Touche Ross (see app VI)
We did not evaluate the Navy study but we believe that the Navy study results, which are consistent with the unadjusted Touche Ross ROA data, are another indicator that government contractors have consistently earned a higher rate of return than commercial manufacturers
Conclusions DFAIR used ROA as the measure to compare the profitability of defense contracting and commercial manufacturmg. We agree with the decision to use ROA as the basis for this comparison. DFAIR found that the ROAS for these two groups were generally comparable in the 1970s-with defense contracting maintaining its ROA levels in the 1980s while those of com- mercial manufactures declined. In contrast, our analysis showed that defense contracting was more profitable, both in the 1970s and in the
Page 37 GAO/NSIAD-W-60 DFAIR

Chapter 3 DFAIR Understated the Profltabillty of Defense Contracting
1980s. Furthermore, we believe DFAIR should have considered the effects of the beneficial tax treatments defense firms use. We agree with DFAIR that defense business is no more risky than commercial business.
DFAIR'S methods of calculating ROA led to a significant understatement of contracting profitability. By increasing contractor assets by the amount of progress payments contractors received from the government, DFAIR doubled the asset base of their ROA calculation. Doubling the asset base cut the RoA percentage in half and DFAIR'S adjustment to the income por- tion of the calculation was not large enough to show the profitability enhancement contractors get from progress payments. The effect of these two adjustments alone was to reduce defense contracting’s R~A from 20.6 percent to 16.4 percent, while the RQA for commercial business remained at 13.3 percent. DFAIR also added 6 years of earlier data that reduced contracting’s ROA and developed its unique definition of profit that cut the RoA of both defense contracting and commercial manufacturing.
This understatement of profitability allowed DFAIR to conclude that the profitability-measured by RoA-for defense contracting was very sim- ilar to that of durable goods manufacturers when the abnormal 1980-83 period is excluded from the comparison. Using this conclusion as the underlying theme of its report, DFAIR addressed its recommendations to a slight disparity in profitability when a significant disparity exists.
Page 38 GAO/NSIADJ37-60 DFAIR

Page 39 GAO/NSIAD47-60 DFAIR

Chapter 4
DFAlR Recommendations to Reduce Unintended Increases in Profit Negotiation Objectives Will Not Meet That Goal -
DFAIR determined that contract profit negotiation objectives were higher than intended from 1981 to 1983. It concluded that the unintended 0.5 to 1 percent increase- as a percentage of contract cost-in profit nego- tiation objectives occurred in 1981 through 1983 due to the implementa- tion of Defense Acquisition Circular 76-23.
DFAIR'S recommendations would change the weighted guidelmes substan- tially. Among other things, it reduced the number of profit elements related to contractor effort from 11 to 3. It would change the profit factor related to facilities investment to provide more profit on equip- ment than for buildings, and no profit on land; it also broke out a sepa- rate profit factor for contract financing costs.
DFAIR believes that its recommended changes to the weighted guidelures policy will reduce profit negotiation objectives by 0.5 to 1 percent. Based on its DOD Form 1499 data, DFAIR concluded that its recommenda- tions would reduce the profit negotiation ObJective to 11.5 percent of total cost, which would be 0.8 percent lower than the 12 3 percent total markup average for fiscal years 1981-83.
Our analysis of the same DOD Form 1499 data showed that the profit objectives developed under DFAIR'S recommendations would not decrease. In fact, they could increase to as much as 12.7 percent of total cost1 If the 12.7 percent profit objective accurately predicted actual contractor profits and if the weighted guidelines were used on the $81 billion in fiscal year 19832 contracts to which they could apply, then DFAIR'S recommendations would result in $972 million in unintended con- tractor profits.
We believe DFAIR understated the probable profit negotiation objectives because it
l used negotiation objectives at the lower end of the possible ranges of individual weighted guidelines factors,
l did not consider the effects of its recommendation to include ship- building under its proposed profit policy, and
. recommended a policy that is very sensitive to the mix of contract types and based the 0 5 to 1 percent reduction on an unrealistic mix of con- tract types.
‘DOD 1s developing another profit pohcy which may result in a different level of profit obJectIves.
“The total amount of fiscal year 1986 contracts to which weighted gmdehnes could apply IS also $81 bilhon
Page 40 GAO/NSlAD-87-M) DFAIR

chapter 4 DFAIR Recommendation to Reduce Unintended Increaaw In Profit Negotiation Objectives WlR Not Meet That Goal
DFAIR Assumed Low In doing its analysis, DFAIH used profit negotiation objectives that fell in
Profit Objectives Would Be Used- History Proves Otherwise
the lower end of the possible ranges of individual weighted guidelines factors. For example, if a direct labor profit negotiation factor could range between 6 to 10 percent of cost, DFAIR determined the factor would average 6.8 percent. DFAIR calculated the profit negotiation factors by arbitrarily reducing the average profit objectives used from 1981 through 1983. For example, the DOD Form 1499 data for 2,994 firm fixed-price nonship contracts-- with a total estimated cost of $3 1.1 bil- lion-showed an average direct labor profit objective of 9 percent. DFAIR then multiplied this rate by 76 percent (an arbitrary 26 percent reduc- tion), to obtain a 6%percent objective. We disagree with this calcula- tion. We determined that based on historic patterns, the profit objective used was 8.6 percent, and we believe this would be a more appropriate predictor of future profit negotiation objectives.
We used the DOD Form 1499 data to determine what the actual profit objectives were m the past. We found that the weighted average of the profit objectives for labor was 8.6 percent- rather than the simple average of 9 percent calculated by DFAIR. Nothing in the DFAIR study jus- tified an arbitrary reduction in the average profit negotiation objectives. Therefore, it is likely that contracting officers can be expected to con- tinue using, on average, a profit negotiation factor of 8.6 percent and that DFAIR overstated the reduction in negotiation objectives that can be expected from its revised profit policy.
Table 4.1 provides an example of the effect of DFAIR'S methodology.
Table 4.1: OFAIR Methodology Effect on Labor Profit Negotiatlon Factor Direct labor Profit
Direct labor profit objective as profit factor objective a percent of
Direct labor coat (billion) (percent) (million) total cost ______.~- -____---_---_. -- Our Analysis b --- --_- ------ -- ---- $40 85 $370 11 --- -_- ___-.- ------ ~ __---.-- - DFAIR analysis $40 -___I-
- ---~ -~- 68 $272 09
As shown in table 4.1, DFAIR'S methodology understated probable profit objectives by 0.2 percent of total cost for the labor costs on firm fixed- priced contracts Similar distortions occurred in the material and indi- rect cost categories and for other contract types. Table 4.2 shows, in the row labeled “cost element profit objective,” that the net effect of these
Page 41 GAO/NSIAD-87-60 DFAIR

Chapter 4 DFAIB Recommendat1on.m to Reduce Unintended Incmasen In Profit Negotiation Objectives WUI Not Meet That Goal
distortions for all cost categories and all contract types is 0.3 percent- the net difference between our calculations and DFMR'S calculations.
Related One of DFAIR'S recommendations is that shipbuilding contracts should be
Recommendation Was priced on the same basis as other DOD contracts and that the Navy should adopt DFAIR'S recommendations. Notwithstanding this recommen-
Not Considered dation, however, in calculating the expected results of its proposed policy, DFAIR did not consider the effect of its recommendation to include shipbuilding contracts in the policy.
Our calculations showed that under the proposed policy, the profit objective for shipbuilding contracts would be 14.1 percent. DFAIR did not include these contracts to calculate the overall profit ObJective of 11.6 percent.
DFAIR stated that the shipbuilding data available to them was signifi- cantly different from that of other product groups, and that ship- building profit reporting practices caused shipbuilding profits to appear substantially higher than their actual level.
We examined the shipbuilding data available from the DOD Form 1499 data base and found that profit objectives reported on shipbuilding were not substantially higher than those of other product groups. In fact, the DOD Form 1499 data base shows that profit objectives on shipbuilding contracts-exclusive of the cost of money factor-are slightly lower than profit objectives for other products, Therefore, we concluded that DFAIR'S concerns about the raw data did not justify excluding ship- building data from our calculations. As shown in table 4.2, excluding shipbuilding contracts has a significant effect on our estimates of overall profit objectives-particularly the cost of money factor. There- I fore, in addition to the inadequacy of the guideline revisions DFAIR pro- posed, the absence of shipbuilding data from the equation which determines the degree of correction necessary limits the extent of DFAIR'S guideline revisions.
Page 42 GAO/NSlAD-S7-50 DFAIR
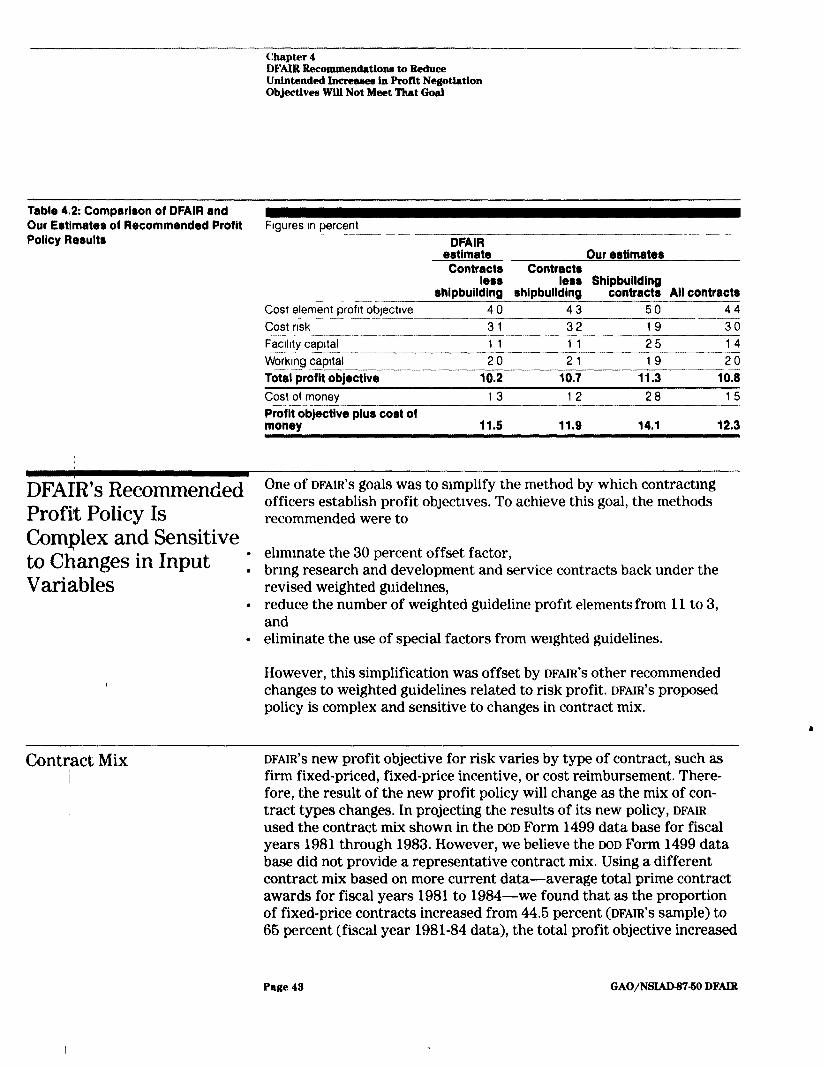
--- Chapter 4 DFAIR Recommendations to Reduce Unintended Increases in Profit Negotiation ObJectIves Will Not Meet That Goal
Table 4.2: Comparison of DFAIR and Our Estimates of Recommended Profit Figures In percent Policy Results
_ ---- -.- - ------. .~. - .~ DFAIR
estimate Our estimates Contracts Contracts
less lesr Shipbuilding shipbuilding shipbuildlng contracts All contracts --
Cost element profit objectwe 40 43 50 44
Cost ri.k -- - ------ -- -.---
31 32 19 30 -..- .~- Fachty capital 11 11 25 14 --__ _ Working capital 20 21 19 20 -_.-- -- ___- Total profit objective 10.2 10.7 11.3 10.8 Cost of money 13 12 28 15 -_ .-.. -___ - -~ Proflt objective plus cost of money 11.5 11.9 14.1 12.3
DFAtR’s Recommended Profit Policy Is Complex and Sensitive to Changes in Input : Variables
.
.
One of DFAIH'S goals was to simplify the method by which contracting officers establish profit ObJeCtiVeS. To achieve this goal, the methods recommended were to
eliminate the 30 percent offset factor, bring research and development and service contracts back under the revised weighted guidelines, reduce the number of weighted guideline profit elements from 11 to 3, and eliminate the use of special factors from weighted guidelines.
However, this simplification was offset by DFAIR'S other recommended changes to weighted guidelines related to risk profit. DFAIR'S proposed policy is complex and sensitive to changes in contract mix.
Contyct Mix 1
DFAIR'S new profit objective for risk varies by type of contract, such as firm fixed-priced, fixed-price incentive, or cost reimbursement. There- fore, the result of the new profit policy will change as the mix of con-
/ tract types changes. In projecting the results of its new policy, DFAIR used the contract mix shown in the DOD Form 1499 data base for fiscal years 1981 through 1983. However, we believe the DOD Form 1499 data base did not provide a representative contract mix. Using a different contract mix based on more current data-average total prime contract awards for fiscal years 1981 to 1984-we found that as the proportion of fixed-price contracts increased from 44.6 percent (DFAIR'S sample) to 65 percent (fiscal year 1981-84 data), the total profit objective increased
Page 43 GAO/NSIAD-t3750 DFAIR

Chapter 4 DFAIR Recommendatiotw to Reduce Unintended Increaeea in Profit Negotiation Objectives Will Not Meet That Goa.l
from 12.3 percent to 12.7 percent. We believe the 66 percent figure is a more appropriate projection of the total fixed-price contracts because it comes from the DOD PO3 report which addresses prime contract awards DoD-wide. DFAIR used the DOD Form 1499 data base which does not con- tain all DOD contract actions over $600,000, and is not adequate for pro- jecting results.
We believe that the 65 percent factor for fixed-price contracts is more consistent with historical data than DFAIR'S 44.6 percent. As shown in table 4.3, the percent of fixed-price contracts has, for the last 10 years, never been lower than 62.9 percent and for the last 6 years, never been lower than 63 percent
Table 4.3: Firm Fixed-Price Contract8 aa c Percent of Total Prime Contract Awprdr
Year8 ---_ --- -.--~- 1974 --~-- 1975 -__- 1976
Percent .- ~-- 529
558
571
1977 542
1978 557
1979 596
1980 658 -- -~ 1981 67 2 ~. -__ 1982 630
1983 630
1984 659
By using a contract mix with a lower proportion of firm fixed-price con- tracts, DFAIR underestimated the effect its new policy could have on profit objectives.
DFAIR Did Not Clearly DFAIR stated that the profitability for defense business was very similar
Relate Profit Policy to to that of durable goods manufacturers when the abnormal 1980-83 period was excluded. DFAIR also stated that the net effect of Defense
ontractor Acquisition Circular 76-23 was to increase profit objectives by 0.5 to 1
Profitability percent and that the 30percent offset factor was insufficient in fiscal years 198183.
DFAIR stated its recommended profit policy alternative will cause overall average profit objectives-as a percentage of cost -to be approxi- mately 0.7 percent lower than the average during 1981-83.
Page 44 GAO/NSIA.D-67-SO DFAIR

chapter 4 DFAIR Recommendations to Reduce Unintended Inm~ In Profit Negotiation ObJecthen Will Not Meet That Goal
DFAIR did not, however, relate its changes to profit policy to the profit- ability- measured by ROA-Of defense contractors and did not indicate to what extent its proposals would have reduced the profit realized in defense business from 1980-83. Some means is needed to relate profit policy to contractor profitability.
Conclusions DFAIR'S proposed profit policy would not significantly reduce the current total profit negotiation objectives. Based on assumptions most favorable to a potential reduction, the profit objectives under DFAIR'S recommenda- tions would not be lower than 12.3 percent of total contract cost- rather than the 11.6 percent reported by DFAIR. Because the complex nature and sensitivity of the proposed policy, and use of other assump- tions, the profit objectives could range as high as 12.7 percent.3
In addition, we believe that some means is needed to relate profit policy to contractor profitability.
"The profit obJective level may be different under DOD’s latest proposal
Page 45 GAO/NSIAD-S7-50 DFAIR

DFAIR’s Recommendations Could Overcompensate Contractors for Financing costs
In evaluating contractor financing costs, DFAIR developed a “typical” contract model. From this model, it concluded that contractors histori- cally incurred a cost equal to approximately 2 percent of the total con- tract cost to finance their working capital requirements1 We question the validity of this conclusion because historic data indicates that these costs are less than 2 percent. Moreover, in devising methods to reim- burse contractors for the 2 percent factor, DFAIR failed to recognize the effect of related recommendations that would lower contractors’ working capital financing costs.
Historic Data Dispute By applying the past progress payment rates and actual short-term com-
DFAIR’s Estimate of mercial loan rate for each year since 1954 to its model, DFAIR concluded that contractor financing costs had been roughly 2 percent of total costs.
Contractor Financing The data used to develop the contract model’s pattern of cost incurred
Needs and delivery schedule were based on 12 contracts with 5 contractors.
Our analysis of historic data indicates that DFAIR’S estimate may be over- stated. COMPUSTAT data for the top 11 defense contractors - publl- tally held companies that accounted for 64.22 percent of total DOD sales from 1980 through 1983 - shows that these contractors incurred net interest expenses that were substantially less than 2 percent of their total cost of goods sold. For 1983 and 1984 the net interest expenses averaged 1.2 percent and 1.1 percent respectively. The Touche Ross data shows a similar pattern. Although the Touche Ross data does not show corporate level interest income or expenses, the data does show that at the segment level contractors incurred total interest costs equal to 0.86 percent of total costs during the period 1975 to 1983.
This historic data indicates that DFAIR may have overestimated contrac- tors’ working capital financing needs. We believe that the historic h figures raise questions about this financing cost and that it should not be accepted without further study. Our position is further supported by
. The Conference Board report (app. III to the DFAIR study) which states that contractors have ample liquidity and little need for financing.
l The fact that some defense contractors have minimal net interest expenses. The contractor from the example in chapter 3 earned a net profit on interest in 1984 and incurred a net interest expense of about
’ DFAIH’s defmltlon of workmg capital, m this case, IS 1 minus the progress payment rate multlphed by the contract cost
Page 46 GAO/NSIAD-67-Ml DFAIR
Chapter 6 DFAIR’s Recommendations Could Overcompensate Contractors for Phanclng Costa
one quarter of 1 percent of total cost in 1985-after acquiring a maJor subsidiary for cash and short-term notes.
. The fact that defense contractors have a higher return on equity than commercial manufacturers-13.8 percent versus 11.7 percent during 1976 to 1983-which indicates that defense contractors have not dam- aged their equity position. While contractors probably finance part of their working capital requirements through equity-and therefore do not incur a 2 percent cost that is entirely interest-the historic data indicates that contractors are not excessively relying on equity to finance assets.
Contract Model Did Not DFAIH'S typical contract model showed a contractor’s working capital
Consider Related cost of $175,323 on a $10 million contract- approximately 1.75 percent of the total contract cost-using the followmg assumptions.
Recommendations l A 40-month contract . A go-percent progress payment rate. . A S-day progress payment delay. . A E-day delivery payment delay. l Four delivery payments m the last 7 months of the contract. . A 12.02 percent short-term commercial interest rate. . An average float time of 3 days.
In making these assumptions, DFAIR did not consider related profit policy changes that it had recommended. These changes affect three of the assumptions used in the model contract: (1) progress payment rate-86 percent rather than 90 percent, (2) delivery payment delay-30 days rather than 16 days, and (3) delivery payment frequency-beginning 6 months after contract start and made monthly. The most significant of these changes is the frequency of delivery payments. DFAIR recom- mended that delivery payments start 6 months after contract start, with payments made monthly or quarterly. On the contract model this would result in 29 monthly payments -in addition to the 3 regular pay- ments-which, as shown in table 6 1, cut the contractor’s working cap- ital costs dramatically.
To demonstrate the effect of these policy changes we did an analysis of the model contract using the following assumptions which reflect DFAIR'S recommendations, and using the current interest rate at the time of our analysis. Based on these assumptions and the same $10 million contract model, we calculated that the contractor’s working capital cost would be reduced from $176,323 to $19,339. (See table 6.1.)
Page 47 GAO/NSIADW-SO DFAIR

.
.
Chapter 5 DFAIR’s Recommendations Could Overcompensate Contractors for Financing Cotta
A 40-month contract. An 86-percent progress payment rate. A S-day progress payment delay. A 30-day delivery payment delay. Interim delivery payments-consisting of 10 percent of costs incurred plus profit2 -beginning 6 months after contract start and made monthly. A 9.76~percent3 short-term commercial interest rate. An average float time of 3 days.
%sed on duxusslons with DOD officials, we assumed the intent delivery payments would consist of 10 percent of cost-which allows a 6 percent reserve-plus profit
sWe used a lower, more current interest rate-9 76 percent Had we used the DFAIR rate of 12 02 percent, contractor costs would have mcreased to $23,847 rather than $19,339
Page 48 GAO/NSLAD87-60 DFAIR

-- chnptm 5 DFAIR’r Reconunendations Could 0vercomperwlt.e contrrrctore for Flnancingc4lsta
Table 5.1: Effect of DFAIR’r Proposed Profit Policy Changes on Its Typical Contract Model ---- - - _ ---~_
costs Month incurred 1 46,640
2 74,137
3 63,300 4 188,552
5 250,576 6 271,250 7 271,250
8 271,250
9 271,250 10 271,250 11 271.250
12 293,583 13 / 306,743 14 D 311,130 15 311,130 16 * 311,130 17 311,130 18 , 311,130 19 311,130 20 1 311,130 21 308,632
22 307,161 23 306,970 24 306,670
25 306,670 26 306,670 27 306,670
28 306,670 29 306,670 30 256,835
31 230,646 32 ; 221,250
33 221,250 34 ' 221,250
35 ' 221,250
36 221,250 37 221,250
Progreso
paylT:; 39,651 63,016
70,805
160,269 212,990
230,563
230,563 230,563 230,563
230,563
230,563 249,546
260,732
264,461
264,461
264,461 264,461
264,461
264,461
264,461 262,337
261.087
260,670 260,670
260,670
260,670 260,670
260,670
260,670 220,010
196,049
188,063 188,063 188,063
188,063
- 188,063
188,063
DeliVery payment received
0 -_ 0 0 0 0 0
41,000 41,000
41,000 41,000
41,000 41,000
41,000
41,000 41,000
41,000
41,000
41,000 41,000
41,000 41,000 41,000
41,000 41,000
41,000
41,000
41,000 41,000
41,000 41,000
41,000
41,000 41,000
41,000
41,000 140,245
0
Contractor Simple Int. EOM’ Pd Total Int. on
Portion of unbilled cost Pal(ment Unbld cont.33 mark-up invntry float(-) c clays invntry invecltment .-~- -
0 6,997 (38) 54 57 73 - -- -0 18,118
---- (fo 85 147 172 - - ---. -__-
0 30,61$- ~~- (68) 96 249 277 ---. 0 58,896 (153) 217 479 543 - --__ 0 96,402 (204) 288 784 --ii68
-.-- -- ----’
0 137,169 (220) 312 1,114 1,206 ---_ - - --- 112.516 24.340 (2201 645 198 623 --.--.- ~~ 33,375 0 (220) 645 0 425 --~-- - _-. 33,375 0 (220) 645 0 425 33,375
-____. -___-- -~--.. 0 (220) 645 0 425
33,375 - -_---_- -- ----
0 (220) 645 0 425 33,375
_ - 0 (2391 671 --- 0 ..--_ 432
_. .-. - - - LL __-___ --_..-. -_ - 36,122 0 (249) 686 0 437 37.742
---- -_ 0 1253) 691 ---f- 438
38,281 - -
______ 0 ---.u (253) 691 0 438 - ----.- ~- ---~ 38,281 0 (253) 691 0 438 -
38,281 _- -- -~
0 (253) 691 0 438 -- --.. -___- 38,281 ~---.-. (253) 691 0 438 - -- - _---.- ___- -- --- - ---_. 38,281 0 (253) 691 0 438 ______-____- --.--~- - -- - 38,281 0 (253) 691 0 438 38,ii81
-- --.--- -~ ..~ -~ 0 (251) 688 0 437
37,974 0 PW 687 0 --437
37,793 -_____ ____--___--- __. ___ ~~ _
0 (249) 686 0 437 37,733 -- -~ 686 ---._~ - ~- 0 (249)
0 -. 437
-37.733 0
ii733 (249)
-2-I 686 0 437
-. _- .~. __- _____~ -.-- 0 (249) 686 0 437 b
37;733 -- -
0 (249) 686 0 437 37733
-------- -~. -~ 0 (249) 686 0 --437
377733 0 6’49) 686 0 437 37,733 0 (210) 631 0 -421
31,647 0 ('87) 599 0 -412
28.379 0 (180) 588 0 271223
408 -. -~ ----. 0 AL- (180) - --.--- 588 - _- 0 .~~~
~~
408
27,223 0 (180) 588 0 406 277223
-- ---- -.-- 0 11801 588 0 400
~~ _~ -~ -.L I-
27,223 0 (180) 1,394 0 1,214
0 -~- --_. ~..---. -..-
0 (18’3 255 0 75 ---- ---- _~ .- -~ --
Page 49 GAO/NSIAD-87dO DFAIR

Chapter 5 DFAIB’rr Recommendationa Could Overcompem9ate Contractora for FInAncIngcos~
Contractor Simple Int. Progrwo Dellvery EOM’ Pd Total Int. on
Coclta Portion of unbllled coa Unbld cont.‘s Month Incurred
P”Yb;$ !rxz mark-up invntty float(-)
Payment delayr invntty Investment _ ___--
38 143,998 122,398 140,245 54,445 0 (117) 1,305 0 1,188
--- - 39 98,474 83,703 0 0 0 (W 113 0 33 - -----_-- 40 129,115 0 140,244 45,720 0 (105) 1,139 0 1,034
Totql 10,000,000 &NO,266 1,609,734 1,230,403 0 (8,125) 24,430 3,028 19,339
aEnd of month
The effect of DFAIR'S recommendations, particularly the establishment of interim/milestone payments, would be to provide almost all of con- tractor working capital needs because the payments would reimburse most of contractor costs-plus an amount of profit.
In addition to recommending the interim/milestone payments, DFAIR rec- ommended that contractors get 2 percent of the total contract cost to cover imputed working capital financing costs, As a result, on the con- tract model with costs of 8 10 million, the contractor would receive $200,000 in profit as compensation for 519,339 in financing cost
If the DFAIR recommendation to provide contractors’ interim/milestone payments was implemented, and at the same time 2 percent of contract cost was provided to reimburse working capital financing costs, and if these recommendations are implemented on the entire $81 billion in fiscal year 1986 contracts to which they could apply, then DOD could (depending on prevailing interest rates) reduce contractor financing costs by 1.8 percent, or S 1.46 billion, and at the same time, reimburse contractors 2 percent, or $1.62 billion.
Conclusions If the contract financing provisions DFAIR recommends are implemented l
without regard for the effect of interim/milestone payments, then con- tractors could be overcompensated for their contract financing costs. Adjusting DFAIR'S typical contract model to reflect the effect of all related recommendations causes DFAIR'S projected financing cost for a $10 million contract to fall from $176,323 to $19,339-approximately 0.19 percent of the total contract cost.
Also, DFAIR has not made a convincing argument that contractors’ financing costs are roughly 2 percent of the total contract cost. Actual data and the current financial position of defense contractors indicate that this cost may be substantially less than DFAIR'S estimate.
Page 50 GAO/NSIAD437-50 DFAIR

Page 51 GA0/NSJAD437-50 DFAIR

Chapter 6 ______
Defense Contractor Investment and Efficiency
One of the issues that DFAIR examined was the amount of capital invest- ment undertaken by defense contractors. The capital intensity of defense contractors has been of great interest to us because it can have a substantial effect on efficiency. A major disincentive to defense con- tractor investment is the cost-based nature of DOD profit policies. Under these policies, contractors’ profits could decline if their investment in productivity enhancing equipment reduced costs, particularly labor expenses, A second disincentive is the uncertainty created by annual contracting. Under this arrangement, defense contractors could have a series of expected annual contracts terminated and be left with unrecov- erable investment expenses
To help overcome the disincentives to investment, the contracting policy was changed in 1976 with Defense Procurement Circular 76-3 and again m 1980 with Defense Acquisition Circular 76-23 to compensate contrac- tors for their capital investments. We believe these pohcy changes raise two questions:
1. Has the capital intensity of defense contractors increased?
2. How does the capital intensity of defense contractors compare with that of comparable commercial firms, and how has this comparison changed over time?
DFAIR'S answer to these two questions was:
“The defense sector has become more caprtahzed in the last nine years as evidenced by the increase in the FCE [facilities capital employed] to sales ratio It still does not use as much facilities capital per dollar of sales as does the non-defense sector, but its rate of increase has been substantially higher than the non-defense sector, and much more consistent ”
LMI, in appendix II to the DFAIR report, disagreed with DFAIR’S implication that the gap between the rates of investment for defense contractors and commercial manufacturers is lessening. LMI concluded there was clear evidence of a high rate of investment by defense contractors between 1978 and 1982 when the remaining book value of facilities cap- ital (fixed assets) grew at 20 percent a year for defense contractors com- pared to 13 percent for durable goods manufacturers
But, LMI observed that business base growth for durable goods manufac- turers was 6.1 percent annually during 1978-1982, which was consider- ably lower than the government contractor rate of growth. LMI found that as a consequence, the ratio of facilities capital book value to total
Page52 GAO/NSIAD-87-5ODFAIR
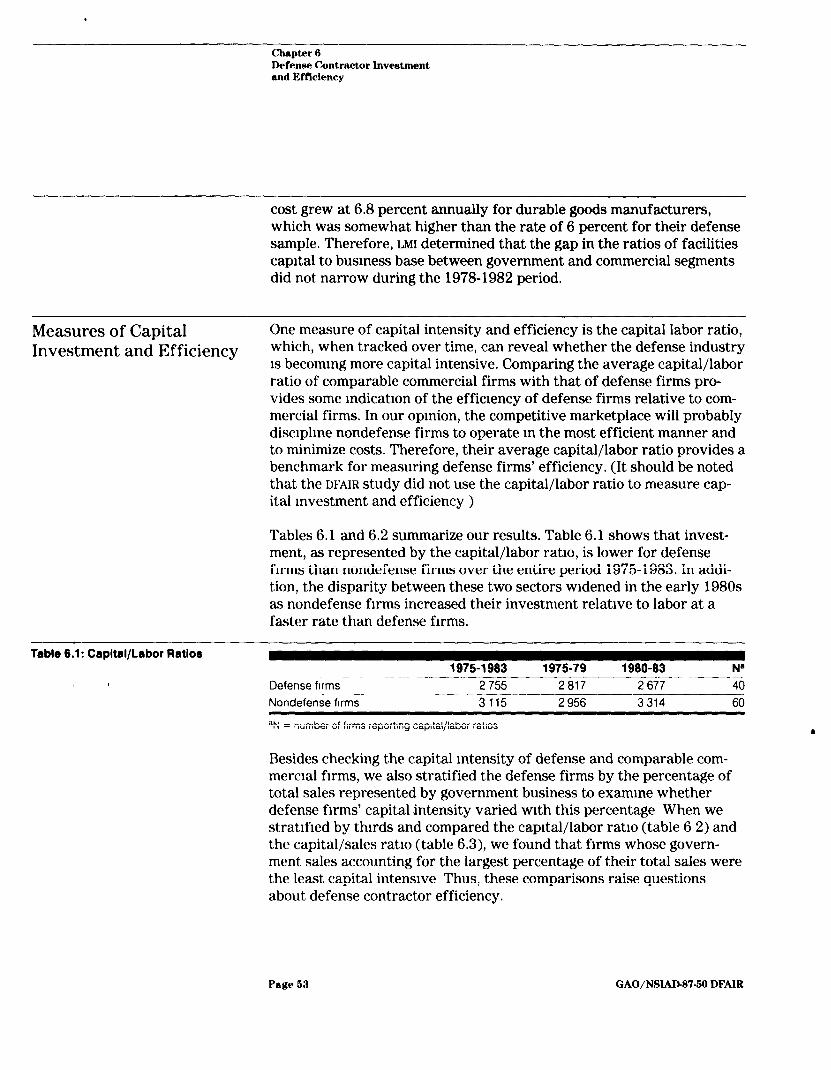
.
Chapter 13 Defense Contractor Investment and EMciency
cost grew at 6.8 percent annually for durable goods manufacturers, which was somewhat higher than the rate of 6 percent for their defense sample. Therefore, LMI determined that the gap in the ratios of facilities capital to business base between government and commercial segments did not narrow during the 1978-1982 period.
Measures of Capital One measure of capital intensity and efficiency is the capital labor ratio, Investment and Efficiency which, when tracked over time, can reveal whether the defense industry
is becoming more capital intensive. Comparing the average capital/labor ratio of comparable commercial firms with that of defense firms pro- vides some mdication of the efficiency of defense firms relative to com- mercial firms. In our opmion, the competitive marketplace will probably disciplme nondefense firms to operate m the most efficient manner and to minimize costs. Therefore, their average capital/labor ratio provides a benchmark for measuring defense firms’ efficiency. (It should be noted that the DFAIR study did not use the capital/labor ratio to measure cap- ital investment and efficiency )
Tables 6.1 and 6.2 summarize our results. Table 6.1 shows that invest- ment, as represented by the capital/labor ratio, is lower for defense firms than nondefense firms over the entire period 1975-1983. In addi- tion, the disparity between these two sectors widened in the early 1980s as nondefense firms increased their investment relative to labor at a faster rate than defense firms.
Table 0!1: Capital/Labor Ratios 1975-1983 1975-79 1980-83 N’ _..--
Defense firms 2 755 2817 2 677 40 Nondefer& firms-
-- 3115 2 956 3 314 60
aN = number of firms reporting capital/labor ratios
Besides checking the capital intensity of defense and comparable com- mercial firms, we also stratified the defense firms by the percentage of total sales represented by government business to examine whether defense firms capital intensity varied with this percentage When we stratified by thirds and compared the capital/labor ratio (table 6 2) and the capital/sales ratio (table 6.3), we found that firms whose govern- ment sales accounting for the largest percentage of their total sales were the least capital intensive Thus, these comparisons raise questions about defense contractor efficiency.
Page 63 GAO/NSIAD-W-60 DFAIR

chapter 6 Defense Contractm Investment and Efficiency
Table 8.2: Capital/Labor Ratio8 for Ddonre Flrm8 1975-1983 1975-79 1980-83 N
Low defense0 2964 3 020 2 894 28
Medium defenseb 1846 1 753 1 9614 s
Hlah defenseC 1468 1 472 1464 4
*These firms’ defense sales are less than one-third of total sales
bThese hrms’ defense sales are between one-third and two-thirds of total sales
CThese hrms’ defense sales comprise more than two-thirds of total sales
Table 6.3 summarizes our calculations for the capital/sales ratio. These results are generally consistent with those from table 6.2; that is, as the percentage of a firm’s defense business increases, its investment declines. Furthermore, defense contractors with more than one-third of their revenues derived from DOD had lower capital/sales ratios than nondefense firms during 1975-1983 The capital/sales ratio for all defense firms combined is higher than for nondefense firms. We believe this is not an appropriate indicator of the relative investment because our sample is dominated by low defense firms-53 out of a total of 84.
TabI) 6.3: Capltal/Saler Ratio8 1975-l 983 1975-79 1980-83 N
Low Uefense 1 0285 10129 1 0480 53 - Medium defense 0 6702 0 6562 0 6877 17
- -. -
High defense 0 5791 0 5966 0 5571 12 ~-~~ -- All defense firms 0 9731 0 9627 0 9860 84 --
Nondefense firms 0 8226 0 8125 0 8352 228
Concl usions Relying on two measures of investment, we conclude that although defense contractor investment has increased over the period 1975-1983, it has lagged behind the corresponding rate of increase for nondefense firms. Therefore, defense firms continue to exhibit low relative invest- ment compared with nondefense firms, and the gap appears to be widening This contradicts DFAIR'S suggestion that the gap is narrowing. Moreover, as the percentage of a firm’s total sales represented by defense increases, its relative investment declines.
Page 64 GAO/NSIAD87-50 DFAIR

Page 56 GAO/NSIADW-5O DFAIR

Conclusions, Recommendations, and Agency Comments
Conclusions The DFAIR report was based on data that was submitted voluntarily by contractors, was reviewed by the contractors’ public accounting firms but not by the government, and was not retained after being summa- rized by Touche Ross and Company. To facilitate and enhance the credi- bility of future studies of defense profit and financing policies, a Profitability Reporting Program should be established to provide verifi- able, auditable data tied to contractors’ financial statements and con- firmed by their independent certified public accountants. These data would be the basis for periodic profit studies. Such studies, done at least every 3 years using appropriate assumptions and methodologies, should provide a sound basis for future changes to DOD profit policy.
We agree with the DFAIR report that contract pricing, financing, and profit policies are related and should be examined on an integrated basis. However, we believe the report inaccurately portrays the compar- ative profitability of defense firms, understates contractor profit ObJec- tives under DFAIR’S proposed weighted guidelines policy, and overstates contractors’ contract financing requirements.
The DFAIR report selected durable good manufacturers, as reported m the Bureau of Census’ QFR, as the group to which defense contractors’ prof- itability would be compared. DFAIR used RQA to measure profitability, and we agree that ROA is the proper measure to use. After analyzing data from 76 contractors, DFAIR concluded that
“profitability for DOD business is very similar to that of durable goods manufac- turers when the abnormal 1980-1983 period is excluded from the comparison ”
DFAIR further concluded that the profit policy (Defense Acquisition Cir- cular 76-23) in use during the abnormal period of 1980433 caused average markups to increase above the expected level by .5 to 1 percent. To remedy this excess, DFAIR structured a profit policy that was b designed to “yield results which are on the average 0.6 to 1 percentage point lower than the results achieved under DAC 76-23.” In essence, this approach was designed to lower profits for defense contractors back to “when they were similar to that of durable goods manufacturers” that is, up to 1979. From our review of data collected by Touche Ross, we conclude that, in terms of ROA, defense contractors were 35 percent more profitable than commercial manufacturers during 1970-79 and 120 per- cent more profitable during the 1980-83 period. In addition, our analysis of publicly available data indicates that defense business was substan- tially more profitable than comparable nondefense firms during the periods of 19751983.
Page56 GAO/NSlAD-87-5ODFAIR

chapter 7 Cmcluaione,Itecmnmendatiom, and Agency Commenta
--.--_ -_- DFAIR implied that a 0.6 to 1 percent reduction in negotiated profits would bring defense contractors into a profitability position similar to that of durable goods manufacturers. We do not agree. Our analysis of available data, indicated that achieving approximate comparability will require a new DOD profit policy that will reduce average negotiated markups by more than 1 percent.
Had DOD adopted DFAIR'S recommended changes to the weighted guide- lines profit policy, it could have resulted in an average profit objective of 12.7 percent. If this 12.7 percent profit objective accurately predicted actual contractor profits and if the weighted guidelines were used on the entire $81 billion in fiscal year 1985 contracts to which they could apply, then DFAIR'S recommendation would have resulted in $972 million in unintended contractor profit.
In addition, had DOD implemented DFAIR'S recommendation to provide contractors with interim/milestone payments and at the same time pro- vide 2 percent of contract cost to reimburse working capital financing costs (part of the 12.7 percent discussed above), and if this recommen- dation were also applied to the entire $81 billion in fiscal year 1985 con- tracts, contractor costs would have been reduced by 1.8 percent, or $1.46 billion.
If DFAIR'S recommendation had been in place during fiscal year 1986, the increase in profits and the decrease in costs could have resulted in $2.43 billion in unintended profits for DOD contractors.
Subsequent to its receipt of a draft of this report, DOD published a pro- posed profit policy. The proposed policy was announced in the Sep- tember 18, 1986, Federal Register and was to become effective January 1,1987. In commentmg on the proposal (see app. IX), we expressed the view that DOD should not implement the new policy until it had access to, and could evaluate, the DOD Form 1499 data for fiscal years 1984 and 1986 and could assure itself that the proposed policy would result in appropriate levels of profit.
On November 14, 1986, DOD published a new interim policy retroactively effectrve on all solicitations issued on or after October 18, 1986. The interim policy- like the proposed policy to become effective January 1, 1987-is designed to reduce profit objectives by 1 percent. The DOD briefing that accompanied the announcement of the initial pohcy stated that this reduction would cause profit objectives to go from 12.3 percent to 11.3 percent. However, recent DOD analysis shows that average DOD
Page 67 GAO/NSIAD-87-50 DFAIR

Chapter 7 Cmncluslone, Recommendationa, and Agency Comments
profit objectives are now about 13.7 percent. Therefore the 1 percent reduction would result in profit ObJeCtiVeS of 12.7 percent-not 11.3 percent.
A goal of a reduction in profit objectives of one percent was sought by DFAIR. That goal has remained consistent in the proposed profit policy promulgated in September 1986, and the more recent interim policy. We are concerned that DFAIR'S methods of estimating ROA led to a significant understatement of defense contractor profitability and DOD’S subsequent actions have addressed a slight disparity in profitability between defense and private sectors when a significant disparity exists.
Recommendation to the We recommend that the Congress establish a legislative requirement for
Congress a Profitability Reporting Program and periodic profit studies.
Recommendations to We recommend that the Secretary:
the Secretary of Dqfense
l initiate, on an expedited basis, new analyses using conventional methods to evaluate profitability;
l based on these analyses make appropriate modifications as soon as pos- sible to the interim policy; and
l develop a means to show in contract negotiations, the effect of govern- ment contract financing (for example rate of progress payments, pay- ment frequency, speed of payment, etc.) and the use of interim/ milestone payments on contractors’ Roes.
Agency Comments In its comments on a draft of this report, DoD generally disagreed with b all of our findings, conclusions, and recommendations saying that we did not give consideration to actions they have taken since DFAIR. They requested that their comments be included as a separate appendix to our final report. DOD'S comments and our evaluation of them are included in appendix I.
We recognize that DOD has adopted an interim profit pohcy. The recom- mendations contained in the draft of this report were pointed toward the DFAIR report. Where information available made it possible, we have
Page 58 GAO/NSIAD-f37-60 DFAIR

-_--_- Chapter 7 Cmwlwions, Recommendations, and Agency Comments
modified our recommendations because of the actions taken by DOD sub- sequent to the issuance of the DFAIR report. We are currently performing a review of the interim profit policy as congressionally requested.
We believe that DFAIR is a very significant study. It collected a significant body of data from major defense contractors. It includes an evaluation of the relative profitability of defense contractors and commercial man- ufacturers and recommendations for major changes to DOD'S contractor profit policy. Since DFAIR was issued, DOD has undertaken additional efforts to develop an improved nou-wide contractor profit policy. We believe, however, that the data collected through the DFAIR study is the best data available to make the comparisons of profitability and should define the objectives of these other efforts. DFAIR should be viewed as the foundation for the current efforts undertaken by DOD. For example, DFAIR stated that profitability of defense contracting and commercial manufacturing was comparable except for the abnormal period of 1980- 83. It is our understanding that DOD'S subsequent efforts use this overall conclusion as a basic premise. Since we do not agree with this conclu- sion, we believe that our analysis of DFAIR and its methodology continues to be germane to DOD'S profit policy decisions.
Page 69 GAO/NSUD-97-60 DFAIU

Comments From the Assistant Secretary of Defense and Our Response
ASSISTANT SECRETARY OF DEFENSE
ACO”I*ITION AtiD LOGlsTlCS
DASD(P) (CPF)
23 ,:, sa6
Mr. Frank C. Conahan Director, National Security and
International Affairs Division United States General Accounting Office Washington, D. C. 20548
Dear Mr. Conahan:
This is the Department of Defense (DOD) response to the General Accounting Office [GAO) draft report entitled “GAO Assessment of DOD’S Defense Financial and Investment Review,” dated July 24, 1986, OSD Case No. 7073, GAO Code 396104.
The DOD generally does not agree with the findings and recom- mendations in the draft report. The Defense Financial and Investment Review (DFAIR) presents an in-depth, objective review of the impact of DOD contract financing, pricing and profit policies, and includes needed reforms to these policies, which should be implemented as soon as possible. The enclosed detailed responses to the findings and recommendations of the draft report set forth the basis for, and support for, the DOD decision to proceed with implementing profit and contract financing policy changes based on the DFAIR recommendations.
In addition, the DOD is concerned with the presentation of factual matters in the report and the total lack of acknowledge- ment of decisions relating to proposed changes in the DOD contract financing and profit policies made by the Deputy Secretary of Defense on May 27, 1986. This memorandum was entered into the Congressional Record during the GAO testimony on DFAIR on June 26, 1986, before the Subcommittee on Legislation and National Security of the Committee on Government Operations. Failure to disclose the Deputy Secretary of Defense decisions is misleading and would cause the readers of the draft report to reach erroneous conclusions regarding both the intent of the DOD, and the actions already taken by the DOD, in reforming its contract financing and profit policies.
The draft report, for example, contains an analysis of the application of interim billings. Subsequent to the DFAIR final report, however, the Deputy Secretary chose not to implement the interim billing procedure. The GAO report also fails to indicate that the Deputy Secretary did not Increase the progress payment rate to 85 percent (as recommended in DFAIR) and chose to not recognize any increase in profit objectives to compensate for leaving the pro ress payment rate at 80 percent (as also recom- mended in DFAIR ‘f .
Page 60 QAO/NSIAD-tW-60 DFAIR

Appendix I Comments From the Aseistant Secretary of Defeme and Our Reqmmee
The Deputy Secretary of Defense directed the Assistant Secre- tary of Defense (Acquisition and Logistics) to form a Joint-Service Implementation Committee (JIG) to implement his May 27, 1986, direction. The DFAIR was one of many sources used by the JIC to develop a new proposed DOD profit policy. This policy, published in the Federal Register on September 18, 1986, includes many sig- nificant changes in the DOD profit policy.
The findings and recommendations are addressed in greater detail in the enclosed comments. The DOD requests that the response be included as a separate appendix in the final GAO report. The DOD appreciates the opportunity to comment on the draft report.
Sincerely,
Page 61 GAO/NSIADM-50 DFAIR

Commenta From the Adstant Becrew of DefenmandOurReqome
DOD’s Detailed Comments and Our Evaluation
Finding A: Use of the Defense Financial and Investment Review CDFAIH) to Evaluate DOD Profit Policy. The GAO identified three aspects of the DFAIR report that relate to an evaluation of DOD profit policy.
(1) The report recognized the interrelationship among contractor invest- ment in working capital, contract financing, and profit policy;
(2) The report relied on return on assets [ROA] to measure comparative profitability; and
(3) The report showed that relevant financial data on defense business could be gathered from a contractor’s segment or division level
The GAO concluded that overall the DFAIR [study] provides a good basis for evaluating DOD profit policy, but that because of major flaws identl- fied in DFAIR (see findings B through E), the DFAIR recommendations are not based on adequate analysis and should not be implemented. The GAO also concluded, however, that the data needed to analyze the profit- ability of Government contractors is readily available and can be obtained without excessive costs if studies are done on a frequent and regular basis. The GAO identified several requirements that should be included in a legislatively required government contractor profit reporting program, and noted that it is presently working on the frame- work for such a program.
DOD response: Partially Concur The DOD agrees that DFAIR recognized the interrelationship among contractor investment in working capital, con- tract financing, and profit policy and provides a good basis for evalu- ating the impact of these policies. The DOD does not agree, however, that major flaws exist in DFAIR, which would preclude the implementation of proposed changes to the profit policy. The DFAIR report is only one item b that was used in determining the proposed changes to the DOD contract financing and profit policies. The proposed changes outlined by the Deputy Secretary of Defense in his May 27, 1986, memorandum are being implemented by a Joint-Service Implementation Committee, which is considering inputs from many sources, including the DFAIR report While the decisions in the May 27, 1986, memorandum are similar to, and based on the DFAIR recommendations, other considerations are being addressed in the policy revisions.
The DFAIR recommendations are based on adequate analysis and should be implemented as soon as possible. The financing recommendations of the DFAIR report have either been published for public comment in the
Page62 GAO/NSIAD87-SODFAIR
.

Appendix I Commenta From the Atwistant Secretary of Defense and Our Response
Federal Register or already implemented. All financing related recom- mendations will be implemented by the end of calendar year 1986
A proposed rule relating to profit policy was published for public com- ment in the Federal Register on September 18,1986, with a proposed implementation date of January 1, 1987 The DOD responses to findings B through E set forth the basis for, and support for, the DOD decision to proceed with implementing the contract fmancing and profit policy changes based on the DFAIR recommendations.
Our Evaluation. We continue to believe that the DFAIR report does have value. However, we also believe that DFAIR'S comparisons of the profit- ability of defense contracting and commercial manufacturing IS flawed and should not be used as the basis for developing a profit policy.
We recognize that DOD has, despite concern expressed in our draft report and in a report issued by the House Committee on Government Opera- tions, continued with plans to develop and implement a new profit policy based on these erroneous comparisons.
Finding B: DFAIR Understated the Profitability of Defense Contracting. The GAO reported that DFAIR used the ROA method to determine con- tractor profitability at the segment level, which the GAO agreed is an appropriate method. The GAO found,however, that DFAIR made two sig- nificant assumptions in its calculations which dramatically reduced the RaA of defense contractors:
(1) DFAIR included in the contractor’s asset base the amount of inventory owned by the Government through progress payments; and
(2) DFAIR developed its own definition of profit called “economic profit.”
The GAO disagreed with the DFAIR conclusion that profits on defense con- tracts were similar to those of commercial manufacturers except during 1980-1983. Based on its analysis, the GAO found that Defense contrac- tors were 36 percent more profitable than commercial manufacturers during 1970-1979, and 120 percent more profitable during 1980-1983. Further, the GAO found that [publicly] available data indicate that defense business was substantially more profitable than comparable non-defense firms during 1975-1983. The GAO also cited an August 1985 Navy study as a further indication that contractor ROA for Government business was higher during 1977 to 1984 than for commercial busmess.
Page 03 GAO/NSLAD-S7-50 DFAIR

Appendix1 Comments From the Assistant Secretary of Defense and Our Response
The GAO concluded that DFAIR'S methods of calculating R~A led to a sigmf- icant understatement of contractor profitability, which in turn caused DFAIR to address its recommendations to a slight disparity in profit- ability when a significant disparity actually exists.
DOD response. Nonconcur. The DFAIR report presented a full range of data using traditional financial measurement techniques to evaluate the prof- itability of both defense and non-defense firms (see pages V-26 through V-42 of the DFAIR report). The DFAIR report also presented a full analysis of these results and supplemented them to determine and explain the impact of the DOD contract financing, pricing, and profit policies on defense contractors. The supplemental analysis included in the DE'AIH report was necessary to address the different accounting methods, financing practices, and pricing provisions of commercial and defense manufacturers. As the GAO well knows, the use of generally accepted accounting principles applied consistently period to period ensures an ability to compare -specific firm’s financial results from one period to another, but does not ensure any ability to compare like firms even m the same period.
The DFAIR report results ‘that were based on typical techniques’ were very similar to those determined by the GAO and the August 1986 Navy study. These results, however, do not provide a true comparison of defense and non-defense firms (or of the firms included in either cate- gory) due to their differing accounting methods, financing practices and pricing provisions. The “economic profit” concept used in the DFAIR report was to truly compare the profitability of defense and non-defense firms by removing the differences discussed above. It does not under- state profits, but establishes comparable profitability values. A true analysis of comparable defense and non-defense firms would not be pos- sible if the difference were not removed. b
The DFAIR recommendations, as modified by the Deputy Secretary of Defense on May 27, 1986, make needed reforms to the DUD contract financing and profit policies which should be implemented and are sepa- rate from, and independent of, an argument over “profitability” measures.
Our Evaluation. DOD did include the conventional data developed by Touche Ross and Company in one chart in its report. The data, however, was combined with 6 years of data from an earlier DOD study. (See chapter 3 of this report.) In addition, the graphs including the data were physically separated from the conclusionary graphs that were based on
Page 64 GAO/NSIAB87-6ODFAIR

-- - Appendix I Chnments From the AesIstant Secrehry of Defense and Our Response
other data. The ROA data developed by Touche Ross was not used in developing the graphs and analysis leading to the conclusion that “these measures [economic profit/assets] demonstrate that profitability for DOD business is very similar to that of durable goods manufacturers when the abnormal 1980-1983 period is excluded from the comparison.” Therefore, in our view, DFAIR does not present a full analysis or draw conclusions based on the unadjusted data developed by Touche Ross. The aggregated data, which showed defense contracting was 76 percent more profitable than commercial manufacturing for the 9 year period 19751983, was so obscured by DFAIR'S adjustments that the final figures fail to provide any meaningful or in DFAIR'S words, “true” comparison.
We cannot agree with DOD'S position that the use of generally accepted accounting principles applied consistently does not provide the ability to compare like firms. The return that an investor expects to receive for the assets invested certainly must be viewed on a comparative basis when deciding where to commit one’s assets. Investors continually make these comparisons using financial statements based on generally accepted accounting principles.
DOD states that economic profit concept was necessary to truly compare the profitability of defense and nondefense firms by removing the dif- ferences in accounting methods, financing practices, and pricing provi- sions. Although it is true that accounting methods, financing practices and pricing provisions may vary from company to company, we fail to see the merit in DOD'S economic profit concept. DOD uses the defense con- tractors’ (and commercial manufacturers’) figures for sales, allowable and unallowable expenses, fixed assets, inventories, accounts receivable, and progress payments. No adjustments are made to these figures to address the typical accounting method variations that cause differences m asset valuation or the timing of revenues or expenses. The only adjustments DOD makes is to increase the assets by the amount of prog- ress payments and then adjust interest expenses to try to show imputed revenue and expense. We continue to believe that DOD'S economic profit calculation is unnecessary and that DOD should use conventional analyt- ical techniques m its profitability calculations.
We also continue to believe that DFAIR'S methods of calculating ROA led to a significant understatement of defense contractmg’s profitability and that DFAIH addressed its recommendations to a slight disparity in profit- ability when a significant disparity exists. We are concerned that DOD'S new profit policy proposals may use the DFAIR calculations as the starting point for developing the objectives of the new pohcy.
Page 65 GAO/NSIADW-50 DFAIR

Appendix1 Commenta From the Assietant Secretary of Defenw and Our Response
Finding C: DFAIR Recommended Changes Will Not Reduce Unintended Increases in Profit Negotiation Objectives. The GAO reported that, because DFAIR determined that contract profit negotiation objectives were higher than intended from 1981 and 1983, it recommended several changes in the weighted guidelines policy. According to the GAO, the DFAIR believes its recommendations would reduce profit objectives from 12.3 to 11.6 percent of total cost, Based on its analysis of DFAIR, how- ever, the GAO concluded that the probable profit negotiation objectives are understated for three primary reasons:
(1) Negotiation objectives at the lower end of the possible ranges of indi- vidual weighted guideline factors were used;
(2) The effects of the DFAIR recommendation to include shipbuilding under its proposed profit policy were not considered; and
(3) The policy recommended is very sensitive to the mix of contract types, and is based on an unrealistic mix of contract types.
The GAO further concluded that not only would profit objectives not decrease under the DFAIR recommendations, but in fact could increase to as much as 12.7 percent of total cost.
DOD response: Partially Concur. The DFAIR changes m the profit policy are not based on factor values at the lower end of the ranges and are not based on an unrealistic mix of contract types. All numbers involved in the DFAIR analysis were based on the actual data included in the DOD Form 1499 (Report of Individual Contract Profit Plan) for Fiscal Years 1981- 1983. Furthermore, while shipbuilding contract data was evalu- ated separately in DFAIR to prevent distortions, the DOD profit policies will encompass shipbuilding.
The individual factors used to evaluate the impact of the proposed profit pohcy changes were derived from actual results of over 6,000 DD Form 1499 submissions over a 3 year period The framework of the new policy will be based on the same trends developed from the historical data; i e., individual factors and ranges of values will be structured to recognize contracting officer tendencies to pick values near the midpoint of the range. The revised profit policy will change historical patterns of assigning profit factors by establishing a normative value for each factor. The impact of shipbuilding will be included in any new policy developed by the DOD. The GAO must remember that the DFAIR report served only as the basis for the Deputy Secretary of Defense’s decisions
Page 88 GAO/NSIAD-S7-60 DFAIR

‘.
Appendix I Commenta From the Asebtant Secreturv of Defense and Our lteqmme
on financing and profit policy reforms in the DOD. The decisions included in the May 27, 1986, decision memorandum contain direction to reduce overall profit objectives even more than the recommendations in the DFAIR report. In addition, the Secretary of Defense has already taken action, in April 1986, to offset the .6 to 1 percent unanticipated increase in profit objectives. The combination of actions already taken by the DOD and the decisions included in the May 27,1986, memorandum will cause a significant reduction in defense contract profits.
The DOD agrees that the profit policy is sensitive to the mix of contract types; however, the GAO used contract mix statistics generated from a DOD data base that includes all DOD contract awards. The vast majority of contract actions included in this data base do not even use the Weighted Guidelines Method to determine profit objectives and do not include negotiated profits. The DFAIR Report used the WD data base for contracts that used the Weighted Guidelines Method to determine profit objectives and then negotiated profit based on those objectives. It is inappropriate for the GAO to conclude that the DFAIR results are incorrect based on comparisons with a noncomparable data base. Furthermore, if the fixed price percentages were as high as the GAO indicates, the average profit uob-wide would have been higher because the Weighted Guidelines Method produces higher profits on fixed price type contracts to reflect the higher contractor risks involved in those contracts.
Our Evaluation. We continue to believe, for the reasons stated in chapter 4 of this report, that the profit objectives resulting from DFAIR'S pro- posed policy could range as high as 12.7 percent of total cost. We used DFAIR'S DOD Form 1499 data base for our review. Our analysis of the data shows that, contrary to DOD'S statement, contracting officers have his- torically awarded profit values at the upper end of the possible profit ranges for the cost elements in the weighted guidelines method, that the shipbuilding data has a large effect on the results of the profit policy, and that the profit policy is sensitive to the mix of contract type.
The historic data derived from the DOD Form 1499 data base shows that contracting officers tend to adopt values higher than the midpoint range. DFAIR, for no explainable reason, reduced those values by 26 per- cent when developing the DFAIR proposed policy. This reduction caused the values to fall in the lower end of the possible range which contra- dicts the pattern shown by the actual data.
Page 67 GAO/NSIAD-87-60 DFAIR

-- Appendix1 Comments From the Asdatnnt Secretary of Defense and Our Response
DOD says shipbuilding will be included in any new policy it develops. This approach is consistant with a DFAIR recommendation that ship- building be included m the overall policy. We believe, however, that DFAIR should have included shipbuilding in its evaluation of the effects of its proposed policy.
DOD agrees the DFAIR proposal is sensitive to the mix of contract types but criticizes the contract mix we used. As indicated in this report, we believe the DOD Form 1499 data base did not provide a representative contract mix. We believe the DOD PO3 report provides a more appro- priate projection of the total of fixed price contracts. We do not believe DOD can substantiate their assertion that “the vast majority of contract actions do not even use the Weighted Guideline Method to determine profit objectives....“. FAR, section 16.902(a) provides that contracts over $100,000 shall use a structured weighted guideline method approach. DOD’s PO3 report for 1986 indicates that contracts over $100,000 repre- sent approximately 96 percent of the Prime Contract Awards made by DOD. We believe this is a more valid sample to use than the DOD 1499 data base. DFAIR acknowledges that the DOD 1499 files are inadequate and contains a recommendation that the system needs to be strength- ened. Our objective in that section of our report was to point out this sensitivity and to indicate its potential effect. We believe DFAIR should have recognized, and disclosed, the possible increase in profit objectives that could result from a change in contract mix.
We assume that the “action taken by the Secretary of Defense in April 1986 to offset the .6 to 1 percent unanticipated increase in profit objec- tives” was the reduction of progress payments from 90 percent to 80 percent which was referred to in the letters sent to Senator Roth and Congressman Brooks on this same subject. DOD answers this point in its own DFAIR report when it cited a DOD report on progress payments as follows:
“Although some short-term reductions m outlays could be achieved by either low- ering progress payment rates or delaying payments, concomitant and very achiev- able price increases would cause the out year outlays to be substantially higher.”
As mentioned earlier DOD has published a new profit policy proposal which makes significant changes to the weighted guidelines method pro- posed in DFAIR. It is important that any new policy be evaluated indepen- dently to ensure that the desired profit goals are achieved. We will evaluate DOD’S latest weighted guidelines method profit proposal.
Page 68 GAO/NSIAD47-50 DFAIR

Appemdlx I Chnmenta From the Asbtant Secretary of Defense and Our Response
Finding D: DFAIR Recommendations Could Overcomnensate Contractors for Financing Costs. The GAO reported that in evaluating contractor financing costs, DFAIR developed a “typical” contract model for a S 10 million contract. From this model, the GAO noted that DFAIR concluded that contractors historically incurred a cost equal to two percent of the total contract costs to finance their working capital requirements. Based on its analysis, however, the GAO concluded that this view is question- able for three reasons:
(1) DFAIR used only a rather narrow sample of 12 contracts with 6 con- tractors to develop the model;
(2) Actual data collected by Touche Ross indicate DFAIR overestimated contractor’s financing costs; and
(3) DFAIR failed to recognize the impact of a related recommendation that would substantially lower contractors’ working capital financing costs.
According to the GAO, related recommendations, particularly the estab- lishment of interim acceptance payments, would effectively provide almost all of contractor working capital needs In addition to making interim payments, however, the GAO noted that DFAIR recommended that contractors get an additional two percent of contract costs as profit to cover working capital costs. Usmg the DFAIR'S model contract with costs of $10 million as an example, the GAO concluded that a contractor would get $200,000 m actual profit as compensation for its working capital financing costs when those costs had been substantially reduced by interim acceptance payments, thus resulting in overcompensation to the contractor
DOD resnonse: Nonconcur. The purpose of the simulation model used in DFAIK was to establish a baseline for evaluation purposes where no actual data base exists and, to establish the relative impacts of the inter- relationships of the variables and their values in differing circum- stances. The relative differences of the impact of contract financing would be the same whether the baseline was established on actual, hypothetical, or estimated data. In other words, the model was designed to measure changes from a baseline, rather than the baseline itself, and would not have varied significantly using different baselmes. In fact, subsequent to DFAIR, the same model was applied to other contract data (different and more contracts than used in DFAIR) and the model pro- duced virtually identical results. As long as all other policy changes incorporate the baseline amount and reflect the relative change rates
Page 69 GAO/NSIAD-87-50 DFAIR
Appemdix I Canmenta From the Amintant &xre@uy of Defense and Our Response
among variables, the simulation approach guarantees the consistency and validity of the relationships. The proposed profit policy changes issued on September 18,1986, incorporated the baseline amount and reflect the relative change rates among all variables,
The actual data collected by Touche Ross included interest expense. The GAO analysis reflects a belief that interest expense reflects the total cost of all capital required by a contractor and does not account for the cost of equity financing. Interest expense reflects only the cost of borrowed (debt) capital. The DFAIR simulation model computes a cost of working capital that is indifferent to whether the contractor borrows the capital or provides working capital from equity. The GAO approach does not rec- ognize such equity financing, and is not based on an accounting concept shared by others who evaluate the cost of capital in either a defense or a non-defense firm.
In addition, the GAO analysis of the impact of interim billings on contract financing did not apply all of the criteria stated in the DFAIR report (i.e., “where there are more than three years from contract start to first delivery-” the GAO example has the first contract delivery before the three year point). The GAO analysis also does not recognize the more stringent criteria that would be applied to restrict the use of interim bill- ings. On the other hand, the GAO assumed that interim billings (based on less stringent criteria) would apply to all DOD contracts when that is not true. The GAO also states that DFAIR includes an “additional” 2 percent of profit for working capital when, in fact, the amount to be recognized for working capital was removed from the contract risk factor and results m a net impact of 0 percent, not +2 percent. Finally, the Deputy Secre- tary of Defense did not implement the DFAIR interim billing recommenda- tion. Instead, the Deputy Secretary of Defense chose to restore milestone billings on a very restrictive basis (i.e., high dollar value, deliveries do b not occur for more than three years after start of contract, limited to significant, measurable events).
Our Evaluation. In evaluating contractor financing costs, DFAIR devel- oped a “typical” contract model. From this model, it concluded that con- tractors historically incurred a cost equal to approximately 2 percent of the total contract cost to finance their working capital requirements. We question the validity of this conclusion because historic data mdicates that these costs are less than 2 percent. Moreover, in devising methods to reimburse contractors for the 2 percent factor, DFAIR failed to recog- nize the effect of related recommendations that would lower contrac- tors’ working capital financing costs.
Page 70 GAO/NSIAD-S7-50 DFAIR
- ___ --_- - AppendLw I Comments From the Aesietant Secretary of Defense and Our Response
DOD indicates that their model was designed to show the interrelation- ships between variables and that the results would not have varied using different baselines. However, since the DOD profit policy proposals are supported by conclusions of the DFAIR study, we believe that the model drawn from only 12 contracts from 6 contractors has a major impact on determining the baseline of 2 percent used in the proposed policy. In this context, we continue to disagree with the results of DFAIR’S simulation model. Actual data shows interest costs are not as high as those calculated using DFAIR’S model. In addition, if the model had taken interim/milestone payments into consideration then the costs calculated using the model would have been substantially lower.
Contrary to DOD’S comment, our draft report did recognize that some working capital could be financed through equity. Although we doubt that a substantial portion of a firm’s short term capital needs-working capital -would routinely be financed through a long term source- equity-we recognize that financing of this type probably occurs to some extent and we have recognized this in chapter 6 of our report.
DOD states that the Deputy Secretary of Defense implemented milestone billings rather than interim billings. DOD’S contention that the Deputy Secretary of Defense chose not to implement interim billings is mis- leading. The DFAIR study does not differentiate between these two pay- ment plans, as shown in the following recommendation quoted from DFAIR.
“4 MIlestone or interim acceptance payments should be permitted on large dollar contracts where there are more than three years from contract start to first delivery If the above markup policy changes are made, a milestone or interim acceptance policy should be established to allow contractors to receive payment, including some portion of markup or fee, based on physical progress This is neces- sary to prevent undue financing burden on the contractor and to avoid unduly high contract markup Mllestone/Intenm acceptance should be*
a Scheduled to commence not earlier than six months after contract start.
b. Based on clearly identifiable events whose completion can be verified and whose costs can be reasonably estimated.
c. Should occur not more frequently than monthly and preferable on a quarterly basis ”
From the wording of this recommendation, it appears that milestone and interim acceptance payments are the same thing, and merely dropping
Page 71 GAO/NSIAD-67-50 DFAIR

Appendix I Comment8 From the Aeeik3tant Secretary of Defense andOurResponee
the name “interim acceptance” does not constitute a change in the recommendation.
DOD stated that our analysis of interim billings is incorrect because they would only be applied to contracts where these are more than 3 years from contract start to first delivery. Our analysis consisted of applying the DFAIR milestone/interim acceptance payment recommendation to DFAIR'S typical contract model which has its first delivery in the 34th, rather than the 36th, month. We were incorrect and have changed our example to correct this error. This change, however, did not have any significant effect on the results of our analysis.
DOD says that we failed to recognize the stringent criteria that would be applied to restrict the use of these payments. The criteria, however, do not appear to be very restrictive. In fact, the criteria appear to be very similar to the characteristics of DFAIR'S typical contract. We believe that the high dollar value criteria is very subjective and would indicate that these payments would apply to only significant contracts. The 3 year criteria nearly matches the typical contract used in the DFAIR report. We believe that if that length is typical, then it should not be considered restrictive. The significant event payment trigger is limited to no more “frequently than monthly or preferably on a quarterly basis.” We believe that milestones that can occur monthly in a long-term contract should not be classified as restrictive.
DOD indicates that our assumption that interim billings would apply to all contracts is incorrect. We did not assume that interim billings would apply to all contracts, however we have modified our recommendation in this area.
A Finding E: Capital Investment by Defense Contractors. The GAO reported that capital investment by defense contractors is of great interest because it can have a substantial impact on efficiency. The GAO reported that, beginning in 1976, Defense contracting policy was changed to over- come existing investment disincentives to defense contractors. According to the GAO, DFAIR analyzed the effect of these changes and concluded that the defense sector has become more capitalized over the last 9 years. Based on its own analysis, the GAO agreed that defense con- tractor investment has increased during the period 1976 to 1983; how- ever, the GAO found that when growth in investment is compared to sales growth, defense contractors’ investment growth has lagged behind the rate for non-defense firms. The GAO pointed out that its finding is
Page 72 GAO/NSIAD+37-50 DFAIR

Appendix I Commenta F’rom the Aaaistant f3ecretuy of Defense and Our Reeqmtwe
consistent with that of Logistics Management Institute (LMI), a consul- tant to the DOD on preparation of the DFAIR report. While acknowledging the overall increase in defense contractor investment, the GAO concluded that contrary to DFAIR, defense firms continue to exhibit low relative investment when compared to non-defense firms and the gap appears to be widening.
DOD response: Partially Concur. The GAO agreed that defense contractor investments have increased during the 1976 to 1983 period, which was the primary DFAIR finding in the investment area, and the DOD agrees with this aspect of the finding. The DOD, however, does not agree with ultimate GAO conclusions. The GAO conclusions are based on a compar- ison of growth rates in the Facilities Capital Employed to Sales ratio over time. This comparison is not a meanmgful way to compare defense and non-defense firms, because of the much higher volatility in the behavior of the ratios for the non-defense durable goods manufacturers, caused largely by changes in the sales base rather than the [Facilities Capital Employed] value. As pointed out in the LMI report, which is part of the DFAIR report and included as an appendix, “the behavior of the ratio of facilities capital to business base in the commercial sector is highly sensitive to the period selected for this computation.” Exhibit 7 (Page VI-12) in the DFAIR report shows that the durable goods manufac- turer [Facilities Capital Employed] to sales ratio is much more volatile than the defense sector over the 1970 to 1983 period and, in fact, would show a net decline between 1970 and 1983 while defense businesses show a net increase between those years.
Our Evaluation. We agree with WD that other measures are preferable to the capital to sales ratio when evaluating a company’s capital invest- ment. Reference was inadvertently made to capital to sales ratio anal- ysis in the executive summary of our draft report. This has been corrected. Our conclusions, however, are based on our analysis of capital to labor ratios, not capital to sales ratios. In chapter 6 of this report, we include two tables that present the capital to labor ratios for defense and nondefense firms. These tables show that nondefense firms have increased their investment relative to labor faster than defense firms and that those firms with a higher percentage of defense sales to total sales have lower capital intensity
We also included one table that addresses capital to sales ratios. The overall ratio showed-for our sample- that defense firms had a higher capital to sales ratio than nondefense firms However, as discussed in
Page 73 GAO/NSIAD-S7-60 DFAIR

Appendix I Commenta Ihm the AmLtant Secretary of Defeme and Our lbsponae
chapter 6 of our report, we believe that this is not an appropriate indi- cator of relative investment because our sample is dominated by firms with a low percentage of defense business, and as the percentage of the sample firms’ business derived from defense declined, the capital to sales ratio increased. (See table 6.3.)
Recommendations Recommendation 1. The GAO recommended that the Congress establish a legislative requirement for a Profitability Reporting Program and peri- odic profit studies.
DOD response. Nonconcur. The DOD does not agree that any convincing evidence is now available to support the GAo-recommended program and studies. The GAO, however, is performing a separate study of these issues, and proposes to collect substantially more information than the DOD currently receives on a routine basis. The information, for example, will include data on non-defense operations, which the DOD does not cur- rently have access to on a routine basis. The GAO review will also address the cost of a profitability reporting system. The DOD will review this GAO study when it is completed and will support a reporting system if one is shown to be beneficial and cost effective.
Our Evaluation. At this time DOD does not have a mechanism to regularly and routinely collect the data necessary to evaluate the profits defense contractors realize from DOD'S profit policies. Previous DOD profit studies have been based on inconsistent evaluation of unverified data, volun- teered by contractors willing to participate; many contractors refused to support DOD data requirements. To build more credibility into future profit studies, we believe such data should be regularly collected and analyzed. Consequently, we see the need for a legislative requirement for a Profitability Reporting Program and periodic profit studies which I
we believe are necessary for an equitable DOD contractor profit pohcy. We recently released an exposure draft outlining our profit reporting proposal.
Recommendation 2. The GAO recommended that the Secretary of Defense not implement the DFAIR report’s recommendations that are based on the DFAIR profitability analysis.
DOD response. Nonconcur. While differing opinions about profitability measures will continue, they should not be the basis for delaying needed action when the only disagreement concerns the extent of the actions. The proposed policy changes outlined m the Deputy Secretary’s May 27,
Page 74 GAO/NSIAD-S7-60 DFAIR

Appendix1 Comment4 From the heietant Secretary of Defetwe and Our Reaponae
1986, memorandum can be clearly and objectively evaluated and will produce reductions in the objective profit levels on all types of DOD con- tracts, which the DOD and the GAO agree are needed. The DOD, therefore, intends to continue implementing its proposed changes by January 1, 1987.
Our Evaluation. Because of the actions taken by DOD subsequent to the DFAIR report we have deleted this as a separate recommendation. It is combined with the recommendation to initiate a new analyses using con- ventional methods to evaluate profitability.
Recommendation 3. The GAO recommended that the Secretary of Defense rescind Defense Acquisition Circular 76-23 and, on an interim basis, reinstate the policy in effect as a result of “Profit 76”-Defense Pro- curement Circular 76-3.
DOD response. Partially Concur. The DOD agrees that Defense Acquisition Circular (DAC) 76-23 should be rescinded and has developed a replace- ment policy, which was published in the Federal Register on September 18, 1986. The DOD does not agree, however, that Defense Procurement Circular 76-3 should be reissued on an interim basis. The Deputy Secre- tary’s May 27, 1986, direction and the proposal published in the Federal Register on September 18, 1986, reflect more current and meaningful policy and should be adopted as quickly as possible.
Our Evaluation. Because of the actions taken by DOD pursuant to legisla- tion, we have deleted this as a separate recommendation. It has been combined with the recommendation to make appropriate modifications to the interim profit policy based on analyses using conventional methods to evaluate profitability.
We have not yet completed our evaluation of DOD'S profit policy direc- tion contained in the May 27, 1986, memorandum (see app. VIII.), pro- posal printed in the September 18,1986, Federal Register, or the interim policy issued on November 14,1986. We plan to report the results of our evaluation as soon as possible.
Recommendation 4. The GAO recommended that the Secretary of Defense initiate, on an expedited basis, new analyses using the aggregated data developed by Touche Ross but using conventional methods to evaluate profitability. The GAO further recommended that these analyses give special emphasis to incentives for investment since the DOD profit policy
Page 76 GA0/NSLAD-87-50 DFAIR

Appendix I Commente From the A&&ant Secretary of Defense and Our Response
in effect before the issuance of Defense Acquisition Circular 76-23 may not adequately encourage investment.
DOD respoo. Nonconcur. The DFAIR report used conventional methods to evaluate profitabihty using the aggregated data developed by Touche Ross (See (DFAIR report] Exhibit 14, Page V-32). The contractors’ dif- fering accounting methods, pricing practices, and financmg methods required additional analysis beyond the conventional approach (See DOD position on finding D). The DFAIR report supplements the conventional methods to evaluate and demonstrate the impact of DOD financing, pricing, and profit policies, thereby permitting a true comparison between non-defense and defense business profitability
Our Evaluation. As discussed earlier, DFAIR'S additional analysis does nothing to resolve the inconsistencies m accounting data. We see no basis for DOD'S statement that its methods provided a “true comparison” between nondefense and defense business profitability. In our view, DFAIR'S adjustments obscure the conventional method’s clear message- defense contracting was, from 1976 to 1983, significantly more profit- able than commercial manufacturing.
The DFAIH policy addresses a 1 percent reduction in profit objectives which is based on DFAIR'S unique profitability calculations. We continue to believe that DOD should use conventional analyses to accurately deter- mine the relative profitability of commercial and defense business. The results of those analyses should be used to determine the appropriate profit objective to be awarded under DOD'S profit policy proposals.
Recommendation 5: The GAO recommended that the Secretary of Defense develop a means to show, in contract negotiations, the impact of Gov- ernment contract financing (for example, rate of progress payments, A payment frequency, speed of payment, etc.) on contractors’ [RQA].
DOD response. Nonconcur. [RQA is a financial balance sheet concept. The GAO recommendation would require implementation on a contract-by- contract basis, which would be neither possible nor practical. If the GAO believes a contract-by-contract evaluation of ROA is possible and prac- tical, the DOD would be willing to consider such an approach if the GAO would provide its methodology and the details.
Our Evaluation. DOD selected ROA to compare the profitability of defense contractors with that of comparable durable goods manufacturers. We agree with that selection. DOD also has opted to retain the weighted
Page 76 GAO/NSIAD-87-50 DFAIR

Appendix I Comment8 From the Au&ant Secretary of Defense and Our Response
guidelines as the method of implementing contract/profit negotiations. We also believe this is the best approach for that activity. The R~A con- tractors achieve depends to a large extent on the contract pricing, profit, and financing arrangements agreed to during negotiations. Data on the existing weighted guidelines forms- and the weighted guidelines forms included in the new DOD profit policy proposal-is concentrated on cost, profit, and cost of money. The treatment of contract financing is limited to cost of money and an obscure reference to a working capital adjust- ment. No attention is given to the significant contract financing factors such as amount of progress payments, frequency of progress payments, timing of progress payments, timing of delivery billings, or interim/mile- stone billings.
DFAIR pointed out several times that contract financing can have a signif- icant effect on a contractor’s ROA. In its comments on our draft, DOD reit- erated this view. We believe that those negotiating contracts for the government should be provided the tools to be able to visualize in one negotiating document, preferably the DOD 1547, Record of Weighted Guidelines Method Application, the entire contract scope, including cost, profit, and financing arrangements. All of this related data could be translated into a nominal ROA for the contract. This RoA computation would provide the negotiator some general idea of the profitability that would result from the contract configuration. Without this added evalu- ation, DOD'S negotiators have no reliable overall measure of negotiated contract profitability.
We continue to believe that all aspects of contract financing should be considered when a contract is negotiated. Allocations of fixed assets are now done through the Cost Accounting Standard 414 formula. Alloca- tion of working capital could be made through the formula proposed in DFAIR. Considering the composite asset base along with financing factors and the profit obJective would provide an indication of the potential ROA of the contract.
Recommendation 6. The GAO recommended that the Secretary of Defense severely limit the use of interim payments to prevent overcompensating contractors.
DoD response. Nonconcur. The DOD does not agree that the use of interim billmgs would result in “overcompensating contractors” (See DOD response to fmdmg D). Interim billings are not, however, included in the May 27, 1986, Deputy Secretary of Defense direction.
Page 77 GAO/NSIAD-87-50 DFXIR

Chnmentu From the Aachtant Secretary of Defense and Our Reapoxme
Our Evaluation. We have deleted this as a separate recommendation. It has been modified and incorporated as part of the recommendation to show in contract negotiations the effect of government contract financing.
Recommendation 7. The GAO recommended that the Secretary of Defense clearly describe the relationship between interim payments and the working capital profit factor in the proposed profit policy, and reduce or eliminate the working capital profit factor when interim payments are provided.
DOD respoo. Nonconcur. See the DOD response to Recommendation 6.
Our Evaluation. See our response to recommendation 6.
Recommendation 8. The GAO recommended that the Secretary of Defense, using actual data, evaluate DFAIR'S projections of contractor financing costs.
DOD respox. Nonconcur. Actual data was used to establish the simula- tion model that developed DFAIR estimates of contractor financing costs. The simulation approach would provide the same relative impact of all the selected variables no matter what data was used to establish the baseline. The simulation approach was necessary since there is not a data base to evaluate the impact of changes and relationships among the important variables associated with DOD'S financing policy. The key in using the simulation approach is to use a baseline, and then evaluate all variables around the baseline. Using the baseline to establish policy ensures that the relative changes will be the same regardless of the indi- vidual conditions. This was done during the development of the pro- posed DOD profit policy, which was published in the Federal Register on b September 18,1986.
Our Evaluation. We have deleted this recommendation since we have been congressionally directed to conduct a review of this subject.
Page 78 GAO/NSIAD-87-60 DFAIR

Appendix II
R&quest Letter Dated April 3,1984, From the Chairman, Senate Committee on Governmentail Affairs
April 3, 1984
The Bonor8ble Ch8rlee Boweher Camptroller Oenrr81 0. 3. Genrrbl Aoeountlng ofrioe 401 CJ Street, N. U. Wuhlngton, D.C. 20458
Debr Nr. Boweher:
he you know, my Committee ha8 been holding 8 eerie8 or overelght he8rlnge on the Defense Depbrtment'e management of the 8oquleltlon proaeee over the last two yebre. There are severe1 mbttere conaernlng the department's caeh man8gement practicer whloh h8ve been or aoncem to the committee, in psrtlcular It8 deoleione to r8lee progreee payment ratee, ralee threeholde for required oertlrla8tlon of coat or pricing datr and for defeetlve prlolng 8udlte under the Truth-In-Negotlatlone Act and continue the praatloe of p8ylng contraotore for acorued vacation eoete months md even year8 before thoee vaoatlone are taken by aontr8ator employear. E8oh OS there practices reeulte In the 1088 to the government of hundred8 of milllone of dollar8 and I h8ve repe8tedly asked the Defenee Department to ahange It8 pollaler in thee0 areae. The Qraoe Commleelon ha8 aleo reviewed the efreote of higher progreee payment rate8 md hae reoommended th8t the Department low6r the r&tee back down.
My reoo~end8tlone to the Defenee Department to ah8nge lte pollalee in there three area8 hbve not been 8ooeQted but recently the Dep&rtoent lnfornred me th8t it would be eonduoting a study on oontrbat prlolng, finanoing 8nd QrOrit polloy which would, among other thin/l, review the effWie of higher progreee p8yment rater 8nd l 8rly p8ymente of aocrued vao8tlon ooetr. I wee lniormed th8t the l tudl would al80 review the orfeat of ooet ~llou~blllty on prielng 8nd QrOrit, the relatlonehlp 0r aontr8ot prialng to o8Qlt81 lnvertoent end the uee of prlolng tQ rotlvbte contreotora to find eomt l tllolenoler in their operation@.
There h8e not been a ooaprohenelve review of derenee oontreot pbymnt end QrOrit pollole~ l lnoe 1976 end I believe the etudr ournntly beio( uadortbkoa br the Dofenee bepertment on there utter8 will gre8tly effeot ouh memgement 8nd aontr8ot rIILarnOin@ goll0le8 In the future. Beo8u.e of the l xperulre of
Page 79 GAO/NSIAD-87-60 DFAIR

Appendix II Request Letter Dated April 3,1984, From the Chairman, Senate Committee on Govemmental Affairs
the Oener41 Aooountlng Offloe In ruoh m4tter8, I am requertlng that you evaluate the adequaoy of the rtudy, the v~lldlty OS It8 finding8 and th8 4pproprl4tene88 of It8 reoomend4tlon8 and report your rindingr to m8 88 Boon 4s your ev8lwtlon 6t the D8partmwt'r study 18 complrted. I would antlolpate that OAO would monitor the rtudy 88 it proceed8 and review It8 methodology and rupportlng document4tlon in ordhr to provide your tier8 on the Department'8 report.
I 4ppr4014t4 your attention t0 thl8 request. Plea80 nOtIf Hr. Link Hoeulng or my rtaii at 224-4751 when you initi4te the work 4nd k88p him inrOtmed OS pour progrerrr.
Willis V. Roth, Jr. -. _
Page 80 GA0/NSIAD-8740 DFAIR

Request Letter Dated September 17,1985, From the Chairman, House Committee on Government Operations
I
, I
I
,,,NCTY Wk7” CONGRESS
iDm,rrf~fi of the Unitlrd $tates tmse of Rqmientanoes
COMMITTEE ON GOVERNMENT OPERATIONS 2167 Rb.YSURN HOUsr OrrIcE BUlLOlNO
WAsl4Il4cTon, DC 20616
September 17, 1985
The Honorable Charles A. Bowsher Conptrcller General General Accounting Office Washinqton, D.C. 20548
Dear General:
In June 19E5. the Defense Department, after a 17-month study, issued a report on its contract pricing, financing and profit policies. The Defense Financial and Investment Review (DFAIR) report generally concludes that the Department's current policies concerning these areas are (1) balanced cconomlcally, (21 protecting the taxpayers' interests, and (3) enabling U.S. Industry :o achieve an equitable return on Cefense business. It does, how- ever, Vflakc recommcndatjons which are a;mnd at refining these policies to bring them more In line with today's economic environment.
In view of the recent horror stories of waste, fraud and abuse In the defense procurement system, i remain skeptical abou: the validity of D&i's DFAII? ccncluslons. iurthsr, because of the rapid increase in defense cxpendltures and the bverouroenrng Federal oeficit which IS in large part a result of those c~pendltures, it is imperative +hat the Congress have a full assessment of tne Department's pricing, firanclng and proflt policies. Therefore, I reqllcst that you lnitlate a review to determine if tne DFAIR report 1: complete and accurate and provide the Committee with your findings, conclusion: and rrcoamondations on these policies nc later than April 15, 1986. Your asslsrance in this matter Is greatly appreciated.
With best wishes, I am
I
Page 81 GAO/NSLAD-S7-60 DFAIR

Appendix IV
Economic Analysis-Profitability -
Appropriate Measures A study of how defense contractor profits compare with those of
of Profitability nondefense firms and how this relationship has changed since the DOD policy modifications of the mid-1970s requires (1) a meaningful measure of profitability, and (2) a standard against which the measure of profit- ability in the defense industry can be compared.
The standard measures of profitability that have been used most fre- quently in studies of this type are: ROS and return on investment. ROE and ROA are two different measures of return on investment. Since all firms compete for funds in the capital markets, and these funds are likely to be attracted to those opportunities offering the highest expected rates of return, the preferred measure of profitability would be a return on investment standard. There are two ways to raise capital, i.e., by issuing debt and by selling equity shares. One frequently used ROI measure, ROE, indicates the return to equity. The other, RoA, repre- sents the return to total assets, whether acquired by debt capital or equity capital.
In the first case, one can use ROE or the after-tax accounting profits of the firm divided by shareholder equity. This measure is imperfect, how- ever, because firms have different capital structures (equity as a per- centage of total capital). Thus, if we compared two almost identical firms (identical operating expenses, profits, etc.), the one that finances its investment with a larger percentage of equity (vs. debt) could appear to have a lower profitability, since the denominator in the ROE calcula- tion would be larger. A second and related problem with the differences in the capital structure of the firms is the notion of “financial risk” introduced with debt instruments, since firms are required to make reg- ular interest and principal payments. (This financial risk would be in addition to the “operating risk” faced by each firm regardless of the extent of its leverage.) Finally, the problem of allocating “equity” by line of business introduces significant additional complexities.
With respect to the other preferred ROI measure of profitability, RQA, profits would be divided by the book value of total assets. Both the numerator and denominator for this computation at the firm level are available from published financial reports. The information can be gath- ered from the appropriate lines of business of DOD contractors via ques- tionnaires. The QFR, published by the Bureau of the Census of the U.S. Department of Commerce, also provide this information by industry classification. It should be noted, however, that one problem with the use of a book value measure for capital is that some firms use acceler- ated depreciation methods while others do not. Furthermore, the book
Page82 GAO/NSIAD-S7-5ODFAIR

bps* w Economic Andy&-Profitability
value of capital will also be a function of its age. One alternative mea- sure for the book value of net property, plant and equipment is the market value of these facilities. Since the market value of assets are generally not available and difficult to estimate, this measure cannot be used.
The use of ROS as a measure is less desirable since it is a profitability measure based on output, and not input or how effectively a firm invests its capital. Therefore, Rw is not a reliable predictor of return on investment. As mentioned above, since firms compete for funds in the capital markets, investors (individuals and institutions) are concerned with the rate of return on their investment, which is an input measure to the firm. A rate of ~0s is less likely to be related to a return on an investor’s capital but more to the products being sold, or the specific industry. For example, retail food stores generally earn a relatively low return in sales, but an average return on invested capital. Thus, a ROB comparison across industries would appear to be of questionable value. On the other hand, comparing RO6 among firms in the same industry may, in this limited case, provide useful information of the relative prof- itability of those firms.
Since RQA or ROE are the preferred measures of profitability, we must now establish a standard against, which to compare the calculations for DOD firms or defense lines of business. This standard can be based on similar computations to be performed for the closely related nondefense lines of business of DOD contractors (from DOD questionnaires) as well as those for commercial durable goods manufacturers. The data at the firm level are available from the QFR’S, Form 10-K filings with the Securities and Exchange Commission, and Compustat data tapes.
In order to perform profitability comparisons across industries, it is important to calculate rates of return after taxes. It is this after-tax rate of return (or what a firm gets to keep) which determines the firm’s ability to pay dividends to shareholders or retain earnings for future investment and expenses. Another reason why it is essential to compute the effective tax treatment of defense contractors is these firms’ ability to defer taxes through the completed contract method of accounting, thereby effectively increasing their relative rate of return.
Before profit rates of DOD contractors are compared with nondefense lines of business and firms, however, it is advisable to measure the rela- tive risk of defense and nondefense business. This is important since investors tend to dislike risk and will demand a higher rate of return to
Page 88 GAO/NSIAD4l7-5O DFAIR
AppedLx Iv Economic Analysis-Profitability
invest in firms or industries with higher risk. The risk of performing defense work may differ from that of nondefense lines of business because there are different sources of risk facing these two sectors of the economy. Whereas profits of nondefense firms are likely to be signif- icantly affected by the business cycle, the profits of defense firms are primarily affected by the size of the defense budget and their share of that budget. The defense industry may experience higher or lower risk than would other lines of business. Since profit comparisons might be misleading without a risk measure being considered, the following approach is suggested.
Although there are several possible risk measures, one method for com- puting risk in the present context is to calculate the degree of earnings variability (standard deviation) of a given firm over time. This measure of risk should provide increased precision the longer the annual time series is used.
A more recent approach to addressing the issue of risk is the application of the capital asset pricing model (CAPM). This approach focuses on the risk of an individual security and relates it to the overall market portfolio.1
,
A Summary of LMI’s Results
In chapter V DFAIR provides a summary of the rates of return and risk analyses provided by its consultants, LMI LMI’S analytical approach and data set differed from DFAIR’S. They conclude:
“We looked at rates of return for individual companies We found no differences in market return between defense contractors and commercial companies, with the exception of one group. We also found no differences between defense contractors and commercial companies in the ratio of net income to assets, to equity, or to sales, with the exception of one measure for one group However, when the return on b assets and the return on equity were calculated using cash flow instead of net income, defense contractors showed higher returns than did commercial companies.“2
Since risk averse investors require a higher rate of return if firms face a higher risk, LMI attempted to measure the relative risk between defense and nondefense firms. The LMI analysis used the standard deviation as
‘Burton G Malklel, A Random Walk Down Wall Street, Fourth Edition, 1986, W W Norton Co, New York
‘LMI Report (App 2-DFAIR) pp 6-10
Page 84 GAO/NSIA.D-87-SO DFAIR

AppendLxN EconomicAnalysis-P&l&bilky
its risk variable, and as stated by DFAIR: “The sample of defense contrac- tors never showed more riskiness than the commercial companies, except for one measure for one group. Defense contractors as a whole actually showed less riskiness for all measures except return on sales, where they were comparable to commercial firms.” Thus, LMI did not find evidence that those rates of return which were higher for defense firms could be justified by a higher risk.
Our Analysis of Defense Profitability
In response to a congressional request, we performed our own analysis of defense profitability using the most complete data set available to us. We did not have access to the confidential data collected by Touche Ross, only the data from corporate financial reports were available The firm level and segment level data we analyzed was obtained from the COMPUSTAT data base. We did not verify the data we obtained from COMPUSTAT.
A comparison was made between a sample of defense firms and com- mercial firms for various measures of profitability, similar to the approach used in the LMI study. Since we included 23 firms m our sample that were asked to participate in the DFAIR study but did not, we were also able to examine the profitability of these 23 firms relative to the profitability of the other defense contractors in our sample.
We divided the defense firms by segment, and split our sample into a defense group and a commercial group. We then compared profitability using both a ROS measure and a ROA measure.
The LMI study incorporated 65 defense firms and 149 commercial firms. The time period of the LMI study was 1974-1984, except for the market measure which was 1965-1985. The GAO analysis at the firm level included 84 defense firms and 228 commercial firms. For the LMI defense
.
sample, 35 of the 65 defense firms participated in the DFAIR study. For our study 59 out of the 84 defense firms participated in the DFAIR study. Of the remaining 25 defense firms in our sample, 23 were part of the original 126 firms that were invited but declined to participate in DFAIR. The commercial firms analyzed by us included the same SIC codes used by LMI as well as additional similar industry groups.
For various measures of profitability, we compared our samples of defense firms and nondefense firms for the time period 1975-1983. In a
Page 86 GAO/NSIAD-S7-6ODFAIR

Appendix IV JkonomtcAnalyeia-ProfhbilIty
further attempt to determine the influence of defense business on profit ability, we also stratified our defense firms by the percentage of total sales attributed to defense.
As a starting point, we used the same six measures of rate of return (at the firm level) as reported in the LMI study. It should be noted that in contrast to DFAIR, LMI used conventional definitions for its profit meas- ures. We calculated these measures as well as several appropriate exten sions with our larger sample of firms. The following presents a summary of LMI'S definitions:
1. Net income ROA (after tax income divided by total assets).
2. Net income return on stockholders equity (after tax income divided by stockholders equity).
3. Net income ROS (after tax income divided by total annual sales).
4. Cash flow HQA (after tax income plus annual depreciation, divided by total assets).
6. Cash flow return on stockholders equity (after tax income plus annual depreciation, divided by stockholders equity).
6. Market return (the sum of the annual stock price appreciation plus the annual dividend, divided by the stock price at the beginning of the year).
Table IV. 1 presents both LMI’S and our results for these six measures of rates of return,
Table IV.l: Rates of Return for Commsrclal and lhtfen8e Flrmr Figures In percent
Net Income ROA
A
LMI LMI OAO Comm. Def. Comm. %:T .
52 65 51 58
Net Income return on stockholders’ eaultv 92 133 99 128 Net Income ROS 46 47 40 57 ~. Cash flow ROA 76 102 94 119 - Cash flow return on stockholders’ eauitv 152 22 1 20 0 26 4
Market return price appreciation DIUS dividends 22.5 196 165 159
Note LMI results are for 1974-1984 except market return results are for 19651985 Our results are for 19751983
Page86 GAO/NSIAD47-SODFAIR

Appendix IV Economic Andye&eRofltabillty
From table IV. 1, we, as well as LMI, found the rate of return for the defense sample to be greater than the returns for the commercial sample for all profitability measures except the market return calculation.
In addition, we computed a weighted average R~A, stockholders’ equity, and sales for each year. Profitability calculations based solely on simple arithmetic averages can be misleading. For example, if one firm in an industry accounts for 60 percent of industry revenues (or assets, or equity), and has a much higher profit rate than its many smaller com- petitors, industry profits will appear lower if they are calculated by a simple arithmetic average of the firms. Using a weighted average, this large firm’s profit would properly receive a 60 percent weight in the overall industry’s profitability computations. The following table shows these results.
Taqe IV.2: Profitabili (Wefghted Average by 7
Rerultr (1975-83) Irm Size) Figures in percent -_-
Commercial Defense firma firms
ROA 67 83 ROE 104 127 Fibs 37 54 ROA - [net income + (l-t) Interest]/total assets where t= (total tax expense _ tax deferral)/ pretax income
ROE = net Income/shareholders’ equity
ROS - net income/sales
As can be seen from table IV.2, defense firm profitability exceeded the returns to the commercial firms for all three measures. Thus table IV.2 is consistent with the results from the table IV. 1, indicating that defense firms appear to be more profitable.
To perform profitability comparisons across industries, it is important to calculate rates of return after taxes (actually paid in a given year). It is this after-tax rate of return (or what a firm gets to keep) which deter- mines the firm’s ability to pay dividends to shareholders or retain earn- ings for future investment and expenses. One reason why it is essential to compute the effective tax treatment of defense contractors is these firms’ ability to defer taxes through the completed contract method of accounting.
Page 87 GAO/NSIAD47M) DFAIR

Appendix IV Economic Amlysie-ProfitabUity
A recent report issued by the Joint Economic Committee of Congress3 indicates that defense firms on average pay a much lower effective income tax rate than firms in most other industries, The principal expla- nation for this outcome is the use of the completed contract method of accounting which permits defense contractors to defer income tax liabil- ities to a much greater extent than commercial firms. We recently issued a report on the completed contract method of accounting.4 As a result of this defense contractor tax advantage, it is important to calculate effec- tive tax rates before computing after-tax rates of return. We have per- formed these adjustments to the Compustat tax data for the firms in our sample.
If an adjustment for tax deferral is made, the effect on defense firms’ after tax rates of return is larger than for commercial firms’ after tax rates of return. Table IV.3 shows this effect.
Table IV.3 Profitabllity Rerultr-With and Without Tax Deknalr Figures In percent
1975-l 983 ROA ROA (tax) Defense firms 83 9s Commercial firms 67 74
ROA (tax) = (net income + (1 -t) (interest) + tax deferral) assets
t = corporate income tax rate
ROE ROE(tax) 127 157 104 114
ROE (tax) = (net Income + tax deferral) stockholders’ equity
The tax deferral IS calculated from the firms financial statement The definitions for ROA and ROE are the same as used In Table IV 2
As can be seen from table IV.3, the adjustment for tax deferrals results in an increase in the relative profitability of defense firms,
We also checked the profitability of the 23 firms that declined to partici- 1
pate in the DFAIR study to determine if their profitability was above or below those firms that did participate. We did not find any difference in the profitability of these two groups. Therefore, it appears that the omission of these 23 firms from DFAIR'S analysis would not have affected their results.
3Joint Committee on Taxation, Study of 1983 Effective Tax Rates of Selected Large U S Corpoo m, lQ84
4~ress Should Further Restrict Use of the Completed Contract Method, (GAO/GGD-8634, Jan 1986)
Page 88 GAO/NSIAD4375O DFAIR

Append&IV Jkonomic Analysts-Pmfltabilky
Besides checking the relative profitability of defense and commercial firms, we also stratified the defense firms by the percentage of total sales represented by government business to examine whether defense firm profitability increases with this percentage. When we stratified by thirds and using both the ROE (tax) and the ROA (tax) measures, we found that firms with defense contracts accounting for the largest per- centage of total sales were the most profitable. This is shown m table IV.4.
Table #M/.4: Profltabillty a8 a Percentage of Total Sale8 Figures In percent -- -- -~ ---.~ ~
1975-l 983 ROE (tax) ROA (tax) --. Low defense -- -~~
-- -----~-- 154 98
Medium defense 170 96 --- -----. _____--- -_.-___ High defense 199 11 1
where ROE (tax) = (Net income + tax deferral) ---- -~.-~~ ~.. __--- -
stockholders’ equity ROA (tax) = [net income + (l-t) Interest + tax deferral]/total assets -II
Low defense = defense sales less than one-third of firm sales -_ M&m defense = defense sales between one-third and two-thirds of firm sales -__ _____ ___..~~ - High defense = defense sales more than two-thirds of firm sales
One additional check performed by us was to compare the profitability of defense and nondefense segments of the 84 defense firms m our sample. The two measures of profitability that were used were oper- ating profit/sales and operating profit/assets. As a result of reduced data availability, the time period for the segment analysis was limited to 1979-1984.
The results are presented in Table IV.5.
IV.5: Profitability at the Segment for 84 Defenre Firma (1979-l 964) Figures In percent
Operating profit/sales
Operatmg profit/assets
-- -_-- - ----- --
Defense 65 176 ---_-- -__ Commercial 102 11 2
From this table, ROA for the defense segments was 17.6 percent, which is approximately 57 percent higher than the ROA of 11.2 percent for the commercial segments. Although this table also indicates that defense segments have a lower ROS than commercial segments, we believe that ROA is the more desirable measure of profitabihty.
Page 99 GAO/NSIAD-f47-50 DFAIR

Appendix IV Economic Analysb-Ffo~tabiUty
Risk As discussed earlier, investors tend to dislike risk and will demand a higher rate of return from firms facing greater risk. Thus, if it can be shown that one industry is riskier than most others, then an observed higher rate of return for that industry may be needed to attract capital. With this consideration in mind, we analyzed two risk measures- standard deviation and beta. Our results are reported on table IV.6. LMI compares the risk of defense firms, as measured by the standard devia- tion of their six measures of profitability, to that of commercial firms.
libla IV.& LMI Rbk Mearurer (Siandard Devlatlon) Figures In percent
Net income on assets
Net income return on stockholders’ equity --~ Net income on sales Cash flow return on assets
Cash flow return on stockholders’ equity
Market return
56 2’ ~.-- ~~ --.. 189 7’ ~___--- - 20 4 21 , 55 2: ~-- --
184 7! _---~- ~ 62 7 49 ;
For all measures except net income on sales, the standard deviation is lower for defense firms than for commercial firms. Therefore, LMI con- cludes that defense firms are not riskier than commercial firms.
Tdble IV.7: Rlrk Mearurecl (Standard D+viatlon)
0
Figures In percent _-
Net income on assets --~- Net income return on stockholders’ eauitv
Commercial firma DefK: -~-_____
32 22
122 51 Net income on sales 26 21
&ish flow ROA -- 32 22 *
-~ Cash flow return on stockholders’ equity 11 2 48
Market return - -.~
37 8 31 6
According to table IV.7, our results are consistent with LMI’S. All of our standard deviations for the defense sample are below those for the com- mercial firms. The implications of these results is that defense firms appear to be less risky than commercial firms.
Next, we calculated a second measure of risk, that is, the average beta for firms in each of our two groups. The average beta for defense firms, 1.099, was almost identical to that of commercial firms, 1.091.
Page 90 GAO/NSIAD-87-60 DFAIR

Appendix IV lkonomlc Analyde-Profitability
Therefore, using this measure, it does not appear that there is a substan- tial difference in risk between defense and commercial firms. This is the basic conclusion reached by DFAIR.
We have concluded that our results, based on the standard deviation and beta, indicated that defense firms are not riskier than commercial firms and, therefore, would not require a higher rate of return.
Relative Profitability One of DFAIR'S conclusions is that defense contractors and commercial
of Defense Contractors firms were equally profitable during 1970-79. Our analysis at the firm 1 eve covered 1976-1983 Until this point, we have represented only our 1
in the 1970s results for the entire period. However, we also performed an analysis of relative profitability for the subperiods 1976-79 and 1980-83, respec- tively. By examining our data for the 1976-79 period, it can be deter- mined if our results are consistent with DFAIR'S conclusion.
Analyzing our sample of 84 defense firms and 228 commercial firms, our results are presented for both the 197579 and the 1980-83 time periods.
Table IV.& Relative Profitability of Dehnae Versus Commercial Flrm8 Figures In percent --
1975-79 1980-83 Defense Commercial Defenre Commercial
ROA 81 66 79 50
ROA (tax) 94 73 97 57 ROE 138 117 113 87
ROE (tax) 165 128 146 98
ROS 60 42 48 32
ROS (tax) 73 49 65 42
ROA = [net income + (l-t) Interest]/total assets - ROA (tax) - (net income + (l-t) interest + tax deferral)/total assets
b
ROE - net Income/stockholders’ equity ROE (tax) = [net income + tax deferral]/stockholders’ equity
ROS - net Income/sales
ROS (tax) = [net income + tax deferral]/sales
As can be seen from table IV.8, the profitability of defense firms exceeded that of commercial firms for each of the six measures over each time period 1976-79 and 1980-83.
Page 91 GAO/NSIAD-S7-60 DFAIR

--__ ---_ - ---- - AppendLrIv EconomicAnalysis-Prof'ltability
Therefore, the results from table IV.8 do not support the DFAIR conclu- sion that defense firms were about as profitable as comparable commer- cial firms during the 1970s. Our results, along with those of LMI, suggest instead that defense firms were more profitable.
C0nclusions We used several measures of profitability to compare the defense industry with commercial durable goods manufacturers. During this study (1976-1983), it appeared that defense contractor profitability was consistently and substantially higher than that of both nondefense firms as well as commercial segments of defense firms. Furthermore, our anal- ysis of relative risk over the 9 year period indicated that defense con- tractors were not riskier than commercial firms and, therefore, did not require a higher rate of return.
The conclusions of this appendix only partially confirm those reported by DFAIR. Although DFAIR concludes that defense firms were more profit- able than commercial firms for 1980-83, and there was no evidence of defense firms being riskier than commercial firms over the entire period of their study (1976-1983), they state that the profitability of defense and nondefense firms was approximately equal in the 1970s. We, by contrast, found that defense firms were substantially more profitable than commercial firms during both 1976-79 and 1980-83.
Page92 GAO/NSIAD-97-5ODFAIR

Appendix V
Defense Contractor Investment
Introduction The Congress is concerned as to whether DOD'S contract pricing, financing, and profit policies are encouraging defense firms to operate in the most efficient manner. Put differently, are defense contractors satis- fying the procurement needs of DOD at minimum total cost? The question is too complex to be answered directly; instead, it must be approached by looking at indirect or intermediate measures of contractor behavior. In effect, the debate focuses on the validity of an alternative hypothesis about (1) whether past DOD contracting and profit policies might have encouraged inefficient production methods and (2) whether recent changes in these policies are likely to lead to contractor behaviors that are closer to those desired.
Approximately 90 percent of DOD expenditures on negotiated contracts covers incurred costs while the remaining 10 percent provides profits for defense firms. Therefore, if modifications of DOD payment policies encourage contractors to become more efficient by substituting capital for labor and thereby reducing incurred costs by 10 percent, DOD could lower its overall expenditures by 9 percent. By contrast, a parallel 10 percent reduction in contractor profits would save only 1 percent of total defense expenditures. This example clearly illustrates that the rel- ative cost savings to DOD by encouraging contractor investment and effi- ciency are substantial.
Beginning in the mid-1970s, DOD introduced a series of modifications in the practices and procedures for reimbursing defense contractors. These changes were predicated on the assumption that pre-1976 contracting policies encouraged under-facilitization (or insufficient use of capital) in the production process, given the then current technology and the rela- tive market prices of capital and labor inputs purchased by contractors. The adjustments in DOD policies were intended to increase facilitization by: (1) changing contract pricing procedures to increase the relative b reward associated with substituting capital for labor, and (2) increasing the resources available to defense contractors to finance capital acquisitions.
The primary disincentive to defense contractor investment is the cost- based nature of nori procurement policies. According to DFAIR:
“the current markup (profit) policy has been approximately 70 percent cost-based and 30 percent investment based since DAC 76-23 was issued Thus, even though DAC 76-23 increased rewards to investment when it was introduced in 1980, con- tractors could see their profits decline if this investment results m a sufficient reduction of labor expenses (the maJor component of their “70 percent cost-based“ payment) ”
Page 93 GAO/NSIAD-S7-SO DFAIR

APpendLr v Defenm Can-r Inve8tment
Review of Past Studies During the past 16 years, we have issued several reports examining
of Defense Contractor investment in the defense industry. In a 1971 study1 we expressed con- tern over the inadequate incentives for contractor investment. We
Investment stated,
1, . . . by relating profits to costs, contractors in noncompetitive sltuatlons are not provided with positive incentives to make investments in equipment that would increase efficiency and result in reduced costs, . . . such investments tend to lower, rather than increase, profits in the long run ”
Our 1977 report? which reviewed the Profit ‘76 study concurred with DOD’S recommended policy revisions encouraging contractors to increase investment in capital assets so as to reduce production costs. We noted,
It, * I . approximately 90 percent of the prenegotiation profit obJective IS still based on
costs. Since the higher dollar profit results from a higher cost estimated, it 1s ques- tionable whether contractors ~111 be sufficiently motivated to reduce their costs ”
In a 1979 study of defense industry investment3 , we stated,
6‘ . . . cost reducing investments have not been made primarily because too much
emphasis is still placed on estimated contract costs in establishing profit objec- tives ” Also, “GAO believes that the emphasis given to capital investment must be substantially increased if desired results are to be achieved ”
The Air Force, in its Profit ‘82 report, concluded:
“Our study revealed that capital investment within the defense industry has increased. Yet, we also found that such investment was still proportionately less than that attained in the commercial sector ” “In spite of the DPC 76-3 revisions emanating from the Profit ‘76 study, capital investment as a percentage of total cost, did not change during the 1977-81 period . , the capital employed profit was far too small, and the method of establishing capital employed on a given contract was too indirect.” b
Finally, in 1986, both the DFAIR report and a companion study by consul- tants to the Defense Department4 , LMI, addressed this issue. The next two sections of this chapter will discuss and evaluate those findings.
‘Defense. Industry Profit Study (Mar 17,1971, GAO, B 169896)
%eview of Profit ‘76, Feb 17,1977, (GAO/PSAD77-76)
3Recent Chwea In the Defense Department’s ProfIt Pohcy-Intended Results Not Achieved (GAO/PSAD-79-38, Mar 8,197Q)
4LogIstics Management Instkute, Facllitles Capital As a Factor in Contract Pncmg, May 1986
Page 94 GAO/NSIAD-87-SO DFAIR

.
Appendix V Defense Cmtractm InveWment
IFAIR’s Results on The principal measure used by DFAIR to examine defense contractor
:ontractor Investment investment was the facilities capital employed/sales ratio. Table V. 1 reports DFAIR'S results for the years 1976 and 1983.
able V.l: Facilities Capital Employed/ ales (DFAIR Study) 1975 1983
DFAIR defense business 8 63 1292
Durable QOOdS manufacturers 20 10 23 17
Source Data for defense business was derived from the Touche Ross survey Data for durable goods manufacturers was derived from Quarterly Flnanclal Reports
DFAIR'S conclusions with respect to defense contractor investment con- tradicts much of LMI'S findings on this subject. According to DFAIR,
“The defense sector has become more capitalized in the last nine years as evidenced by the increase in the FCE (facihties capital employed) to sales ratio. It still does not use as much facilities capital per dollar of sales as does the non-defense sector, but its rate of increase has been substantially higher than the non-defense sector, and much more consistent.” Also: “The mix of capital expenditures has changed over the sample period to some degree, with building expenditures mcreasing at the expense of equipment.”
DFAIR relied upon the Touche Ross data for its measure of investment by defense firms, and the Census of Manufacturers for its nondefense firm measure.
LMi’s Results LMI primarily relied on the facilities capital employed/sales ratio to examine defense contractor capital intensity. Table V.2 presents the
9 results that LMI reports for 1978 and 1982.
rable J.2: LMl’r Facllltleo Capital :mplayed/Saler Figures in percent
Profit ‘82 Sample (Air Force Profit Study performed In 1982)
LMI Samole
b
Defense Firms 1978 1982 5.76 9 74
1351 14 14
Combined Profit ‘82 and LMI Samples 1079 1269
Source LMI relied pnmanly on cost of money factor forms to calculate facilities capital employed
LMI also calculated growth rates for both facilities capital employed and sales. They concluded that the rate of growth of defense contractor investment has lagged that of comparable durable goods manufacturers since the mid-1970s. Their conclusion contradicts DFAIR. LMI states,
Page 96 GAO/NSIAD43’/aO DFAXIt

Appendix V Defcnae Contrnctm Investment
“since 1976 . . . the amount of facilities capital used in relation to the amount of defense business increased by about 4 percent a year, indicating that the new pricing policies do encourage investment in facilities capital. But manufacturers of durable goods economy-wide increased their relative use of facilities capital by about 7 percent a year, showing that defense contractors still lag behind.”
However, LMI obtains a similar result to DFAIR’S with respect to an increasing percentage of annual defense capital expenditures being devoted to buildings at the expense of machinery and equipment.
There is another contradiction between the DFAIR report and the LMI study regarding the effect of the changes in profit policy upon invest- ment. Quoting DFAIR, “The rate of change in capital investment (of defense contractors) has been driven by factors other than DOD markup policy.” However, the LMI study stated, “The amount of facilities capital used in relation to the amount of defense business increased by about 4 percent a year, indicating that the new pricing policies do encourage investment in facilities capital.”
To calculate defense firm investment, LMI primarily relied on “Cost of Money Factor” forms used by DOD to pay a business’ or segment’s cost of money pursuant to GAS 414. Quarterly Financial Reports were used to provide data on investment by comparable durable goods manufacturers.
Finally, LMI evaluated alternative types of policies to encourage cost reductions. They conclude, “By further lowering the importance of cost and raising the importance of capital in determining profit, DOD can increase a contractor’s incentive to invest in facilities capital.”
A Theoretical In order to make judgments about the relative use of capital and labor in b
Approach to Measuring the defense industry, consideration should be given to (1) an ideal mea- sure of capital intensity if internal corporate data were available, (2) a
Investment and meaningful measure of capital use that could be calculated from pub-
Efficiency licly available data, and (3) a standard against which the measure of capital intensity in the defense industry can be compared.
An ideal measure of the capital intensity of a specific line of business is the capital-to-labor ratio. Theoretically, capital would be measured by the market value of the property, plant, and equipment of a line of busi- ness. Given the unavailability of this data, capital could be represented by the book value of “net property, plant, and equipment” associated
Page 90 GAO/NSIAD87-Ml DFAIR

Appendix V Defense Contractor Invedment
with that line of business. Similarly, “total labor expenses” would ide- ally be used as a measure of “I,” by line of business. Unfortunately, the above data for both capital and labor are publicly available only at the corporate level.
To obtain the capital-to-labor ratio for defense and nondefense firms, Form 10-K filings with the Securities and Exchange Commission provide both the book values of net property, plant, and equipment and total labor expenses at the corporate level. This information is also readily accessible from COMPUSTAT data tapes.
Since commercial durable good manufacturing lines of business of defense firms are likely to use similar technologies as the defense work, and these nondefense lines are likely to be disciplined by the market- place to operate in the most efficient manner (i.e., produce at minimum cost) a calculation of capital/labor ratios for these lines would provide a standard or benchmark for an optional capital-to-labor ratio. To com- pare the capital intensity measure for defense business with other closely related lines of business would, therefore, provide an indication of whether DOD contractors are utilizing their factor inputs of capital and labor in approximately the same ratio. If capital/labor ratios for defense work is significantly below that for commercial work, this would suggest that the contractor may not be facing the proper incen- tives to minimize cost by incorporating the same capital/labor mix that is used in commercial work.
An alternative standard against which to compare capital intensity is to calculate capital/labor ratios for nondefense firms. This information is readily available from the previously mentioned lo-KS. Once again, a comparison of K capital/labor ratios for defense firms with this ratio for durable goods manufacturers can provide information on whether b defense contractors are operating close to the optimal capital intensity level and, therefore, minimizing total cost.
Since questions have been raised about the relative capital intensities between defense and related nondefense lines of business, both in the mid-1970s and today, these calculations and comparisons should be made for the two time periods. If defense contractors in the mid-1970s exhibited capital intensities that were significantly below those of the comparison commercial lines of business, then it would appear that under capitalization was a problem at that time. If similar comparisons today indicate an elimination or reduction in the difference between
Page 97 GAO/NSIAD-S7-50 DFAIR

Appendix V Defense tintrnctor Investment
these sets of ratios, then there would be evidence that DOD policy modifi- cations since the mid-1970s have at least partially achieved their intended purpose.
It is important to note, however, that where possible, several adjust- ments, which were not made by DFAIR or LMI, should be made to the cap- ital/labor (or capital/sales ratios) calculations. First, defense contractors frequently use government-owned facilities. Where this occurs, it would be necessary to estimate a book value (available from the Touche Ross questionnaires) for these facilities and then include the estimate in the calculation of capital for that firm. Second, the capital-to-labor ratio may vary by product mix for defense firms, That is, the production pro- cess for some equipment is less capital intensive than others. Therefore, it would be of interest to compare capital/labor ratios across defense contractors to establish whether there is a wide variance in this mea- sure. If there is a large dispersion in capital/labor values (holding con- tract type constant) then there would be an indication that DOD products and the technologies required to manufacture them are too heteroge- neous to be lumped into the same category. For example, optimal cap- ital/labor ratios may differ greatly in the production of aircraft versus the manufacture of defense electronics. This problem would raise ques- tions as to the usefulness of overall capital/labor comparisons across firms.
A third concern that should be examined is the “capacity utilization” of a firm’s capital. For example, if firm A and firm B are identical in all respects except that firm A utilizes its capital during one &hour shift a day, while firm B hires additional labor for a second &hour shift, the capital/labor ratio for firm B would be lower than that of Firm A (unless an appropriate adjustment is made).
Finally, another consideration in comparing pre-1976 WD contractor capital/labor ratios with those of today is the different technologies available. Since production technologies have changed over time, so might optimal capital-to-labor ratios.
Thus, before capital/labor (or capital/sales) ratios can be properly cal- culated and compared across firms, industries, and time, one should con- trol for each of the above concerns.
Our Results DFAIR examined the capital intensity as well as the capital investment undertaken by defense contractors. The issue of the capital intensity of
Page 96 GAO/NSIAD87-50 DFAIR

. AppendlrV Defense Contract.or Investment
defense contractors was considered important by DFAIR because of pre- vious concern that defense contractors were under capitalized and as a result were inefficient. If they were inefficient, procurement costs would be higher than necessary and taxpayers’ money would be wasted. Since we did not have access to the Touche Ross data, we conducted an anal- ysis of capital intensity at the firm level during 1976-1983, relying on the COMPUSTAT data base. There were 84 defense firms and 228 nondefense firms in our sample. Two measures of capital intensity were used: (1) capital/labor ratio and (2) capital/sales ratio. As discussed in the previous section, we prefer the capital/labor ratio to serve as the most reliable measure of capital intensity. However, only 26 percent of the firms in our sample could be used to calculate this ratio since only that percentage of firms report labor expense. Because of this low response rate and since DFNR and LMI relied on a capital/sales ratio in their investment comparisons, we also examined this measure.
It should be noted that the primary reason for preferring a capital/labor ratio to a capital/sales ratio is that the former provides a measure of the relative use (and, therefore, efficiency) of two inputs (capital and labor), while the latter is a ratio of an input (capital) to output (sales). Further- more, sales do not depend solely on input costs, but also on the price received for the end products.
In addition to the above calculations, we stratified the defense sample by the percentage of each firm’s total sales represented by defense. The purpose of this exercise was to examine how investment varied with the degree of defense business.
Since we did not have access to the Touche Ross data, no adjustments could be made to account for government owned facilities as discussed in Section V. In addition, no data were available to GAO with respect to “capacity utilization” and how capital/labor ratios varied with specific technologies. (It is important to note that none of these adjustments were made by either DFAIR or LMI.)
Table V.3 summarizes our results.
Page 99 GAO/NSIAD8745ODFAIB

Appendix V Defense Contractor Investment
Table V.3: Capital/Labor Ratios (1975. 1983) Capital/labor
(19751983) (197579) (1960-83) F - Defense firms 2 755 2817 2 677 4
Nondefense firms 3 115 2 956 3 314 E
BN-Number of firms reporting capital/labor ratios
From table V.3, capital intensity as represented by the capital/labor ratio, is lower for defense firms than nondefense firms over the entire period of 19761983. Furthermore, the disparity between these two sec- tors appears to be widening, with a larger difference occurring between 1980-83 than for the earlier time period of 197679. These results indi- cate that nondefense firms in the early 1980s have been increasing investment relative to labor at a faster rate than have defense contractors.
Next, table V.4 presents capital/labor ratios for our sample of defense firms,
Thble V.4 Capital/Labor Ratios for Dhwe Firms 1975-83 1975-79 1980-83 N
Low defenseb 2964 3 020 2 094 21
Medium defenseC 1 846 1 753 1 961 t
High defensed 1468 1 470 1464 1.
‘N - number of firms In each category blot defense * firm’s defense sales are less than one-third of total sales Wedlum defense = firms’s defense sales are between one-third and two-thirds of total sales dHlgh defense - firms’s defense sales compnse more than two-thirds of total sales
From table V.4, as the percentage of a firm’s total sales represented by defense increase, capital intensity (capital/labor ratio) declines. This b relationship appears to hold over the entire period of 19761983.
Table V.6 summarizes the calculations for the capital/sales ratio.
Page 100 GAO/NSLUM7450 DFAIR
4 i
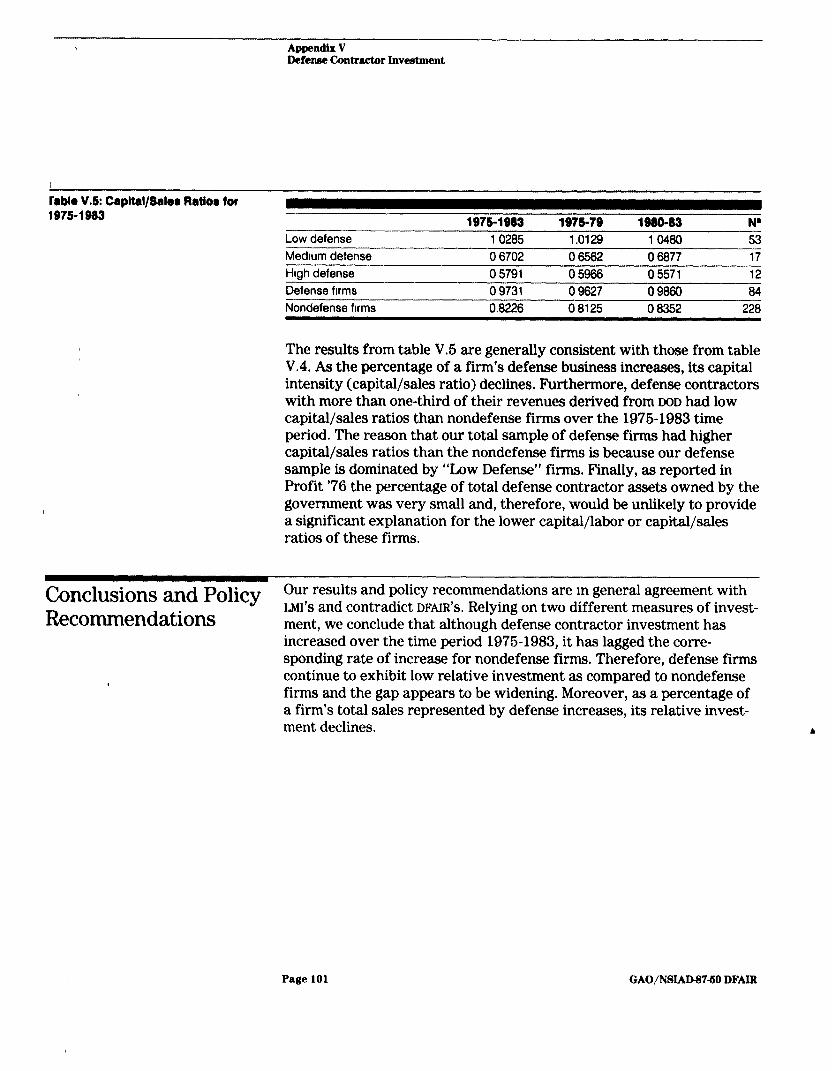
Appendix V Defense Cmtractm Investment
Table V.s: Capltal/Saler Ratioa for 1975-1953 1976-1953 1975-79 19So-83 N’
Low defense 1 0285 1.0129 10480 53
Medium defense 0 6702 06562 0 6877 17
High defense 0 5791 05966 0 5571 12
Defense firms 0 9731 0 9627 09860 84
Nondefense firms 0.8226 0 8125 0 8352 228
The results from table V.6 are generally consistent with those from table V.4. As the percentage of a firm’s defense business increases, its capital intensity (capital/sales ratio) declines. Furthermore, defense contractors with more than one-third of their revenues derived from DOD had low capital/sales ratios than nondefense firms over the 1976-1983 time period. The reason that our total sample of defense firms had higher capital/sales ratios than the nondefense firms is because our defense sample is dominated by “Low Defense” firms. Finally, as reported in Profit ‘76 the percentage of total defense contractor assets owned by the government was very small and, therefore, would be unlikely to provide a significant explanation for the lower capital/labor or capital/sales ratios of these firms.
I
Conclusions and Policy Our results and policy recommendations are m general agreement with
Recommendations LMI’S and contradict DFNR’S. Relying on two different measures of invest- ment, we conclude that although defense contractor investment has increased over the time period 1975-1983, it has lagged the corre- sponding rate of increase for nondefense firms. Therefore, defense firms continue to exhibit low relative investment as compared to nondefense firms and the gap appears to be widening. Moreover, as a percentage of a firm’s total sales represented by defense increases, its relative invest- ment declines. b
Page 101 GAO/NSIAD87-50 DFAIR
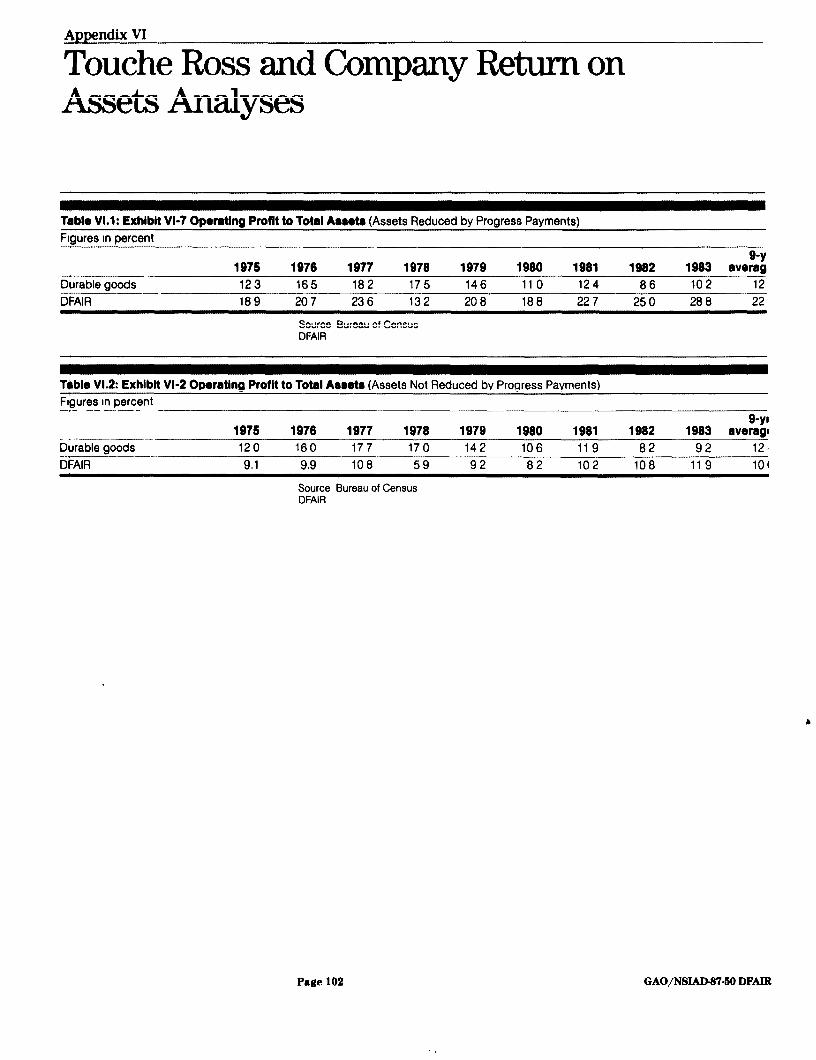
Appendix VI
Touche Ross and Company Return on Assets Analyses
Table VI.1: Exhlblt VI-7 Operating Profit to Total Ameta (Assets Reduced by Progress Payments)
Figures In percent -- 9-Y
1975 1970 1977 1978 1979 1980 1981 1992 1983 averag -_- - Durable goods 123 165 182 175 146 110 124 86 102 12 --
DFAIR 189 207 236 132 208 188 227 250 288 22
Source Bureau of Census DFAIR
T#ble Vl.2: Exhlblt VI-2 Oparatlng Profit to Total Aaaetr (Assets Not Reduced by Progress Payments)
Figures In percent -.- __- ---___ -- -
197s 1976 Q-y1
1977 1978 1979 1980 1981 1982 1983 average _ _--_ -_- Durable goods 120 160 177 170 142 106 119 82 92 12. --_---- DFAIR 9.1 9.9 108 59 92 82 102 108 119 lot
Source Bureau of Census DFAIR
Page 102 GAO/NSlAlM745O DFAIR

Appendix VII
Touche Ross and Company Data “Verification
The data collected for the DFAIR report was subject to verification, editing, and validation procedures developed by Touche Ross and Com- pany. The following is taken from the Touche Ross report to DOD and briefly describes those procedures.
Quality Control A. Certified Public Accountant Review
Ptiocedures In order to achieve an acceptable level of assurance that the submitted data are reflective of the contractors financial operations, submissions had to be accompanied by a report of the contractor’s Certified Public Accountant. The Certified Public Accountant report stated that based on the procedures they applied, they became aware of no information that would cause them to believe that any material adjustments were required to the information submitted by the contractor. For those con- tractors included in the analysis, the Certified Public Accountant reports received were without any qualifications or exceptions.
The recommended review program for the contractor’s outside account- ants and their review letter are provided m attachments III and IV, respectively, in the data collection package in appendix V (of the Touche Ross report).
B. Data Editing and Validation
The data submitted for inclusion into the survey were subjected to a series of manual and automated edit and review procedures. Any incon- sistencies and questions were resolved with the contractor and the con- tractor’s Certified Public Accountant before the data were incorporated into the final database. Appendix II (of the Touche Ross report) pro- vides the detailed procedures for both the manual and automated edit b and review processes performed by Touche Ross.
C. Follow-up Procedures
To resolve questions that were identified during the edit process, Touche Ross contacted the contractor and the contractor’s Certified Public Accountants to resolve all issues. Explanations and corrections were reviewed, and the appropriate adjustments were made to the data. Corrections and explanations were documented and verified with the contractor and Certified Public Accountant.
Page 103 GA0/NSLAD47-50 DFAIR

Appendix WI Touche Roes and Company Data VerLfication
The contractors’ Certified Public Accountant firms applied the Touche Ross procedures to the contractor data and sent Touche Ross a letter indicating their position on the data. The following are excerpts taken from three of those letters.
Letter A Because the procedures outlined in the attached review program do not constitute an examination made in accordance with generally accepted auditing standards, we do not express an opinion on any of the Depart- ment of Defense DFAIR data collection forms. In connection with the pro- cedures referred to above, no matters came to our attention that caused us to believe that any material adjustments are required to the informa- tion presented in the data collection forms. Had we performed additional procedures, or had we made an examination of the data collection forms in accordance with generally accepted auditing standards, matters may have come to our attention that would have been reported to you. This report relates only to the data collection forms specified above and does not extend to the financial statements of Corporation . . . or its compo- nents, taken as a whole.
Letter B Because the specified procedures referred to above do not constitute an examination in accordance with generally accepted auditing standards, we express no opinion on the data collection forms of the segments listed above of Corporation . . . for the nine-year period ended . . . either taken as a whole, or with respect to any specific item, to which the pro- cedures relate. However, based on the procedures we have applied, as designated above, we have no information that would cause us to believe that any material adjustments are required to the information presented in the accompanying forms, other than as presented hereto as Attachment B, Results of Procedures. Furthermore, there can be no b assurance that these limited procedures would reveal matters of signifi- cance with respect to the data to which the procedures were applied nor that subsequent events have not had a material effect on such data. Had we performed additional procedures or had we made an examination of the data collection forms in accordance with generally accepted auditing standards, other matters might have come to our attention that would have been reported to you and our conclusions as to the matters described herein might have been different.
Letter C Because the above procedures do not constitute an examination made in accordance with generally accepted auditing standards, we do not
Page 104 GAO/NSIAD-S7-50 DFADZ

Appendix M Touche ltoaa and Company Data Verl!lcation
express an opinion on the accompanying data collection forms. In con- nection with the procedures referred to above, no matters came to our attention that caused us to believe that the data collection forms might require adjustment. Had we performed additional procedures or had we made an examination of the data collection forms in accordance with generally accepted auditing standards, other matters might have come to our attention that would have been reported to you. This report relates only to the accounts and items specified above and does not extend to any financial statements of. . . taken as a whole.
Page 106 GAO/NSIADS7-50 DFAIR

Appendix VIII
Deputy Secretary of Defense, May 27,1986, Memorandum: Findings, Recommendations, and Decisions
The 17 reform areas, with the DFAIR recommendations and Deputy Secrc tary of Defense decisions, are as follows:
1. Interest expee
DFAIR finding:
Contractor interest expense, although ordinary and necessary to the conduct of defense business, should not be an allowable contract cost.
DFAIR recommendation:
Contractor interest expense should continue to be an unallowable cost on defense contracts. Alternatively, if interest was made an allowable cost and no progress payments were provided, contract prices would increase roughly 10 percent (at 8 percent interest).
Deputy Secretary of Defense decision:
Continue to make interest an unallowable cost and alternatively handle through the combination of DOD'S progress payment and profit policies.
2. Contract Financing and Profit Policy Integration
DFAIR finding:
DOD's contract financing and profit policies are not sufficiently integrated.
DFAIR recommendation:
The profit policy should be revised to provide explicit (not implicit) rec- ognition of the cost of contractor financing and the amount of progress payments furnished by the government. This would be accomplished by decreasing the amount of profit presently awarded for contract cost risk and using that decrement for the new financing factor (zero-sum adjust- ment overall). The amounts to be subtracted from cost risk and added as a financing factor would be affected by decisions made on other recom- mendations. At this point, only the conceptual framework is being con- sidered. The alternative is to keep policies separate and react to economic conditions through policy changes.
Deputy Secretary of Defense decision:
Page 106
. ,
GAO/NSIAD-S7-50 DFAJR

Appendix VIII Deputy Secretary of Defenee, May 27,1886, Memorandum: Fiudlnga, RecommendatIona, and DecLslons
Revise profit policy to integrate contractor financing, government-fur- nished progress payments, and changes in the interest rate.
3. Balance Between Profit and Progress Payments
DFAIR finding:
Current DOD progress payment and profit policies are not balanced enough to compensate contractors for financing requirements.
DFAIR recommendation:
There are three alternatives for balancing the profit and progress pay- ment policies:
l 1: Set profit recognition at 2 percent and the progress payment rate at 86 percent. (DFAIR recommendation).
. 2: Leave progress payment rate at 80 percent and adjust profit recogni- tion to offset increased cost to contractor.
9 3: Leave the progress payment rate at 80 percent and do not provide offsetting increase to profit. This would reduce profit objectives by roughly 0.6 percent of total costs.
Deputy Secretary of Defense decision:
Leave progress payment at 80 percent and do not provide offsetting increase to profit objective.
4. Foreign Military Sales Progress Payments and Profit
DFAIR finding:
The progress payment rates authorized on foreign military sales con- tracts are too high and should be the same as rates used on domestic defense contracts.
DFAIR recommendation:
Remove the differential between foreign military sales contracts and recognize unique risks within normal profit factors.
Deputy Secretary of Defense decision:
Psge 107 GAO/NSUD-S7-50 DFAIR

Appendix VIII Deputy Secretary of Defense, May 27,19&3, Memorandum: Findings, Recommendations, and De&ions
Remove differential in progress payment rates and recognize unique risks within normal profit factors.
6. Economic Price Adiustment Clause
DFAIR finding:
DOD has not effectively used economic price adjustment clauses during periods of substantial economic uncertainty.
DFAIR finding:
Economic Price Adjustment clauses should be used on all large dollar contracts whose period of performance is 3 years or longer. Alterna- tively, Economic Price Adjustment coverage could be left to case-by-case analysis.
Deputy Secretary of Defense decision.
Economic price adjustment clauses should be used for major elements of direct costs on all large dollar contracts whose period of performance is 3 years or longer. Policy needs to reflect pricing uncertainties that exist during periods of rising and declining inflation,
6. Small Business CustomaryProRress Payment Rate
DFAIR finding:
The differential between the progress payment rate for large and small businesses should be narrowed.
b DFAIR recommendation:
DFAIR recommended restoring the 6 percent differential with the resul- tant progress payment rate dependent on the progress payment rate for large businesses. The alternative is to keep the differential at 10 percent.
Deputy Secretary of Defense decision:
Restore small business progress payment rate differential to 6 percent.
7. Flexible Progress Payments
Page 108

‘I .
Appendix VJII Deputy Secretary of Defense, May 27,1988, Memorandum: Fhdiugs, Recommendations, and Decision
DFAIR finding:
The flexible progress payment rate policy needs to be more closely cali- brated with the standard progress payment rate.
DFAIR recommendation:
DFAIR recommend that the minimum level of contractor investment for computing flexible progress payments be set at 100 percent minus the standard progress payment rate. This was equated to 16 percent because the recommended standard progress payment rate was 86 percent.
Deputy Secretary of Defense decision:
Set minimum level equal to 100 percent minus the standard progress payment rate.
8. mress Payment Frequency
DFAIR finding:
The current DOD policy for making progress payments no more fre- quently than monthly is reasonable.
DFAIR recommendation:
Contractors should be allowed progress payments on a basis no more frequently than monthly The alternative is to return to a biweekly frequency.
Deputy Secretary of Defense decision:
Leave payment frequency at monthly.
9. Timing of Invoice and Financing Payments
DFAIR finding:
DOD'S policies on timing of payment need to be revised.
DFAIR recommendation:
Page 109 GAO/NSIAD87-SO DFAIR

Appendix VIII Deputy Secretary of Defense, May 27,1986, Memorandum: Findhgs, Recommendationa, and Decisions
Invoice payments should not be made until 30 days after receipt of con- tractor invoice or government acceptance of related goods and services, whichever occurs later. Contract financing payments should continue to be made as expeditiously as possible, normally within 6 to 10 days after receipt of a progress payment request by the disbursing officer, but not earlier than 6 days.
Deputy Secretary of Defense decision:
For invoice payments: establish 30-day payment policy.
For contract financing payments retain payment policy of 6 to 10 days, but not before 6 days. This is subject to disbursing office’s ability to accommodate such payment terms.
10. Milestone Billings
DFAIR finding:
Milestone billing arrangements for long-term contracts with deliveries at the end of the contract need to be reinstated.
DFAIR recommendation:
Restore milestone billings to include partial profit payment.
Deputy Secretary of Defense decision:
Restore milestone billings and include partial profit payment.
11. Simr>lification of Weighted Guidelines Method
DFAIR finding:
The weighted guidelines method should be simplified.
DFAIR recommendation:
DFAIR recommended reducing the number of profit factors and nar- rowing the range of the factors. There are other alternatives to the DFAIR recommendation.
. Keep current profit factors and current weight ranges.
Page 110 GAO/NSIAD-8745ODFAIR
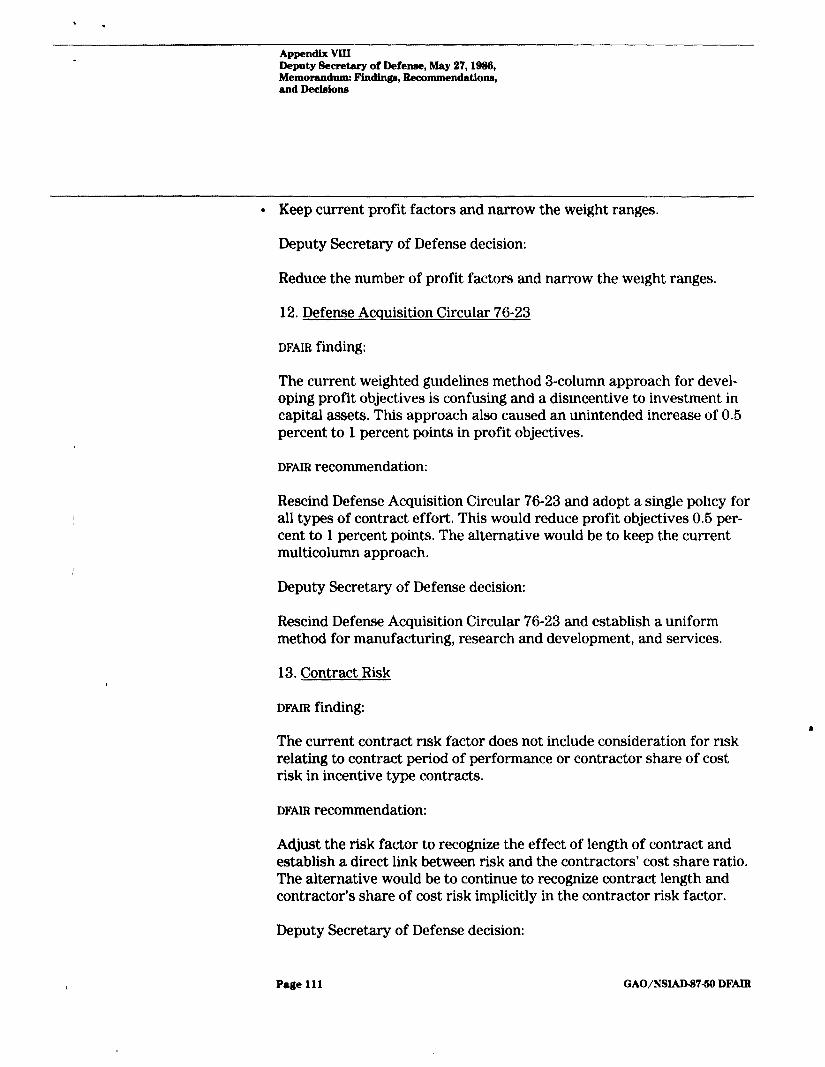
’ .
Appendix VIII Deputy Secretary of Defetwe, May 27,1996, Memorandum: Pindings, Recommendatione, and Decl~Ion~
l Keep current profit factors and narrow the weight ranges.
Deputy Secretary of Defense decision:
Reduce the number of profit factors and narrow the weight ranges.
12. Defense Acquisition Circular 76-23
DFAIR finding:
The current weighted guidelines method 3-column approach for devel- oping profit objectives is confusing and a disincentive to investment in capital assets. This approach also caused an unintended increase of 0.6 percent to 1 percent points in profit objectives.
DFAIR recommendation:
Rescind Defense Acquisition Circular 76-23 and adopt a single policy for all types of contract effort. This would reduce profit objectives 0.6 per- cent to 1 percent points. The alternative would be to keep the current multicolumn approach.
Deputy Secretary of Defense decision:
Rescind Defense Acquisition Circular 76-23 and establish a uniform method for manufacturing, research and development, and services.
13. Contract Risk
DFAIR finding:
The current contract risk factor does not include consideration for risk relating to contract period of performance or contractor share of cost risk in incentive type contracts.
DFAIR recommendation:
AcQust the risk factor to recognize the effect of length of contract and establish a direct link between risk and the contractors’ cost share ratio. The alternative would be to continue to recognize contract length and contractor’s share of cost risk implicitly in the contractor risk factor.
Deputy Secretary of Defense decision:
Page 111 GAO/NSIAD-87-SODFAIR

Appendix VIII Deputy Secretary of Defense, May 27,1986, Memorand- Findings, Recommendation, and De&dons
For contract length, recognize contract length as a factor m determmmg profit objectives. This will redistribute profit objective amounts betweer short and long-term contracts.
For incentive (cost share of overruns and underruns) contracts, recog- nize the link between risk, and the contractors cost share of overruns and underruns. This will redistribute profit objectives for incentive tyy>E contracts by degree of cost risk sharing.
14. Profit on Facilities Capital Employed
DFAIR finding:
Current profit policy provides equal reward to all fixed assets regard- less of their contribution to potential productivity increases.
DFAIR recommendation:
Establish a lowest-to-highest priority in the factors for fixed assets (as applied to net book value of capital assets employed):
Tdble VIII.1: Proflt on Facllitier Capital E(nployed Figures In percent
Ci%~f Possible revision
Land 16-20 0 - 0 Lowest
Furnlture/flxtures 16-20 4-0
Bulldings 16-20 6-10
Eaulament 16-20 16 _ 20 Hiahest
This will result in a decrease in capital employed profit objectives for all contractors and an even larger decrease for contractors who do not have significant investments in equipment. The alternative would be to pro- vide the same profit factor for all assets.
Deputy Secretary of Defense decision:
Establish factors for capital employed in relationship to the potential for cost reduction. Land should have the lowest factor and equipment the highest factors.
Page 112 GAO/NSIAD-S7-50 DFAIR

. Appendix VIII Deputy Secretary of Defeuae, May 27,19@ Memomndum: F’indingrr, Recommendations, and Decblo~
16. Profit on Indirect Expenses
DFAIR finding:
The profit recognition for indirect expenses (overhead and general and administrative expense) should be reduced.
DFAIR recommendation:
DFAIR recommended eliminating general and administrative expenses from the cost base for determining the profit objective and reducing profit factors for overhead.
Deputy Secretary of Defense decision:
Eliminate general and administrative expense from the cost base for determining the profit objective and reduce factors for overhead by 60 percent.
16. Special Factors
DFAIR finding:
Special factors in the current policy are rarely used and appear to be used as “fillers” to generate extra profit objective dollars.
DFAIR recommendation:
Remove the special profit factors from the profit policy. This will result in a minimal decrease in profit objectives.
b Deputy Secretary of Defense decision.
Remove the special factors.
17. Cost Accounting Standard 414, Cost of Moneys Facilities Cap&J
DFAIR finding:
Cost Accounting Standard 414, “Cost of Money as an Element of the Cost of Facilities Capital”, and DOD Federal Acquisition Regulation Sup- plement 30.70, “Facilities Capital Employed for Facilities in Use”, have not caused a significant increase in profits.
Page 113 OAO/NSlAD-S7-50 DFAIR

Deputy Secretary of Defense, May 27, IBM, Memorandum: FYnding~, Recommendations, and Dedalona
DFAIR recommendation:
Cost of money should continue to be treated as an allowable cost.
Page 114

4pbndix IX
GAO Comments on the September l&1986, Proposed DOD Profit Policy
IGAO llnlted States Geneml Accounting Of?ke Washington, D C. 20548
National Stvurity and Intematlunal AfTaim Divisron
November 12, 1986
Lieutenant Colonel Richard J. Wall, USAF Chairman, Joint Implementation Committee ODASD(P)/CPF Room 301082, Pentagon Washington, D.C. 20301-3062
Dear Colonel Wall.
Because of GAO's continuing interest in DOD profit policy, and in view of our soon to be released report on DFAIR, we are providing the following comments on the proposed DOD profit policy publlshed in the Federal Register of September 18, 1986.
DOD profit policy is a SubJect that is extremely complex and involves significant amounts of money. Experience shows thal when a policy, such as this one, is adopted it remains in place, time.
substantially unchanged, for an extended period of For that reason we believe that DOD should not
Implement this new policy until it has access to, and can evaluate, the DOD Form 1499 data for fiscal years 1984 and 1985 and can assure the Congress that the proposed policy will result in appropriate levels of profit.
Although the lack of analysis of current data is a concern to us, the proposed policy has some beneficial aspects. These comments will address those aspects of the proposal that we believe are beneficial as well as our concerns about the new policy. I
The Proposed Policy Gives More Emphasis to Facilities Capital Investment
I b
In general, the concept of placing more emphasis on investment, rather than cost, proposed by DOD has merit. The use of profit to stimulate efficient contract performance has long been espoused as the policy of the Department of Defense. Most agree that higher utilization of productivity enhancing equipment produces increased efficiency and lower overal 1 costs. To this end, and after a long study, DOD implemented a new profit policy, Defense Procurement Circular (DPC) 76-3, which took effect October 1, 1976. DPC 76-3 embodied a major change in the emphasis of DOD's profit policy. It was designed to Place less emphasis on cost in determining profit and, for the first time, recognize investment in facilities capital as a major profit
Page 115 GAO/NSLAD8745ODFAIR

Appendix IX GAO Commenta on the September l&1996, Proposed DOD Profit Policy
determinant. In a 1979 report evaluating the effectiveness of the new policy, GAO recommended that to improve the policy's effectiveness, the emphasis placed on capital facilities investment should be increased and the emphasis placed on cost should be further decreased.
We continue to believe that it would be beneficial to place more emphasis on facilities investment and less emphasis on cost as profit determinants in DOD's profit policy. The proposed policy certainly meets those two criteria. However, whether the specific details of the DOD proposal are precisely those that should be implemented will require further study and analysis. Some of the specifics of the proposal will be discussed later in this letter.
DOD's Proposal Decreases Emphasis on Cost
Although the proposal reduces the consideration of cost in profit determination, cost does play a part in the calculations. The DOD proposal eliminates material, labor, overhead, and general administrative costs as specific factors to which profit is assigned. Having eliminated those cost elements as profit factors, it could be said that this approach entirely eliminates contract cost as a profit determinant. However, the profit objective to be awarded for contract type risk and performance risk is calculated as a percentage of total estimated contract cost. Therefore, cost does continue to play some part, albeit a much reduced part, in the determining of profit objectives.
Implementation is Practical
Retaining the Weighted Guideline procedures eases the implementation of this proposal. Any DOD profit policy must be implemented by several thousand contracting officers. These contracting officers have used, and are familiar with, a profit determination procedure called Weighted Guidelines (WGL). The WGL method provides contracting officers with a technique that will insure consideration of all appropriate profit factors in establishing profit objectives and conducting contract negotiations. We believe this stylized system is still viable and should be retained. The proposed policy contains significantly different profit determinant factors and factor weight ranges than the current WGL policy (DAC 76-231, however, it maintains the basic weighted guidelines structure and, as such, would be a viable approach.
Page 116 GAO/NSlAD-97-60 DFAIR

Appendix IX GAO Comments on the September 18,1986, Proposed DOD Profit Policy
Although the DOD proposal makes a dramatic shift from cost to facilities capital investment in determining profit, it includes provisions to use different profit objectives in exceptional cases. We believe a profit policy should make provisions for contractors that perform highly complex, difficult tasks with talented personnel but have a very small investment in facllitles. A policy that assigns profit based on capital facilities investment must provide a means for recognizing exceptional cases where other considerations should be given some weight. We believe that the proposed profit policy contains such provisions. As with the previous profit policy, DAC 76-23, the proposal provides for other profit determination plans in special circumstances, such as architect-engineering contracts, management contracts, constructions contracts, cost-plus-award-fee contracts, etc. We believe this is appropriate.
Different Profit For Different Types of Capital Investment
The proposed policy assigns different proflt ranges for different types of capital investments. In the previous two profit policies--DPC 76-3 and OAC 76-23--land, buildings, and equipment were all included as profit factors with equal weights. Under DOD's proposal, equipment is assigned a higher profit weight range than buildings and land is dropped as a profit factor. While we know of no empirical data showing that equipment has a more positive effect on productivity than buildings, the proposed approach seems reasonable.
DOD's Goal to Reduce Contractor Profit By 1 Percentage Point Max Not Be Sufficient to Achieve Comparability of Profits
According to DOD, one principal ObJective of the proposed policy is to "reduce overall DOD profit objectives by 1 percentage point -- from 12.3 percent to 11.3 percent." We have not yet analyzed the proposal's profit factors with actual data from the DOD Form 1499 data file to determine whether the factors will achieve the 1 percent reduction. As discussed in the next section, we believe such an analysis must be done before a definitive opinion on the proposal can be provided. However, ever and above the question of whether the factors in the proposal ~111 produce a 1 percent reduction is the question of whether a 1 percent reduction is enough to bring defense contractors' return on assets in line with comparable durable good manufacturers.
Page 117 GAO/NSlAD-87-69 DFAIR
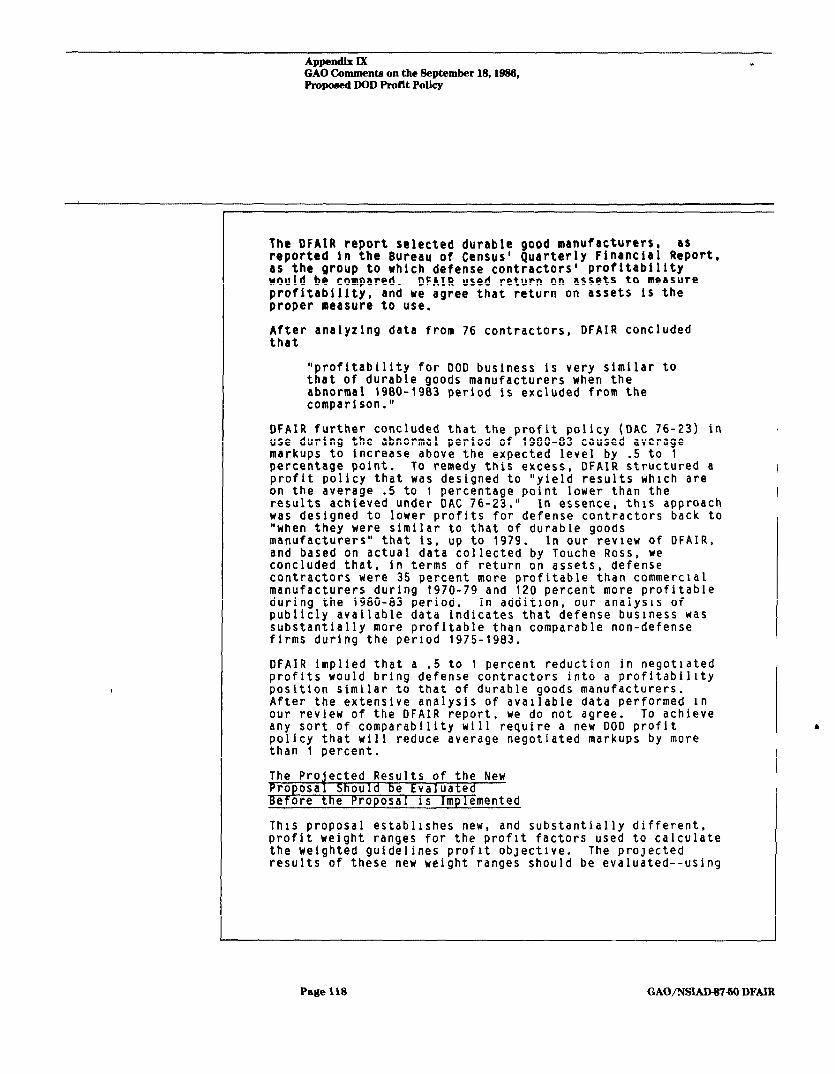
Appendix M GAO Comments on the September 18,19&J Proposed DOD Proflt Polky
The DFAIR report selected durable good manufacturers, as reported in the Bureau of Census' Quarterly Financial Report, as the group to which defense contractors' profitability would be COInDared. DFAIR used return on aSSetS t0 measure profitabillt~, and we agree that return on assets is the proper measure to use.
After analyzing data from 76 contractors, DFAIR concluded that
"profitability for DOD business is very similar to that of durable goods manufacturers when the abnormal 1980-1983 period is excluded from the comparison."
OFAIR further concluded that the profit policy (DAC 76-23 use during the abnormal period of 1980-83 caused average markups to increase above the expected level by .5 to 1 percentage.point. To remedy this excess, OFAIR structure
1 in
da proflt policy that was designed to "yield results which are on the average .5 to 1 percentage point lower than the results achieved under DAC 76-23." In essence, this approach was designed to lower profits for defense contractors back to "when they were similar to that of durable goods manufacturers" that is, up to 1979. In our review of DFAIR, and based on actual data collected by Touche Ross, we concluded that, in terms of return on assets, defense contractors were 35 percent more profitable than commercial manufacturers during 1970-79 and 120 percent more profitable during the 1980-83 period. In addition, our analysis of publicly available data indicates that defense business was substantially more profitable than comparable non-defense firms during the period 1975-1983.
DFAIR implied that a .5 to 1 percent reduction in negotiated profits would bring defense contractors into a profitability position similar to that of durable goods manufacturers. After the extensive analysis of available data performed in our review of the DFAIR report, we do not agree. To achieve any sort of comparability will require a new DOD profit policy that will reduce average negotiated markups by more than 1 percent.
The Projected Results of the New Proposal Should be Evaluated Before the Proposal is Implemented
This proposal establishes new, and substantially different, profit weight ranges for the profit factors used to calculate the weighted guidelines profit ObJectlve. The proJected results of these new weight ranges should be evaluated--using
Page ill3 GAO/NSlAD-97-50 DFAIR

bpe* = GAO Commenta on the September 18,1986, Propowd DOD Profit PoIicy
complete and current data--before this proposed policy is implemented.
The proposal's profit factors--which are divided into the categories of contractor risk and facilities capital employed-- base.
should be evaluated using the DOD Form 1499 data This data base, however, is not current for all 3
services. Current data--through fiscal year 1985--is available for Air Force contract actions. This Air Force data shows that profit objectives averaged 13.9 percent in fiscal year 1985. Data for the Army and Navy for fiscal years 1984 and 1985 is not available.
GAO's evaluation of the OFAIR report showed that the DFAIR proposed weight ranges would not have met their goal of a 1 percent reduction in profit objectives and without proper evaluation of current data we are concerned that the proposed policy may have similar results. DOD Form 1499 data for fiscal years 1984 and 1985 should be collected from all services and the projected results of the proposal should be analyzed before the new policy is put into effect.
The Proposed Policy Should Integrate Profit and Financing Policies
The proposed policy does not clearly integrate profit and contract financing policies. In its OFAIR report DOD integrated the Weighted Guideline policy with its contract financing policies. The September 18, 1986, proposal includes no consideration of contract financing policies except in the calculation of the working capital offset.
GAO believes that 000 took the correct approach in its OFAIR report and should continue in its efforts to develop an integrated profit policy. At a minimum DOD should consider the following factors in deveIoping its new policy, and should structure its policy to recognize the affects of these factors on contractor profits:
-- amount of progress payments,
-- timing of progress payments,
-- frequency of progress payments,
-- timing of delivery payments,
-- frequency of delivery payments,
-- milestone billing arrangements,
Page 119 GAO/NSLAD-87-50 DFAIR

Appendix IX GAO Comments on the September 18,19&J, Proposed DOD Profit Policy
-- assumed length of contract,
-- assumed interest rate,
-- working capital adjustment rate,
-- degree of government ownership of facilities, and
-- amount of flexible progress payment if any.
DOD Has Not Established the 'Reed for Compensating Imputed Working Capital cost
In its OFAIR report, DOD failed to establish the need for a profit factor to compensate contractors for their costs of financing working capital. This new proposal includes profit for working capital in the risk portion of its Weighted Guidelines structure. OFAIR determined that since 1954 the level of working capital investment required of defense contractors yielded average imputed financing costs of 2 percent of total costs. With no explanation the current proposal assumes contractor financing costs to be 2.5 percent. Before this policy is implemented, DOD should determine what the actual working capital needs of contractors are. This could be done by studying the actual requirements of 20-30 contractors' defense business segments. GAO has been directed by the 1987 Defense Appropriations Act to give careful attention to this aspect of the new policy and we are initiating a review to address this subject.
Interest Rate for the Working Capita1 AdJUStment Should be Established Outside DOD
According to the proposed policy, the interest rate used to calculate the working capital factor would be subject to change by the Assistant Secretary of Defense for Acquisition and Logistics or designee. If a legitimate need is found for the working capital factor. the interest rate used to calculate it should be established outside of DOD. Changes to the rate should be based primarily on economic factors. The interest rate should be a published rate--such as the Treasury Department's CAS 414 rate, or the prime rate published in the Wall Street Journal--not a rate that can be influenced by DOD.
Conclusions
We agree in principle with the basic concept of the proposed profit policy. We have previously stated, and continue to believe, that in negotiating profit levels it is appropriate
Page 120 GAO/NSIAD-87-5O DFAIB

l (I”
, Appendix KX GAO Commentn on the September 18,lBStJ Propod DOD Pro!lt Policy
to place more emphasis on facilities capital investment and I less emphasis on contract costs. The new proposal achieves that goal. However, before any new profit policy is implemented, a thorough evaluation of all aspects of the policy should be conducted. First, DOD should determine the appropriate target levels for the proposed policyts profit objectives--using the Touche Ross data, gathered under DFAIR, and conventional analytical methods. Then, DOD should use Form 1499 data from the Army, Navy, and Air Force for fiscal years 1984 and 1985 to analyze the effects of the new factor percentages and relationships and to determine if the overall results of the proposed policy meet those targets.
Sincerely yours,
\ Paul F. Math Associate Director
(3Qd104) Page 121 GAO/NSIAD-S7-Ml DFAIR


w . t - _ --- ~-- -----~ ___-
.
.___ -- __.-- Kequests for copies of GAO reports should be sent to
173. General Accountmg Office Post Office Box 60 15 Galthersburg, Maryland 2087’7
Telephone 20%275-624 1
The first five copws of each report are free Additional copws are $2 00 each
There is a 2Fi% discount on orders for 100 or more copies malled to a single address.
Orders must be prepaid by cash or by check or money order madcb out to the Superintendent of Documents

-- [‘nited States General Accounting Office Wa.!!hrngton, r> C‘. 20548
Addrtw ( ‘orrw*tlon Iiequested
Fist-Class Mat’ Postage & Fees Paid
GAO Permit No. G100