Business Plan Template - Business Gateway | Business Gateway

NSHE GATEWAY COURSE SUCCESS SUMMIT
EnglishNovember 19, 2014

Today’s Summit
Summit Web Site
Web site includes all presentations materials and data tables
https://www.nevada.edu/ir/GatewayCourseSummit.php
2

Today’s Summit
Why are we here and what are doing?
Meeting our commitment to the White House
Achieving Complete College America goals
New metrics for measuring success and new methods for measuring the need for remediation
Tuning into the national dialogue on remediation
Focusing on models with proven success
3

Shifting Focus
Changing how we measure success Historical focus – Enrollment based rate
Nevada Revised Statutes 396.548 Summer and Fall enrollments only Enrollments in remedial courses only
Improved reporting for remedial rates Placement rates Full year of System‐wide enrollment captured Capturing co‐requisite, stretch, bridge, and technical courses
and skills labs
New Focus – Percent of students who successfully complete the gateway course in the first year (or two)
4

NSHE Remedial Report
2013‐14 Remedial Placement and Enrollment Report
available on summit web site
2013‐14 NSHE Remedial Placement and Enrollment Report
5

NSHE Remedial Report
2013 Reporting ChangesEnrollment v. Placement of Recent High School Graduates
0%
10%
20%
30%
40%
50%
60%
27.8%
55.6%
Enrollment Rates(old)
Placement Rate(new) 6

2013‐14 Placement RatesRecent High School Graduates Placed Below College‐Level – English and/or math
System‐wide Placement Rate: 55.6%
20.0%
3.1% 2.7%12.6%
24.5%
21.1%
41.3% 23.9%
12.2%
9.3%
36.9%
12.2%
0%
10%
20%
30%
40%
50%
60%
70%
80%
90%
UNLV UNR NSC 4‐Year Institutions
56.7%
33.5%
80.9%
48.7%
English only Math only Math and English 7

Enrollment of Placed Students ‐ English
42.8%
78.9%
2.2%
47.4%
7.2%
55.1%
1.8% 7.9%
10.1%
8.0% 6.0%
32.6%
0%
10%
20%
30%
40%
50%
60%
70%
80%
90%
100%
UNLV UNR NSCNo English College Level Co‐Req Remedial
UNLV32.2% Placed(N=937)
UNR12.4% Placed(N=251)
NSC39.6% Placed(N=89)
Summer, Fall, or Spring (2013‐14) immediately following high school graduation
8

2013‐14 Placement RatesRecent High School Graduates Placed Below College‐Level in English and/or mathematics
System‐wide Placement Rate: 55.6%
English only Math only Math and English
14.0%2.6% 4.6% 1.7%
11.2%
17.7%
15.0%
29.1%42.9% 21.2%
22.4%
36.5%
43.5%
6.9%25.1%
0%
10%
20%
30%
40%
50%
60%
70%
80%
90%
CSN GBC TMCC WNC 2‐YearInstitutions
54.1%57.5%
51.5%
77.2%
54.1%
9
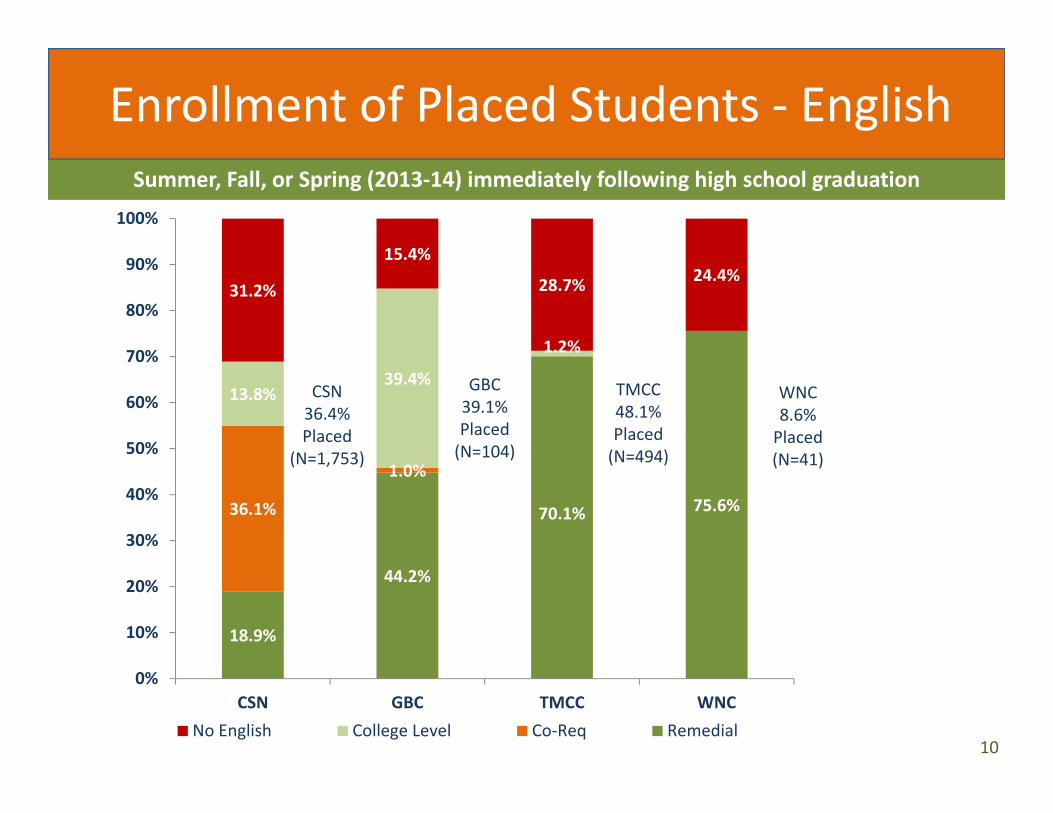
Enrollment of Placed Students ‐ English
18.9%
44.2%
70.1% 75.6%36.1%
1.0%
13.8%39.4%
1.2%
31.2%
15.4%
28.7% 24.4%
0%
10%
20%
30%
40%
50%
60%
70%
80%
90%
100%
CSN GBC TMCC WNCNo English College Level Co‐Req Remedial
WNC8.6% Placed (N=41)
TMCC48.1% Placed (N=494)
GBC39.1% Placed (N=104)
CSN36.4% Placed
(N=1,753)
Summer, Fall, or Spring (2013‐14) immediately following high school graduation
10

Gateway Course Completions
Successful completion of the gateway course Critical momentum point
Sooner rather than later
Significantly increases the likelihood of graduating
Co‐Requisite models for remediation
Focusing on the End Game
11
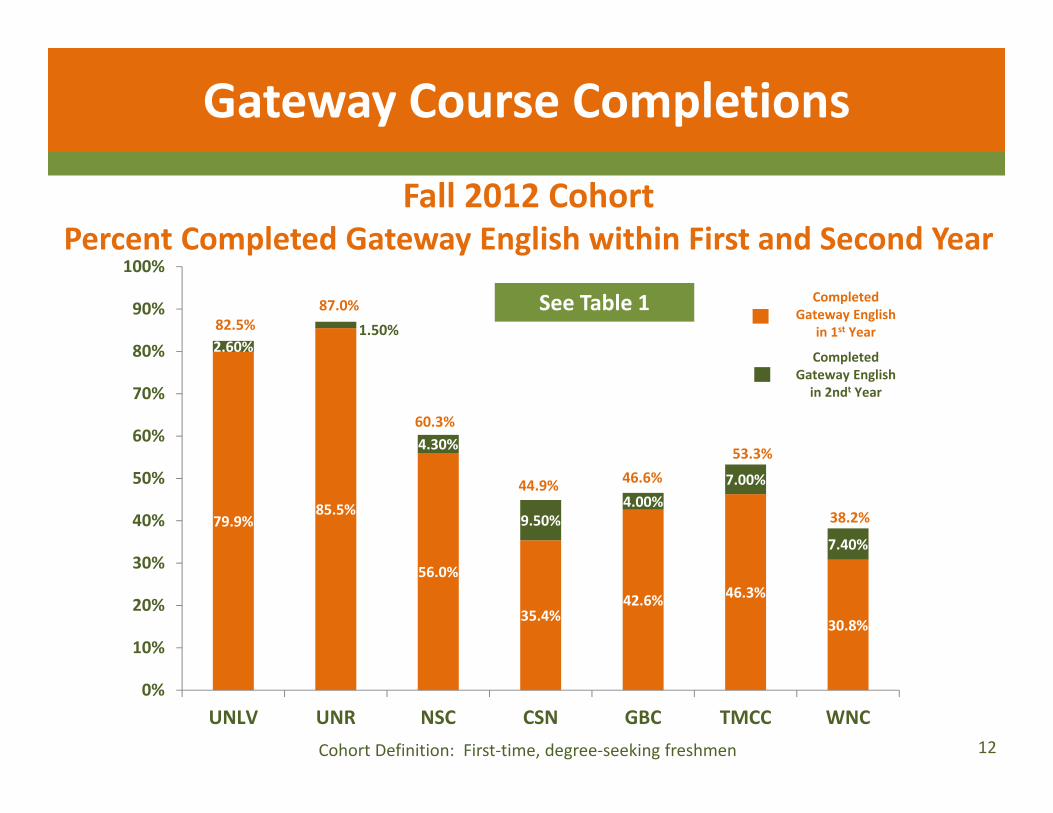
Gateway Course Completions
Fall 2012 CohortPercent Completed Gateway English within First and Second Year
Cohort Definition: First‐time, degree‐seeking freshmen
See Table 1
79.9%85.5%
56.0%
35.4%42.6% 46.3%
30.8%
2.60%1.50%
4.30%
9.50%4.00%
7.00%
7.40%
0%
10%
20%
30%
40%
50%
60%
70%
80%
90%
100%
UNLV UNR NSC CSN GBC TMCC WNC
82.5%87.0%
60.3%
44.9% 46.6%53.3%
38.2%
Completed Gateway English
in 1st Year
Completed Gateway English in 2ndt Year
12
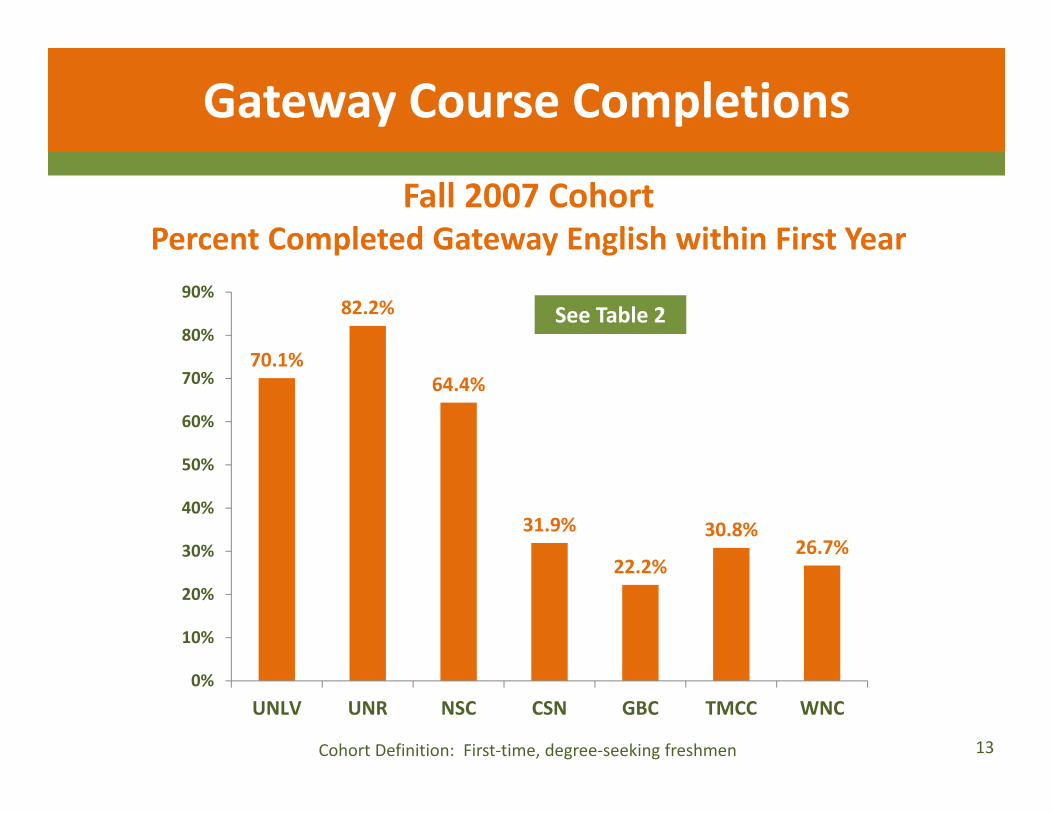
Gateway Course Completions
Fall 2007 CohortPercent Completed Gateway English within First Year
Cohort Definition: First‐time, degree‐seeking freshmen
70.1%
82.2%
64.4%
31.9%
22.2%
30.8%26.7%
0%
10%
20%
30%
40%
50%
60%
70%
80%
90%
UNLV UNR NSC CSN GBC TMCC WNC
See Table 2
13

Gateway Course Completions
Fall 2007 cohort
% CompletedGateway
English in first year
150%Graduation
Rate
UNLV 70.1% 46.2%
UNR 82.2% 53.0%
NSC 64.4% 17.5%
CSN 31.9% 30.1%
GBC 22.2% 29.8%
TMCC 30.8% 39.6%
WNC 26.7% 42.3%
% notCompleted
Gateway English in first year
150%Graduation
rate
16.9% 28.8%
3.1% 31.8%
15.6% 8.0%
49.6% 6.2%
55.1% 5.8%
28.7% 3.9%
31.1% 6.0%
Students who complete the gateway course in English in the first year of enrollment are significantly more likely to graduate.
Impacts on Graduating Students See Table 2.1
14

Gateway Course Completions
Today’s Summit
Hearing from the experts
Team break‐out discussions What are you doing that is working?
What could you be doing differently?
Placement – are we over‐placing students?
What resources do you need to scale up models with proven success? What’s holding you back?
Policy recommendations 15

16