NSF MSP: CEEMS Project Annual Report - College of...
18
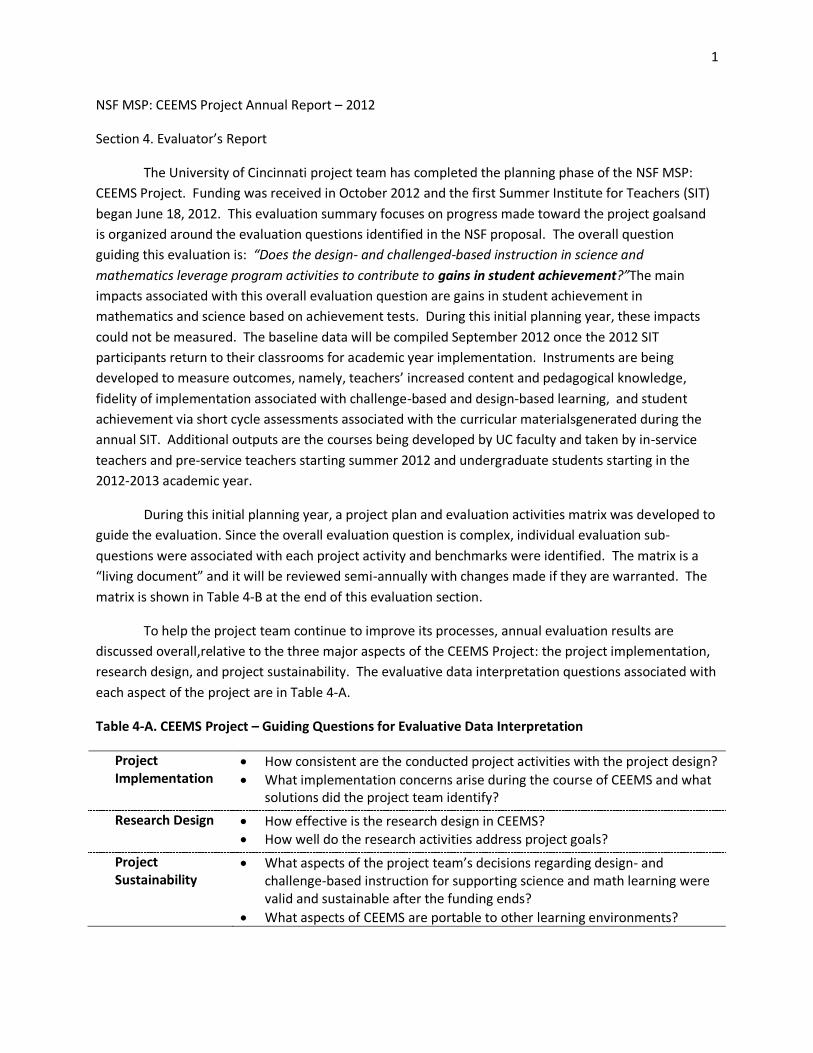
1 NSF MSP: CEEMS Project Annual Report – 2012 Section 4. Evaluator’s Report The University of Cincinnati project team has completed the planning phase of the NSF MSP: CEEMS Project. Funding was received in October 2012 and the first Summer Institute for Teachers (SIT) began June 18, 2012. This evaluation summary focuses on progress made toward the project goalsand is organized around the evaluation questions identified in the NSF proposal. The overall question guiding this evaluation is: “Does the design- and challenged-based instruction in science and mathematics leverage program activities to contribute to gains in student achievement?”The main impacts associated with this overall evaluation question are gains in student achievement in mathematics and science based on achievement tests. During this initial planning year, these impacts could not be measured. The baseline data will be compiled September 2012 once the 2012 SIT participants return to their classrooms for academic year implementation. Instruments are being developed to measure outcomes, namely, teachers’ increased content and pedagogical knowledge, fidelity of implementation associated with challenge-based and design-based learning, and student achievement via short cycle assessments associated with the curricular materialsgenerated during the annual SIT. Additional outputs are the courses being developed by UC faculty and taken by in-service teachers and pre-service teachers starting summer 2012 and undergraduate students starting in the 2012-2013 academic year. During this initial planning year, a project plan and evaluation activities matrix was developed to guide the evaluation. Since the overall evaluation question is complex, individual evaluation sub- questions were associated with each project activity and benchmarks were identified. The matrix is a “living document” and it will be reviewed semi -annually with changes made if they are warranted. The matrix is shown in Table 4-B at the end of this evaluation section. To help the project team continue to improve its processes, annual evaluation results are discussed overall,relative to the three major aspects of the CEEMS Project: the project implementation, research design, and project sustainability. The evaluative data interpretation questions associated with each aspect of the project are in Table 4-A. Table 4-A. CEEMS Project – Guiding Questions for Evaluative Data Interpretation Project Implementation How consistent are the conducted project activities with the project design? What implementation concerns arise during the course of CEEMS and what solutions did the project team identify? Research Design How effective is the research design in CEEMS? How well do the research activities address project goals? Project Sustainability What aspects of the project team’s decisions regarding design- and challenge-based instruction for supporting science and math learning were valid and sustainable after the funding ends? What aspects of CEEMS are portable to other learning environments?
Transcript of NSF MSP: CEEMS Project Annual Report - College of...
1
NSF MSP: CEEMS Project Annual Report – 2012
Section 4. Evaluator’s Report
The University of Cincinnati project team has completed the planning phase of the NSF MSP:
CEEMS Project. Funding was received in October 2012 and the first Summer Institute for Teachers (SIT)
began June 18, 2012. This evaluation summary focuses on progress made toward the project goalsand
is organized around the evaluation questions identified in the NSF proposal. The overall question
guiding this evaluation is: “Does the design- and challenged-based instruction in science and
mathematics leverage program activities to contribute to gains in student achievement?”The main
impacts associated with this overall evaluation question are gains in student achievement in
mathematics and science based on achievement tests. During this initial planning year, these impacts
could not be measured. The baseline data will be compiled September 2012 once the 2012 SIT
participants return to their classrooms for academic year implementation. Instruments are being
developed to measure outcomes, namely, teachers’ increased content and pedagogical knowledge,
fidelity of implementation associated with challenge-based and design-based learning, and student
achievement via short cycle assessments associated with the curricular materialsgenerated during the
annual SIT. Additional outputs are the courses being developed by UC faculty and taken by in-service
teachers and pre-service teachers starting summer 2012 and undergraduate students starting in the
2012-2013 academic year.
During this initial planning year, a project plan and evaluation activities matrix was developed to
guide the evaluation. Since the overall evaluation question is complex, individual evaluation sub-
questions were associated with each project activity and benchmarks were identified. The matrix is a
“living document” and it will be reviewed semi-annually with changes made if they are warranted. The
matrix is shown in Table 4-B at the end of this evaluation section.
To help the project team continue to improve its processes, annual evaluation results are
discussed overall,relative to the three major aspects of the CEEMS Project: the project implementation,
research design, and project sustainability. The evaluative data interpretation questions associated with
each aspect of the project are in Table 4-A.
Table 4-A. CEEMS Project – Guiding Questions for Evaluative Data Interpretation
Project Implementation
How consistent are the conducted project activities with the project design?
What implementation concerns arise during the course of CEEMS and what solutions did the project team identify?
Research Design How effective is the research design in CEEMS? How well do the research activities address project goals?
Project Sustainability
What aspects of the project team’s decisions regarding design- and challenge-based instruction for supporting science and math learning were valid and sustainable after the funding ends?
What aspects of CEEMS are portable to other learning environments?

2
Overall, the CEEMS project is progressing as expected toward accomplishing its goals. The
majority of the project activities completed in these past nine months focused on hiring project staff,
planning the Summer Institute for Teachers (SIT), and recruiting the first cohort of in-service and pre-
service teachers to participate in the SIT. Details of these project activities are detailed in the annual
report’s implementation matrixes.
Project Implementation
The project activities conducted to date have been consistent with the proposed project design.
The project team has hired key personnel; a project director and administrative support; planned the
2012 SIT; and hired resource team members.
Due to a lag time in creating internal university accounts, the project director and administrative
staff members were hired slightly later than expected. The project director began working part-time on
the project in February; 100% of her efforts were devoted to the project beginning in May.This timing
had implications for recruitment of teachers. For year one, less in-service teachers are participating in
the SIT than projected (16 versus 20). While the project team met with administrators of all
participating school districts to discuss recruitment of teachers, some interested, qualified teachers
were unable to come to all weeks of the SIT due to scheduling conflicts. In future years, this issue will be
minimized with recruitment scheduled to begin in September 2012 for the 2013 SIT. Then, more
qualified teachers can take advantage of the opportunity by putting it on their summer schedule prior to
other commitments. Recruitment of pre-service teachers is ongoing but there are 12pre-service
teachers, 6 are relatively new graduates and 6 are considered career changers, that are taking CEEMS
course during the SIT. These pre-service teachers were identified to take courses this summer and have
additional financial support from the Woodrow Wilson Ohio Teaching Fellowship (WWOTF) project or
the NSF Noyce Scholarship project.
Since we want to document changes in teacher content knowledge, attitudes, and behaviors in
the classroom, a pre-post content knowledge assessment was developed for each course and an overall
pre-post survey was developed that documents participating in-service teachers’ current instructional
practices that are associated with challenge-based and design-based learning. The survey has two
batteries of questions listing the same challenged-based/designed-based learning practices. One
battery of questions asks about participants’ incorporation of these practices into instruction and the
second battery of questions asks participants to indicate their level of confidence when using these
instructional practices. The pre-survey was administered at the beginning of the SIT to all participants
(n=16). Results were given to the project team. Highlights are summarized below.
Survey results indicated that the most used practice was the explicit connection of class content
to real world examples and applications (37.5% (6) of the participants used it regularly).
The least used instructional practices were the explicit connection of class content to how
people in STEM careers use their knowledge to address societal impacts (43.8% (7) of the
teachers never used it) and guidance provided students to break complex global problems into
their local and more actionable components (37.5% (6) of participants never used it).

3
Survey results for SIT participants on the confidence scale indicated that they were not very
confident in implementing these challenged-based/design-based practices.
The instructional practice with the highest confidence level was still low with only 25% of the
participants reporting being very confident in explicitly connecting class content to real world
examples and applications.
Almost forty-four percent of the participants reported being “not confident” in explicitly
connecting class content to how people in STEM careers use their knowledge to address societal
impacts;37.5% noted they were not confident in providing opportunities for students to take
responsibility for the decisions they made about the processes used in solving complex problems.
Instances of non-usage of critical practices in challenge-based/design-based learning provide
opportunities for Project CEEMS in the improvement of teachers’ instructional practices. These areas
where teachers reported the lowest levels of confidence in implementation provide the CEEMS project
with opportunities to build teacher skills and confidence in using critical practices in challenge-
based/design-based learning.
When planning the SIT, the project team identified a potential opportunity to improve
instructors’ CEEMS course development. Leveraging evaluation feedback from another University of
Cincinnati teacher preparation program, WWOTF, the CEEMS project team provided A&S and
Engineering faculty who were creating project courses with a professional development opportunity.
These faculty and instructors were invited to attend four seminars. Each seminar was evaluated and a
complete summary was given to the project team. Highlights of the seminar evaluation include the
following:
Overall, the evaluation results indicate that these seminars met the goal of supporting faculty in
their development of the SIT courses. The responses indicated that the faculty had a common
understanding of the CEEMS project and the project team’s definition of challenge based
learning and how design based learning fits into the framework. Examples of faculty definitions
of challenged-based learning, by seminar, include.
o CBL requires a big idea to act as a framework and also inspiration for studying the context.
As you get to the level of guiding questions, activities, and resources, these are taught in
context with the challenge. This provides real-world context for the learning. (Seminar 1)
o DBL [design based learning within challenged based learning framework] is like a highway
map for students. They know where they will start and where they will end. (Seminar 2)
o CBL - having students understand a problem, and design something that fits certain criteria
to solve the problem, within certain guidelines, learning content in the process. (Seminar 3)
o Challenge based learning in my course will have the characteristics of combining scientific
knowledge with engineering skills. (Seminar 4)
The course syllabi developed as a product of these seminars clearly outline learning objectives
for each course and fit together to create a cohesive curriculum that will contribute to the
development of products that the participating teachers can implement in their classrooms
during the 2012-2013 academic year.
4
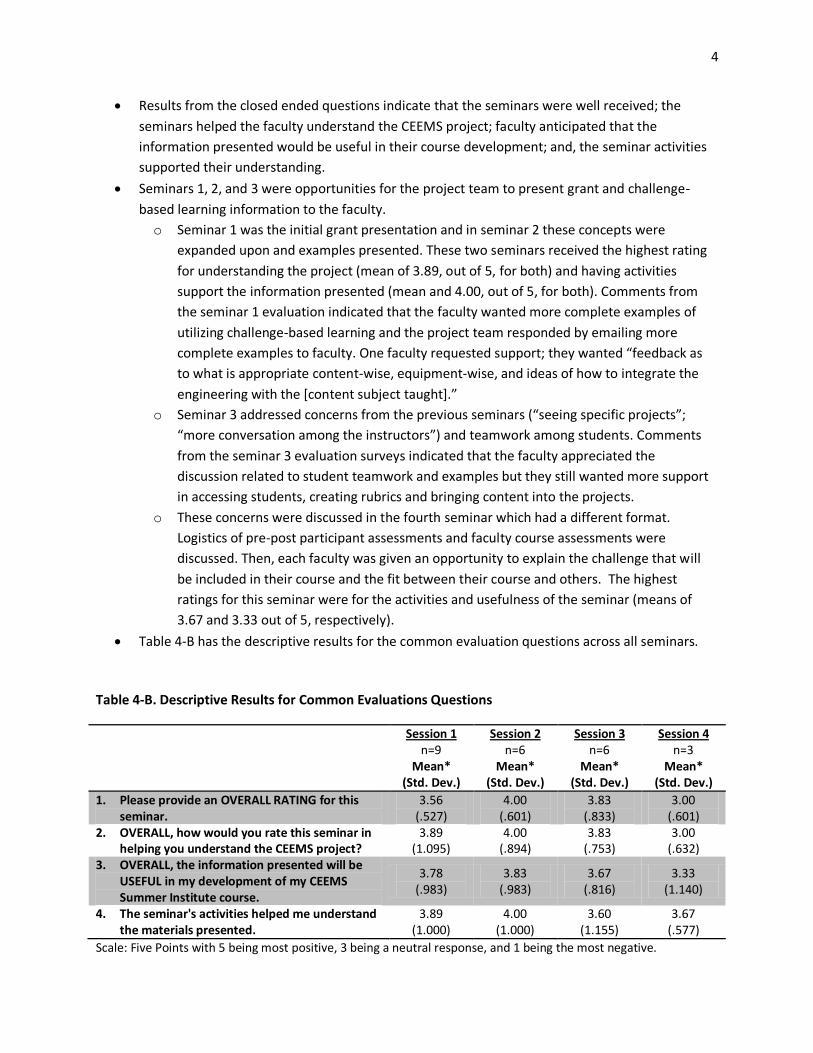
Results from the closed ended questions indicate that the seminars were well received; the
seminars helped the faculty understand the CEEMS project; faculty anticipated that the
information presented would be useful in their course development; and, the seminar activities
supported their understanding.
Seminars 1, 2, and 3 were opportunities for the project team to present grant and challenge-
based learning information to the faculty.
o Seminar 1 was the initial grant presentation and in seminar 2 these concepts were
expanded upon and examples presented. These two seminars received the highest rating
for understanding the project (mean of 3.89, out of 5, for both) and having activities
support the information presented (mean and 4.00, out of 5, for both). Comments from
the seminar 1 evaluation indicated that the faculty wanted more complete examples of
utilizing challenge-based learning and the project team responded by emailing more
complete examples to faculty. One faculty requested support; they wanted “feedback as
to what is appropriate content-wise, equipment-wise, and ideas of how to integrate the
engineering with the *content subject taught+.”
o Seminar 3 addressed concerns from the previous seminars (“seeing specific projects”;
“more conversation among the instructors”) and teamwork among students. Comments
from the seminar 3 evaluation surveys indicated that the faculty appreciated the
discussion related to student teamwork and examples but they still wanted more support
in accessing students, creating rubrics and bringing content into the projects.
o These concerns were discussed in the fourth seminar which had a different format.
Logistics of pre-post participant assessments and faculty course assessments were
discussed. Then, each faculty was given an opportunity to explain the challenge that will
be included in their course and the fit between their course and others. The highest
ratings for this seminar were for the activities and usefulness of the seminar (means of
3.67 and 3.33 out of 5, respectively).
Table 4-B has the descriptive results for the common evaluation questions across all seminars.
Table 4-B. Descriptive Results for Common Evaluations Questions
Session 1 n=9
Mean* (Std. Dev.)
Session 2 n=6
Mean* (Std. Dev.)
Session 3 n=6
Mean* (Std. Dev.)
Session 4 n=3
Mean* (Std. Dev.)
1. Please provide an OVERALL RATING for this seminar.
3.56 (.527)
4.00 (.601)
3.83 (.833)
3.00 (.601)
2. OVERALL, how would you rate this seminar in helping you understand the CEEMS project?
3.89 (1.095)
4.00 (.894)
3.83 (.753)
3.00 (.632)
3. OVERALL, the information presented will be USEFUL in my development of my CEEMS Summer Institute course.
3.78 (.983)
3.83 (.983)
3.67 (.816)
3.33 (1.140)
4. The seminar's activities helped me understand the materials presented.
3.89 (1.000)
4.00 (1.000)
3.60 (1.155)
3.67 (.577)
Scale: Five Points with 5 being most positive, 3 being a neutral response, and 1 being the most negative.
5
The resource team will be providing critical support to the participating teachers during the
upcoming academic year. The resource team structure was discussed at numerous executive committee
team meetings and it was determined that a total of eight resource team members with varied skills
working with all participants would be the most efficient use of resources for the first year. The project
team modified its initial design because it proposed having the subgroups of the resource team assigned
to specific schools based on geography. Recruitment of the resource team started with word-of-mouth
recommendations from district representatives and educators in the area and snowballed to include
recommendations from local professional organizations that had engineering outreach components.
Five resource team members hired have discipline specific (science, math, technology) teaching
experience and three resource team members have professional engineering experience with some
public school mentoring or tutoring exposure. Having the team work as one group serving all teachers
will enable the team to leverage all members’ strengths. The geographical distances can be managed
via email, web communication and video conferencing. The effectiveness of this resource team will be
evaluated as the academic year progresses.
Research Design
The research component of the CEEMS project is in the instrument development and planning
stage. The research and evaluation teams have been granted approval from the University of Cincinnati
Institutional Review Board. To minimize “over-surveying” participants, the research and evaluation
teams have created a comprehensive data management system that will help coordinate data collection
and data sharing. The first cohort of in-service and pre-service teacher participants have consented to
participating in the evaluation activities and the majority have agreed to be contacted by the
researchers if they are chosen to be part of the research study. The CEEMS research design is a case
study and this methodology has the potential to obtain in-depth data related to how and why the
project outputs and outcomes can be attributed to the project activities. Data collection instruments are
currently being developed and will be piloted during the 2012-2013 academic year.
Evaluation of the research component will focus on how effective the research results are in
helping the project team identify what supported and what inhibited the team’s ability to attain project
goals and to begin supporting the casual model. Effectiveness will be considered in terms of the outputs
and outcomes (i.e., number of participants studied and what these participants do) and in terms of the
research process itself (i.e., elements of a case study design, use of reliable and valid instruments,
scientific evidence related to the project’s theory of change). The change theory associated with this
project includes the following: A) Give teachers PD on how to implement design-based and challenged-
based instruction; B) Follow-up with school year support (administrative support, resource team
members, others); C) Changes in teacher attitudes and behaviors; D) Student learning increases; E)
Sustained change in teacher practices; which leads to F) Sustained increase in student achievement.
Sustainability
While activities associated with long term project sustainability are not expected at this time,
the CEEMS project has identified and developed a group of content and education faculty to provide

6
instruction that is cohesive and directly related to the project goals of incorporating challenge-based
learning and design-based processes into 7-12th grade units. These faculty members all reported
understanding the goals of the CEEMS project and the courses will continue to be taught as the project
progresses. These results were shown in the implementation section of this evaluation summary.
Additionally, the CEEMS project team is capitalizing on other NSF funded projects at the
University of Cincinnati. For example, some pre-service teachers participating in the CEEMS courses are
funded by WWOTF or NSF Noyce funds. One local teacher, who participated in UC’s Research
Experience for Teachers (RET) project, presented an example of her engineering design unit during a SIT
professional development session. This will provide credibility that these challenge-based learning units
can be created and successfully implemented in middle and high school classrooms.
7
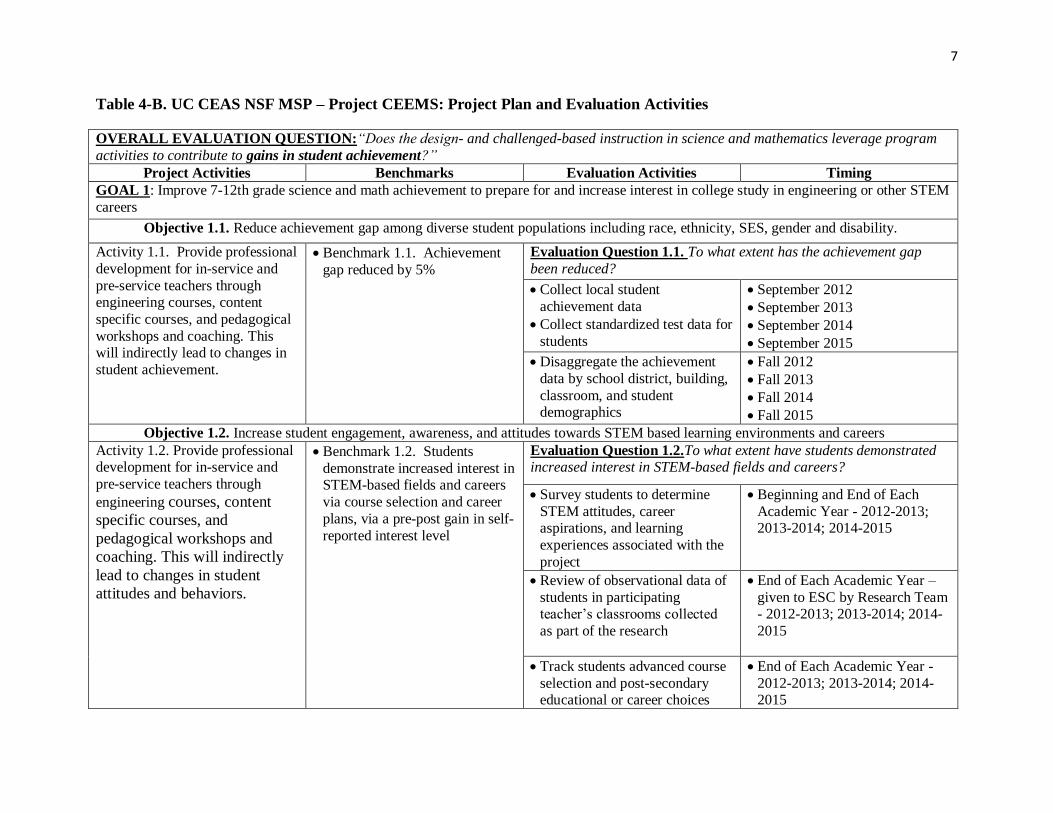
Table 4-B. UC CEAS NSF MSP – Project CEEMS: Project Plan and Evaluation Activities
OVERALL EVALUATION QUESTION:“Does the design- and challenged-based instruction in science and mathematics leverage program
activities to contribute to gains in student achievement?”
Project Activities Benchmarks Evaluation Activities Timing
GOAL 1: Improve 7-12th grade science and math achievement to prepare for and increase interest in college study in engineering or other STEM
careers
Objective 1.1. Reduce achievement gap among diverse student populations including race, ethnicity, SES, gender and disability.
Activity 1.1. Provide professional
development for in-service and
pre-service teachers through engineering courses, content
specific courses, and pedagogical
workshops and coaching. This will indirectly lead to changes in
student achievement.
Benchmark 1.1. Achievement
gap reduced by 5%
Evaluation Question 1.1. To what extent has the achievement gap
been reduced?
Collect local student
achievement data
Collect standardized test data for
students
September 2012
September 2013
September 2014
September 2015
Disaggregate the achievement
data by school district, building,
classroom, and student demographics
Fall 2012
Fall 2013
Fall 2014
Fall 2015
Objective 1.2. Increase student engagement, awareness, and attitudes towards STEM based learning environments and careers
Activity 1.2. Provide professional development for in-service and
pre-service teachers through
engineering courses, content
specific courses, and
pedagogical workshops and
coaching. This will indirectly
lead to changes in student
attitudes and behaviors.
Benchmark 1.2. Students
demonstrate increased interest in STEM-based fields and careers
via course selection and career
plans, via a pre-post gain in self-
reported interest level
Evaluation Question 1.2.To what extent have students demonstrated increased interest in STEM-based fields and careers?
Survey students to determine
STEM attitudes, career aspirations, and learning
experiences associated with the
project
Beginning and End of Each
Academic Year - 2012-2013; 2013-2014; 2014-2015
Review of observational data of
students in participating teacher’s classrooms collected
as part of the research
End of Each Academic Year –
given to ESC by Research Team - 2012-2013; 2013-2014; 2014-
2015
Track students advanced course
selection and post-secondary educational or career choices
End of Each Academic Year -
2012-2013; 2013-2014; 2014-2015

8
OVERALL EVALUATION QUESTION:“Does the design- and challenged-based instruction in science and mathematics leverage program
activities to contribute to gains in student achievement?”
Project Activities Benchmarks Evaluation Activities Timing
Objective 1.3. Increase students’ knowledge in STEM areas
Activity 1.3. Provide professional
development for in-service and
pre-service teachers through engineering courses, content
specific courses, and pedagogical
workshops and coaching. This will indirectly lead to changes in
student knowledge.
Benchmark 1.3. Student math
and science achievement scores
increase 5% to 10% annually
compared to the baseline achievement data.
Evaluation Question 1.3.To what extent do student math and science
achievement scores increase compared to baseline data.
Collect local student
achievement data
Collect standardized test data for
students
September 2012
September 2013
September 2014
September 2015
Review student artifacts
End of Each Academic Year –
given to ESC by Research Team - 2012-2013; 2013-2014; 2014-
2015
GOAL 2: Develop math and science teacher knowledge of engineering and the engineering design-and-challenge instruction process through
explicit training and classroom implementation support.
Objective 2.1. Prepare for Summer Institute for Teachers and other licensure pathways by designing courses and hiring resource team.
Activity 2.1a. Design team create
the material for SIT summer
program
Benchmark 2.1a. Creation of
SIT
Evaluation Question 2.1a. Were the project activities conducted to
create the SIT consistent with the plan? If changes were made, why?
Document review and content
analysis of SITplanning records and curricular materials
Work with Engineering, A&S
and Education faculty to
develop questions related to
content and pedagogy; Pre-surveys will be distributed when
participants are identified. Post-
surveys will be administered annually
Collect data in Winter and
Spring
Updated June 2013
Updated June 2014
Updated June 2015
Activity 2.1b. Hire personnel for
Resource Teams Benchmark 2.1b. Resource team
personnel are hired and working
with SIT participants.
Evaluation Question 2.1b. What supports are provided by the
resource team and what impact does it have on activities and lessons?
Review minutes from Executive
Committee meetings
Review project hiring
Summarized June 2012
Updated June 2013
Updated June 2014

9
OVERALL EVALUATION QUESTION:“Does the design- and challenged-based instruction in science and mathematics leverage program
activities to contribute to gains in student achievement?”
Project Activities Benchmarks Evaluation Activities Timing
documentation
Interview resource team
members to get their perception
of what they are doing.
Survey teachers about support
provided to them by the resource
team
Updated June 2015
Objective 2.2. Offer Summer Institute for Teachers.
i. Effectively train 385 7-12th grade science or math teachers in the use of math or science instructional practices using
engineering as a context for guided design and challenge based inquiry and project based learning
ii. Indirectly impact 200 in-service teachers through SIT dissemination activities
iii. Through direct and indirect impact of project activities, 50-75% of each school district’s science and math teachers actively engaged
iv. Increase participating teachers’ use of design and challenge based instruction utilizing engineering concepts
v. Increase teachers’ knowledge of STEM based fields and careers, so they can better guide students into career pathways
Activity 2.2a. Summer Institute for Teachers (SIT)
Benchmark 2.2a1. Attendance
record—100% of teachers attend 90% of PD training
Evaluation Question 2.2a1. What was the attendance rate of the SIT?
Review SIT attendance records August 2012, August 2013,
August 2014, August 2015
Benchmark 2.2a2. 100% of
teachers positively react to professional development.
Evaluation Question 2.2a2. What impact did the SIT have on teacher’s math and science instructional practices, attitudes, and
beliefs?
Survey teachers related to
STEM attitudes, career
recommendations, and teaching practices associated with the
project
Survey of teachers to determine
reaction to professional development and curricular
materials expected usefulness
Conduct interviews with a
sample of teachers annually
Pre-post Current Instructional
Practices Survey – June 2012,
May 2013, May 2014 for first SIT participant cohort; similar
timing for later cohorts
Course evaluations –completion
of each course
End-of-SIT Survey –August
2012, August 2013, August
2014, August 2015
Teacher interviews – May 2013,
10
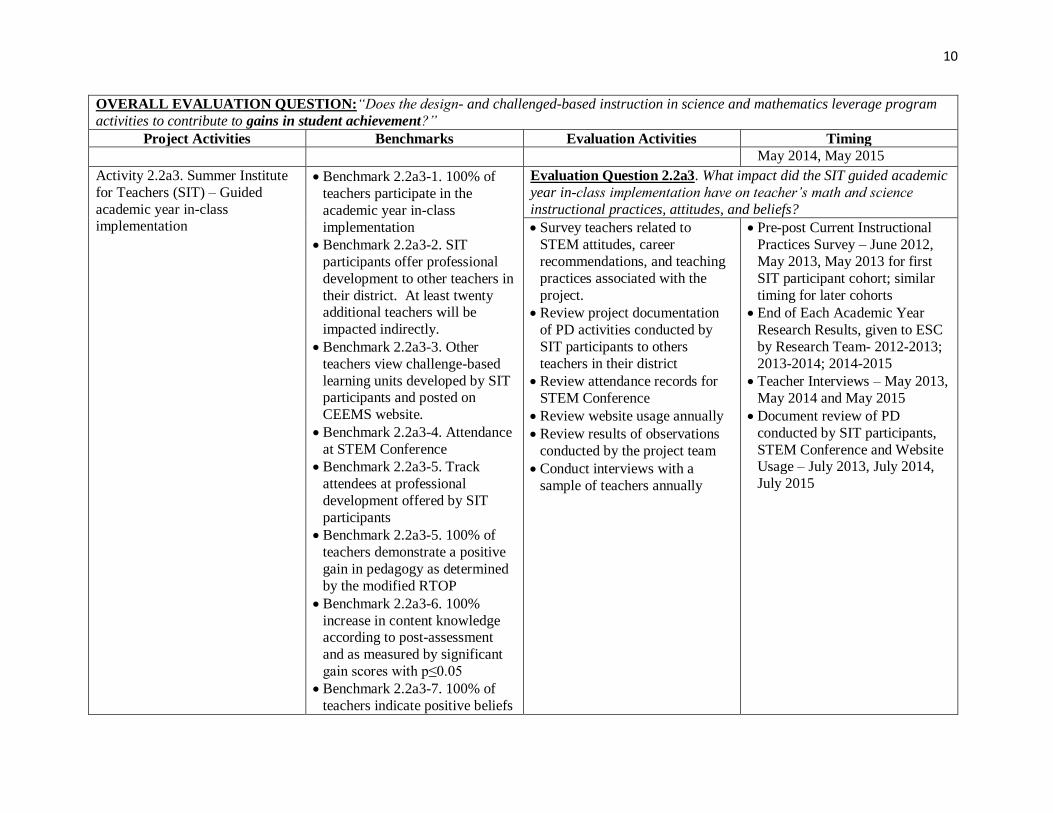
OVERALL EVALUATION QUESTION:“Does the design- and challenged-based instruction in science and mathematics leverage program
activities to contribute to gains in student achievement?”
Project Activities Benchmarks Evaluation Activities Timing
May 2014, May 2015
Activity 2.2a3. Summer Institute
for Teachers (SIT) – Guided
academic year in-class implementation
Benchmark 2.2a3-1. 100% of
teachers participate in the
academic year in-class
implementation
Benchmark 2.2a3-2. SIT
participants offer professional
development to other teachers in
their district. At least twenty additional teachers will be
impacted indirectly.
Benchmark 2.2a3-3. Other
teachers view challenge-based
learning units developed by SIT participants and posted on
CEEMS website.
Benchmark 2.2a3-4. Attendance
at STEM Conference
Benchmark 2.2a3-5. Track
attendees at professional
development offered by SIT
participants
Benchmark 2.2a3-5. 100% of
teachers demonstrate a positive
gain in pedagogy as determined
by the modified RTOP
Benchmark 2.2a3-6. 100%
increase in content knowledge according to post-assessment
and as measured by significant
gain scores with p≤0.05
Benchmark 2.2a3-7. 100% of
teachers indicate positive beliefs
Evaluation Question 2.2a3. What impact did the SIT guided academic
year in-class implementation have on teacher’s math and science
instructional practices, attitudes, and beliefs?
Survey teachers related to
STEM attitudes, career
recommendations, and teaching
practices associated with the
project.
Review project documentation
of PD activities conducted by
SIT participants to others
teachers in their district
Review attendance records for
STEM Conference
Review website usage annually
Review results of observations
conducted by the project team
Conduct interviews with a
sample of teachers annually
Pre-post Current Instructional
Practices Survey – June 2012,
May 2013, May 2013 for first
SIT participant cohort; similar
timing for later cohorts
End of Each Academic Year
Research Results, given to ESC
by Research Team- 2012-2013;
2013-2014; 2014-2015
Teacher Interviews – May 2013,
May 2014 and May 2015
Document review of PD
conducted by SIT participants,
STEM Conference and Website Usage – July 2013, July 2014,
July 2015
11
OVERALL EVALUATION QUESTION:“Does the design- and challenged-based instruction in science and mathematics leverage program
activities to contribute to gains in student achievement?”
Project Activities Benchmarks Evaluation Activities Timing
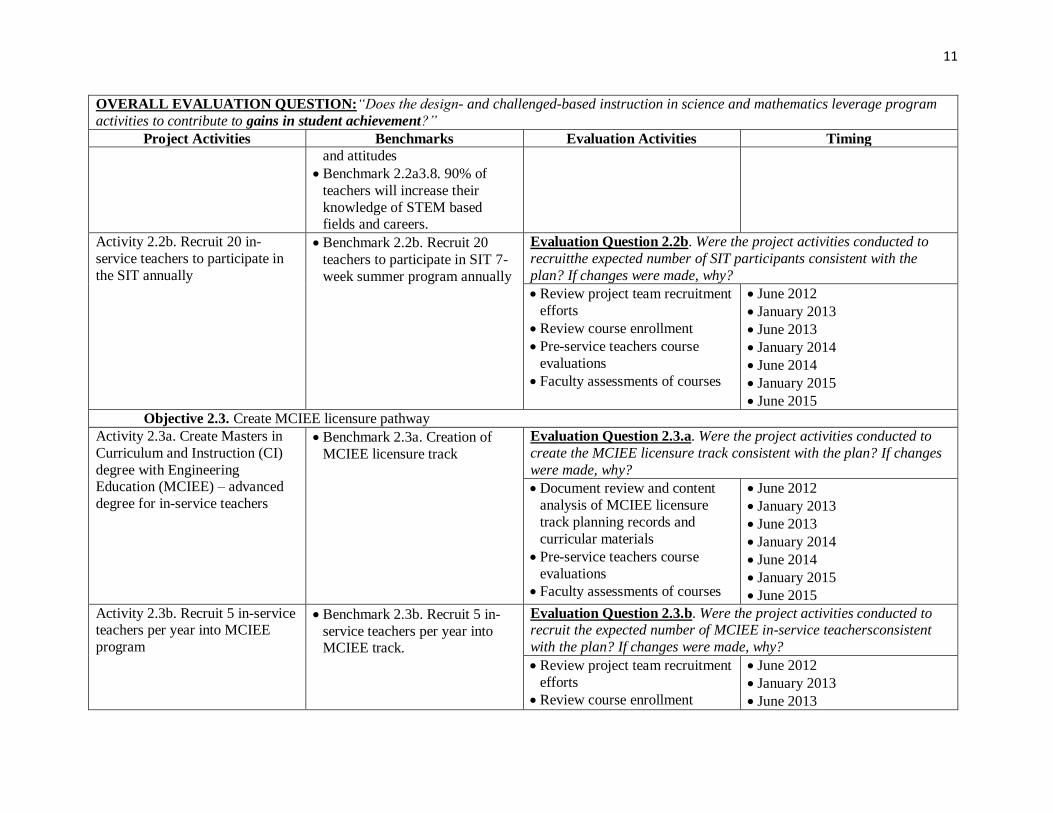
and attitudes
Benchmark 2.2a3.8. 90% of
teachers will increase their
knowledge of STEM based fields and careers.
Activity 2.2b. Recruit 20 in-
service teachers to participate in
the SIT annually
Benchmark 2.2b. Recruit 20
teachers to participate in SIT 7-
week summer program annually
Evaluation Question 2.2b. Were the project activities conducted to
recruitthe expected number of SIT participants consistent with the
plan? If changes were made, why?
Review project team recruitment
efforts
Review course enrollment
Pre-service teachers course
evaluations
Faculty assessments of courses
June 2012
January 2013
June 2013
January 2014
June 2014
January 2015
June 2015
Objective 2.3. Create MCIEE licensure pathway
Activity 2.3a. Create Masters in
Curriculum and Instruction (CI)
degree with Engineering Education (MCIEE) – advanced
degree for in-service teachers
Benchmark 2.3a. Creation of
MCIEE licensure track
Evaluation Question 2.3.a. Were the project activities conducted to
create the MCIEE licensure track consistent with the plan? If changes
were made, why?
Document review and content
analysis of MCIEE licensure
track planning records and
curricular materials
Pre-service teachers course
evaluations
Faculty assessments of courses
June 2012
January 2013
June 2013
January 2014
June 2014
January 2015
June 2015
Activity 2.3b. Recruit 5 in-service teachers per year into MCIEE
program
Benchmark 2.3b. Recruit 5 in-
service teachers per year into MCIEE track.
Evaluation Question 2.3.b. Were the project activities conducted to recruit the expected number of MCIEE in-service teachersconsistent
with the plan? If changes were made, why?
Review project team recruitment
efforts
Review course enrollment
June 2012
January 2013
June 2013

12
OVERALL EVALUATION QUESTION:“Does the design- and challenged-based instruction in science and mathematics leverage program
activities to contribute to gains in student achievement?”
Project Activities Benchmarks Evaluation Activities Timing
Pre-service teachers course
evaluations
Faculty assessments of courses
January 2014
June 2014
January 2015
June 2015
Activity 2.3c. Recruit 20 pre-
service teachers per year into the
MCIEE program
Benchmark 2.3c. Recruit 20 pre-
service teachers per year into
MCIEE track.
Evaluation Question 2.3.c. Were the project activities conducted to
recruit the expected number of MCIEE pre-service teachersconsistent
with the plan? If changes were made, why?
Review project team recruitment
efforts
Review course enrollment
Course evaluations
Faculty assessments of courses
June 2012
January 2013
June 2013
January 2014
June 2014
January 2015
June 2015
GOAL 3: Recruit engineering undergraduates as science or math teachers through involvement in teaching experiences with younger college students and in the schools and then a succinct licensure program.
Objective 3.1. Create Education Pathway with Licensure for Engineering (EPLE) majors
Activity 3.1a Create Education
Pathway with Licensure for Engineering (EPLE) pathway
Benchmark 3.1a. EPLE pathway
is created.
Evaluation Question 3.1a. Were the project activities conducted to
create the EPLE pathway consistent with the plan? If changes were made, why?
Document review and content
analysis of EPLE pathway
planning records and curricular
materials
Course evaluations
Faculty assessments of courses
January 2013
June 2013
January 2014
June 2014
January 2015
June 2015
Activity 3.1b. Make an ACCEND
program option available in
CEAS
Benchmark 3.1b. ACCEND
program is available in CEAS.
Evaluation Question 3.1b. Were the project activities conducted to
create the ACCEND program consistent with the plan? If changes
were made, why?
Review official UC CEAS
documentation
January 2013
June 2013
January 2014

13
OVERALL EVALUATION QUESTION:“Does the design- and challenged-based instruction in science and mathematics leverage program
activities to contribute to gains in student achievement?”
Project Activities Benchmarks Evaluation Activities Timing
June 2014
January 2015
June 2015
Objective 3.2. Develop and teach ten courses outlined in the proposal
Activity 3.2a. Develop and teach
ten courses Benchmark 3.2a-1. As
determined through self-report
surveys, in-service teachers
working with undergraduate engineering students will have
an increased knowledge of
STEM based fields and careers so they can better guide students
in career pathways.
Benchmark 3.2a-2. All undergraduate engineering
students can use design and challenged based instruction
utilizing engineering concepts as
demonstrated by the course
artifacts.
Benchmark 3.2a-3. 95% of
students report that the
program made them prepared
to teach science and math in
7-12th grade classrooms as
demonstrated by course
evaluations and surveys
Evaluation Question 3.2a. What impact did the course have on EPLE
participant’s math and science instructional practices, attitudes, and
beliefs?
Course evaluations
Faculty assessments of courses
Review research activities
related to classroom
observations of these
engineering students
Review licensure documentation
Annually survey or interview
undergraduate students related
to their experience in the
program
Annually survey in-service
teachers working with these engineering students
End of Each Academic Year –
given to ESC by Research Team
– 2012-2013; 2013-2014; 2014-
2015
End of Each Academic Year
research results, given to ESC by Research Team – 2012-2013;
2013-2014; 2014-2015
Course evaluations administered
at the completion of each course; results sent to project
team regularly to facilitate
continuous improvement efforts
Faculty Course Assessment
survey completed at the after
each course is taught; results
sent to project team regularly to
facilitate continuous improvement efforts
Objective 3.3. Recruit undergraduate engineering students for the ELPE pathway
Activity 3.3a. Recruit 10 per year
engineering undergraduate
students into the EPLE track beginning in 2012-13.
Benchmark 3.3a-1. Recruit 40
undergraduate engineering
students into program
Benchmark 3.3a-2. 75% of the
Evaluation Question 3.3. Were the project activities conducted to
recruit the expected number of EPLE engineering undergraduate
studentsconsistent with the plan? If changes were made, why?
Review project team recruitment January 2013
14
OVERALL EVALUATION QUESTION:“Does the design- and challenged-based instruction in science and mathematics leverage program
activities to contribute to gains in student achievement?”
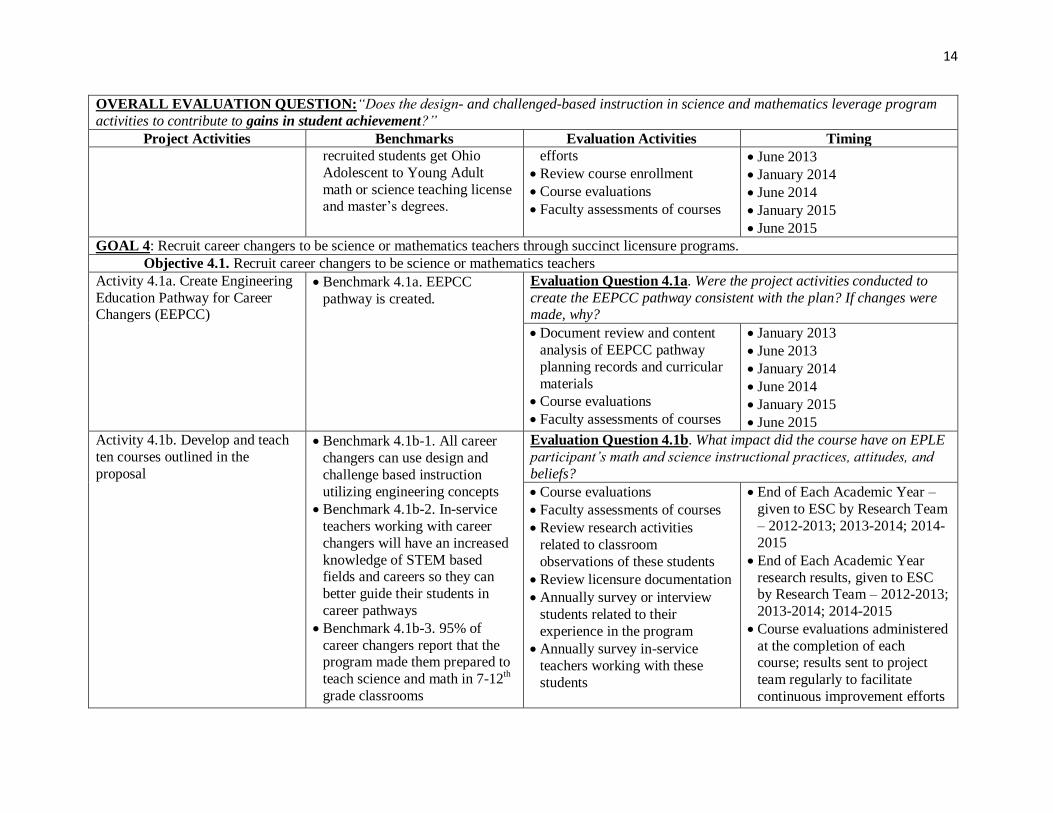
Project Activities Benchmarks Evaluation Activities Timing
recruited students get Ohio
Adolescent to Young Adult
math or science teaching license and master’s degrees.
efforts
Review course enrollment
Course evaluations
Faculty assessments of courses
June 2013
January 2014
June 2014
January 2015
June 2015
GOAL 4: Recruit career changers to be science or mathematics teachers through succinct licensure programs.
Objective 4.1. Recruit career changers to be science or mathematics teachers
Activity 4.1a. Create Engineering
Education Pathway for Career Changers (EEPCC)
Benchmark 4.1a. EEPCC
pathway is created.
Evaluation Question 4.1a. Were the project activities conducted to
create the EEPCC pathway consistent with the plan? If changes were made, why?
Document review and content
analysis of EEPCC pathway
planning records and curricular
materials
Course evaluations
Faculty assessments of courses
January 2013
June 2013
January 2014
June 2014
January 2015
June 2015
Activity 4.1b. Develop and teach
ten courses outlined in the
proposal
Benchmark 4.1b-1. All career
changers can use design and
challenge based instruction
utilizing engineering concepts
Benchmark 4.1b-2. In-service
teachers working with career
changers will have an increased
knowledge of STEM based fields and careers so they can
better guide their students in
career pathways
Benchmark 4.1b-3. 95% of
career changers report that the program made them prepared to
teach science and math in 7-12th
grade classrooms
Evaluation Question 4.1b. What impact did the course have on EPLE
participant’s math and science instructional practices, attitudes, and
beliefs?
Course evaluations
Faculty assessments of courses
Review research activities
related to classroom
observations of these students
Review licensure documentation
Annually survey or interview
students related to their
experience in the program
Annually survey in-service
teachers working with these
students
End of Each Academic Year –
given to ESC by Research Team
– 2012-2013; 2013-2014; 2014-
2015
End of Each Academic Year
research results, given to ESC by Research Team – 2012-2013;
2013-2014; 2014-2015
Course evaluations administered
at the completion of each course; results sent to project
team regularly to facilitate
continuous improvement efforts
15
OVERALL EVALUATION QUESTION:“Does the design- and challenged-based instruction in science and mathematics leverage program
activities to contribute to gains in student achievement?”
Project Activities Benchmarks Evaluation Activities Timing
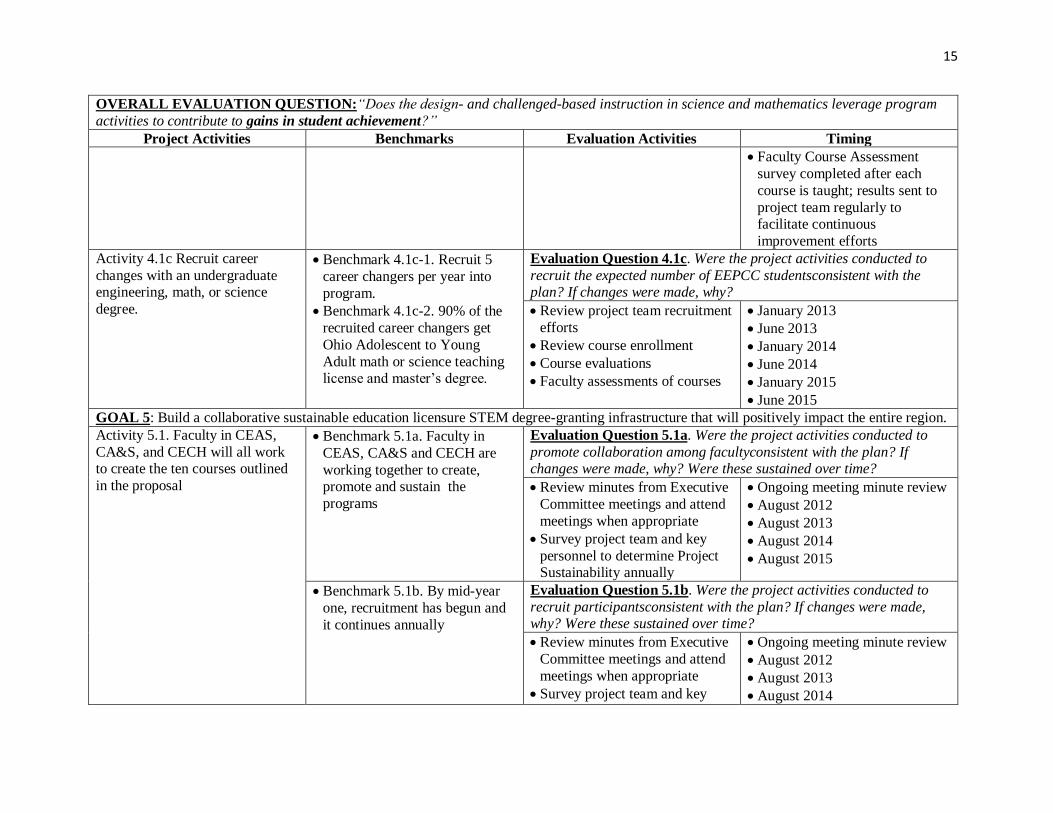
Faculty Course Assessment
survey completed after each
course is taught; results sent to
project team regularly to facilitate continuous
improvement efforts
Activity 4.1c Recruit career
changes with an undergraduate engineering, math, or science
degree.
Benchmark 4.1c-1. Recruit 5
career changers per year into
program.
Benchmark 4.1c-2. 90% of the
recruited career changers get
Ohio Adolescent to Young
Adult math or science teaching license and master’s degree.
Evaluation Question 4.1c. Were the project activities conducted to
recruit the expected number of EEPCC studentsconsistent with the plan? If changes were made, why?
Review project team recruitment
efforts
Review course enrollment
Course evaluations
Faculty assessments of courses
January 2013
June 2013
January 2014
June 2014
January 2015
June 2015
GOAL 5: Build a collaborative sustainable education licensure STEM degree-granting infrastructure that will positively impact the entire region.
Activity 5.1. Faculty in CEAS,
CA&S, and CECH will all work to create the ten courses outlined
in the proposal
Benchmark 5.1a. Faculty in
CEAS, CA&S and CECH are
working together to create, promote and sustain the
programs
Evaluation Question 5.1a. Were the project activities conducted to
promote collaboration among facultyconsistent with the plan? If changes were made, why? Were these sustained over time?
Review minutes from Executive
Committee meetings and attend
meetings when appropriate
Survey project team and key
personnel to determine Project Sustainability annually
Ongoing meeting minute review
August 2012
August 2013
August 2014
August 2015
Benchmark 5.1b. By mid-year
one, recruitment has begun and
it continues annually
Evaluation Question 5.1b. Were the project activities conducted to
recruit participantsconsistent with the plan? If changes were made, why? Were these sustained over time?
Review minutes from Executive
Committee meetings and attend
meetings when appropriate
Survey project team and key
Ongoing meeting minute review
August 2012
August 2013
August 2014
16
OVERALL EVALUATION QUESTION:“Does the design- and challenged-based instruction in science and mathematics leverage program
activities to contribute to gains in student achievement?”
Project Activities Benchmarks Evaluation Activities Timing
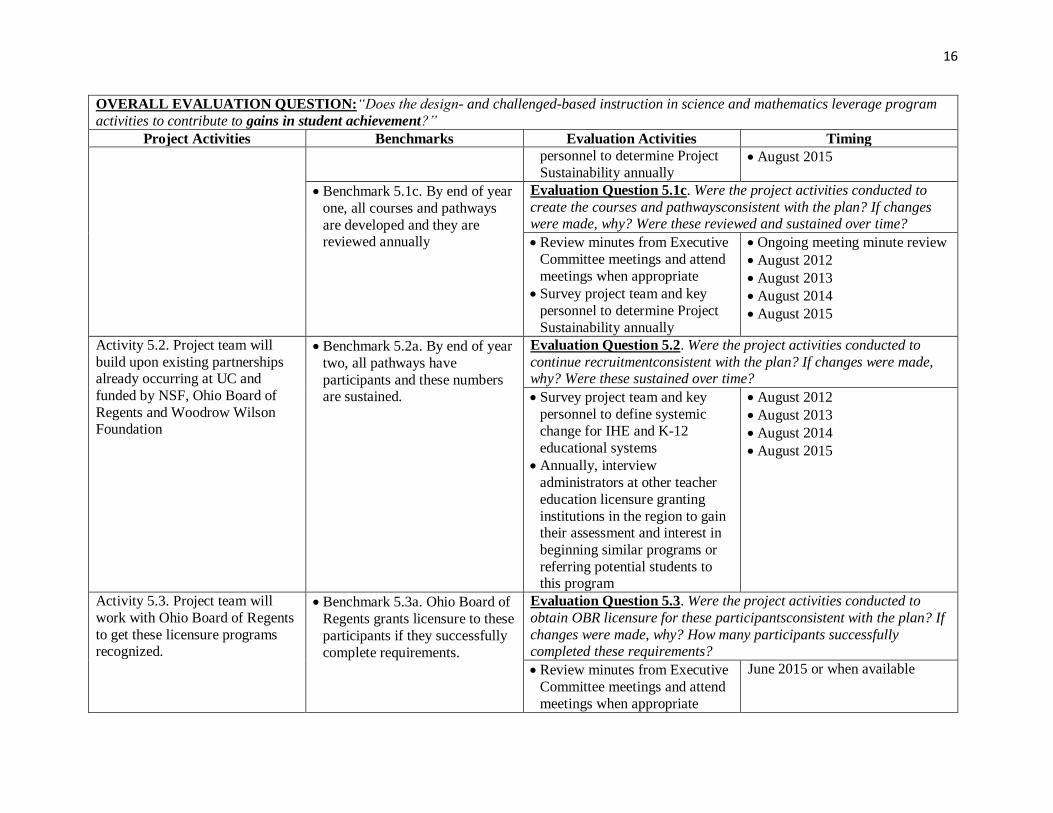
personnel to determine Project
Sustainability annually August 2015
Benchmark 5.1c. By end of year
one, all courses and pathways
are developed and they are reviewed annually
Evaluation Question 5.1c. Were the project activities conducted to
create the courses and pathwaysconsistent with the plan? If changes were made, why? Were these reviewed and sustained over time?
Review minutes from Executive
Committee meetings and attend
meetings when appropriate
Survey project team and key
personnel to determine Project
Sustainability annually
Ongoing meeting minute review
August 2012
August 2013
August 2014
August 2015
Activity 5.2. Project team will
build upon existing partnerships already occurring at UC and
funded by NSF, Ohio Board of
Regents and Woodrow Wilson Foundation
Benchmark 5.2a. By end of year
two, all pathways have
participants and these numbers are sustained.
Evaluation Question 5.2. Were the project activities conducted to
continue recruitmentconsistent with the plan? If changes were made, why? Were these sustained over time?
Survey project team and key
personnel to define systemic
change for IHE and K-12
educational systems
Annually, interview
administrators at other teacher
education licensure granting
institutions in the region to gain their assessment and interest in
beginning similar programs or
referring potential students to this program
August 2012
August 2013
August 2014
August 2015
Activity 5.3. Project team will
work with Ohio Board of Regents
to get these licensure programs recognized.
Benchmark 5.3a. Ohio Board of
Regents grants licensure to these
participants if they successfully
complete requirements.
Evaluation Question 5.3. Were the project activities conducted to
obtain OBR licensure for these participantsconsistent with the plan? If
changes were made, why? How many participants successfully completed these requirements?
Review minutes from Executive
Committee meetings and attend
meetings when appropriate
June 2015 or when available

17
OVERALL EVALUATION QUESTION:“Does the design- and challenged-based instruction in science and mathematics leverage program
activities to contribute to gains in student achievement?”
Project Activities Benchmarks Evaluation Activities Timing
Annually, interview
administrators at other teacher
education licensure granting
institutions in the region to gain their assessment and interest in
beginning similar programs or
referring potential students to
this program
Review documentation
pertaining to licensure
submission and decision by
OBR
Activity 5.4. Dissemination of
materials and results. Benchmark 5.4a. Launch a
website to provide centralized
points of access for
dissemination of project
information and lesson materials.
Evaluation Question 5.4a. What is on the CEEMS website? Who is
using it? How is it being used?
Review CEEMS project website
usage
Survey project team and key
personnel to determine Project Sustainability annually
June 2013
June 2014
June 2015
Benchmark 5.4b. Research
presented at professional
conferences and in peer-
reviewed publications
Evaluation Question 5.4b. What activities are being conducted by the
researchers and project team to disseminate the CEEMS project
materials and results?
Document project related
research publications and
presentations authored by
project team members
Document project related
research publications and
presentations authored by
research team members
Document project related
research publications and presentations authored by
End of Each Academic Year
Research Results, given to ESC
by Research Team- 2012-2013;
2013-2014; 2014-2015
Document review of PD
conducted by Research and
Project Team members – July
2013, July 2014, July 2015
Survey – June 2013, June 2014,
June 2015

18
OVERALL EVALUATION QUESTION:“Does the design- and challenged-based instruction in science and mathematics leverage program
activities to contribute to gains in student achievement?”
Project Activities Benchmarks Evaluation Activities Timing
participating teachers
Survey project team and key
personnel to determine Project
Sustainability annually
Benchmark 5.4c. Participants
serve as presenters at the STEM annual conference and
professional development
workshops
Evaluation Question 5.4c. What activities are being conducted by the project participants to disseminate the CEEMS project materials and
results?
Review STEM conference
agenda and evaluation results
Review project documentation
related to academic year PD
workshops
Conduct interviews with a
sample of teachers annually
End of Each Academic Year
Research Results, given to ESC by Research Team- 2012-2013;
2013-2014; 2014-2015
Teacher Interviews – May 2013,
May 2014 and May 2015
Document review of PD
conducted by SIT participants and STEM Conference – July
2013, July 2014, July 2015