NRW Strategic Plan - acwua.org · Auditing 7.1 Core NRW unit ... $5,000 per km + $500 per annum per...
16
12/6/2018`1 NRW Strategic Plan Water Management Initiative SESSION 3&4 Amman, December 4, 2018
-
Upload
nguyenhuong -
Category
Documents
-
view
222 -
download
0
Transcript of NRW Strategic Plan - acwua.org · Auditing 7.1 Core NRW unit ... $5,000 per km + $500 per annum per...

12/6/2018`1
NRW Strategic PlanWater Management Initiative
SESSION 3&4
Amman, December 4, 2018

Outline
12/6/2018
• Masterplan Elements and Targets
– Distribution Systems B to C example
– Zarqa B to C example: Distribution Systems

Sustaining Practices
(proportional to system size and level)
NRW Master PlanPlan Components
12/6/2018
Responsibility
framework
Employment
Standards
Policies
Operating
ProcedureskNowledge
Systems
Infrastructure
• Civil works
• Targeted rehabilitation
• Instrumentation
• Telemetry
• Data update
Business process
Upgrade
• Network
operations
• Customer
operations
Leadership
Equipment
Sector
Centr
al U
tilit
y
Each Primary/Distribution system

Sustaining Practices
NRW Master PlanDistribution Systems (B to C)
12/6/2018
Auditing
7.1 Core NRW unit
8.3 DMA monitoring and control 8.1
maintenance
9.1Leak inspection
1.2 DMA standards
1.1 Distribution
system metering
policy
2.5 DMA monitoring
system
Infrastructure
5.5 Hydraulic reinforcement
5.6 Bulk meter and pressure monitoring and
control
5.7 Permanent pressure monitoring
5.8 Intensive ALC and restoration
5.9 GIS update
3.3 Network
corrective
maintenance
operations
optimization
Demand management towards 24/7
Sector
Centr
al U
tilit
y
Each DMA Zone

Category B to CDistribution Systems
12/6/2018
Systems
2.5 DMA monitoring system (Category C and above)
budget price: $50,000 per utility + $10,000 per annum per utility
Infrastructure
5.5 DMA hydraulic reinforcement and Isolation design and works
budget cost: $6,000 per km + $200 per annum per km)
5.6 DMA bulk meter and pressure monitoring and control
budget cost: $20,000 per DMA + $4,000 per annum per DMA
5.7 DMA permanent network pressure monitoring points
budget cost: $9,000 per DMA + $1,800 per annum per DMA
5.8 DMA intensive ALC and restoration under continuous supply
budget cost: $5,000 per km + $500 per annum per km
5.9 DMA GIS Update
budget cost: $100 per km + $10 per annum per km

Category B to CDistribution Systems
12/6/2018
DMA Monitoring
System• MNF
• AZP
• Critical point pressure
• Max P point pressure
• ILI
• ESPBs
• Etc.
DMA3
DMA4
DMA1
DMA2
DMA5
✔️
✔️
✔️

Category B to CDistribution Systems
12/6/2018
-
1
2
3
4
5
6
7
-
10
20
30
40
50
60
Pre
ssure
(bar
)
Flo
w (
m3/h
)
DMA Chart
Flow Target MNF P high P avg P low

Category B to CDistribution Systems
12/6/2018
Core NRW unit analysis
1 team per utility, budget cost: $80,000 per annum per utility
8.3 DMA monitoring and control maintenance
1 team per 50 DMA, budget cost: $50,000 per annum per 50 DMAs
9.1 Leak inspection and repair
1 team per 1000 km, budget cost: $70 per annum per km
• Procedure outline
• Staff needed
• Equipment needed
• Training needed
Costing ExampleZarqa Distribution Systems (B to C) - Capital
12/6/2018
No. Intervention
Unit
Fixed
Cost
(USD)
Unit
Annual
Cost
(USD)
Scaling Unit
Capital
Maintenance
Period
(year)
Scale
(No.)
Ratio
Required
(%)
Capital
Cost
(USD)
Annual
Maintenancee
Cost
(USD)
2.5 DMA monitoring system 50,000 10,000 Utility 5 1 100% 50,000 10,000
2.6 Smart meter monitoring system for big customers 100,000 20,000 Utility 5 1 100% 100,000 20,000
5.5 DMA hydraulic reinforcement and Isolation 6,000 200 Km 30 3200 80% 15,360,000 512,000
5.6 DMA bulk meter and pressure monitoring and control 20,000 4,000 DMA 5 216 80% 3,456,000 691,200
5.7 DMA permanent network pressure monitoring points 9,000 1,800 DMA 5 216 100% 1,944,000 388,800
5.8 DMA intensive ALC and restoration under cont. supply 5,000 500 Km 10 3200 100% 16,000,000 1,600,000
5.9 DMA GIS Update 100 10 Km 10 3200 100% 320,000 32,000
6.4 Smart big customer static meter chambers 4,000 400 big cust'mr 10 239 100% 956,000 95,600
6.5 Smart big customer static meters 1,000 200 big cust'mr 5 239 100% 239,000 47,800
38,425,000 3,397,400Total

Costing ExampleZarqa Distribution Systems (B to C) - Operational
12/6/2018
No. Intervention
Unit
Annual
Cost
(USD)
Scaling Unit Scale
(No.)
Ratio
Required
(%)
Annual
Operating
Cost
(USD)
7.1 Core NRW Unit 80,000 Utility 1 100% 80,000
8.1 Primary system Monitoring and Control Maintenance teams 70,000 SCADA Point 3 100% 210,000
8.2 DZ Monitoring and Control Maintenance teams 50,000 DZ 1 100% 50,000
8.3 DMA Monitoring and Control Maintenance teams 50,000 DMA 5 100% 250,000
9.1 Leak inspection and repair teams 70,000 1000 Km 4 100% 280,000
9.2 Unauthorized consumption inspection and treatment teams 50,000 50K cust'mr 4 100% 200,000
9.3 Billing cycle visual inspection readers/inspectors 20,000 4K cust'mr 45 100% 900,000
9.4 Customer meter inspection and maintenance teams 50,000 50K cust'mr 4 100% 200,000
9.5 Big customer meter inspection and maintenance teams 50,000 50 big cust'mr 5 100% 250,000
10.1 Operational GIS update teams 50,000 500 Km 7 100% 350,000
2,770,000Total

DMA Flow CPP AZP PRV E Diff Supply Mains Customers
DMA1 Yes Yes Yes N/A 32 24/7 12 1222
DMA2 Yes Yes Yes N/A 10 24/7 9 3100
DMA2 Yes - Yes Yes 34 24/7 14 2190
DMA3 Yes Yes - N/A 22 24/7 17 1242
DMA4 Yes Yes Yes N/A 31 24/7 22 3425
DMA5 Yes - Yes N/A 13 24/7 7.5 2331
DMA5 - - Yes Yes 44 24/7 23 5401
DMA5 Yes Yes Yes - 29 24/7 14 534
Etc.
12/6/2018
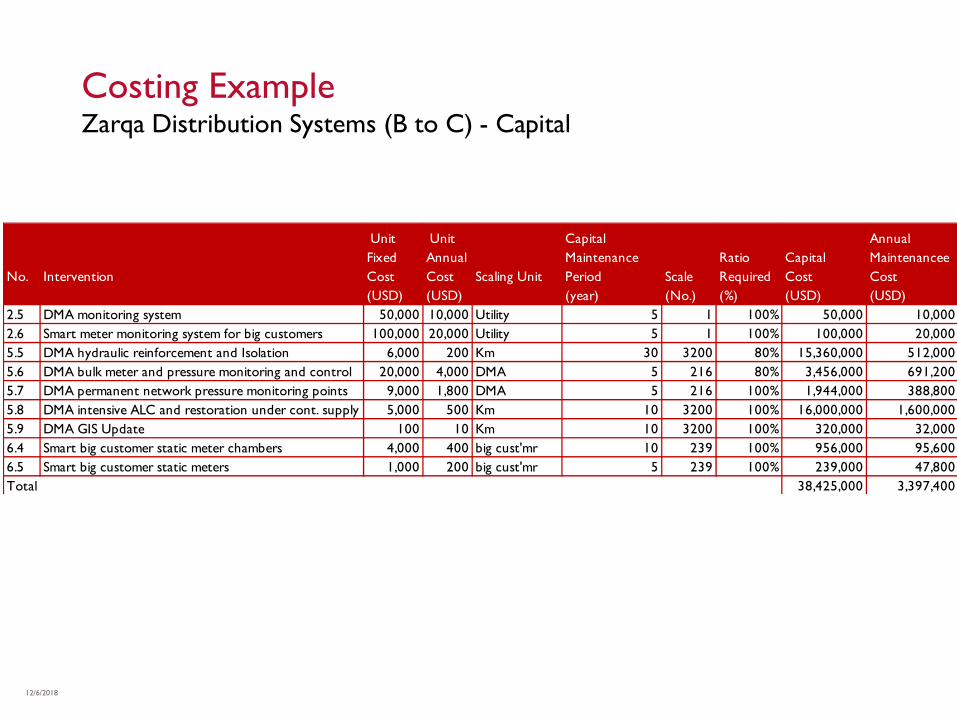
Distribution systemsAuditing of Targets
DMA Implementation example
Component Status Validation
Flow Active Logging and MNF summary on system
AZP P Active Logging and summary on system available for use.
Critical P inactive Not implemented. Old data only.
Max P Not collected Not implemented.
Etc.
12/6/2018
Category B to CAuditing of Targets
DMA Monitoring example

Area Unit Annual
Target
Annual
completion
Validated?
Leak Km 50% 80% GIS survey maps
Leak connections 50% 120% GIS survey maps
UAC Properties 100% 60% No validation evidence
Meters Customers 100% 60% GIS survey maps
Etc.
12/6/2018
Category B to CAuditing of Targets
DMA Inspection example

Variable Unit Value Validated?
AZP m No data evidence
ΔP at critical m 16 Calculated from logging
MNF m3/h 34 Logged data summarized in system
LNC m3 13 Estimation only
NRW/Year m3 45500 Billing not validated. No error margins at 95% CL.
UARL m3 12000 Based on estimation of AZP
CARL m3 36000 No pressure correction
ILI - 14
Etc.
12/6/2018
Category B to CAuditing of Targets
DMA Analysis example

12/6/2018
-
1
2
3
4
5
6
7
-
10
20
30
40
50
60
12:
00
13:
00
14:
00
15:
00
16:
001
7:00
18:
00
19:
00
20:
00
21:
002
2:00
23:
00
00:
00
01:
00
02:
00
03:
000
4:00
05:
00
06:
00
07:
00
08:
000
9:00
10:
00
11:
00
12:
00
13:
001
4:00
15:
00
16:
00
17:
00
18:
001
9:00
20:
00
21:
00
22:
00
23:
00
00:
000
1:00
02:
00
03:
00
04:
00
05:
000
6:00
07:
00
08:
00
09:
00
10:
001
1:00
12:
00
Pre
ssu
re (
bar
)
Flo
w (
m3
/h)
DMA Chart
Flow Target MNF P high P avg P low
Air Valve
Standard
Elevation
≤ 30 m
reinforcement and restructuring
PRV
DMA
flow monitoring
Private
Secondary
P
P
P
Critical Point
pressure monitoring
Average Point
pressure monitoring
Max Point
pressure monitoring
verification of pressure and isolationfield leak inspection
Unit DMA1 DMA2 DMA3 DMA4 DMA5 DMA6 DMA7 DMA8 DMA9
Lengthofmains Km 9.5 14 6 8 11 8 13 7 12
Serviceconnec ons No. 295 784 114 360 297 184 520 266 120
Connec ondensity Km-1 31 56 19 45 27 23 40 38 10
Customers No. 1054 2408 513 1395 999 713 1640 1102 390
MNF m3/h 12.8 30.8 5.9 15.5 12.1 11.4 18.9 26.6 5.1
MNF-TargetMNF m3/h 0.9 3.8 0.1 0.1 0.6 3.3 0.3 14.4 0.0
Pavg@MNF Bar 3.7 3.9 3.3 3.0 3.6 4.4 3.3 4.9 3.2
AZP Bar 3 3.2 2.6 2.4 2.9 3.6 2.6 4.1 2.5
LNC m3/h 10.5 24.1 5.1 14.0 10.0 7.1 16.4 11.0 3.9
Leakage m3/h 1.8 5.5 0.6 1.2 1.7 3.6 2.0 13.0 0.9
Leakage l/c/d 150 168 131 80 137 464 91 1173 183
ILI - 3.6 4.7 2.9 2.8 3.2 8.1 2.8 22.5 2.8
well-equipped and responsive treatment of bursts
classification and documentation of leaks
assessment of losses
DMA monitoring

12/6/2018`1
THANK YOU FOR ATTENTION!!
Amman, December 4, 2018