NREL/CP-520-44968 Spectrum Enabling Accelerated Testing of … · 2013-09-27 · Conference Paper ....
15
Conference Paper NREL/CP-520-44968 July 2009 Analysis of Transmitted Optical Spectrum Enabling Accelerated Testing of CPV Designs Preprint D.C. Miller, M.D. Kempe, C.E. Kennedy, and S.R. Kurtz To be presented at the Society of Photographic Instrumentation Engineers (SPIE) 2009 Solar Energy + Technology Conference San Diego, California August 2-6, 2009
Transcript of NREL/CP-520-44968 Spectrum Enabling Accelerated Testing of … · 2013-09-27 · Conference Paper ....

Conference Paper NREL/CP-520-44968 July 2009
Analysis of Transmitted Optical Spectrum Enabling Accelerated Testing of CPV Designs Preprint D.C. Miller, M.D. Kempe, C.E. Kennedy, and S.R. Kurtz To be presented at the Society of Photographic Instrumentation Engineers (SPIE) 2009 Solar Energy + Technology Conference San Diego, California August 2-6, 2009
NOTICE
The submitted manuscript has been offered by an employee of the Alliance for Sustainable Energy, LLC (ASE), a contractor of the US Government under Contract No. DE-AC36-08-GO28308. Accordingly, the US Government and ASE retain a nonexclusive royalty-free license to publish or reproduce the published form of this contribution, or allow others to do so, for US Government purposes.
This report was prepared as an account of work sponsored by an agency of the United States government. Neither the United States government nor any agency thereof, nor any of their employees, makes any warranty, express or implied, or assumes any legal liability or responsibility for the accuracy, completeness, or usefulness of any information, apparatus, product, or process disclosed, or represents that its use would not infringe privately owned rights. Reference herein to any specific commercial product, process, or service by trade name, trademark, manufacturer, or otherwise does not necessarily constitute or imply its endorsement, recommendation, or favoring by the United States government or any agency thereof. The views and opinions of authors expressed herein do not necessarily state or reflect those of the United States government or any agency thereof.
Available electronically at http://www.osti.gov/bridge
Available for a processing fee to U.S. Department of Energy and its contractors, in paper, from:
U.S. Department of Energy Office of Scientific and Technical Information P.O. Box 62 Oak Ridge, TN 37831-0062 phone: 865.576.8401 fax: 865.576.5728 email: mailto:[email protected]
Available for sale to the public, in paper, from: U.S. Department of Commerce National Technical Information Service 5285 Port Royal Road Springfield, VA 22161 phone: 800.553.6847 fax: 703.605.6900 email: [email protected] online ordering: http://www.ntis.gov/ordering.htm
Printed on paper containing at least 50% wastepaper, including 20% postconsumer waste

1
Analysis of Transmitted Optical Spectrum Enabling Accelerated Testing of CPV Designs
David C. Miller*a, Michael D. Kempea, Cheryl E. Kennedya, Sarah R. Kurtza
aNational Renewable Energy Laboratory (NREL), 1617 Cole Boulevard, Golden, CO, USA 80401
ABSTRACT
Concentrated photovoltaics (CPV) has recently gained interest based on its scalability and expected low levelized cost of electricity. The reliability of materials used in CPV systems, however, is not well established. The current qualification test for photodegradation of CPV modules includes only real-time ultraviolet (UV) exposure, i.e. methods for accelerated UV testing have not been developed. Therefore, the UV and infrared (IR) spectra transmitted through representative optical systems is evaluated in this paper. The measurements of concentrating optics are used to assess expected optical performance as well as to understand how to quantify damaging optical exposure. Optical properties (transmittance, refractive index, reflectance, and absorptance) of candidate materials are identified. The dose and flux analysis here identifies the increased significance of IR (as opposed to UV) exposure for CPV systems, particularly for the most concentrating systems. For these, the UV dose may not greatly exceed the unconcentrated global solar condition, but the thermal load scales nearly directly with the geometric concentration.
Keywords: Activation spectrum, action spectrum, ultraviolet, infrared, reliability, durability, accelerated testing
1. INTRODUCTION Concentrated photovoltaics (CPV) has recently gained interest based on its scalability and expected low levelized cost of electricity. For example, in some locations the daily power yield may be increased when harvesting direct (vs. global) radiation by tracking the sun, where yield may be further improved by illuminating high efficiency multi-junction cells using concentrating optics [1]. Figure 1 compares the cross-section for a traditional flat-panel PV (FP-PV) system to those that may be present in refractive or reflective CPV systems. The figure represents the essential optical components present, including the PV cell, but does not include the heat sink or mechanical components (such as module walls or opto-mechanical fixtures). FP-PV, Figure 1 (a), utilizes a glass superstrate (such as low-iron, non-cerium containing soda lime glass) as well as an encapsulant (such as ethylene-co-vinyl acetate “EVA”, 33% wt. vinyl acetate) to isolate the cell from the environment while providing mechanical support. Refractive CPV systems, Figure 1 (b) and (c), utilize a lens (such as the faceted Fresnel type) to focus light, where the geometric concentration, Cg, may be approximated from the ratio of area of the lens perpendicular to the incident light to the absorbing area at the PV cell. Reflective systems utilize a mirror to either redistribute, Figure 1 (d), or focus, Figure 1 (e), the solar flux onto a PV cell. A kaleidoscope homogenizer is a secondary optic utilizing total internal reflectance to improve flux uniformity, compensate misalignment, reduce chromatic aberration, and compensate focusing errors.
Figure 1: Cross-sectional schematic identifying optical components present in: (a) conventional FP-PV, (b) & (c) refractive
CPV, and (d) & (e) reflective CPV systems. Transmission (Ti) or reflection (Rk) events are labeled next to active superstrate, lens, homogenizer, or reflector components.
The photodegradation of materials used in CPV systems, however, is not well established relative to the desired service life of 30 years. The current qualification test for CPV modules includes only real-time ultraviolet (UV) exposure.
*[email protected]; phone 1 303 384-7855; fax 1 303 384-6790; www.nrel.gov/pv/performance_reliability/

2
Methods for accelerated optical testing have not been formally developed because of the difficulty of simulating the service exposure to highly concentrated sunlight in a reasonable amount of time. More fundamentally, the conditions inherent to the application are not widely understood. In the textile, paint, and coating industries, polymer lifetime was historically evaluated in terms of cumulative dose of UV radiation over a broad bandwidth, such as “UV-B” (280-320 nm) or “UV-A” (320-400 nm). As popularized in the biosciences, improved correlation between field and laboratory simulated service life is achieved if the effectiveness of the damaging radiation is considered, e.g. Equation 1 – which is based on the wavelength-specific action spectrum of the material [2].
[ ] [ ] [ ] [ ] λλλλλ 21
cecEsE −==Λ (1)
In the equation, here for system international (SI) units, Λ represents the activation spectrum {W⋅m-2⋅nm-1}, E the spectral irradiance {W⋅m-2⋅nm-1}, s the action spectrum {unitless}, and λ the optical wavelength {nm}. As in [3], an exponential variation is assumed for the polymer encapsulant; the coefficients c1= 5.76⋅107 {unitless} and c2=0.0697 {nm-1} are assumed here from ref. [4]. The action spectrum indicates the sensitivity of a polymer to photo-degradation and is not distinguished here from the quantum yield of photon interaction events [2], [3]. In particular c2 is appropriate for a hydrocarbon, such as EVA. In contrast, the activation spectrum depends on the characteristics of the light source; for the variable outdoor environment this includes: time of day, season, specimen orientation, cloud cover, humidity, and local aerosol/ozone content. The activation spectrum is specific to the material property considered (e.g. optical transmittance, modulus, toughness, etc.) and may vary in sign according to competing processes, e.g. being “positive” for yellowing vs. “negative” for bleaching [2]. The activation spectrum can also vary according to the specimen or environment, for factors including: thickness (amount of absorptance), processing (density and microstructure), formulation (additives such as stabilizers), moisture concentration, temperature, and time (if attack at the surface filters transmitted light). From the activation spectrum, D, the dose{W⋅m-2} may be obtained from Equation 2.
[ ] [ ] [ ]∑∫ ∆=∂Λ=f
i
f
i
sEDλ
λ
λ
λ
λλλλλ (2)
H, the radiant exposure {J⋅m-2}, is obtained from the product of dose and time, i.e. H=Dt.
The goal of this study was to quantify the relative dose of damaging UV radiation delivered to a polymeric encapsulant material located in front of a PV cell. To facilitate a fundamental understanding of light-induced degradation, the optical properties of multiple components (including lenses, homogenizers, and reflectors that might be employed in CPV) were characterized. The optical throughput for representative component technologies in the wavelengths specific to the PV application as well as UV & infrared (IR) spectra were used to compare expected performance and encapsulant degradation. In addition to CPV components, previous studies of the materials specific to FP-PV were used as a reference. A damage analysis predicting the photodegradation of a polymeric encapsulant was performed according to an assumed action spectrum. The estimations here identify the stresses induced within different CPV configurations, providing a foundation for developing an accelerated-aging test methodology, which may be used to evaluate candidate materials exposed to concentrated light.
2. EXPERIMENTAL Optical measurements were performed using a dual-beam UV-VIS-NIR spectrophotometer (Lambda 900, Perkin-Elmer Inc.) with a 60-mm diameter integrating-sphere attachment. The entrance aperture of the integrating sphere is 30-mm and its incidence angle is 8°. The measurement accuracy of the instrument is ±0.08% in the UV/VIS and ±0.32% in the NIR and the reproducibility is <2±0.8% (Avg±STD). To adequately monitor both UV and IR performance, transmission was measured from 200-2600 nm at 5 nm intervals; likewise, reflectance was measured from 250-2500 nm. The spectra obtained according to ref. [5] can be later analyzed with the air-mass (AM) 1.5 terrestrial direct-normal solar spectrum [6]. All specimens (plates of glass or polymer, Fresnel-lenses, encapsulants laminated between quartz slides, mirrors, and reflectors) were cleaned with a 20% vol. solution of detergent (LiquiNox, Alconox Inc.) and deionized water prior to measurement.
For laminated specimens, the silica glass was buffed with pumice powder, cleaned with a detergent (Billco, Billco Manufacturing Inc.), deionized water (DI), and then isopropyl alcohol prior to assembly. Polymer sheets were then assembled with a liner, composed of fiberglass embedded in Poly(tetrafluoroethylene) (PTFE), to define the thickness

3
(~0.5 mm) and cavity size. Alternately, the silicones were degassed in a vacuum chamber and then poured into a PTFE mold. Hydrocarbon-based polymers were prepared via melt processing using a commercial laminator (Model LM-404, Astropower Inc.), whereas the silicone specimens were cured in an oven according to the manufacturer’s specifications. To promote adhesion to silicone, the quartz was etched in a sulfuric acid:DI (1:1 vol.) solution for 12 hours prior to assembly. Furthermore, a commercial primer (92-023, Dow Corning Corp.) was typically used with the silicones to enhance adhesion. The primer was chosen for its good optical clarity and lack of strong haze.
3. DATA REDUCTION All raw optical measurements were subject to post-analysis. Accounting for all backward- and forward-reflections, the approximation for transmittance through a thick flat plate at each λ is given by Equation 3 [7].
( )
( )α
α
hi
hi
ererT 22
2
11
−
−
−−
= , where λπα 24 k
= and
( ) ( )( ) ( )221
221
221
221
ˆˆ
kkinnkkinnri
+++−+−
= (3)
Additional nomenclature includes T, which represents the optical transmittance {unitless}, ri, the reflectance at the interface {unitless}, h, the specimen thickness {m}, α, the absorption coefficient {m-1}, π, the mathematical constant, k, the extinction coefficient {unitless}, and n, the real component of the refractive index {unitless}. The subscripts -1 and -2 distinguish between materials on opposite sides of the interface. For a single material in air, n1→1 and k1→0. Using Equation 3, all transmitting components were scaled to the common thickness of 3.2 mm for the purpose of direct comparison, except that h=61.3 mm was utilized for secondary optics (kaleidoscope homogenizers).
The transmittance for a glass/polymer/glass laminate may be analyzed using Equation 4.
pphgeTT α−= (4)
Here, Tg refers to the transmittance of the glass in air (Equation 3, for the combined thickness of both silica pieces), and the subscript –p refers to the polymer. From the numeric solution for αp at each λ, A, the optical absorptance {unitless} may be determined from Equation 5.
ppheA α−−=1 (5)
To directly compare the optical measurements from different specimens, A was scaled for hp=0.5mm for polymers including: Poly(methyl methacrylate) (PMMA), Poly(dimethylsiloxane) (PDMS), Poly(p-methylstyrene) (PPMS), Poly(ethylene-co-methacrylic acid metal salt) (ionomer), EVA, polyolefin (PO), and Polyvinyl butyral (PVB).
4. RESULTS AND DISCUSSION 4.1 Measurement of candidate components and materials
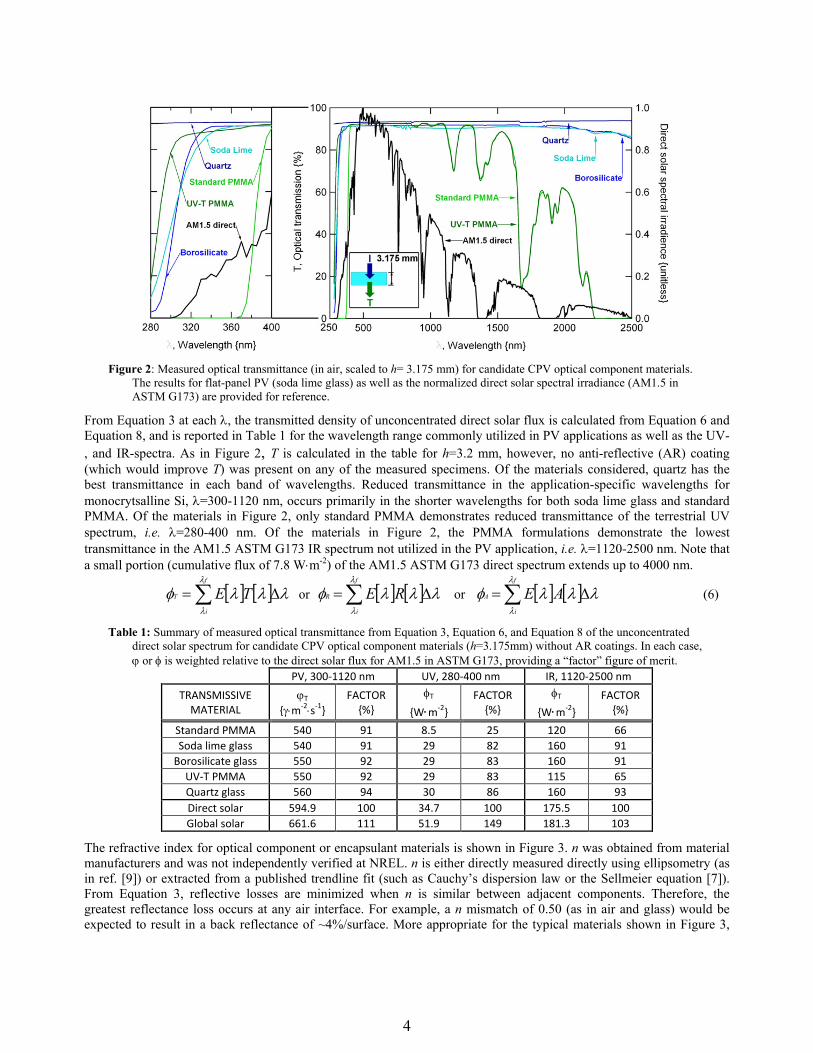
The data for several transmitting optical materials is shown in Figure 2, and is further summarized in Table 1. The geometry of the specimens is indentified in the inset of the figure. To clarify the nomenclature, the transmitted light is the remainder when the reflected and absorbed portions are subtracted from the incident flux (I), i.e. T=I-(R+A). The data profiles shown in the figure are considered representative; each is subject to variation according to the particular material formulation utilized. Figure 2 also includes the normalized direct solar spectral irradiance (AM1.5 in ASTM G173 [6]) for reference. A “standard” or specifically UV transmitting (UV-T) PMMA formulation might be used in a Fresnel-lens. A glass superstrate with silicone facets is another embodiment of the Fresnel-lens [8]; the performance of such was not examined here. A previously solarized soda lime glass (Starphire, PPG Industries from ref. [4]) represents the FP-PV superstrate. Borosilicate or quartz glass might be used to construct lenses or (more typically) secondary optics. Borosilicate glass is known for its low coefficient of thermal expansion (CTE), excellent weatherability, homogeneity, and reasonable cost. In Figure 2, the standard PMMA and borosilicate glass demonstrate a minimal or slightly reduced UV transmittance capability, respectively. Quartz is known for its homogeneity and outstanding transmittance across a broad spectrum. Because they are UV transmitting, components made out of UV-T PMMA or quartz might be utilized for the purpose of UV accelerated aging. All materials in Figure 2 transmit well over the wavelength range commonly utilized in PV applications, i.e. 300-1120 nm. Aside from the typical reflectance losses occurring at the interfaces, only PMMA shows specific reduced transmittance in the IR wavelengths.
4
Figure 2: Measured optical transmittance (in air, scaled to h= 3.175 mm) for candidate CPV optical component materials.
The results for flat-panel PV (soda lime glass) as well as the normalized direct solar spectral irradiance (AM1.5 in ASTM G173) are provided for reference.
From Equation 3 at each λ, the transmitted density of unconcentrated direct solar flux is calculated from Equation 6 and Equation 8, and is reported in Table 1 for the wavelength range commonly utilized in PV applications as well as the UV-, and IR-spectra. As in Figure 2, T is calculated in the table for h=3.2 mm, however, no anti-reflective (AR) coating (which would improve T) was present on any of the measured specimens. Of the materials considered, quartz has the best transmittance in each band of wavelengths. Reduced transmittance in the application-specific wavelengths for monocrytsalline Si, λ=300-1120 nm, occurs primarily in the shorter wavelengths for both soda lime glass and standard PMMA. Of the materials in Figure 2, only standard PMMA demonstrates reduced transmittance of the terrestrial UV spectrum, i.e. λ=280-400 nm. Of the materials in Figure 2, the PMMA formulations demonstrate the lowest transmittance in the AM1.5 ASTM G173 IR spectrum not utilized in the PV application, i.e. λ=1120-2500 nm. Note that a small portion (cumulative flux of 7.8 W⋅m-2) of the AM1.5 ASTM G173 direct spectrum extends up to 4000 nm.
[ ] [ ] λλλφλ
λ
∆= ∑f
i
T TE or [ ] [ ] λλλφλ
λ
∆=∑f
i
R RE or [ ] [ ] λλλφλ
λ
∆=∑f
i
A AE (6)
Table 1: Summary of measured optical transmittance from Equation 3, Equation 6, and Equation 8 of the unconcentrated direct solar spectrum for candidate CPV optical component materials (h=3.175mm) without AR coatings. In each case, ϕ or φ is weighted relative to the direct solar flux for AM1.5 in ASTM G173, providing a “factor” figure of merit.
PV, 300-1120 nm UV, 280-400 nm IR, 1120-2500 nm
TRANSMISSIVE MATERIAL
ϕT
{γ⋅m-2⋅s-1} FACTOR
{%} φT
{W⋅m-2}
FACTOR {%}
φT
{W⋅m-2} FACTOR
{%}
Standard PMMA 540 91 8.5 25 120 66 Soda lime glass 540 91 29 82 160 91
Borosilicate glass 550 92 29 83 160 91 UV-T PMMA 550 92 29 83 115 65 Quartz glass 560 94 30 86 160 93 Direct solar 594.9 100 34.7 100 175.5 100 Global solar 661.6 111 51.9 149 181.3 103
The refractive index for optical component or encapsulant materials is shown in Figure 3. n was obtained from material manufacturers and was not independently verified at NREL. n is either directly measured directly using ellipsometry (as in ref. [9]) or extracted from a published trendline fit (such as Cauchy’s dispersion law or the Sellmeier equation [7]). From Equation 3, reflective losses are minimized when n is similar between adjacent components. Therefore, the greatest reflectance loss occurs at any air interface. For example, a n mismatch of 0.50 (as in air and glass) would be expected to result in a back reflectance of ~4%/surface. More appropriate for the typical materials shown in Figure 3,

5
~0.5% reflectance/surface is expected for a n mismatch of 0.22. PPMS is particularly well matched to borosilicate and soda lime glass. The use of PPMS as an encapsulant, however, is not recommended because the aromatic phenyl ring structure is known to yellow in response to UV photo-excitation [10]. Separately, PMMA, EVA, PVB and ionomer all demonstrate very similar n. The use of a fluid to fill the module cavity, thereby reducing the reflectance losses of the internal components, is not considered in this study.
Figure 3: Real refractive index (n, measured or from trendline fit) for candidate CPV optical materials over the wavelength
range commonly utilized in PV applications. The result for FP-PV (solarized soda lime glass) is provided for reference.
Aside from index matching, the materials in Figure 3 all demonstrate normal dispersion (an asymptotic rise in n at the left of the figure). A difference in the location of λi, the wavelength of the inflection, would result in increased reflectance loss from optical mismatch between adjacent materials for λ≤λi. More importantly, the asymptotic rise at the left of Figure 3 will retard light as λ is decreased. For Fresnel optics in particular, this will result in chromatic aberration, where shorter wavelengths will be focused closer to the lens; conversely, longer wavelengths will be focused farther from the lens. For Fresnel based systems, common methods to minimize chromatic aberration include: shaping the lens to reduce the optical path length between the lens and cell [11], use of a high n fluid to fill the module cavity and reduce optical path length, and the addition of a secondary optic to render a more homogeneous spectral distribution [11].
The measured data for several optical reflector components is shown in Figure 4 and is further summarized in Table 2. Reflectors considered include: a sputtered Ag film (Ag), sputtered Al (Al), a wet-silvered low-iron glass (h=4 mm) composite (thick-glass/Ag), wet-silvered tempered low-iron glass (h=4 mm, tempered thick-glass/Ag), wet-silvered low-iron glass (h=1 mm, thin-glass/Ag), a PMMA superstrate/Ag composite (PMMA/Ag), PMMA superstrate/adhesive/Ag (PMMA/adhesive/Ag), an anodized aluminum composite (anodized Al), a 1.5-µm Al2O3 thin-film/Ag front surface composite (Al2O3/Ag), and a 1.5-µm SiO2 thin-film/Ag front surface (SiO2/Ag). To clarify, the nomenclature used in Figure 4 and Table 2 refers to only the essential optical layers, indicated from the front (incident) side to the back side. The reflective surface for the specimens in Figure 4 and Table 2 occurs at an Ag or Al layer, based on their known high reflectance across a broad spectrum. Other materials such as Fe and Pt provide a lower base reflectance or fail to reflect at shorter wavelengths, like Au. As with the transmittance data, Figure 2, the reflectance data applies to optical components in their unconditioned initial state; the degradation of these reflectors over time (owing to mechanisms including corrosion, abrasion, soiling, and photodegradation) is examined elsewhere [12]. As with the transmittance data, the subsequent scattering of light by the optical component is not considered here, neither is the state of optical polarization. Consistent with [7], bare Ag has a cut-on λ near 360nm, whereas bare Al is more reflecting to UV, but demonstrates reduced reflectance centered about λ=775 nm. In comparison to Figure 4, the typical reflectance of transmitting components, i.e. glass or PMMA in Table 1, is 3-4%/surface.

6
Figure 4: Measured optical reflectance (direct normal incidence, in air) for candidate CPV optical component materials.
The normalized direct solar spectral irradiance (AM1.5 in ASTM G173) is provided for reference.
Like Table 1, the reflected flux density from Equation 6 and Equation 8 for a single pass of unconcentrated direct solar radiation is provided in Table 2. Over λ=300-1120 nm, an average hemispherical reflectance of 90.6 and 90.1% is observed for bare Ag and Al, respectively. In Table 2, Ag is a superior reflector over Al in the profiles as in Figure 4 except in the UV wavelengths. All of the components in Table 2 demonstrate strong reflectance in the application specific spectrum as well as the IR spectrum. Tempering glass, common in FP-PV, slightly improves reflectance [12]. To explain, the additives in the glass become free to diffuse during the high-temperature anneal. A PMMA superstrate (containing UV stabilizers) reduces the reflected UV spectrum. Performance of PMMA/Ag is subject to the additional layers (such as the adhesive) utilized in the mirror stack, Table 2. Al2O3/Ag provided the best performance specific to the PV application. Al2O3/Ag might substitute particularly well in CPV systems using an internally located reflective secondary homogenizer, where the component would be mechanically and chemically protected from the environment.
Table 2: Summary of measured optical reflectance from Equation 6 and Equation 8 of the unconcentrated direct solar spectrum for candidate CPV optical materials. In each case, the photon density (ϕ) or optical flux density (φ) is weighted relative to the direct solar flux for AM1.5 in ASTM G173 providing a “factor” figure of merit.
PV, 300-1120 nm UV, 280-400 nm IR, 1120-2500 nm
REFLECTIVE MATERIAL
ϕR
{γ⋅m-2⋅s-1} FACTOR
{%} φR
{W⋅m-2} FACTOR
{%} φR
{W⋅m-2} FACTOR
{%}
Ag (sputtered) 540 90 28 82 170 96 Anodized Al 540 91 22 64 160 94
1.5µm SiO2/Ag 550 93 17 48 170 99 Thick-glass/Ag 560 94 25 71 170 94
Tempered thick-glass/Ag 570 95 26 74 170 94 PMMA/adhesive/Ag 570 96 5.1 15 160 94
Thin-glass/Ag 570 96 24 70 170 97 Al (sputtered) 580 97 18 51 170 99
PMMA/Ag 580 97 7.4 21 160 94 1.5µm Al2O3/Ag 580 98 24 68 170 99
Direct solar 594.9 100 34.7 100 175.5 100 Global solar 661.6 111 51.9 149 181.3 103
The absorptance for several encapsulation materials is shown in Figure 5 and is further summarized in Table 3. The geometry of the specimens is identified in the inset of the figure. The data presented is considered representative; in particular, polymeric materials are subject to the formulation utilized, including: photo-stabilizers, UV absorbers, anti-oxidants, adhesion promoters, curing agents, and compositional purity. A key assumption regarding Equation 4 is that no significant internal reflections occur within the laminate specimens, justified for n (and assumed for k) by the similar

7
values shown in Figure 3. Many of the materials in Figure 5 demonstrate some absorptance of UV light, which is likely caused by additives present in the material formulation, including UV stabilizers. UV absorptance should therefore not be confused with propensity for photo-degradation or the overall robustness against UV damage. The materials in Figure 5 also demonstrate IR absorptance, enabling the material to be heated directly by the sun. Some polymeric materials undergo direct thermal or hydrothermal degradation at sufficient temperature. Perhaps more commonly, temperature is coupled to UV-photodegradation. The activation spectrum can therefore be readily influenced by the specimen temperature, e.g. the prevalent damage modes and/or most robust materials can vary significantly with temperature [13].
Figure 5: Measured optical absorptance (in air, scaled to h=0.5 mm) for candidate CPV encapsulant materials. The
normalized direct solar spectral irradiance (AM1.5 in ASTM G173) is provided for reference.
The absorbed flux density of unconcentrated direct solar radiation is provided in Table 3 for the typical wavelength range in the PV application as well as the UV and IR spectra. PDMS, which has the greatest n mismatch in Figure 3, excels in each band of wavelengths. PDMS, PPMS, and PMMA are the materials least absorbing in the PV application specific wavelengths, providing for the most efficient power production. In contrast, PVB and ionomer, demonstrate the greatest absorptance in the UV and IR wavelength bands. The efficacy of UV photodegradation of polymeric materials is evaluated below. In contrast, the temperature of components adjacent to the cell is very much dependent upon the system design and the related thermal management scheme. Consider also that much of the optical flux not absorbed in Table 3, will be accommodated at the cell (either directly or through thermalized photon absorptance for light above the semiconductor bandgap) in addition to Joule heating of the interconnects.
Table 3: Summary of optical absorptance (from Equation 4, Equation 5 at each λ, calculated by Equation 6 and Equation 8) of the unconcentrated direct solar spectrum for candidate CPV encapsulant materials (h=0.5mm). In each case, ϕ or φ is weighted relative to the direct solar flux for AM1.5 in ASTM G173, providing a “factor” figure of merit.
PV, 300-1120 nm UV, 280-400 nm IR, 1120-2500 nm
ENCAPSULATION MATERIAL
ϕA
{γ⋅m-2⋅s-1} FACTOR
{%} φA
{W⋅m-2} FACTOR
{%} φA
{W⋅m-2} FACTOR
{%}
PDMS 0.35 0.04 0.12 0.33 11 6.3 UV-T PMMA 0.37 0.05 0.11 0.31 21 12
PPMS 2.0 0.24 0.30 0.86 17 9.4 Standard PMMA 6.4 0.80 15 42 19 10.9
EVA 9.3 1.2 19 55 19 11 Polyolefin (PO) 13 1.6 24 68 18 10
Ionomer 15 1.8 25 73 26 15 PVB 15 1.9 26 74 25 14
Direct solar 594.9 100.0 34.7 100.0 175.5 100 Global solar 661.6 111.2 51.9 149.4 181.3 103

8
Of the encapsulation materials considered here, EVA has traditionally dominated the FP-PV application on the basis of its low cost and good optical performance. It should be reminded that all of the materials in Table 3 were considered as candidate encapsulants based on their excellent optical clarity, i.e. the comparison ‘factor’ for PV, UV, and IR accentuates their relative performance. EVA formulations are subject to UV-photodegradation, which affects its optical characteristics over time [14] and results in the formation of acetic acid [15]. In contrast, it is currently unclear which material(s) are best suited for the CPV application. The best choice may be application specific, being subject to the constraints of: the optical system (Cg as well as the spectrum transmitted by the components utilized), thermal management, optical performance (transmittance), reliability (service life), manufacturing cost, and material cost. Note that other factors such as the specific formulation or grade of material may affect the results in Table 3.
4.2 Determination of the effective UV damage dose for a polymeric encapsulant from the activation spectrum
The effective dose of damaging radiation, Equation 2, may be determined from the activation spectrum, Equation 1. As indicated in Figure 1, the spectral irradiance at the front surface of the polymeric encapsulant may be estimated from the series of preceding transmittance- and/or reflectance-events occurring within a particular optical system, Equation 7.
[ ] [ ] [ ]ληληλλ ∏∏=
=
=
=
=
lk
kkk
ji
iiigI RTCEE
11
(7)
Here, η represents the optical efficiency {unitless}, R, the reflectance at a mirror component {unitless} as well as the indices i, j, k, and l. The term EI refers to the incoming radiation (global solar, Xe-lamp, or direct normal solar) incident upon the optical system. Fresnel-lens components were analyzed from the T of stock PMMA material, subject to η=0.95, to account for optical losses caused by the finite draft angle, tip radius, and valley radius of the lens facets. Similarly, η=0.95 was assumed for the reflector components to account for geometric loss, such as mechanical attachment or view factor. Based on an NREL design, transmittance for secondary homogenizer optic components (η=1) was calculated for h=61.25 mm from the T data measured at each λ for stock glass.
The Λ for several concentrating optical systems is shown in Figure 6 and is further summarized in Table 4. The figure includes profiles for: soda-lime glass with no concentration (FP-PV), standard PMMA lens (Standard PMMA), a standard PMMA lens/borosilicate glass homogenizer system (S-PMMA/B-glass), a UV-T PMMA lens/quartz homogenizer system (UV-T PMMA/Q-glass), a wet-silvered low-iron glass (h=1 mm) reflector (thin-glass/Ag), a PMMA superstrate/Ag reflector (PMMA/Ag), and an anodized aluminum reflector (anodized Al). The UV-T PMMA/Q-glass system, a design used at NREL to greatly accelerate photodegradation for the purpose of investigating candidate materials, provides the greatest dose of damaging radiation. The anodized Al, thin-glass/Ag and flat panel (simply a soda lime glass superstrate) systems bear similar Λ profiles that differ in magnitude (note logarithmic scale). The standard PMMA lens (used on its own or with a borosilicate glass homogenizer) has a Λ profile that decreases rapidly towards the left of Figure 6, where the attenuation in the homogenizer at λ≤340 nm does not greatly affect the overall damage dose, Table 4. The reflector components (thin-glass/Ag, PMMA/Ag, and anodized Al) all provide UV damage dose greater than a standard PMMA lens, Figure 6. The PMMA/Ag reflector is the least damaging of the reflectors shown in Figure 6. The standard PMMA refractor or reflector components represent commonly employed “low-concentration” CPV systems i.e. Cg≤50. The PMMA lens/borosilicate homogenizer system or reflector/borosilicate homogenizer system represent commonly employed CPV configurations for “medium” to “high” concentration, i.e. Cg≥50.
The flux density of photons (γ), previously referenced above, is applicable to the PV application as it is accounts for the energy of the light incident to the semiconductor cell (for light at or above the bandgap). The γ flux density is calculated in Equation 8.
φλϕhcq
= (8)
Here, ϕ {γ⋅m-2⋅s-1} represents the γ flux density, q, the charge of a single electron {1.602176531⋅10−19 C}, h, Planck’s constant {6.626068963⋅10−34 W⋅s2}, c, the speed of light in a vacuum {299,792,458 m⋅s-1}, and φ, the optical flux density {W⋅m-2} obtained from Equation 6. For the representative optical systems, Equation 6 and Equation 7 are used together to calculate φ.

9
Figure 6: From Equation 1, Equation 2, and Equation 7, Λ (at Cg=500, except for FP-PV) for key representative optical
systems. The normalized spectral irradiance profiles for the direct solar resource (AM1.5 in ASTM G173) as well as a Xe-lamp are provided for reference. The “UV-A” and “UV-B” bands are indicated at the top of the figure.
The expected UV damage doses for several representative optical systems are summarized in Table 4. Here the dose for FP-PV subject to global solar irradiation is used as a reference and compared to two Xe-lamp accelerated test conditions commonly used at NREL. An additional ~3x exposure can be achieved for the latter, since a lamp may be operated continuously for 24 hours/day. The instantaneous dose from the Xe-lamp(s) is of the same order of magnitude as that encountered when a standard PMMA Fresnel-lens is utilized at Cg=500. A significantly greater UV dose is anticipated for UV transmitting optics (UV-T-, borosilicate, or quartz-lens). Here, the dose factor is considerably less than that anticipated from Cg, in part because a significant portion of diffuse UV light present in the global solar spectrum does not survive the concentrating optics, which can only focus direct light. A lesser loss occurs for all of these systems, owing to the limited η of Fresnel-lens components. For refractive optical systems, the use of a homogenizer has very little effect on UV dose, relative to the material choice for the Fresnel-lens. The reflective optical systems are intermediate to standard PMMA and quartz lenses. The greater reflectance of bare Al over bare Ag, Figure 4 (left), would be expected to result in a greater UV dose for Al. In practice, the various layers used in representative reflector components may outweigh the significance of the base reflective layer, particularly for PMMA/Ag – which reflects much less UV light. For reflective optical systems, the use of a borosilicate homogenizer will decrease the UV dose more significantly than in the refractive systems, i.e. attenuating 1/3 to 1/2 of the original dose. While not shown in Table 4, the use of a quartz homogenizer would instead attenuate about 10% of the UV dose.
The dependence of CPV upon direct light (particularly for Cg,≥2x or 2.8x, where tracking has been identified as required for line and spot focusing simple Fresnel-lens systems, respectively [16]) is its most significant limiting factor. The arid and/or high elevation locations most suited to CPV are known to favor direct UV radiation [17]. Direct UV radiation, however, is readily subject to scattering by moisture as well as the local atmospheric aerosol content. A significant seasonal variation can exist outside of tropical latitudes. For example, while the remainder of the solar spectrum may vary by about 3%, UV-A may vary by a factor of 1.6 and the most damaging UV-B may vary by 4x between solstices [17]. Therefore, the location- and temporal-specific conditions combined with the dose factor suggested in Table 4 are expected to increase the variability in photodegradation and resulting service life for CPV relative to FP-PV.

10
Table 4: Summary of UV activation spectrum analysis from Equation 1, Equation 2, Equation 7, and Equation 8 for representative optical systems subject to the direct solar spectrum; the “dose factor” compares the system dose to that of FP-PV subjected to the global solar spectral irradiance (AM1.5 in ASTM G173) or a FP-PV subjected to a Xe-lamp.
PV, 300-1120 nm
SYSTEM
Cg, GEOMETRIC CONCENTRATION
{unitless}
ϕ
{γ⋅m-2⋅s-1} FACTOR
{unitless} RANK
{unitless}
UV DOSE FACTOR
{unitless}
Global solar//soda-lime (FP-PV, field application) 1 0.63 1.00 1 1.0 Xe-lamp//soda-lime (FP-PV, accelerated indoor aging) 2 @ 340 nm 2.0 3.2 2 2.7 Xe-lamp//soda-lime (FP-PV, accelerated indoor aging) 2.5 @ 300-400 nm 2.2 3.5 3 3.0 Standard PMMA//anodized Al homogenizer 500 230 370 5 3.8 Standard PMMA lens//borosilicate homogenizer 500 240 370 7 4.2 Standard PMMA lens 500 260 410 13 4.6 PMMA/Ag reflector//borosilicate homogenizer 500 250 400 9 10 PMMA/Ag reflector 500 280 440 19 21 thin-glass/Ag//thin-glass/Ag//borosilicate homogenizer 500 230 360 4 62 Anodized Al//borosilicate homogenizer 500 230 370 6 81 Ag reflector (sputtered) 500 270 440 18 95 thin-glass/Ag//borosilicate homogenizer 500 250 400 8 97 thin-glass/Ag 500 270 430 17 150 thick-glass (tempered)/Ag 500 270 430 16 150 Anodized Al 500 260 410 12 160 Borosilicate lens 500 260 410 14 270 UV-T PMMA lens//quartz homogenizer 500 250 400 10 272 UV-T PMMA lens 500 260 420 15 280 Al reflector (sputtered) 500 250 410 11 290 Direct solar (bare cell) 1 0.59 0.95 N/A 0.68 Global solar (bare cell) 1 0.66 1.05 N/A 1.2
The increasing ability of photons to cause damage as their energy (wavelength) is increased (decreased) is inherently captured in Equation 1. The action spectrum and coefficients considered, however, are most appropriate for hydrocarbons and those polymers containing carbon backbones, where covalent carbon bonds in the backbone and/or side-groups of the polymer molecules become prone to scission for λ≤360 nm. In contrast, the covalent silicon bonds present in silicones, such as PDMS, become subject to scission for λ≤250 nm. Figure 6 and Table 4 are therefore readily applicable for the hydrocarbon materials, but not necessarily the silicones.
The flux density of IR light was analyzed for the same representative systems in Table 4. A distinct difference here is their improved φ in the IR range (58<φ<96% of Cg). In refractive systems, the glass lens transmits more IR than PMMA. In contrast, there is much less distinction between the reflective optical systems; all provide substantial IR flux (φ>73% Cg). Differences between the reflective systems can arise from the particular components utilized. For example, there is a ~16 or ~7% loss when a borosilicate or quartz homogenizer is used, respectively. One unique instance is the use of a standard PMMA Fresnel-lens combined with an anodized Al homogenizer (the homogenizer is shielded from damage by being located inside the module). Here, there is a sizeable reduction in both the UV- and IR-flux.
The dose and flux analysis identify the increased significance of IR (as opposed to UV) exposure for CPV systems, particularly for Cg≥50. Here, the UV dose may not greatly exceed the unconcentrated global solar condition, but the thermal load scales nearly directly with Cg. Note that the reflectors examined in Figure 4 and Table 2 come from the concentrated solar power (CSP) industry, where reflectance of IR flux is vital to the application. Hence, the reflectors have not been tailored to the CPV application, where rejection of IR flux is desirable. Approaches that may be used to promote longevity include: (1) reducing the thermal load by choosing an encapsulation material exhibiting little direct absorptance of the solar spectrum, such as PDMS in Table 3, (2) choosing optical components that maximize IR absorptance, such as a standard PMMA lens in Table 1 or an anodized Al reflector in Table 2. Here, incoming IR is absorbed up front at lesser concentration, before it reaches the vicinity of the cell. (3) Water is an excellent example of a liquid that absorbs the solar spectrum selectively for λ>1300 nm [7]. The absorptance spectrum of water is ideally compatible with crystalline Si, if water could be incorporated into the initial component of the optical system, its

11
reflective loss could be tolerated, and freezing was not an issue. (4) The IR flux might be separated and/or defocused in the optical design of refractive components. (5) The thermal load may also be lessened by using thin film coating(s) as a “hot” heat mirror (reflecting or absorbing incoming IR). (6) The use of a liquid, such as silicone oil, to fill the module cavity, improving thermal conductivity might prove requisite in extreme situations. (7) AR coating(s) present on the cell may reject IR flux below the bandgap. While the aforementioned techniques may prove beneficial, the most fundamental tactic to promote performance and reliability is a good system design that optimizes thermal management. Because most degradation processes (including photo- and hydro-degradation) are synergistically enhanced with temperature, good thermal management should improve reliability and promote lifetime.
A key assumption in the analysis (Figure 6, and Table 4) is that the optical flux within each CPV system is uniform. The flux uniformity could easily vary by 1-3 orders of magnitude for a Fresnel-lens, particularly when an imaging lens design is used without a homogenizer [11]. Likewise, mechanical damage such as retained deformation at impact sites on a mirror component could locally concentrate light. Temporal factors such as: mechanically induced sag (snow, wind, or gravity), heterogeneous material degradation, moisture condensation, soiling, corrosion, abrasion, or degradation at interfaces may have a similar effect. The particular details of flux heterogeneity would determine whether concentrated light will have direct (UV or thermal) or coupled (UV + IR + PV) effect.
The study here provides preliminary insight concerning the reliability and service life of CPV encapsulant materials. Future research will include real-time field exposure to compare candidate encapsulant materials and identify failure modes. This work will involve the verification of the UV flux and operating temperature in CPV systems deployed in the field and indoor accelerated stress systems. The results will provide feedback concerning the relative importance of damaging UV and IR radiation. Separate study of the performance and lifetime of contemporary PMMA formulations and Fresnel-lens components will provide understanding of how the analysis here applies over time for refractive optical systems; independent study of reflector components is currently on-going.
5. CONCLUSIONS Using representative components, the wavelength-specific optical performance of concentrated photovoltaic (CPV) systems has been studied. Key results include:
CPV designs using PMMA deliver a relatively small dose of UV near the cell, whereas many reflective CPV designs deliver a much greater UV dose. Acceleration of UV exposure relative to PMMA designs can easily be accomplished using UV transmissive optics, but acceleration relative to the reflective CPV designs requires an increase in optical concentration and/or an increase in temperature. In all cases, operation at increased temperature is expected to be critical to the reliability of CPV encapsulants.
For refractive optical components, the ultraviolet (UV) and infrared (IR) transmittance for standard PMMA is much less than that of glass. Regarding reflective optical components, Ag exceeds Al, except in the UV bands. The various reflector components differ depending on the particular layers utilized, e.g. tempering the glass superstrate improves reflectance. A PMMA superstrate reflects significantly less UV radiation. All reflectors provided similar IR performance. Regarding candidate encapsulation materials, silicone was exceptionally transmitting, whereas PVB and ionomer absorbed the most UV and IR light. All encapsulation materials examined here are highly transmitting, therefore factors other than optical performance (transmittance), including thermal management, reliability (service life), and cost may motivate their use.
In the case of CPV (vs. conventional flat-panel photovoltaics), thermal management is identified as of increased significance relative to UV radiation. That is, the IR flux density typically scales more closely with the geometric concentration of solar radiation, whereas the UV flux may be substantially less than the nominal geometric concentration. In systems with low geometric concentration, where a single reflection may be used to concentrate light, the UV dose may well exceed that in systems with high geometric concentration, such as those utilizing a PMMA refractive optic with a secondary homogenizer. The analysis here, however, does not eliminate the importance of UV radiation; the findings do, however, suggest that thermal and/or related synergistic mechanisms, including photo-thermal and hydro-thermal, bear increased significance.
Regarding future material selection, module durability, qualification, and safety tests, the control of specimen temperature is of utmost importance. The specific test conditions appropriate to CPV are yet to be determined; the conditions present in CPV modules may vary considerably according to the system design. Future work at NREL will

12
quantify the appropriate conditions. The aging of optical components further complicates the findings of the study here. For example, change in the output spectrum of refractive or reflective components may completely alter the activation spectrum. Both drawing upon and including a legacy of optical durability studies of reflector components, the durability and service life of refractive components and encapsulation materials specific to CPV will also be examined.
ACKNOWLEDGEMENTS
The authors are grateful to: Dr. Keith Emery, Dr. John Pern, and Marc Oddo & Kent Terwilliger & Robert Tirawat of the National Renewable Energy Laboratory for their discussion/help with the solar spectrum, experimental methods, and optical measurements, respectively; Dr. Margaret Fraelich of Fresnel Technologies Inc., Dr. Jayesh Bokria & Dr. Ryan Tucker & Dr. Christopher Hastings of Specialized Technology Resources Inc., Roger French & Eric Romano of E.I. du Pont de Nemours and Co., Dr. Uwe Keller of Kuraray Europe GmbH, and Michelle Velderrain of NuSil Technology LLC for their help with specimen materials. This work was supported by the U.S. Department of Energy under Contract No. DOE-AC36-08GO28308 with the National Renewable Energy Laboratory.
REFERENCES
[1] Dunlap, M.A., Marion, W., Wilcox, S.M., “Solar Radiation Data Manual for Flat-Plate and Concentrating Collectors”, NREL/TP 463-5607, 1-259 (1994).
[2] Martin, J.W., Lechner, J.A., and Varner, R.N., “Quantitative Characterization of Photodegradation Effects of Polymeric Materials Exposed in Weathering Environments”, in ASTM STP 1202, 27-51 (1994).
[3] Andrady, A.L., “Wavelength Sensitivity in Polymer Degradation”, Adv. Poly. Sci., 128, 47-94 (1996). [4] Kempe, M.D., Kilkenny, M., and Moricone, T.J., “Accelerated Stress Testing of Hydrocarbon Based Encapsulants
for Medium-Concentration CPV Applications”, Proc. IEEE PVSC (2009). [5] “ASTM E1175 Standard Test Method for Determining Solar or Photopic Reflectance, Transmittance, and
Absorptance of Materials Using a Large Diameter Integrating Sphere,” ASTM International, West Conshohocken, 1-4 (2009).
[6] “ASTM G173 Standard Tables for Reference Solar Spectral Irradiances”, ASTM International, West Conshohocken, 1-20 (2003).
[7] Palik, E.D., [Handbook of Optical Constants of Solids], Academic Press Limited, London, (1998). [8] G. Sala, and E. Lorenzo, “Hybrid Silicone Glass Fresnel; Lens as Concentrator for Photovoltaic Applications”, J.
Appl. Metalworking, 1004-1010, 1979. [9] French, R.H., Rodríquez-Parada, J.M., Yang, M.K., Derryberry, R.A., Lemon, M.F., Brown, M.J., Haeger, C.R.,
Samuels, S.L., Romano, E.C., and Richardson, R.E., “Optical Properties of materials for Concentrator Photovoltaic Systems”, Proc. IEEE PVSC (2009).
[10] Deshpande, G., and Rezac, M.E., “The Effect of Phenyl Content on the Degradation of Poly(dimethyl diphenyl) Siloxane Copolymers”, Polym. Degrad. Stab., 74, 363-370 (2001).
[11] Leutz, R. and Suzuki, A, Nonimaging Fresnel-lenses: Design and Performance of Solar Concentrators], Springer, New York, (2001).
[12] Kennedy, C.E., and Terwilliger, K., “Optical Durability of candidate Solar Reflectors”, J. Sol. Eng. 127, 262-269 (2005).
[13] Kockott, D. “Factors Influencing the Reliability of Results in Accelerated Weathering Tests”, ASTM STP 1294, 24-39 (1996).
[14] Czanderna, A.W., and Pern, F.J., “Encapsulation of PV Modules Using Ethylene Vinyl Acetate Copolymer as a Pottant: A Critical Review”, Sol. Energy Mater. Sol. Cells, 43, 101-181 (1996).
[15] Kempe, M.D., Jorgensen, G.J., Terwilliger, K.M., McMahon, T.J., Kennedy, C.E., Borek, T.T., “Acetic Acid Production and Glass Transition Concerns with Etylene-Vinyl Acetate Using in Photovoltaic Devices”, Sol. Energy Mater. Sol. Cells, 91, 315-329 (2007).
[16] Leutz, R., Suzuki, A., Akisawa, A., Kashiwagi, T., “Design of a Nonimaging Fresnel-lens for Solar Concentrators”, Sol. Energy, 65 (6), 379-387 (1999).
[17] Zerlaut, G.A., “Solar Ultraviolet Radiation: Aspects of Importance to the Weathering of Materials”, Accelerated and Outdoor Durability Testing of Organic Materials, ASTM STP 1202, 3-26 (1994).

F1147-E(10/2008)
REPORT DOCUMENTATION PAGE Form Approved OMB No. 0704-0188
The public reporting burden for this collection of information is estimated to average 1 hour per response, including the time for reviewing instructions, searching existing data sources, gathering and maintaining the data needed, and completing and reviewing the collection of information. Send comments regarding this burden estimate or any other aspect of this collection of information, including suggestions for reducing the burden, to Department of Defense, Executive Services and Communications Directorate (0704-0188). Respondents should be aware that notwithstanding any other provision of law, no person shall be subject to any penalty for failing to comply with a collection of information if it does not display a currently valid OMB control number. PLEASE DO NOT RETURN YOUR FORM TO THE ABOVE ORGANIZATION. 1. REPORT DATE (DD-MM-YYYY)
July 2009 2. REPORT TYPE
Conference Paper 3. DATES COVERED (From - To)
August 2-6, 2009 4. TITLE AND SUBTITLE
Analysis of Transmitted Optical Spectrum Enabling Accelerated Testing of CPV Designs: Preprint
5a. CONTRACT NUMBER DE-AC36-08-GO28308
5b. GRANT NUMBER
5c. PROGRAM ELEMENT NUMBER
6. AUTHOR(S) D.C. Miller, M.D. Kempe, C.E. Kennedy, and S.R. Kurtz
5d. PROJECT NUMBER NREL/CP-520-44968
5e. TASK NUMBER PVB76701
5f. WORK UNIT NUMBER
7. PERFORMING ORGANIZATION NAME(S) AND ADDRESS(ES) National Renewable Energy Laboratory 1617 Cole Blvd. Golden, CO 80401-3393
8. PERFORMING ORGANIZATION REPORT NUMBER NREL/CP-520-44968
9. SPONSORING/MONITORING AGENCY NAME(S) AND ADDRESS(ES)
10. SPONSOR/MONITOR'S ACRONYM(S) NREL
11. SPONSORING/MONITORING AGENCY REPORT NUMBER
12. DISTRIBUTION AVAILABILITY STATEMENT National Technical Information Service U.S. Department of Commerce 5285 Port Royal Road Springfield, VA 22161
13. SUPPLEMENTARY NOTES
14. ABSTRACT (Maximum 200 Words) Concentrated photovoltaics (CPV) has recently gained interest based on its scalability and expected low levelized cost of electricity. The reliability of materials used in CPV systems, however, is not well established. The current qualification test for photodegradation of CPV modules includes only real-time ultraviolet (UV) exposure, i.e. methods for accelerated UV testing have not been developed. Therefore, the UV and infrared (IR) spectra transmitted through representative optical systems are evaluated in this paper. The measurements of concentrating optics are used to assess expected optical performance as well as to understand how to quantify damaging optical exposure. Optical properties (transmittance, refractive index, reflectance, and absorptance) of candidate materials are identified. The dose and flux analysis here identifies the increased significance of IR (as opposed to UV) exposure for CPV systems, particularly for the most concentrating systems. For these, the UV dose may not greatly exceed the unconcentrated global solar condition, but the thermal load scales nearly directly with the geometric concentration.
15. SUBJECT TERMS PV; activation spectrum; action spectrum; ultraviolet; infrared; reliability; durability accelerated testing;
16. SECURITY CLASSIFICATION OF: 17. LIMITATION OF ABSTRACT
UL
18. NUMBER OF PAGES
19a. NAME OF RESPONSIBLE PERSON a. REPORT
Unclassified b. ABSTRACT Unclassified
c. THIS PAGE Unclassified 19b. TELEPHONE NUMBER (Include area code)
Standard Form 298 (Rev. 8/98) Prescribed by ANSI Std. Z39.18