
NREL Advanced Research Turbine (ART) Aerodynamic Design … · Aerodynamic Design of ART-2B Rotor...
58
August 2000 NREL/SR-500-28473 Dayton A. Griffin Global Energy Concepts, LLC Kirkland, Washington NREL Advanced Research Turbine (ART) Aerodynamic Design of ART-2B Rotor Blades National Renewable Energy Laboratory 1617 Cole Boulevard Golden, Colorado 80401-3393 NREL is a U.S. Department of Energy Laboratory Operated by Midwest Research Institute • Battelle • Bechtel Contract No. DE-AC36-99-GO10337
Transcript of NREL Advanced Research Turbine (ART) Aerodynamic Design … · Aerodynamic Design of ART-2B Rotor...

August 2000 � NREL/SR-500-28473
Dayton A. GriffinGlobal Energy Concepts, LLCKirkland, Washington
NREL Advanced ResearchTurbine (ART) AerodynamicDesign of ART-2B Rotor Blades
National Renewable Energy Laboratory1617 Cole BoulevardGolden, Colorado 80401-3393NREL is a U.S. Department of Energy LaboratoryOperated by Midwest Research Institute •••• Battelle •••• Bechtel
Contract No. DE-AC36-99-GO10337

August 2000 � NREL/SR-500-28473
NREL Advanced ResearchTurbine (ART) AerodynamicDesign of ART-2B Rotor Blades
Dayton A. GriffinGlobal Energy Concepts, LLCKirkland, Washington
NREL Technical Monitor: Alan LaxsonPrepared under Subcontract No. VAM-8-18208-01
National Renewable Energy Laboratory1617 Cole BoulevardGolden, Colorado 80401-3393NREL is a U.S. Department of Energy LaboratoryOperated by Midwest Research Institute •••• Battelle •••• Bechtel
Contract No. DE-AC36-99-GO10337

NOTICE
This report was prepared as an account of work sponsored by an agency of the United Statesgovernment. Neither the United States government nor any agency thereof, nor any of their employees,makes any warranty, express or implied, or assumes any legal liability or responsibility for the accuracy,completeness, or usefulness of any information, apparatus, product, or process disclosed, or representsthat its use would not infringe privately owned rights. Reference herein to any specific commercialproduct, process, or service by trade name, trademark, manufacturer, or otherwise does not necessarilyconstitute or imply its endorsement, recommendation, or favoring by the United States government or anyagency thereof. The views and opinions of authors expressed herein do not necessarily state or reflectthose of the United States government or any agency thereof.
Available electronically at http://www.doe.gov/bridge
Available for a processing fee to U.S. Department of Energyand its contractors, in paper, from:
U.S. Department of EnergyOffice of Scientific and Technical InformationP.O. Box 62Oak Ridge, TN 37831-0062phone: 865.576.8401fax: 865.576.5728email: [email protected]
Available for sale to the public, in paper, from:U.S. Department of CommerceNational Technical Information Service5285 Port Royal RoadSpringfield, VA 22161phone: 800.553.6847fax: 703.605.6900email: [email protected] ordering: http://www.ntis.gov/ordering.htm
Printed on paper containing at least 50% wastepaper, including 20% postconsumer waste

Aerodynamic Design of ART-2B Rotor Blades ii
Table of Contents1. General .................................................................................................................................................1
1.1 Background ...................................................................................................................................11.2 Purpose..........................................................................................................................................11.3 Approach .......................................................................................................................................2
2. Overview of Design Approach ...........................................................................................................3
2.1 Signs and Conventions ..................................................................................................................32.2 Aerodynamic Design Criteria........................................................................................................52.3 Aerodynamic Design Methodology ..............................................................................................52.4 Structural Design Considerations..................................................................................................6
3. Candidate Airfoils ...............................................................................................................................7
3.1 NREL Airfoil Families..................................................................................................................73.2 Eppler Calculations of Airfoil Properties .....................................................................................73.3 Reynolds Number Effects ...........................................................................................................18
4. Performing Rotor Design Studies with PROPID...........................................................................20
4.1 Design Process for Near-Optimal Variable-Speed Performance ................................................204.2 Example Rotor Design ................................................................................................................21
4.2.1 Assumptions / Constraints...................................................................................................214.2.2 Target Lift Distributions .....................................................................................................224.2.3 Resulting Blade Design.......................................................................................................244.2.4 Effect of Using Wind tunnel Data for S825........................................................................26
5. Evaluation of Candidate Airfoil Families .......................................................................................28
5.1 Assumptions / Constraints...........................................................................................................285.2 Target Lift Distributions .............................................................................................................285.3 Summary of Airfoil Family Results ............................................................................................29
6. Sweep of Design TSR for Blade Using S818/825/826 Airfoils .......................................................33
7. Detailed Aerodynamic Design..........................................................................................................36
7.1 Effect of Varying Lift Distributions............................................................................................367.2 Performance Losses Due to Imposed Design Details .................................................................377.3 Comparison of Power Performance with ART-1 and ART-2A Rotors ......................................39
8. Conclusions ........................................................................................................................................42
9. References ..........................................................................................................................................43
Appendix A Summary of Archived Electronic Files ......................................................................... A-1
Appendix B Example PROPID Input File for Rotor Design and Analysis .................................... B-1

Aerodynamic Design of ART-2B Rotor Blades iii
List of FiguresFigure 1. Blade planform viewed facing downwind....................................................................................3Figure 2. Relationship between global and local blade coordinates (viewed from root to tip) ...................4Figure 3. Blade airfoil section in local coordinates (viewed from root-to-tip) ............................................4Figure 4. S815 and S818 root airfoils ..........................................................................................................8Figure 5. Primary and tip airfoils for the S815/809/810 family...................................................................9Figure 6. Primary and tip airfoils for the S818/825/826 family.................................................................10Figure 7. Primary and tip airfoils for the S818/827/828 family.................................................................11Figure 8. Aerodynamic curves for the S815/809/810 airfoil family..........................................................12Figure 9. Aerodynamic curves for the S818/825/826 airfoil family..........................................................13Figure 10. Aerodynamic curves for the S818/827/828 airfoil family........................................................14Figure 11. Comparison of Eppler calculations with Delft wind tunnel data for S809...............................16Figure 12. Comparison of Eppler calculations with LTPT wind tunnel data for S825 .............................17Figure 13. Blade Reynolds number for ART-2A (variable-speed ART-1)................................................18Figure 14. Reynolds number effects for S818/825/826 airfoil family.......................................................19Figure 15. Shifting of target CL distribution ..............................................................................................23Figure 16. Rotation of target CL distribution .............................................................................................23Figure 17. Variation of CPmax because of shifting of target CL distribution ...............................................24Figure 18. PROPID planform for near-optimal rotor (S818/825/826 at design TSR = 8).........................25Figure 19. PROPID twist distribution for near-optimal rotor (S818/825/826 at design TSR = 8)............25Figure 20. PROPID planforms for S818/825/826 blade, measured versus Eppler S285 data ...................27Figure 21. PROPID twist distributions for S818/825/826 blade, measured versus Eppler S285 data ......27Figure 22. PROPID near-optimal planforms for candidate airfoil families...............................................30Figure 23. Calculated thrust versus power for candidate airfoil families ..................................................31Figure 24. CP � TSR curves for candidate airfoil families.........................................................................31Figure 25. Thrust versus power for S818/825/826 blades at varying design TSR ....................................34Figure 26. RPM Schedule for optimal VS operation at varying design TSR ............................................34Figure 27. CP-TSR curves for near-optimal S818/825/826 blades ............................................................35Figure 28. Planforms for near-optimal S818/825/826 blades ....................................................................35Figure 29. Effect of varying CL,75%R on CP-TSR curve ..............................................................................37Figure 30. Imposed linear taper for S818/825/826 blade...........................................................................38Figure 31. Truncated twist schedule for S818/825/826 blade ...................................................................38Figure 32. Calculated ART power curves..................................................................................................41Figure 33. ART-2B rotor at fixed-speed operation....................................................................................41
List of TablesTable 1. Summary of Design Parameters for NREL S-Series Airfoils ......................................................15Table 2. Baseline Target CL Distribution for S818/825/826 Airfoil Family .............................................22Table 3. Baseline Target CL Distribution for S818/825/826 Airfoils using Measured S825 Data............26Table 4. Baseline Target CL Distribution for S818/827/828 Airfoil Family .............................................28Table 5. Baseline Target CL Distribution for S815/809/810 Airfoil Family .............................................28Table 6. Near-Optimal Rotor Designs for Candidate Airfoil Families......................................................29Table 7. Summary of Rotor Designs for Candidate Airfoil Families ........................................................32Table 8. Summary Results for Study of Design TSR, S818/825/826 Blades ............................................33Table 9. Summary Effects of Varying CL,75%R for S818/825/826 Blade at Design TSR =8......................36Table 10. Effect of Design Details on S818/825/826 Blade......................................................................39Table 11. Blade Geometry for S818/825/826 with Aerodynamic Design Details.....................................39Table 12. AEP Calculations for ART Rotor Power Curves.......................................................................40

Aerodynamic Design of ART-2B Rotor Blades 1
1. General1.1 Background
As a part of its Advanced Research Program, the National Renewable Energy Laboratory (NREL)installed two new Advanced Research Turbines (ART). The ART turbines are being used by NREL asfull-scale test beds for ongoing research efforts, including three-dimensional blade aerodynamics and theeffects of various control methods on turbine loads and performance. The Westinghouse WWG-0600was selected as a baseline configuration for the ART turbines because of its scale, robust design, andwell-known operational history.
The Westinghouse WWG-0600 is a 600-kilowatt (kW), two-bladed upwind turbine with a teetering huband full-span blade pitch control. The first turbine NREL installed, designated ART-1, at the NationalWind Technology Center (NWTC) near Boulder, Colorado, is currently operational and has been used tocollect a baseline set of performance and loads data.
A second turbine, designated ART-2A, was installed on a neighboring site at the NWTC. The ART-2Aturbine is also a WWG-0600 but incorporates several major modifications:
1. A new hub was installed with independent electromechanical blade pitch systems replacing theoriginal hydraulic pitch system.
2. An induction generator with a variable-speed drive replaced the synchronous generator and fluidcoupling.
3. The original controller was replaced by a PC-based integrated control and data acquisition system.
This second turbine may be upgraded further to a configuration designated ART-2B. Possible features ofthe ART-2B turbine include a multi-degree of freedom hub and newly designed rotor blades.
Global Energy Concepts, L.L.C. (GEC, formerly Kamzin Technology, Inc.) provided engineering supportto NREL in designing the components for the ART-2B turbine. The current document provides asummary of work performed by GEC on the aerodynamic design of ART-2B rotor blades.
1.2 Purpose
The purpose of this report is to summarize the aerodynamic design work performed for the ART-2B rotorand to formally document both the process used and the results obtained.

Aerodynamic Design of ART-2B Rotor Blades 2
1.3 Approach
The ART-2B turbine is intended to support the ongoing research efforts of NREL�s Advanced ResearchProgram. The ART-2B blade design is, therefore, not intended to be commercially competitive but ratherto reflect state-of-the-art aerodynamic performance. As such, the aerodynamic design objectives weregiven first priority in this process, and structural design aspects were considered secondary.
The aerodynamic design of the ART-2B rotor blades was optimized for variable-speed, variable-pitchoperation, with peak rotor power coefficients (CP) as high as possible. Design studies were performed toinvestigate various airfoil families, design tip-speed ratios(TSR), and other design considerations.Specifically, the design studies included:
• An evaluation of three NREL S-series airfoil families− S818/825/826− S818/827/828− S815/809/810.
• For the S818/825/826 airfoil family, a sweep of design TSR was conducted.• For the S818/825/826 airfoil family at design TSR = 8, the detailed aerodynamic design was
considered, including an evaluation of performance losses because of imposed design details.
For each airfoil design considered, a near-optimal blade geometry was determined, with calculatedannual energy production (AEP) used as the primary figure of merit. Structural efficiency (strength, cost,and weight) were addressed qualitatively through consideration of the resulting blade dimensions. Forselected cases, the effects of design variations on operating rotor thrust and peak (50-year) blade bendingloads were evaluated.

Aerodynamic Design of ART-2B Rotor Blades 3
2. Overview of Design Approach
2.1 Signs and Conventions
Some basic blade terminology, signs, and conventions are defined in Figures 1 through 3. A generatorline (z-axis) is defined that is perpendicular to the plane of the blade root. A global blade coordinatesystem is defined with x and y axes lying in the plane of the blade root.
The blade shape is then described as a series of airfoil sections along the blade span. At each spanwisestation, local coordinates (x′-y′) are introduced as indicated in Figure 2. The local coordinate system isrelated to the global blade coordinates by a translation in the x-y plane followed by a rotation equal to thelocal blade twist angle. Each blade section is then defined by its x′-y′ coordinates, with the leading edgeat the local origin, and the local section chord coincident with the y′-axis.
In the present work, each blade aerodynamic design is described and analyzed in terms of its spanwiseschedule of airfoil shapes, chord lengths and twist angles. The aerodynamic designs will frequently bepresented and discussed in non-dimensional combinations of the dimensions and parameters shown inFigures 1 through 3 (i.e., r/R, c/R, x′/c, y′/c).
Figure 1. Blade planform viewed facing downwind

Aerodynamic Design of ART-2B Rotor Blades 4
Figure 2. Relationship between global and local blade coordinates (viewed from root to tip)
Figure 3. Blade airfoil section in local coordinates (viewed from root-to-tip)

Aerodynamic Design of ART-2B Rotor Blades 5
2.2 Aerodynamic Design Criteria
The aerodynamic designs for the ART-2B rotors were developed to optimize power performance forvariable-speed, variable-pitch operation. This implies that each rotor is designed to maximize peak rotorpower coefficients (CPmax). In making AEP calculations, the rotors were assumed to maintain peak CP forall wind speeds up to rated power. The designs were subject to the following constraints:• Rated power = 600 kW, independent of air density• Rotor radius = 21.34 meters (m), [70 feet (ft)]• Hub radius (to blade root) = 1.38 m, [54.4 inches (in.)]• Root chord = 1.14 m (45 in.)• Rotor speed range (low speed shaft) = zero to 45 revolutions per minute (rpm)• Number of blades = 2• Rotation = clockwise when viewed facing downwind.
2.3 Aerodynamic Design Methodology
The ART-2B blade design was conducted using the NREL S-series of airfoils [Ref. 1]. In particular, thedesign and analysis focused on three families of airfoils that were designed for high Reynolds number(Re). Note that throughout this report, the full designation will be used when referencing a single airfoil(i.e., the S825 airfoil), however for brevity only the first �S� will be used when discussing completeairfoil families (i.e., the S818/825/826 family).
The aerodynamic properties of the candidate airfoils (lift and drag curves) were calculated using theEppler Airfoil Design and Analysis Code [Ref. 2], with the calculations validated using wind tunnel dataas available [Refs. 3 and 4]. Once the aerodynamic properties were developed, several design studieswere performed, including:• An evaluation of the three NREL S-series airfoil families
− S818/ 825/826− S818/827/828− S815/809/810.
• For the S818/825/826 airfoil family, a sweep of design TSR was conducted.• For the S818/825/826 airfoil family at design TSR = 8, the detailed aerodynamic design was
considered, including an evaluation of performance losses due to imposed design details.
For each airfoil design considered, a near-optimal blade geometry was determined. With airfoils anddesign tip-speed selected, and the blade radius constrained, the primary design variables remaining aredistributions of local chord and twist. The blade designs were performed using the PROPID computercode [Ref. 5].
The primary figure of merit for aerodynamic performance was the calculated annual energy production.The AEP calculations were performed within PROPID according to the methods presented in Reference 6.The calculations were based on generator power versus wind-speed curves, assuming a constant drivetrainefficiency of 90%, no soiling or array losses, and 100% availability. The AEP calculations used a Weibullwind distribution with shape factor k = 1.7, annual average wind speed of 7.5 meters per second (m/s) athub-height, and an air density of 1.03 kilograms per meter cubed (kg/m3). Because all of

Aerodynamic Design of ART-2B Rotor Blades 6
the designs resulting from this study reached rated power at or before 12 m/s wind speed, the majority ofthe comparative AEP calculations in this report have been performed excluding wind speeds above 12 m/s.
2.4 Structural Design Considerations
As discussed earlier, the aerodynamic design objectives were given first priority in this process, withstructural design aspects considered as secondary. Although no rigorous studies were conducted to trade-off aerodynamic performance against blade cost and weight, structural efficiency has been addressedqualitatively through consideration of blade dimensions.
For selected cases, the effect of design variations on operating rotor thrust and peak (50-year) bladebending loads has been evaluated. All bending loads are reported in kilo Newton-meters (kN-m). Forpeak bending loads, a 50-year extreme gust of 70 m/s was used according to a Class I wind regime perthe International Electrotechnical Commission 61400-1 standard [Ref. 7]. Air density of 1.03 kg/m3 wasused for all aerodynamic calculations, including the peak bending loads. A drag coefficient of 1.8 wasused for making the bending load calculations, and the full planform was assumed to be loaded (i.e.,blades in full power-production position with no reduction in loaded area due to twist and pitch).Although these assumptions are somewhat conservative, the calculations are only presented forcomparative purposes. Finally, it should be noted that no load partial safety factors have been applied toeither the thrust or peak bending loads presented herein.

Aerodynamic Design of ART-2B Rotor Blades 7
3. Candidate Airfoils
3.1 NREL Airfoil Families
The ART-2B blade design was conducted using the NREL S-series of airfoils. In particular, the processfocused on the following three families of airfoils that were designed for high Reynolds number:• S818/825/826• S818/827/828• S815/809/810
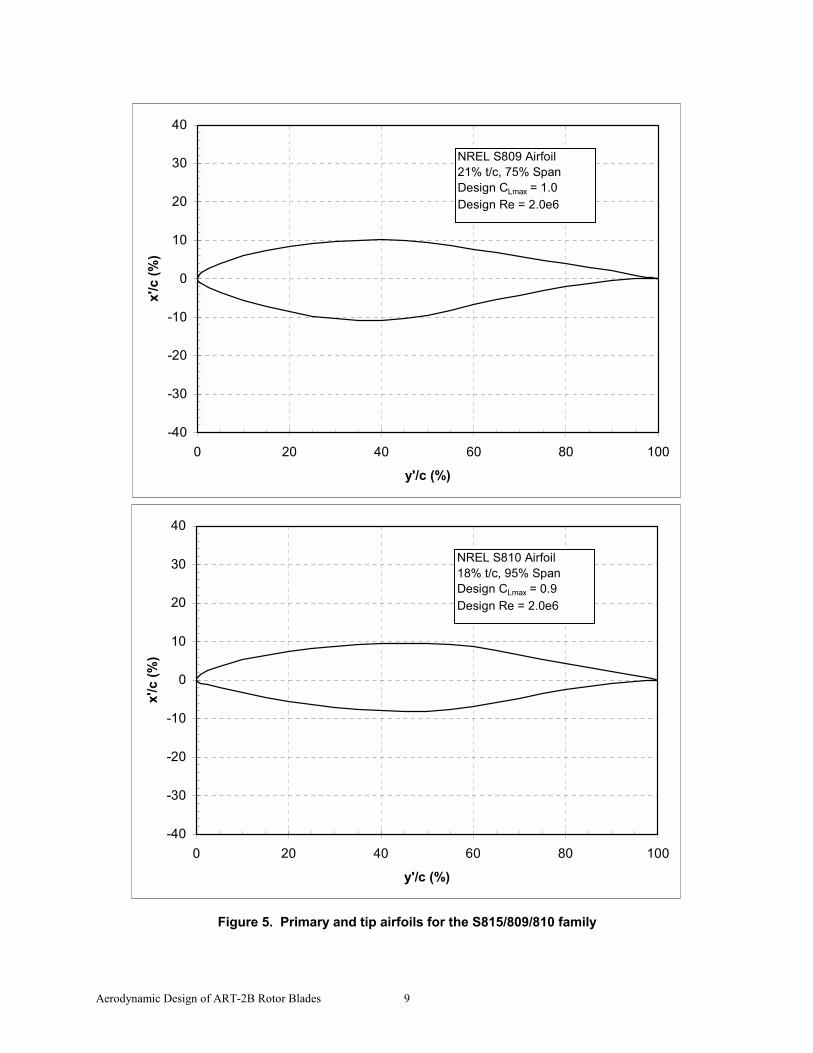
The root airfoils for these families (S815 and 818) are depicted in Figure 4. The primary (75% span) andtip (95% span) airfoils for each family are presented in Figures 5−7. In all cases the airfoil coordinatesand maximum thickness are shown as normalized to the airfoil chord (x′/c, y′/c and t/c, expressed as apercentage). As seen in the figures, the S818/825/826 family is the thinnest and most highly cambered.
3.2 Eppler Calculations of Airfoil Properties
The aerodynamic properties of the candidate airfoils (lift and drag curves) were calculated using theEppler Airfoil Design and Analysis Code, with the calculations validated using wind tunnel data asavailable. The lift and drag data are presented in coefficient form (CL and CD). In preparing the Epplerdata for input into the PROPID code, the lift curves for all airfoils were flat-lined for all angles of attack(AOA) above maximum lift coefficient (CLmax). This was done for convenience, and allowed thePROPID inverse design process to run more robustly. As will be illustrated in the following discussions,the aerodynamic data above CLmax is of no consequence to the aerodynamic design of variable-speedrotors with active power control.
Figure 8 shows the calculated aerodynamic properties for the S815/809/810 family. Note that the rootairfoil (S815) shows markedly different lift characteristics than the primary and tip airfoils (S809 andS810). The outboard airfoils were designed for low CLmax, whereas no attempt was made to restrain CLmaxfor the root airfoil. Inspection of the airfoil shapes (Figures 4 and 5) shows that the S815 also hassignificantly more camber than the S809 and S810 airfoils, and this distinction is evident by the offset inzero-lift angles between the root and the outboard airfoils. Figure 8 also shows the lift/drag (L/D) curvefor the S815/809/810 family. Comparison with the lift curve shows that maximum lift/drag (L/Dmax)occurs at an earlier angle of attack than CLmax, which holds true for all airfoils considered.
Figure 9 shows the aerodynamic properties for the S818/825/826 family. All three airfoils have beendesigned for high CLmax, and the lift curves for the airfoils are similar in both zero lift angle andmagnitude of CLmax. The L/D curves show a well-behaved trend of increasing L/Dmax with decreasingairfoil thickness. Due to the wider drag bucket of the S818, the angle of attack for L/Dmax is severaldegrees higher than for the outboard airfoils.
Figure 10 shows the calculated aerodynamic properties for the S818/827/828 family. For this family, theprimary and tip airfoils have been designed for low CLmax, so the corresponding lift curves are markedlydifferent that that of the S818. Note that the S827 and S828 airfoils have also been designed for very lowdrag, and as a result, have the highest L/Dmax values of the candidate airfoils considered.

Aerodynamic Design of ART-2B Rotor Blades 8
-40
-30
-20
-10
0
10
20
30
40
0 20 40 60 80 100
y'/c (%)
x'/c
(%)
NREL S815 Airfoil26% t/c, 30% SpanDesign CLmax = 1.2Design Re = 1.2e6
-40
-30
-20
-10
0
10
20
30
40
0 20 40 60 80 100
y'/c (%)
x'/c
(%)
NREL S818 Airfoil24% t/c, 40% SpanDesign CLmax = 1.3Design Re = 2.5e6
Figure 4. S815 and S818 root airfoils
Aerodynamic Design of ART-2B Rotor Blades 9
-40
-30
-20
-10
0
10
20
30
40
0 20 40 60 80 100
y'/c (%)
x'/c
(%)
NREL S809 Airfoil21% t/c, 75% SpanDesign CLmax = 1.0Design Re = 2.0e6
-40
-30
-20
-10
0
10
20
30
40
0 20 40 60 80 100
y'/c (%)
x'/c
(%)
NREL S810 Airfoil18% t/c, 95% SpanDesign CLmax = 0.9Design Re = 2.0e6
Figure 5. Primary and tip airfoils for the S815/809/810 family

Aerodynamic Design of ART-2B Rotor Blades 10
-40
-30
-20
-10
0
10
20
30
40
0 20 40 60 80 100
y'/c (%)
x'/c
(%)
NREL S825 Airfoil17% t/c, 75% SpanDesign CLmax = 1.6Design Re = 2.0e6
-40
-30
-20
-10
0
10
20
30
40
0 20 40 60 80 100
y'/c (%)
x'/c
(%)
NREL S826 Airfoil14% t/c, 95% SpanDesign CLmax = 1.6Design Re = 1.5e6
Figure 6. Primary and tip airfoils for the S818/825/826 family

Aerodynamic Design of ART-2B Rotor Blades 11
-40
-30
-20
-10
0
10
20
30
40
0 20 40 60 80 100
y'/c (%)
x'/c
(%)
NREL S827 Airfoil21% t/c, 75% SpanDesign CLmax = 1.0Design Re = 4.0e6
-40
-30
-20
-10
0
10
20
30
40
0 20 40 60 80 100
y'/c (%)
x'/c
(%)
NREL S828 Airfoil16% t/c, 95% SpanDesign CLmax = 0.9Design Re = 3.0e6
Figure 7. Primary and tip airfoils for the S818/827/828 family

Aerodynamic Design of ART-2B Rotor Blades 12
-0.5
0.0
0.5
1.0
1.5
2.0
-5 0 5 10 15 20
Angle of Attack (degrees)
Lift
Coe
ffici
ent
0.00
0.01
0.02
0.03
0.04
0.05
Dra
g C
oeffi
cien
t
Eppler calculatedairfoil data.Re = 2.0e6
0
50
100
150
200
-5 0 5 10 15 20
Angle of Attack (degrees)
Lift
/ Dra
g
S815 S809 S810
Eppler calculatedairfoil data.Re = 2.0e6
Figure 8. Aerodynamic curves for the S815/809/810 airfoil family

Aerodynamic Design of ART-2B Rotor Blades 13
-0.5
0.0
0.5
1.0
1.5
2.0
-5 0 5 10 15 20
Angle of Attack (degrees)
Lift
Coe
ffici
ent
0.00
0.01
0.02
0.03
0.04
0.05
Dra
g C
oeffi
cien
t
Eppler calculatedairfoil data.Re = 2.0e6
0
50
100
150
200
-5 0 5 10 15 20
Angle of Attack (degrees)
Lift
/ Dra
g
S818 S825 S826
Eppler calculatedairfoil data.Re = 2.0e6
Figure 9. Aerodynamic curves for the S818/825/826 airfoil family

Aerodynamic Design of ART-2B Rotor Blades 14
-0.5
0.0
0.5
1.0
1.5
2.0
-5 0 5 10 15 20
Angle of Attack (degrees)
Lift
Coe
ffici
ent
0.00
0.01
0.02
0.03
0.04
0.05
Dra
g C
oeffi
cien
t
Eppler calculatedairfoil data.
0
50
100
150
200
-5 0 5 10 15 20
Angle of Attack (degrees)
Lift
/ Dra
g
S818 (Re=2e6) S827 (Re=4e6) S828 (Re=3e6)
Eppler calculatedairfoil data.
Figure 10. Aerodynamic curves for the S818/827/828 airfoil family

Aerodynamic Design of ART-2B Rotor Blades 15
Wind tunnel testing was conducted at Delft University to verify the aerodynamic properties of the S809airfoil [Ref. 3]. Figure 11 shows a comparison of these measured Delft data with the Eppler calculationsused in the present work. The experimental lift curve shows a very subtle stall between 9° and 11° AOA,with a �secondary� CLmax and stall around 15°. The Eppler calculations do not show this secondary CLmax,but otherwise are near-perfect in their prediction of the measured data. Similarly good agreement withEppler predictions was found from testing of the S814 airfoil at Delft [Ref. 8].
The S825 and S827 airfoils were tested in 1999 at the National Aeronautic and Space AdministrationLangley Low-Turbulence Pressure Tunnel (LTPT) [Ref. 4]. Figure 12 shows the comparison of themeasured aerodynamic properties with Eppler calculations. As seen in the figure, there is an offsetbetween the predicted and measured lift curves, and the drag data do not agree as well as was observedfor the S809. The error in predicted lift and drag combine to result in the discrepancies seen in the L/Dcurves. Most important to the aerodynamic design of blades is not that the measured L/Dmax is lower thanpredicted, but that it occurs at a lower value of CL and 2° earlier AOA. The significance of thisdiscrepancy to aerodynamic blade design will be evaluated in Section 4.2.4.
The LTPT-measured data for the S827 also deviated substantially from the Eppler predictions, but withdifferent trends than seen for the S825. (Note that the tabular data for S827 measurements were not madeavailable to GEC, but the graphical data can be found in Reference 4). Specifically, the S827 showedCLmax values significantly higher than the design target. This characteristic is contrary to the originallyintended application of the S827 (benign stall-regulated operation). However, the higher value of CLmaxwould be of no consequence to a rotor designed for variable speed operation with active power control solong as the power control was pitch-to-feather.
The majority of work performed on the ART-2B rotor blade design occurred before the LTPT test resultsfor the S825 and S827 were available. The scaling studies presented herein are based entirely on Eppler-calculated aerodynamic properties, with the exception of the example calculations in Section 4.2.4.Table 1 provides a summary of the key design parameters for the candidate NREL airfoils. Note that forthe S825, both the calculated and measured parameters are given.
Table 1. Summary of Design Parameters for NREL S-Series Airfoils
Airfoil
Location(%
Radius)
Thickness
(t/cmax)
Design Re(millions) CLmax
Alphaat CLmax
L/DmaxCL at
L/Dmax
Alphaat L/Dmax
S815 0.30 0.26 1.2 1.35 10.0° 104 1.21 7.0°S818 0.40 0.24 2.5 1.60 11.0° 115 1.52 9.0°S809 0.75 0.21 2.0 1.00 10.0° 103 0.73 5.0°S810 0.95 0.18 2.0 0.95 8.0° 132 0.73 5.0°S825 0.75 0.17 2.0 1.50 11.0° 125 1.32 6.0°S825* 0.75 0.17 2.0 1.56 13.0° 115 1.01 4.0°S826 0.95 0.14 1.5 1.60 11.0° 142 1.26 5.0°S827 0.75 0.21 4.0 1.00 8.0° 154 0.86 5.0°S828 0.95 0.16 3.0 0.91 8.0° 170 0.84 6.0°
*Properties as measured for S825 at LTPT wind tunnel tests

Aerodynamic Design of ART-2B Rotor Blades 16
-0.5
0.0
0.5
1.0
1.5
2.0
-5 0 5 10 15 20
Angle of Attack (degrees)
Lift
Coe
ffici
ent
0.00
0.01
0.02
0.03
0.04
0.05
Dra
g C
oeffi
cien
t
Re = 2.0e6
0
50
100
150
200
-5 0 5 10 15 20
Angle of Attack (degrees)
Lift
/ Dra
g
S809, Eppler S809, Delft
Re = 2.0e6
Figure 11. Comparison of Eppler calculations with Delft wind tunnel data for S809

Aerodynamic Design of ART-2B Rotor Blades 17
-0.5
0.0
0.5
1.0
1.5
2.0
-5 0 5 10 15 20
Angle of Attack (degrees)
Lift
Coe
ffici
ent
0.00
0.01
0.02
0.03
0.04
0.05
Dra
g C
oeffi
cien
t
Re = 2.0e6
0
50
100
150
200
-5 0 5 10 15 20
Angle of Attack (degrees)
Lift
/ Dra
g
S825, Eppler S825, LTPT
Re = 2.0e6
Figure 12. Comparison of Eppler calculations with LTPT wind tunnel data for S825

Aerodynamic Design of ART-2B Rotor Blades 18
3.3 Reynolds Number Effects
The PROPID calculations used in this study include Reynolds number effects. Figure 13 shows thespanwise Re distribution calculated for ART-1 rotor blade at a schedule of discrete rotational speeds (42rpm represents the baseline fixed-speed operation of the ART-1). Although the actual Re distribution forART-2B blades will vary with each rotor design, Figure 13 provides a useful estimate of both the rangeof typical magnitudes and the effect of rotor speed on Re.
0.0
1.0
2.0
3.0
4.0
5.0
0.0 0.1 0.2 0.3 0.4 0.5 0.6 0.7 0.8 0.9 1.0
Radial Position (r/R)
Rey
nold
s N
umbe
r (m
illio
ns)
Increasing rotor speed,10, 20, 30, 42 rpm
Re based on rotor speed only,air density = 1.03 kg/m3
Figure 13. Blade Reynolds number for ART-2A (variable-speed ART-1)
In terms of airfoil aerodynamic properties, two effects may be expected with increasing Re−a decrease indrag values throughout the drag bucket and an increase in CLmax. The increments in minimum drag andCLmax are most pronounced at the lower range of Re (i.e., from 1e6 to 2e6) and diminish at higher Re (i.e.,from 3e6 to 4e6).
Figure 14 shows the aerodynamic properties used in the present scaling study for the S825 at varyingReynolds numbers. Note that although the Eppler calculations for the S825 predicted an increase inCLmax with increasing Re, that trend would have no effect on the design of optimal variable speed rotorsand as such has not been included in the input data files. However, the decrease in minimum drag withincreasing Re is evident in the drag curve and is responsible for the corresponding increases in L/Dmax.This Re trend will effect the blade optimizations and is incorporated in the PROPID calculations.

Aerodynamic Design of ART-2B Rotor Blades 19
-0.5
0.0
0.5
1.0
1.5
2.0
-5 0 5 10 15 20
Angle of Attack (degrees)
Lift
Coe
ffici
ent
0.00
0.01
0.02
0.03
0.04
0.05
Dra
g C
oeffi
cien
t
Eppler calculatedS825 airfoil data.
0
50
100
150
200
-5 0 5 10 15 20
Angle of Attack (degrees)
Lift
/ Dra
g
Re = 2.0e6 Re = 3.0e6 Re = 4.0e6
Eppler calculatedS825 airfoil data.
Figure 14. Reynolds number effects for S818/825/826 airfoil family

Aerodynamic Design of ART-2B Rotor Blades 20
4. Performing Rotor Design Studies with PROPID
The original ART-2B blade scaling studies were performed and presented to NWTC personnel inNovember 1998. In subsequent work and in the course of preparing this report, additional cases were runand updates were made to the original design study calculations. As a result, all of the design studiespresented in the current report are based on calculations using the PROPID code version �PROPID34�[Ref. 9]. All of the archived input and output files for these studies are documented in Appendix A.
4.1 Design Process for Near-Optimal Variable-Speed Performance
PROPID does not optimize, but rather will perform a multi-point inverse design of a rotor blade to meetany number of specified criteria. The development of a near-optimal blade design therefore requiressome pre-knowledge of rotor design trends and the use of judgment in developing input files. Norigorous optimization methodology has been used in the current work, and the resulting designs must,therefore, be considered �near-optimal.� However, it will be seen in the following sections that the near-optimal design space can become very flat and that the performance increment between these near-optima and a true optimum design is very small.
PROPID will iterate to search for a blade design to satisfy any number of designer-specified criteria, butthe code can converge on a solution only if the specified combination is physically realizable. For eachdesign criterion specified, the designer must give up one degree of freedom. For instance, for each bladesegment where the local lift coefficient is specified, PROPID must have one variable on which it caniterate to satisfy the criterion. In the case of specified CL, the blade twist is the logical choice of a freevariable. Similarly, the local blade chords can be used as free design variables to achieve a desireddistribution of axial induction factors.
For any combination of design objectives (i.e., CL and axial induction factors), a �design point� must bespecified at which the rotor will satisfy the objectives. In general, each design point includesspecification of wind speed, rotor speed, and blade pitch angle. Note that these design point parametersmay also be included as either design objectives or allowed as degrees of freedom in the iteration, butonly so long as a one-to-one correspondence is maintained between the design criteria and free variables.
For the ART-2B rotor design studies, a design point wind speed of 7.15 m/s was used for all cases. Thatis, the rotor designs will achieve their near-optimal CP conditions at a wind speed of 7.15 m/s. Thisselection of design point wind speed is somewhat arbitrary. Because the rotors are designed for variable-speed operation, the rotor will track the optimum CP condition over a wide range of the power curve(wind speeds) below rated power. For each blade design, the rotor speed was set to achieve the desireddesign TSR, and the blade pitch angle was given up as a degree of freedom.
The following steps outline the process used to design blades for near-optimal variable-speed powerperformance:
1. Specify an airfoil family and the spanwise location of each airfoil on the blade.2. Specify a CL distribution along the blade that is close to L/Dmax.3. Specify a constant axial induction factor of 0.33 at all blade stations (near-optimal value from blade-
element momentum theory).

Aerodynamic Design of ART-2B Rotor Blades 21
4. Select a design point (TSR and wind speed) at which to satisfy the design objectives.5. Allow PROPID to iterate on blade twist, chord, and pitch to achieve specifications.6. Evaluate each design on the basis of calculated AEP and maximum rotor CP.7. Shift specified CL distribution and repeat steps 3 through 6.8. Identify near-optimum based on highest AEP and/or best CPmax.
The above steps will result in blades that are close enough to optimal designs so that the process can beused for comparative evaluation of airfoil families, design tip speed ratios, rotor scaling, and other suchtrade-off studies. However, if a full, detailed design is desired, the process can be refined through:
9. Subtle perturbation of the CL and axial induction distribution specifications and evaluation of results.10. Smoothing of design output and/or imposition of constraints on chord, twist, and thickness
distribution (for reduced cost, weight, and ease-of-manufacture). Evaluation of resulting designs anditeration as desired.
Note that steps 1 through 9 above result in the near-optimization of the blade in terms of powerperformance. The items described in step 10 will result in reductions of power performance from thetheoretical optimum. It is at this point that such AEP compromises must evaluated and weighed againstthe benefits of lower cost, weight, ease of manufacture, and other considerations.
All of the design processes outlined above were completed during the ART-2B blade design work andwill be presented herein. The following section provides an example rotor design that illustrates steps 1through 8 above.
4.2 Example Rotor Design
The current example is for near-optimal performance using the S818/825/826 airfoil family at a designTSR = 8. The complete PROPID input file for this design, �18_25_26_01.in,� is provided inAppendix B. Note that �18_25_26_01.in� also contains lines for performing the optimization at otherdesign TSRs, but that those lines are commented out. This same input file was used to complete thedesign TSR sweep presented in Section 6.0 by adding and deleting comment characters to systematicallychange which TSR lines were included in the file.
4.2.1 Assumptions / Constraints
In addition to the constraints given in Section 2.2, the present design example assumes:
• S818 airfoil shape continues all the way to the root.• No restrictions are imposed on allowable chord and twist distributions.• Design TSR = 8.
The selection of design TSR = 8 is somewhat arbitrary. The effect of varying deign TSR will beinvestigated in Section 6.0.

Aerodynamic Design of ART-2B Rotor Blades 22
4.2.2 Target Lift Distributions
Table 2 shows the baseline target CL distribution to achieve maximum L/D at all blade stations. Notethat the left-hand side of the table shows only four stations, at which the airfoils and airfoil properties aredirectly specified in the input file. If the designer specifies intermediate blade stations in the design andanalysis (typical approach), then PROPID will automatically interpolate between the input airfoilproperties to develop the aerodynamic curves for the intermediate stations. However, it is up to thedesigner to specify the target conditions at all stations where inverse design is desired. The right-handside of Table 2, has, therefore, been derived for all 10 blade stations via a linear interpolation of the fourinput stations. The far-right column shows target CL with respect to the value of CL at 75% span (CLw.r.t. 75%R). This data format has been calculated for ease-of-use within the PROPID input filestructure, and it is these relative CL values that appear in the file �18_25_26_01.in.�
Table 2. Baseline Target CL Distribution for S818/825/826 Airfoil Family
Airfoil Family CL Distribution Target CL DistributionStation # Airfoil r/R CL at L/Dmax Station # r/R CL at L/Dmax CL w.r.t. 75%R
1 S818 0.05 1.52 1 0.05 1.52 0.204 S818 0.35 1.52 2 0.15 1.52 0.208 S825 0.75 1.32 3 0.25 1.52 0.20
10 S826 0.95 1.26 4 0.35 1.52 0.205 0.45 1.47 0.156 0.55 1.42 0.107 0.65 1.37 0.058 0.75 1.32 0.009 0.85 1.29 -0.03
10 0.95 1.26 -0.06
The process of shifting and perturbing the target CL distribution is illustrated graphically in Figures 15and 16. As outlined in Section 4.1, the first step in the design process is to perform the CL shifts (as inFigure 15) and evaluate the resulting designs. Once a near-optimum is found, then subtle CLperturbations can be performed (as in Figure 16) and the effect of perturbations on the axial inductionfactor can be investigated.
For the present example, Figure 17 shows the variation of maximum rotor power coefficient due toshifting of the target CL distribution. The highest CPmax occurs with the CL at 75% radius (CL,75%R) equalto 1.15. However, the optimum with respect to this parameter is very flat. Although the CPmax appears tofall off sharply as CL,75%R exceeds 1.20, the entire range of CPmax values in Figure 17 varies by less than1%.
Subsequent to locating the highest CPmax via shifting of the lift distribution, the target CL distribution wasrotated about CL,75%R = 1.15 (as depicted in Figure 16). The target axial induction distribution was alsoperturbed slightly (from the constant value of 0.33) through both shifts and rotations. For this designcase, these rotations and perturbations resulted in either no change or a slight decrease in CPmax. It was,therefore, concluded that for this case the design achieved purely by shifting the target CL distribution isvery near the true optimum.

Aerodynamic Design of ART-2B Rotor Blades 23
1.0
1.1
1.2
1.3
1.4
1.5
0 0.1 0.2 0.3 0.4 0.5 0.6 0.7 0.8 0.9 1
Blade Span (r/R)
Loca
l CL a
t Des
ign
Poin
t
BaselineDistribution
Up / DownShift
Figure 15. Shifting of target CL distribution
1.0
1.1
1.2
1.3
1.4
1.5
0 0.1 0.2 0.3 0.4 0.5 0.6 0.7 0.8 0.9 1
Blade Span (r/R)
Loca
l CL a
t Des
ign
Poin
t
BaselineDistribution
Rotation
Figure 16. Rotation of target CL distribution

Aerodynamic Design of ART-2B Rotor Blades 24
0.500
0.502
0.504
0.506
0.508
0.510
1.00 1.05 1.10 1.15 1.20 1.25 1.30
CL at 75% Spanwise Station
Peak
Rot
or P
ower
Coe
ffici
ent
Figure 17. Variation of CPmax because of shifting of target CL distribution
Comparing the results of Figure 17 with the data in Table 2, it is seen that the best peak CP was obtainedwith a CL distribution significantly lower than the distribution that follows L/Dmax (best CPmax is atCL,75%R = 1.15, whereas the L/Dmax condition occurred for CL,75%R = 1.32). This trend persistedthroughout the ART-2B trade studies; peak power performance was consistently found with liftdistributions lower than those for maximum L/D. This phenomenon has also been observed andinterpreted by Dr. Selig [Ref. 10].
For all of the primary design studies presented in this report, the blade geometry corresponding to thehighest CPmax has been used (CL,75%R = 1.15 in the case of the S818/825/826). However, as the powerperformance optima are very flat, the implications of designing for CL,75%R either below or above peakCPmax are investigated in Section 7.1.
4.2.3 Resulting Blade Design
Figures 18 and 19 show the planform and twist distribution corresponding to the PROPID near-optimumblade design for the S818/825/826 airfoil family at design TSR = 8. As indicated by Figure 17, the peakrotor CP for this design is equal to 0.5080. The calculated system AEP for this design (all wind speedsbelow 12 m/s) is 966 megawatt-hours per year (MWh/y).
Note that the chord and twist values at 5% radial location have not been calculated by PROPID, butremained as the �first guess� in the input file. This is because the ART rotor hub extends to 6.5% R, andthe blade at 5% R is, therefore, not properly included in the blade design. The chord dimension shown inFigure 18 is the actual dimension of the ART hub flange. The twist value shown in Figure 19 is a semi-arbitrary guess and has a negligible effect on the PROPID calculations.

Aerodynamic Design of ART-2B Rotor Blades 25
0
2
4
6
8
0.0 0.1 0.2 0.3 0.4 0.5 0.6 0.7 0.8 0.9 1.0
Radial Location (r/R)
Bla
de C
hord
(m)
Figure 18. PROPID planform for near-optimal rotor (S818/825/826 at design TSR = 8)
-505
1015202530
0.0 0.1 0.2 0.3 0.4 0.5 0.6 0.7 0.8 0.9 1.0
Radial Location (r/R)
Loca
l Tw
ist (
degr
ees)
Figure 19. PROPID twist distribution for near-optimal rotor (S818/825/826 at design TSR = 8)
Figure 18 has been scaled to be nearly proportional (the blade span is approximately 21 m). Carefulinspection of the figure shows that the outboard blade planform is almost, but not quite, linear. Also, forthe inboard blade sections, the chord lengths become quite long and the twist angles are high. Althoughthis geometry is the result of seeking maximum power performance, it is natural to wonder what powerperformance penalty would be paid for modifying these design details. That question is addressed inSection 7.2 of this report.

Aerodynamic Design of ART-2B Rotor Blades 26
4.2.4 Effect of Using Wind tunnel Data for S825
The design for the S818/285/826 blade was used to evaluate the effect of using the recently availablewind tunnel data for the S825 airfoil. Two questions were addressed:
1. What design would result from using the measured S825 aerodynamic properties (along with theEppler properties for the S818 and S826) as PROPID input?
2. What performance is realized if the Eppler aerodynamic properties are used for all three airfoils indetermining the design, and then the measured S825 aerodynamic properties are used in the analysis?
To answer the first question, an input file was developed using the measured S825 data in conjunctionwith the Eppler S818 and S826 properties. The baseline target CL distribution was developed asdescribed in Section 4.2.2 and is shown in Table 3. This target CL distribution was then used to performthe design, shifting the distribution (as indicated in Figure 15 and discussed earlier) and evaluating theresults. Using this approach the near-optimal performance was determined to be at CL,75%R = 0.85 withCPmax = 0.5082.
This power performance is essentially equal to that found for the blade design using the Eppler data asinput for all three airfoils. However, as indicated in Figures 20 and 21, the resulting geometries are veryunusual. The planform has a pronounced local bulge at 75% span, and the twist distribution shows aninflection in that region as well. This can be explained by a review of Section 3.2, which shows that themeasured S825 not only had a lower L/Dmax than was predicted by the Eppler calculations, but that itoccurred at a lower value of CL and a 2° lower AOA.
Therefore, the measured data for the S825 are �mismatched� to the Eppler data for the S826 tip section,and combining the data sets during the design process can result in a blade with theoretically good powerperformance but undesirable physical attributes. Once this mismatch has been recognized, the designercould still use these data sets and work to derive CL distributions that remain close to tracking L/Dmaxwhile avoiding the undesirable inflections in planform and twist distribution.
To answer the second question above, an analysis was performed of the blade shown in Figures 18 and19 (designed by using the Eppler aerodynamic properties for all three airfoils) using the measured S825aerodynamic properties during the analysis. At TSR = 8 (original design value) the CP was 0.5056, orslightly less than 0.5% lower than the near-optimal blade designs. However, the analysis also showedthat the highest CP was 0.5072, occurring at TSR = 9.
Table 3. Baseline Target CL Distribution for S818/825/826 Airfoils using Measured S825 Data
Airfoil Family CL Distribution Target CL DistributionStation # Airfoil r/R CL at L/Dmax Station # r/R CL at L/Dmax CL w.r.t. 75%R
1 S818 0.05 1.52 1 0.05 1.52 0.524 S818 0.35 1.52 2 0.15 1.52 0.528 S825* 0.75 1.00 3 0.25 1.52 0.52
10 S826 0.95 1.26 4 0.35 1.52 0.525 0.45 1.39 0.396 0.55 1.26 0.267 0.65 1.13 0.138 0.75 1.00 0.009 0.85 1.13 0.13
10 0.95 1.26 0.26

Aerodynamic Design of ART-2B Rotor Blades 27
0
2
4
6
8
0.0 0.1 0.2 0.3 0.4 0.5 0.6 0.7 0.8 0.9 1.0
Radial Location (r/R)
Bla
de C
hord
(m)
Eppler S825 Data Measured S825 Data
Figure 20. PROPID planforms for S818/825/826 blade, measured versus Eppler S285 data
-5
0
5
10
15
20
25
30
0.0 0.1 0.2 0.3 0.4 0.5 0.6 0.7 0.8 0.9 1.0
Radial Location (r/R)
Loca
l Tw
ist (
degr
ees)
Eppler S825 Data Measured S825 Data
Figure 21. PROPID twist distributions for S818/825/826 blade, measured versus Eppler S285 data

Aerodynamic Design of ART-2B Rotor Blades 28
5. Evaluation of Candidate Airfoil Families
In this section, a comparison is made between near-optimal designs for the candidate airfoil families. Thedesign for the S818/825/826 blade was described in detail in Section 4.2. A similar process was followedfor the S818/827/828 and S815/809/810 families, with the input data and results summarized below.
5.1 Assumptions / Constraints
In addition to the constraints given in Section 2.2, the evaluation of candidate airfoil families assumes:• The 35% R airfoil shapes continue all the way to the root.• No restrictions are imposed on allowable chord and twist distributions.• Design TSR = 8.
5.2 Target Lift Distributions
The target lift distributions for the S818/827/828 and S815/809/810 families are shown in Tables 4 and 5,respectively. Near-optimal rotor designs were obtained with PROPID, shifting these distributions asdescribed in Section 4.2.2 and evaluating the resulting designs for power performance and CPmax.
Table 4. Baseline Target CL Distribution for S818/827/828 Airfoil Family Airfoil Family CL Distribution Target CL DistributionStation # Airfoil r/R CL at L/Dmax Station # r/R CL at L/Dmax CL w.r.t. 75%R
1 S818 0.05 1.52 1 0.05 1.52 0.664 S818 0.35 1.52 2 0.15 1.52 0.668 S827 0.75 0.86 3 0.25 1.52 0.66
10 S828 0.95 0.84 4 0.35 1.52 0.665 0.45 1.36 0.506 0.55 1.19 0.337 0.65 1.03 0.178 0.75 0.86 0.009 0.85 0.85 -0.01
10 0.95 0.84 -0.02
Table 5. Baseline Target CL Distribution for S815/809/810 Airfoil Family Airfoil Family CL Distribution Target CL DistributionStation # Airfoil r/R CL at L/Dmax Station # r/R CL at L/Dmax CL w.r.t. 75%R
1 S815 0.05 1.21 1 0.05 1.21 0.484 S815 0.35 1.21 2 0.15 1.21 0.488 S809 0.75 0.73 3 0.25 1.21 0.48
10 S810 0.95 0.73 4 0.35 1.21 0.485 0.45 1.09 0.366 0.55 0.97 0.247 0.65 0.85 0.128 0.75 0.73 0.009 0.85 0.73 0.00
10 0.95 0.73 0.00

Aerodynamic Design of ART-2B Rotor Blades 29
5.3 Summary of Airfoil Family Results
Table 6 provides a summary of the PROPID results for the candidate airfoil families. For completeness,the design Reynolds number, L/Dmax, and thickness of each airfoil is also given. The values of CL,75%Rthat correspond to the maximum power performance designs are also indicated. Comparison with thebaseline CL distributions of Tables 4 and 5 show that the CL,75%R values for optimal performance arelower than L/Dmax.
Table 6. Near-Optimal Rotor Designs for Candidate Airfoil Families
AirfoilFamily
Design Re(millions)
MaximumL/D
Thicknesst/cmax (%)
CL,75%
R
AEP*
(MWh/y)
CPmax
RFBmax(kN-m)
S818/825/826 2.5 / 2.0 /1.5
115 / 125 /142
24 / 17 / 14 1.15 966 0.5080 1,260
S818/827/828 2.5 / 4.0 /3.0
115 / 154 /170
24 / 21 / 16 0.75 967 0.5106 1,550
S815/809/810 1.2 / 2.0 /2.0
104 / 103 /132
26 / 21 / 18 0.65 954 0.5023 1,840
*System AEP calculated for wind speeds ≤ 12 m/s
The S818/827/827 blade has the best power performance, with the S818/825/826 and S815/809/810blades achieving peak CP values that are 0.5% and 1.6% lower, respectively. This trend would beexpected by inspection of the L/Dmax values for each family. Table 6 also lists the maximum root-flapbending (RFBmax) for each blade design. These have been calculated for a 50-year gust using the methodand assumptions described in Section 2.4. The table shows that the RFBmax for the S818/827/828 andS815/809/810 blades are 23% and 43% higher, respectively than the S818/825/826 blade.
Figure 22 shows the planforms corresponding to the near-optimal design for each airfoil family. Both ofthe families with low CL have significantly longer chords than the S818/825/826 blade, accounting forthe higher values of calculated RFBmax. Also, these blades show a more pronounced non-linear bulgingof the planform near 75% span than the S818/825/826 blade, and would likely require more smoothing(and associated performance losses) prior to developing a final design.
Before proceeding, it should be noted that the comparisons of RFBmax contained in this report are basedon the assumption that the maximum flap bending occurs as the result of a drag-based load case (i.e.,extreme wind with blade pitched to the full power production position). However, the actual peak flapbending load is dependent on many factors, including the turbine architecture, control system andassumed fault cases. For instance, for a rotor with full-span pitch control, the blades may be assumed tobe in fully-feathered position during a 50-year gust. In that case, the peak flap bending would bedominated by aerodynamic lift, and for the blade designs under consideration there would be offsettingeffects between increased planform and the corresponding lower values of lift.

Aerodynamic Design of ART-2B Rotor Blades 30
0
2
4
6
8
0.0 0.1 0.2 0.3 0.4 0.5 0.6 0.7 0.8 0.9 1.0
Radial Location (r/R)
Bla
de C
hord
(m)
S818/825/826 S818/827/828 S815/809/810
Figure 22. PROPID near-optimal planforms for candidate airfoil families
Figure 23 shows the calculated thrust versus power for each of the candidate airfoil families, whichshows virtually no variation. This is because the blades with larger chords dimensions are operating atlower CL, and the net resultant forces are nearly the same for each design. Based on this result it isexpected that the steady aerodynamic component of the operating root-flap-bending moment would alsobe the same for each design, although the inertial and dynamic components would vary according to thediffering blade structures.
Figure 24 shows the CP-TSR curves for each airfoil family. It is evident that the peak CP occurs at thedesign TSR of 8, and that all three blade designs are relatively insensitive to off-design operation in therange of TSR = 7−9. The S818/825/826 performance falls off more rapidly than the other two families atvery high tip-speed ratios. As fixed-speed operation involves high tip speeds at low-to-moderate windspeeds, the S818/825/826 blade would have the poorest fixed-speed performance of the three designsconsidered.

Aerodynamic Design of ART-2B Rotor Blades 31
0.0
10.0
20.0
30.0
40.0
50.0
60.0
70.0
80.0
90.0
100.0
0.0 100.0 200.0 300.0 400.0 500.0 600.0 700.0
Rotor Power (kW)
Rot
or T
hrus
t (kN
)
S818/825/826 S818/827/828 S815/809/810
Figure 23. Calculated thrust versus power for candidate airfoil families
0.0
0.1
0.2
0.3
0.4
0.5
2 4 6 8 10 12 14 16
Tip Speed Ratio
Rot
or P
ower
Coe
ffici
ent
S818/825/826 S818/827/828 S815/809/810
Figure 24. CP � TSR curves for candidate airfoil families

Aerodynamic Design of ART-2B Rotor Blades 32
Table 7 summarizes the advantages and disadvantages for each of the candidate airfoil families. For thepurposes of the remaining ART-2B blade design studies, the S818/825/826 airfoil family was selected.
Table 7. Summary of Rotor Designs for Candidate Airfoil Families
AirfoilFamily Advantages Disadvantages
S818/825/826 • Good peak CP• S825 tested at LTPT to high
confidence• Smallest chord dimensions• Planform nearest to linear; would
require the least smoothing
• Relatively thin sections would posestructural challenges
• Lower energy capture for fixed-speedoperation
• High CLmax tip section not suitable forpitch-to-stall power control
S818/827/828 • Best peak CP• S827 tested at LTPT to high
confidence• Good fixed-speed energy capture• Good structural shapes
• Could be �too laminar;� LTPT datashowed high soiling losses
• Variable-speed operation would bebelow design Re at low wind speeds
• Large chord / peak bending loads• Optimal planform has substantial non-
linear bulge; would require significantsmoothing
• LTPT data showed high CLmax; notsuitable for pitch-to-stall power control
S815/809/810 • Likely benign for stall power control• Good fixed-speed energy capture• Primary airfoil (S809) tested at Delft;
other airfoils tested in multipletunnels
• Best structural shapes
• Lowest peak CP• Largest chord / peak bending loads• Optimal planform has substantial non-
linear bulge; would require significantsmoothing

Aerodynamic Design of ART-2B Rotor Blades 33
6. Sweep of Design TSR for Blade Using S818/825/826 Airfoils
A sweep of design tip-speed ratios was performed for blades using the S818/825/826 airfoil family. Aswith the previous design studies, no restriction was placed on the allowable chord and twist distributions,and the inboard airfoil (S818) shape was assumed to continue all the way to the root. It was determinedthat CL,75%R = 1.15 resulted in the highest CPmax for all design TSRs considered, so that value was used forthe designs shown.
Table 8 shows the summary results for the TSR sweep. The peak power performance is found at a designTSR = 9, with the peak CP about 0.3% higher than at design TSR = 8 and a slow decline in powerperformance for TSR above 9. The power performance falls off more rapidly at lower design TSRs.Table 8 also shows the chord length at 75% span and the calculated peak (50-year) root flap bending foreach near-optimal design. As expected, the blades become more slender and RFBmax decreases as designTSR is increased. This trend is more pronounced below TSR = 8, and the incremental changes diminishat high design TSR.
Table 8. Summary Results for Study of Design TSR, S818/825/826 BladesDesignTSR
AEP*
(MWh/y)∆∆∆∆AEP w.r.t.TSR=8 (%) CPmax
∆∆∆∆CPmax w.r.t.TSR=8 (%)
Chord at 75%R (cm)
RFBmax(kN-m)
∆∆∆∆RFBmax w.r.t.TSR=8 (%)
6 947 -1.97 0.4988 -1.81 179.2 2,095 +657 959 -0.73 0.5048 -0.62 134.4 1,609 +278 966 � 0.5080 � 104.2 1,270 �9 970 +0.41 0.5094 +0.28 83.2 1,029 -19
10 970 +0.41 0.5093 +0.26 67.7 850 -3311 968 +0.21 0.5081 +0.02 56.1 715 -44
*System AEP calculated for wind speeds ≤ 12 m/s
Figure 26 shows the operating rotor thrust versus power for the range of tip-speed ratios considered. Thethrust versus power curves show very little variation with design TSR, with the increase in blade speed athigh TSR designs being nearly offset by the corresponding decrease in rotor solidity. Again, it should benoted that the result of Figure 25 is for the steady aerodynamic component of thrust, and that non-steadythrust variations due to blade-turbine dynamic interaction and response to turbulent inflow could show astronger dependence on the blade designs considered.
Figure 26 shows the variable-speed rpm schedule required to track peak CP for each TSR. Each curveassumes that peak CP is tracked up to rated power and that active (pitch) power control is implementedfor all wind speeds above rated. The figure shows that for design TSR ≥ 8, tracking peak CP up to ratedimplies exceedance of the baseline ART-1 rotor speed (42 rpm). Alternately, rotors with design TSR ≥ 8could be controlled to track peak CP up to a selected maximum rotor speed and operate at less than peakCP between that point and rated power. Inspection of Figure 26 shows that the power performancepenalty for limiting rotor speed to 42 rpm would be minimal for design TSR = 8 and increase for higherdesign tip-speed ratios.

Aerodynamic Design of ART-2B Rotor Blades 34
0.0
10.0
20.0
30.0
40.0
50.0
60.0
70.0
80.0
90.0
100.0
0.0 100.0 200.0 300.0 400.0 500.0 600.0 700.0
Rotor Power (kW)
Rot
or T
hrus
t (kN
)
TSR=6 TSR=7 TSR=8 TSR=9 TSR=10 TSR=11
Figure 25. Thrust versus power for S818/825/826 blades at varying design TSR
0.0
10.0
20.0
30.0
40.0
50.0
60.0
0.00 5.00 10.00 15.00 20.00
Wind Speed (m/s)
Rot
or S
peed
(rpm
)
Increasing design TSR:6, 7, 8, 9, 10, 11
S818/825/826 airfoil family.Assumes blade pitch power control at rated power.
Figure 26. RPM Schedule for optimal VS operation at varying design TSR

Aerodynamic Design of ART-2B Rotor Blades 35
Figure 27 shows CP-TSR curves for near-optimal S818/825/826 rotors designed for TSR of 7 and 8. Therotor designed for TSR = 7 shows a greater penalty in CP for operating at TSRs below the design pointthan does the TSR = 8 rotor. The sensitivity of CP to operating at TSRs above the design values isroughly the same for both rotors. Figure 28 shows the near-optimal planforms for TSR = 7 and 8. Inaddition to the longer chord lengths, the TSR = 7 blade is lightly more non-linear in the tip region thanthe TSR = 8 blade.
0.0
0.1
0.2
0.3
0.4
0.5
2 4 6 8 10 12 14 16
Tip-Speed Ratio
Rot
or P
ower
Coe
ffici
ent
TSR = 7 TSR = 8
Figure 27. CP-TSR curves for near-optimal S818/825/826 blades
0
2
4
6
8
0.0 0.1 0.2 0.3 0.4 0.5 0.6 0.7 0.8 0.9 1.0
Radial Location (r/R)
Bla
de C
hord
(m)
Design TSR = 7 Design TSR = 8
Figure 28. Planforms for near-optimal S818/825/826 blades

Aerodynamic Design of ART-2B Rotor Blades 36
7. Detailed Aerodynamic Design
The designs of the previous sections have used fairly ideal inputs with minimal constraints on theresulting designs. While this approach is suitable for trade-off and sensitivity studies, additional detailsand constraints must be considered during detailed aerodynamic design. The following sections presentsome aspects of the detailed design for a blade using the S818/825/826 airfoil family at design TSR = 8.
7.1 Effect of Varying Lift Distributions
As shown in Section 4.2.2, the power performance optimum with respect to CL,75%R can be very flat. Thedesigner may, therefore, consider the implications of designing for a CL,75%R that varies from the peakCPmax value. Table 9 presents a summary of the CL,75%R effects on power performance, planform, and theassociated peak root flap bending. As seen in the table, within the range of 1.05 to 1.25, the effect ofCL,75%R on power performance is essentially negligible. Blades designed for higher CL have a moreslender planform and lower peak bending loads, roughly 4%−5% decrease per 0.05 of lift coefficient. Aswas seen in earlier design studies, the steady rotor thrust/power is invariant with CL,75%R, with theincrease in local lift offset by the smaller chord (result not shown).
Table 9. Summary Effects of Varying CL,75%R for S818/825/826 Blade at Design TSR =8
CL,75%RAEP*
(MWh/y)∆∆∆∆AEP w.r.t.TSR=8 (%) CPmax
∆∆∆∆CPmax w.r.t.CL,75%R = 1.15
Chord at 75%R (cm)
RFBmax(kN-m)
∆∆∆∆RFBmax w.r.t.CL,75%R = 1.15
1.05 966 0 0.5074 -0.12% 114.3 1,381 +8.7%1.10 966 0 0.5079 -0.02% 109.1 1,323 +4.2%1.15 966 � 0.5080 � 104.2 1,270 �1.20 965 +0.10 0.5076 -0.08% 100.0 1,221 -3.8%1.25 962 +0.42 0.5063 -0.33% 96.0 1,176 -7.2%1.30 956 +1.01 0.5040 -0.79% 92.3 1,126 -11.3%
* System AEP calculated for wind speeds ≤ 12 m/s
Figure 29 shows CP-TSR curves for CL,75%R values ranging from 1.1 to 1.3. As seen in the figure, the CPcurves become more narrow with increased CL,75%R. Thus, designing for a high lift distribution can resultin a more slender blade with a minimal penalty in peak power performance, but the resulting rotor maybe more sensitive to off-design operation.

Aerodynamic Design of ART-2B Rotor Blades 37
0.0
0.1
0.2
0.3
0.4
0.5
2 4 6 8 10 12 14 16
Tip-Speed Ratio
Rot
or P
ower
Coe
ffici
ent
CL (75%R) = 1.1 CL (75%R) = 1.2 CL (75%R) = 1.3
Figure 29. Effect of varying CL,75%R on CP-TSR curve
7.2 Performance Losses Due to Imposed Design Details
The previous design studies have all assumed a lifting airfoil shape extended all the way to the blade rootand have had no restrictions imposed on the allowable chord and twist distributions. However, forconsiderations of cost, weight, and/or structural efficiency, it is usual for the designer to impose someconstraints on these items. Common constraints and imposed design features include a transition to anon-lifting root section (i.e., circular root), imposed linear taper of planform, and constrained twistschedule.
Figures 30 and 31 show the planform and twist distribution, respectively, for the near-optimal blade asdetermined by PROPID for the S818/825/826 airfoil family at design TSR = 8. The figures also show animposed linear taper and a truncated twist schedule that have been used for analysis and an evaluation ofthe resulting loss in power performance. The taper shown in Figure 30 was developed by trial-and-errorto find a linear fit to the original PROPID planform that resulted in minimal loss of power performance.The truncated twist schedule of Figure 31 is an arbitrary deviation from the twist calculated by PROPID.

Aerodynamic Design of ART-2B Rotor Blades 38
0
2
4
6
8
0.0 0.1 0.2 0.3 0.4 0.5 0.6 0.7 0.8 0.9 1.0
Radial Location (r/R)
Bla
de C
hord
(m)
PROPID Near-Optimal Planform Imposed Linear Taper
Figure 30. Imposed linear taper for S818/825/826 blade
-5
0
5
10
15
20
25
30
0.0 0.1 0.2 0.3 0.4 0.5 0.6 0.7 0.8 0.9 1.0
Radial Location (r/R)
Loca
l Tw
ist (
degr
ees)
PROPID Near-Optimal Twist Schedule Truncated Twist Schedule
Figure 31. Truncated twist schedule for S818/825/826 blade
Table 10 summarizes the effects on power performance of the imposed linear planform and truncatedtwist schedule shown in Figures 30 and 31, as well as the effect of including the transition to a non-liftingroot in the analysis. Note that each intermediate entry in Table 10 considers the isolated effect of asingle design detail, and the final entry is the cumulative effect of all three details. The effect ofincluding a non-lifting root in the analysis is seen to be negligible, and the effect of truncating the twistschedule is also small. The effect of imposing a linear taper, however, is a non-trivial 1.3% loss inperformance. An analysis of this loss was performed, and it was determined that although the changesappear very subtle in Figure 30, over half of the performance loss (0.7%) was due to the altered chordsoutboard of 75% span. This underscores the importance this region, and the care that must be given todesign details near the blade tip. Note also that all of the AEP sensitivities shown above were calculatedfor wind speeds ≤ 12 m/s, and the incremental effects would be smaller if calculated over a full range ofoperational wind speeds.

Aerodynamic Design of ART-2B Rotor Blades 39
Table 10. Effect of Design Details on S818/825/826 BladeCase AEP* (MWh/y) CPmax ∆∆∆∆CPmax (%)
Baseline 966.3 0.5080 �Linear planform 953.7 0.5013 -1.32Truncated twist 963.7 0.5067 -0.26Non-lifting root 965.5 0.5076 -0.08All details above 951.9 0.5007 -1.44
*AEP calculated for wind speeds ≤ 12 m/s
7.3 Comparison of Power Performance with ART-1 and ART-2A Rotors
Table 11 gives a tabular description of the S818/825/826 blade geometry with the design details (lineartaper and truncated twist distribution) as indicated in Figures 30 and 31. An analysis of this blade hasbeen used to compare with the calculated power performance of the ART-1 and ART-2A rotors. TheAEP calculations for these comparisons are shown in Table 12. Because the calculated ART-1 powercurve does not reach rated power until 13.5 m/s (due to the lower efficiency of the airfoils), all thecomparative AEP calculations have been made inclusive of this wind speed. Note also that the rotorpower curves (rather than the system power) have been used in the AEP comparisons of this section.
Table 11. Blade Geometry for S818/825/826 with Aerodynamic Design Details
Station(r/R) Section Shape Radial
Location (m)Chord
Length (m)Twist
(degrees)0.065 WWG-600 root 1.38 1.143 12.000.15 Transition to S818 3.20 3.139 12.000.25 Transition to S818 5.33 2.374 7.000.35 S818 7.47 1.819 3.750.45 Hybrid S818 / S825 9.60 1.515 1.860.55 Hybrid S818 / S825 11.73 1.309 0.830.65 Hybrid S818 / S825 13.87 1.160 0.270.75 S825 16.00 1.044 0.000.85 Hybrid S825 / S826 18.14 0.909 -0.280.95 S826 20.27 0.665 -0.401.00 S826 21.34 0.543 -0.46

Aerodynamic Design of ART-2B Rotor Blades 40
Table 12. AEP Calculations for ART Rotor Power CurvesWS Hours ART-1 ART-2A ART-2B (variable speed) ART-2B (fixed-speed oper.)Bin Per PRotor ERotor PRotor ERotor Var. PRotor ERotor Var. PRotor ERotor Var.
(m/s) Year (kW) (kWh) (kW) (kWh) (%) (kW) (kWh) (%) (kW) (kWh) (%)3.0 386.5 0.0 0 8.5 3,287 N/A 10.0 3,864 N/A 0.0 0 N/A3.5 407.0 0.0 0 13.5 5,496 N/A 15.8 6,433 N/A 0.0 0 N/A4.0 420.0 0.0 0 20.2 8,465 N/A 23.5 9,877 N/A 0.0 0 N/A4.5 426.1 0.0 0 28.7 12,229 N/A 33.5 14,294 N/A 0.0 0 N/A5.0 426.2 0.0 0 39.4 16,780 N/A 46.2 19,677 N/A 0.0 0 N/A5.5 421.1 7.6 3,185 52.4 22,066 592.8 61.5 25,919 713.8 3.9 1,661 -47.86.0 411.5 27.3 11,238 68.0 27,994 149.1 80.0 32,909 192.8 24.6 10,106 -10.16.5 398.1 49.8 19,818 86.5 34,436 73.8 101.7 40,491 104.3 48.6 19,369 -2.37.0 381.7 75.2 28,690 108.0 41,237 43.7 127.0 48,478 69.0 76.8 29,330 2.27.5 362.9 104.3 37,835 132.9 48,221 27.5 156.1 56,664 49.8 109.8 39,856 5.38.0 342.4 137.0 46,919 161.3 55,205 17.7 189.4 64,836 38.2 148.3 50,772 8.28.5 320.6 173.9 55,753 193.4 62,004 11.2 227.1 72,794 30.6 192.4 61,670 10.69.0 298.1 215.2 64,139 229.6 68,441 6.7 269.8 80,429 25.4 241.6 72,004 12.39.5 275.4 260.9 71,845 270.0 74,353 3.5 317.4 87,408 21.7 296.3 81,575 13.5
10.0 252.7 309.6 78,253 314.9 79,600 1.7 370.3 93,580 19.6 356.5 90,096 15.110.5 230.6 360.2 83,065 364.6 84,067 1.2 428.5 98,810 19.0 421.5 97,189 17.011.0 209.1 413.3 86,428 419.2 87,666 1.4 492.5 102,996 19.2 490.9 102,672 18.811.5 188.6 466.9 88,054 476.1 89,797 2.0 562.5 106,094 20.5 563.0 106,180 20.612.0 169.2 522.5 88,387 535.6 90,602 2.5 638.9 108,076 22.3 636.1 107,608 21.712.5 150.9 580.6 87,621 597.9 90,246 3.0 666.4 100,573 14.8 666.3 100,555 14.813.0 134.0 641.3 85,907 667.0 89,349 4.0 667.0 89,349 4.0 667.0 89,349 4.013.5 118.3 667.0 78,904 667.0 78,904 0.0 667.0 78,904 0.0 667.0 78,904 0.0
AEP Total (MWh): 1,016 1,170 1,342 1,139
Var. from ART-1 (%): 15.2 32.1 12.1
The calculated power curves for the ART-1, ART-2A (ART-1 with variable-speed operation) andART-2B rotors are shown in Figure 32. For the ART-2A turbine, variable speed operation results in anincrease of power output at low wind speeds, but at moderate-to-high wind speeds the ART-2A andART-1 power curves converge. As a result, the annual energy for ART-2A exceeds the ART-1 by15.2%. The ART-2B power output exceeds ART-1 at all wind speeds, with a resulting AEP increase of32.1%.
Figure 33 shows a comparison of the calculated ART-1 power curve with the ART-2B blades operated ata fixed speed of 42 rpm. Near cut-in, the ART-2B rotor at fixed speed produces slightly less power thanthe baseline ART-1 rotor, but at moderate-to-high wind speeds the ART-2B blade significantlyoutperforms the ART-1. The net result is a 12.1% increase over the baseline rotor.
It should be noted that the AEP gains due to variable-speed operation have been calculated on the basisof increased rotor power. The increments in system AEP would be dependent on the relative efficienciesof the variable-speed and fixed-speed drive trains under consideration and could, in principle, be eitherhigher or lower than the values presented herein.

Aerodynamic Design of ART-2B Rotor Blades 41
0.0
100.0
200.0
300.0
400.0
500.0
600.0
700.0
0.0 5.0 10.0 15.0 20.0
Wind Speed (m/s)
Rot
or P
ower
(kW
)
Baseline ART-1 ART-2A (VS ART-1) ART-2B
PROP - calculated powerAir density = 1.03 kg/m3
Figure 32. Calculated ART power curves
0.0
100.0
200.0
300.0
400.0
500.0
600.0
700.0
0.0 5.0 10.0 15.0 20.0
Wind Speed (m/s)
Rot
or P
ower
(kW
)
Baseline ART-1 ART-2B Blade w/ Fixed-Speed Operation
PROP - calculated powerAir density = 1.03 kg/m3
Figure 33. ART-2B rotor at fixed-speed operation

Aerodynamic Design of ART-2B Rotor Blades 42
8. Conclusions
In support of the ongoing research efforts of the NREL Advanced Research Program, an aerodynamicdesign has been performed for the ART-2B rotor blades. The ART-2B blade was designed to reflect thestate-of-the-art in aerodynamic performance. As such, the aerodynamic design objectives were givenfirst priority in this process, with structural design aspects considered as secondary.
The aerodynamic designs for the ART-2B rotor blades were performed for optimal variable-speed,variable-pitch operation with peak rotor power coefficients as high as possible. Studies were performedto investigate various airfoil families, design tip-speed ratios, and other design considerations.Specifically, the design studies included:• An evaluation of three NREL S-series airfoil families
− S818/825/826− S818/827/828− S815/809/810.
• For the S818/825/826 airfoil family, a sweep of design tip-speed ratios was conducted.• For the S818/825/826 airfoil family at design TSR = 8, detailed aerodynamic design aspects were
considered, including an evaluation of performance losses due to imposed design details.
For each airfoil design considered, a near-optimal blade geometry was determined, with calculatedannual energy production used as the primary figure of merit.
A final detailed design is presented, using the S818/825/826 airfoil family at a design TSR of 8, andincluding an imposed linearly-tapering planform and a truncated twist distribution. This final design wasevaluated for power performance and compared with other ART turbines. For wind speeds less than orequal to 13.5 m/s, the calculated AEP for the ART-2B rotor exceeds the baseline ART-1 turbine by 32.1%.
Structural efficiency (strength, cost, and weight) have been addressed qualitatively through considerationof the resulting blade dimensions. For selected cases, the effect of design variations on operating rotorthrust and peak (50-year) blade bending loads has been evaluated. For the designs under consideration,the rotor power per unit thrust was found to be largely invariant. However, the designs showedsignificant variations in rotor solidity and the associated peak bending loads (as based on a drag-dominated load case).
The �final� S818/825/826 rotor presented herein is the result of an aerodynamic design process withlimited structural considerations. The next steps in a detailed design process would include:• Consideration of cost of energy implications for both candidate rotor geometries and net energy
capture (i.e., efficiency) for variable-speed operation• Preliminary structural design
− selection of materials, basic internal structure, and shell design− preliminary development of basic shell thickness distribution, calculations of weight, and stiffness
• Additional smoothing of geometry− chord, twist, thickness, and airfoil blending along blade− evaluation of derivatives to eliminated discontinuities− analysis of resulting geometries for power performance, iteration as desired
• Detailed structural design, root design, lay-up schedule, ply drops, and other details.

Aerodynamic Design of ART-2B Rotor Blades 43
9. References
1. Tangler, J.L.; Somers, D.M. (1995). �NREL Airfoil Families for HAWTs�. Presented at theAmerican Wind Energy Association Windpower �95 Conference.
2. Eppler, R.; Somers, D.M. (1980). A Computer Program for the Design and Analysis of Low-SpeedAirfoils. NASA TM-80210. National Aeronautics and Space Administration.
3. Somers, D.M. (January 1997). Design and Experimental Results for the S809 Airfoil. NREL/SR-440-6918.Golden, CO: National Renewable Energy Laboratory.
4. Somers, D.M.; Tangler, J.L. (2000). �Wind Tunnel Tests for Two Airfoils for Wind TurbinesOperating at High Reynolds Numbers�, Presented at the AIAA Wind Energy Meeting, NREL/CP-500-27891.
5. Selig, M.S.; Tangler, J.L. (1994) �A Multipoint Inverse Design Method for Horizontal Axis WindTurbines�, Presented at the AWEA Windpower �94 Conference. NREL/CP-500-16336. Golden,Co: National Renewable Energy Laboratory.
6. International Electrotechnical Commission. (1998). Wind Turbine Generator Systems: PowerPerformance Measurement Techniques. International Standard 1400-12.
7. International Electrotechnical Commission. (1999). IEC 61400-1: Wind turbine generator systems� Part 1: Safety Requirements, 2nd Edition. International Standard 1400-1.
8. Somers, D.M. (January 1999). Design and Experimental Results for the S814 Airfoil, NREL/SR-440-6918. Golden, CO: National Renewable Energy Laboratory.
9. Giguere. P. (August 1999) PROPID seminar. National Wind Technology Center, Golden, CO.
10. Giguere, P.; Selig, M.S. (1996) �Desirable Airfoil Characteristics for Large Variable-SpeedHorizontal Axis Wind Turbines�. Presented at the AWEA Windpower �96 Conference. NREL/CP-500-22297. Golden, CO: National Renewable Energy Laboratory.

Aerodynamic Design of ART-2B Rotor Blades
Appendix A
Summary of Archived Electronic Files

Aerodynamic Design of ART-2B Rotor Blades A-1
The primary electronic files used for this design study have been archived and written to a compact disc(CD) titled �ART2B Blade.� This CD contains an electronic version of the present report, allspreadsheet files that were used to generate the figures contained in the report, an executable copy of thePROPID code used for the design studies, and an archive of the major input and output files. ThePROPID output files all have two varying digits prior to the �.dat� extension. These digits follow theoutput file naming convention of PROPID, as indicated in Table A-1. Note that not all files shown inTable A-1 were written as output and/or saved for each design case (input file) run. Also note thatalthough scientific units have been exclusively used in the body of this report, the PROPID calculations(and the output files) have used units of feet, pounds, and miles per hour, respectively, for length, force,and wind speeds. Table A-2 provides a description of the CD directory structure, file naming conventionsand information contained within.
Table A-1. Naming Convention for PROPID Output FilesPROPID Output File
Number�_____##.dat�
Data Contained
21 PROPID �dump� file containing converged blade design for run(chord, twist, pitch, airfoils, design point used)
39 rpm versus wind speed (mph) for variable speed operation40 Rotor power (kW) versus wind speed (mph) for variable speed
operation45 Rotor power coefficient (Cp) versus tip-speed ratio50 Rotor thrust coefficient at varying TSR51 Rotor thrust (pounds) versus wind speed (mph) variable speed
operation95 Local blade chord (feet) versus radius (feet)99 Local blade twist (degrees) versus radius (feet)

Aerodynamic Design of ART-2B Rotor Blades A-2
Table A-2. Archive of Blade Design Study Electronic Media (page 1 of 2)Sub-Directory Filenames Content
(none) ART-2B Blade Design Final.doc Electronic version of current report � ART-2B propid blade results.xls Spreadsheet containing PROPID design and analysis data, charts for reporting � AEP 1.xls Calculation of hours for Wiebull wind distribution, used for final AEP calculation � sfoils 1.xls Spreadsheet containing profiles and aerodynamic properties of S-series airfoils � Cl dist example.xls Spreadsheet containing example of shifting / rotation for target CL distributions � propid34.exe Executable version of PROPID code used in design studies
aerodata intuitive Files containing aerodynamic properties of airfoils, to be read by PROPID
S815_809_810 15_09_10_01.in Input file for near-optimal design of S815/809/810 blade at TSRdesign = 8, used toshift CL,75%R and evaluate results
� f590_##.dat Output files for design of S815/809/810 blade with CL,75%R = 0.65. The digits inthe ## place indicating the content of the output file as indicated on previous page
S818_825_826 18_25_26_01.in Input file for near-optimal design of S818/825/826 blade at TSRdesign = 8, used toshift CL,75%R and evaluate results
� 18_25_26_07.in Input file for near-optimal design of S818/825/826 blade, used to rotate liftdistribution clockwise with respect to CL,75%R = 1.15 and evaluate results
� 18_25_26_08.in Input file for near-optimal design of S818/825/826 blade, used to rotate liftdistribution counter-clockwise with respect to CL,75%R =1.15 and evaluate results
� f856_##_##.dat Output files for design of S818/825/826 blade at varying CL,75%R. The last twovarying digits in the filenames indicate the content of the output file as describedon previous page. The first two varying digits indicate the value used for CL,75%Ras follows:
Output file number f856_## CL,75%R01 1.3002 1.2503 1.2004 1.1505 1.1006 1.05

Aerodynamic Design of ART-2B Rotor Blades A-3
Table A-2. Archive of Blade Design Study Electronic Media (page 2 of 2)Sub-Directory Filenames Content
S818_827_828 18_27_28_01.in Input file for near-optimal design of S818/827/828 blade at TSRdesign = 8, used toshift CL,75%R and evaluate results
F878_##.dat Output files for design of S818/827/828 blade with CL,75%R = 0.75 (The digits inthe ## place indicating the content of the output file as indicated on previouspage.)
Smooth 818_825_826 Smooth_856_##.in Input files for investigation of design details on S818/825/826 blade. Varyingdigits in input files denote the parameters changed as follows:
Input file number smooth_856_## Parameter Changed01 Baseline blade02 Linear planform03 Truncated twist04 Non-lifting root05 All details above06 Same, with analysis at fixed speed
� Smooth_856_##_##.dat Output files for investigation of design details on S818/825/826 blade. Firstvarying digits denote the parameters under consideration as shown in the tableabove (files only saved for 05 and 06). Last two varying digits denote informationcontained in each file.
TSR_818_825_826 18_25_26_TSR##.in Input file for investigation of S818/825/826 blades designed with CL,75%R = 1.15and varying design TSR. Last two (varying) digits denote the TSRdesign
� tsr##_##.dat Output files for above investigation of design TSR First two varying digits denotethe design TSR, and the last two denote the output content
Wind Tunnel S825 wind_tunnel_dsgn_856.in Input file for near-optimal design of S818/825/826 blade at TSRdesign = 8, usingwind tunnel measured data for the S825 airfoil and Eppler data for the 818 and 826
� wind_tunnel_desgn_##.dat Output files for above case, ## denotes data contained in file � wind_tunnel_anal_856.in Input file for analysis of S818/825/826 blade where measured S825 data is used in
analysis, but design was completed using Eppler data for all three airfoils � wind_tunnel_anal_##.dat Output files for above case, ## denotes data contained in file

Aerodynamic Design of ART-2B Rotor Blades
Appendix B
Example PROPID Input File for Rotor Design

Aerodynamic Design of ART-2B Rotor Blades B-1
# ART blade design input file �18_25_26_01.in�
MODE 1.0 # wind turbineLTIP 1.0 # tip loss modelLHUB 1.0 # tip loss modelIBR 1.0 # brake state modelISTL 1.0 # viterna stall modelUSEAP 1.0 # swiral suppressionWEXP 0.0000 # no boundary layerHH 3.333 # tower heightNS_NSEC 10.0 1.0 # number of blade elements/number of sectorsIS1 1.0 # first segment used in analysisIS2 10.0 # last segment used in analysisBE_DATA 0.0 # printout blade element dataINCV 0.0 # use TSRSH 0.0 # shaft tilt effects on crossflowBN 2.0 # blade numberCONE 0.0 # cone angle of rotor
# 1.03 kg/m^3RHO 0.0020000
# hub radius 4.53 ftHUB 0.065RD 70
CH_TW 0.040000 25.4000 0.152545 20.1368 0.124516 13.6008 0.098460 8.7735 0.081798 5.8202 0.070218 3.6790 0.061386 1.8103 0.054686 0.0000 0.049049 -0.6629 0.044548 -1.1005
#CORRIGAN_EXPN 1#DU_MODEL 1 1 1 22.5
# Available airfoil Files:# aerodata/s814_fl4.pd # aerodata/s815_fl4.pd # aerodata/s818_fl4.pd# .24 10. 5 1.34 6 # .26 10. 5 1.35 6 # .24 11. 5 1.60 6# aerodata/s809_fl4.pd # aerodata/s810_fl4.pd# .21 10. 1 1.00 1.5 # .18 8. .5 0.95 6# aerodata/s825_fl4.pd # aerodata/s826_fl4.pd# .17 11. 1 1.50 1.5 # .14 11. .5 1.60 6# aerodata/s827_fl4.pd # aerodata/s828_fl4.pd# .21 8. 1 1.00 1.5 # .16 8. .5 0.91 6

Aerodynamic Design of ART-2B Rotor Blades B-2
AIRFOIL_MODE 44aerodata/s818_fl4.pd.24 11. 5 1.60 6aerodata/s818_fl4.pd.24 11. 5 1.60 6aerodata/s825_fl4.pd.17 11. 1 1.50 1.5aerodata/s826_fl4.pd.14 11. .5 1.60 6
# airfoil family 1, 4 nodesAIRFOIL_FAMILY 4.0000 1 1.0000.3000 2 .7000.7500 3 .25001.000 4 .0000
USE_AIRFOIL_FAMILY 1
TIPON
#DP 1 19.20 2.00 16.000 2 !Design TSR=6#DP 1 22.40 2.00 16.000 2 !Design TSR=7DP 1 25.60 2.00 16.000 2 !Design TSR=8#DP 1 28.80 2.00 16.000 2 !Design TSR=9#DP 1 32.00 2.00 16.000 2 !Design TSR=10#DP 1 35.20 2.00 16.000 2 !Design TSR=11
# Iterate on pitch to set 75%R stationNEWT1LDP 500 8 1.15 1 1 1 1 3 1 .5
# iteration on only local chord for axial inductionNEWT1LDP 501 8 .3333 1 1 1 2 8 999 .5IDES
# Specify Cl with Respect to 75%RNEWT2SDDP 100 2 7 8 61 0.202 0.203 0.204 0.155 0.106 0.051 1 1 2 100 .5
NEWT2SDDP 100 9 10 8 21 -.032 -.06

Aerodynamic Design of ART-2B Rotor Blades B-3
1 1 1 2 100 .5IDES
# Specify a with Respect to 75%RNEWT2SDDP 101 2 7 8 61 0.002 0.003 0.004 0.005 0.006 0.001 1 1 1 100 .05
NEWT2SDDP 101 9 10 8 21 0.02 0.01 1 1 1 100 .05IDES
LCOL45VS_MODEPITCH_DP 1TSR_SWEEP 2 16 1WIND_SWEEP 16 16 1 22D_SWEEPWRITE_FILES 45
# reset the print flags so that 45 is not written againRPRINT
FIXPD 667 1VS_MODEPITCH_DP 1#TSR_SWEEP 6 6 0#TSR_SWEEP 7 7 0TSR_SWEEP 8 8 0#TSR_SWEEP 9 9 0#TSR_SWEEP 10 10 0#TSR_SWEEP 11 11 0
WIND_SWEEP 5 50 1 22D_SWEEP# write out RPM vs WS, Pwr vs WS, and thrust vs WSWRITE_FILES 39 40 51
RKR_GAMMA 1.70 0.892244 ! Weibull, shape factor = 1.7GAEP 16.78 16.78 1 27 0.9 ! 7.5 m/s mean, 12 m/s cutout, 90% effic.
PITCH_DP 1RPM_DP 1

Aerodynamic Design of ART-2B Rotor Blades B-4
WIND_DP 11D_SWEEP# write out ch(ft-ft), and tw(deg-ft)WRITE_FILES 95 99
# write out converged blade dataDUMP_PROPID 21*

REPORT DOCUMENTATION PAGE Form ApprovedOMB NO. 0704-0188
Public reporting burden for this collection of information is estimated to average 1 hour per response, including the time for reviewing instructions, searching existing data sources,gathering and maintaining the data needed, and completing and reviewing the collection of information. Send comments regarding this burden estimate or any other aspect of thiscollection of information, including suggestions for reducing this burden, to Washington Headquarters Services, Directorate for Information Operations and Reports, 1215 JeffersonDavis Highway, Suite 1204, Arlington, VA 22202-4302, and to the Office of Management and Budget, Paperwork Reduction Project (0704-0188), Washington, DC 20503.
1. AGENCY USE ONLY (Leave blank) 2. REPORT DATE
August 2000
3. REPORT TYPE AND DATES COVERED
Subcontract Report4. TITLE AND SUBTITLE
NREL Advanced Research Turbine (ART) Aerodynamic Design of ART-2B RotorBlades
6. AUTHOR(S)Dayton A. Griffin
5. FUNDING NUMBERST: WE001510C: VAM-8-18208-01
7. PERFORMING ORGANIZATION NAME(S) AND ADDRESS(ES)
Global Energy Concepts, LLC
8. PERFORMING ORGANIZATIONREPORT NUMBER
9. SPONSORING/MONITORING AGENCY NAME(S) AND ADDRESS(ES)National Renewable Energy Laboratory1617 Cole Blvd.Golden, CO 80401-3393
10. SPONSORING/MONITORINGAGENCY REPORT NUMBER
NREL/SR-500-28473
11. SUPPLEMENTARY NOTES
NREL Technical Monitor: Alan Laxson12a. DISTRIBUTION/AVAILABILITY STATEMENT
National Technical Information ServiceU.S. Department of Commerce5285 Port Royal RoadSpringfield, VA 22161
12b. DISTRIBUTION CODE
13. ABSTRACT (Maximum 200 words)The National Renewable Energy Laboratory (NREL) installed two Advanced Research Turbines (ART) at the National Wind Technology Center nearBoulder, Colorado, to use as full-scale test beds for ongoing research efforts, including three-dimensional blade aerodynamics and the effects of variouscontrol methods on turbine loads and performance. The Westinghouse WWG-0600 was selected as a baseline configuration for the ART turbines. Thefirst turbine, ART-1, is currently operational and has been used to collect a baseline set of performance and loads data. A second turbine, ART-2A,incorporates several major modifications and may be upgraded further to a configuration designated aRT-2B. Possible features of the ART-2B turbineinclude a multi-degree of freedom hum and newly designed rotor blades. Global energy concepts, L.L.C. provided engineering support to NREL indesigning the components for the ART-2B turbine. This document provides a summary of work performed by GEC on the aerodynamic design of ART-2Brotor blades.
15. NUMBER OF PAGES14. SUBJECT TERMSwind energy, advanced research turbines, wind turbine blade aerodynamics, design
16. PRICE CODE
17. SECURITY CLASSIFICATIONOF REPORTUnclassified
18. SECURITY CLASSIFICATIONOF THIS PAGEUnclassified
19. SECURITY CLASSIFICATIONOF ABSTRACTUnclassified
20. LIMITATION OF ABSTRACT
UL
NSN 7540-01-280-5500 Standard Form 298 (Rev. 2-89)Prescribed by ANSI Std. Z39-18
298-102