NR Maps- Species Atlas (Flora & Fauna)
13
Department of Lands Resource Management 7/12/2015, version 1 Page 1 of 13 NR Maps User Guide NR Maps: NT Species Atlas nrmaps.nt.gov.au This guide describes how to view, explore, select and download data from the Northern Territory Species Atlas. The Atlas consists of: Flora, Fauna, Sites of Conservation Significance and Sites of Botanical Significance We recommend reading the Getting Started User Guide first. Click on the Help link on the top right of the NR Maps screen to access the Guide. Contact Us: The NR Maps web mapping application is administered by the Spatial Data and Mapping Unit from the Department of Land Resource Management. We encourage users to provide Feedback and help us improve NR Maps. To send us an email, please click on the Feedback link, located at the top right of the NR Maps screen.
Transcript of NR Maps- Species Atlas (Flora & Fauna)

Department of Lands Resource Management 7/12/2015, version 1 Page 1 of 13
NR Maps User Guide
NR Maps: NT Species Atlas
nrmaps.nt.gov.au
This guide describes how to view, explore, select and download data from the Northern Territory Species Atlas.
The Atlas consists of: Flora, Fauna, Sites of Conservation Significance and Sites of Botanical Significance
We recommend reading the Getting Started User Guide first. Click on the Help link on the top right of the NR Maps screen to access the Guide.
Contact Us:
The NR Maps web mapping application is administered by the Spatial Data and Mapping Unit from the Department of Land Resource Management.
We encourage users to provide Feedback and help us improve NR Maps.
To send us an email, please click on the Feedback link, located at the top right of the NR Maps screen.

Department of Lands Resource Management 7/12/2015, version 1
Page 2 of 13
Part 1. About the Species Atlas
1.1 What is the Species Atlas? (structure of the data)
The complete Species Atlas consists of 4 separate datasets:
Fauna Atlas N.T. (points)
Flora Atlas N.T. (points)
Sites of Conservation Significance (polygons)
Sites of Botanical Significance (polygons)
Each of these datasets has separate Metadata entry and a different attribute structure.
IMPORTANT: If you are not familiar with the Species Atlas, please read the Metadata first.
1.2 How the Atlas is displayed in NR Maps
Data becomes visible at scale 1:30,000 and closer. Above that scale, layers are grayed out. Zoom in.
Filters have been applied to display Flora and Fauna layers in different ways, according to selected attributes. Please read the Metadata to familarise yourself with these attributes.
All Fauna displays all available data.
Threatened Fauna – THREAT2012 = 1
Significant Fauna – SIG2012 = 1
All Flora displays all available data
Restricted Range Flora – RESTRICTED_RANGE = ‘Y’
Threatened Flora – THREATENED2012 = 1
Significant Flora – SIGNIFICANT2012 = 1
Part 2. Viewing and examining the Atlas data
2.1 Viewing the Atlas in the Map Window
Data points become visible at scale 1:250,000 and closer.
Labels become visible at scale 1:100,000 and closer.
If working between these two scales, it may be a good idea to activate the MapTips tool.
Hover the mouse over a data point to view the label.

Department of Lands Resource Management 7/12/2015, version 1
Page 3 of 13
If multiple points are clustered, multiple labels are shown. There are two points in the example below. Note that only selected attributes are displayed in this way.
NOTE: Data points are often clustered – i.e. there may be ‘hidden’ points that will not be revealed even at closest possible scale.
In the example on the left it appears there are 4 points. Selecting the cluster reveals 26 points!
So… how to find out more about these mysterious invisible data points?
MapTip tool offers no help – too many features to display.
Viewing the table of attributes may be of help.
2.2 Examining the Atlas in the Data Panel and Data Window
Data attributes can be viewed in the data panel at the bottom of the map screen, or in the data window.
If the data panel is not visible at the bottom of the map screen, click on the tiny tab on the border.
The size of the panel can be adjusted by dragging.

Department of Lands Resource Management 7/12/2015, version 1
Page 4 of 13
Click on the data tab at the top of the map screen to open the data window.
The data table (in both views) displays all available attributes (columns) by default. This setting can be changed. Columns can be turned on and off, and any column can be used to sort and filter the data. Initial setting to display 20 item per page can also be changed. Views in the data panel and data window can be customised independently.
Highlighting a table row places a pin on the associated data point. This is convenient when zoomed beyond
label’s visibility.

Department of Lands Resource Management 7/12/2015, version 1
Page 5 of 13
Part 3. Exporting and downloading
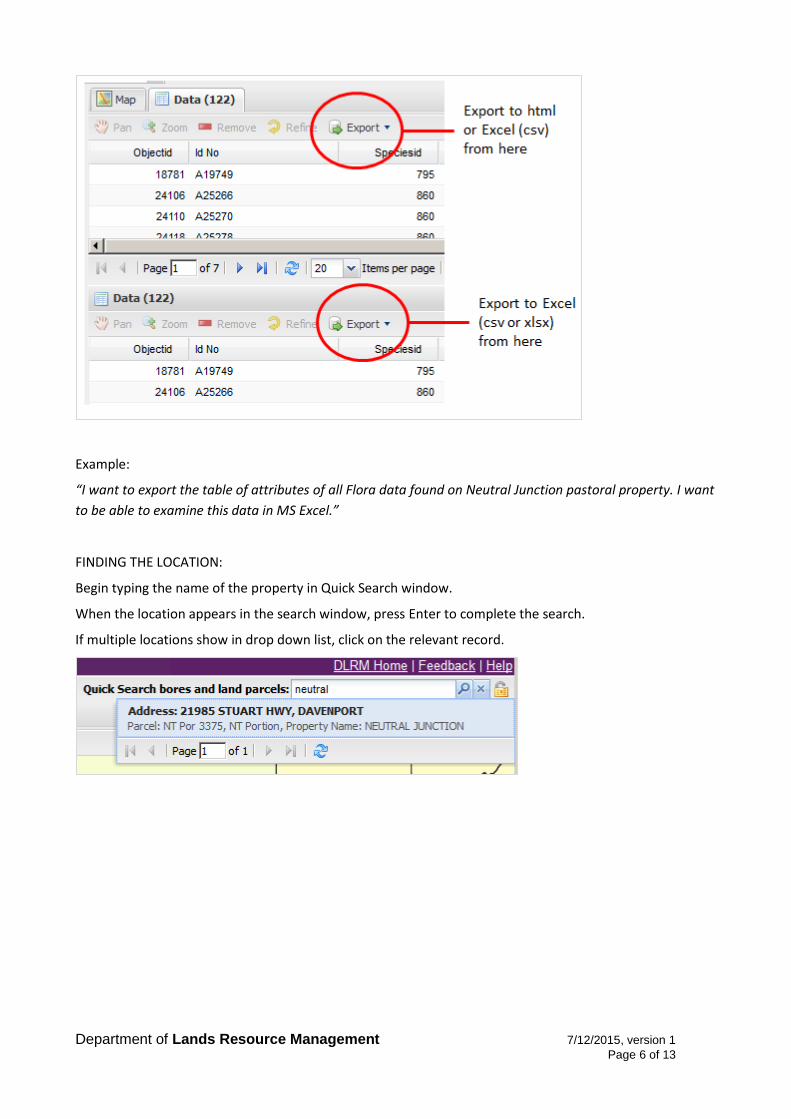
3.1 Exporting
Exporting saves the complete attribute table of selected items. It is not affected by visibility of columns or
sorting, however it is affected by filtering. Only filtered records will be exported, as filtering changes the
selection.
The exporting tool can be accessed from the Data screen (tab) or Data panel at the bottom.
Department of Lands Resource Management 7/12/2015, version 1
Page 6 of 13
Example:
“I want to export the table of attributes of all Flora data found on Neutral Junction pastoral property. I want
to be able to examine this data in MS Excel.”
FINDING THE LOCATION:
Begin typing the name of the property in Quick Search window.
When the location appears in the search window, press Enter to complete the search.
If multiple locations show in drop down list, click on the relevant record.

Department of Lands Resource Management 7/12/2015, version 1
Page 7 of 13
This search set the Cadastre layer active and Neutral Junction pastoral property is highlighted.
The zoom level is beyond the visibility of the Species Atlas. However, the Flora layer, even greyed out, can
still be made active, ready for selecting and exporting.
Use the Buffer tool to select all the Flora records that are within the Neutral Junction property.
Department of Lands Resource Management 7/12/2015, version 1
Page 8 of 13
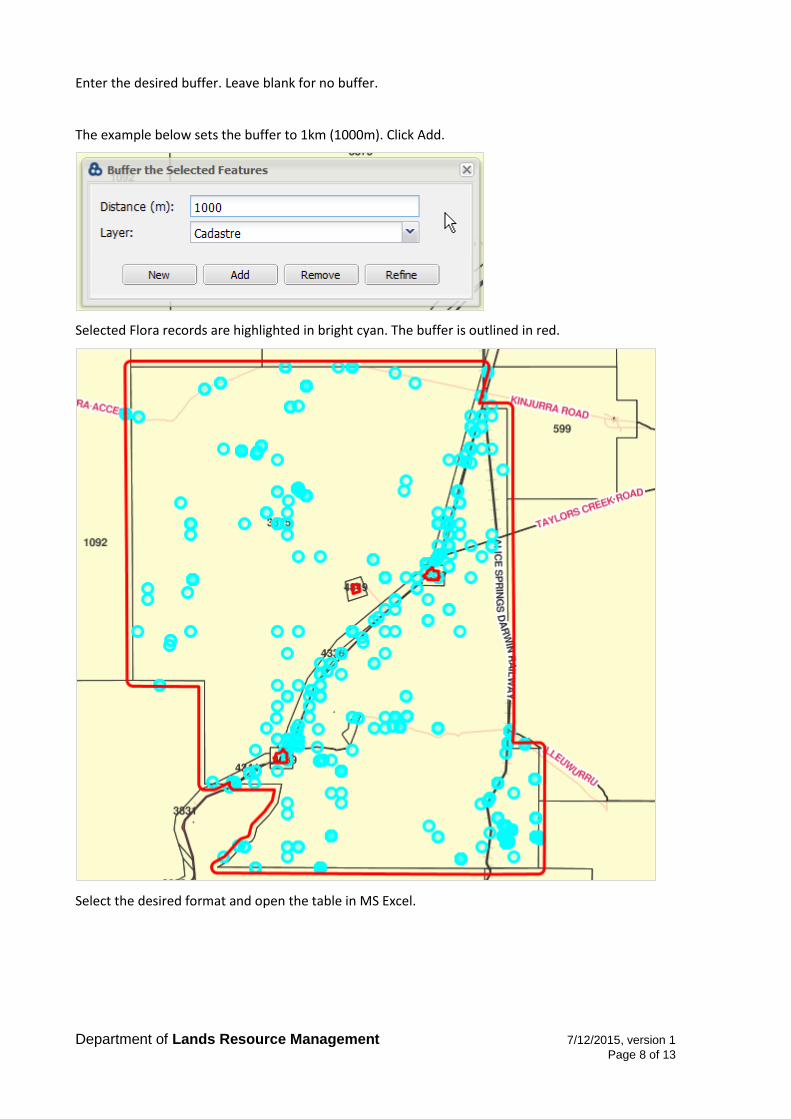
Enter the desired buffer. Leave blank for no buffer.
The example below sets the buffer to 1km (1000m). Click Add.
Selected Flora records are highlighted in bright cyan. The buffer is outlined in red.
Select the desired format and open the table in MS Excel.

Department of Lands Resource Management 7/12/2015, version 1
Page 9 of 13
The data export tool is also available from the Data tab. The options offered are HTML and Excel (CSV).
3.2 Downloading
The download tool becomes active when zoomed closer than 1:550,000.
The extents of data available to download is limited to the extents of the map window at the time
of download.
IMPORTANT: The visibility of the data doesn’t affect the ability to download.
Example: Your area of interest lays at scale 1:400,000. At that scale, the download tool is already
active, but the visibility of the data is not (data becomes visible at 1:300,000). You will still be able
to download the data.
If you require a larger clip of the data (beyond 1:550,000) or the complete dataset, please contact
the Data Request Officer by phone (08) 8951 9216 or email: [email protected]
The downloading tool, accessible from the menu bar in the Map Window, allows users to save data in
several spatial formats – ESRI shapefiles, Mapinfo TAB or dxf (for CAD programs).

Department of Lands Resource Management 7/12/2015, version 1
Page 10 of 13
Example:
“I want to download shapefile of all Flora and Fauna data found on Neutral Junction pastoral property.”
FINDING THE LOCATION:
Begin typing the name of the property in the Quick Search window. When the location appears in the
search window, press Enter to complete the search.
This search has set the cadastre layer as active.
The highlighted polygon of Neutral Junction pastoral property is shown above.
The zoom level is beyond the visibility of the Species Atlas. However, the data can still be downloaded!
Adjust the zoom level if you wish to add a buffer around the property.
Do not zoom beyond the 1:550,000 scale.
If the data panel at the bottom is visible, click it away, to maximise the size of map window.
Top Tip!! Click on F11 to maximise the screen display.
Department of Lands Resource Management 7/12/2015, version 1
Page 11 of 13
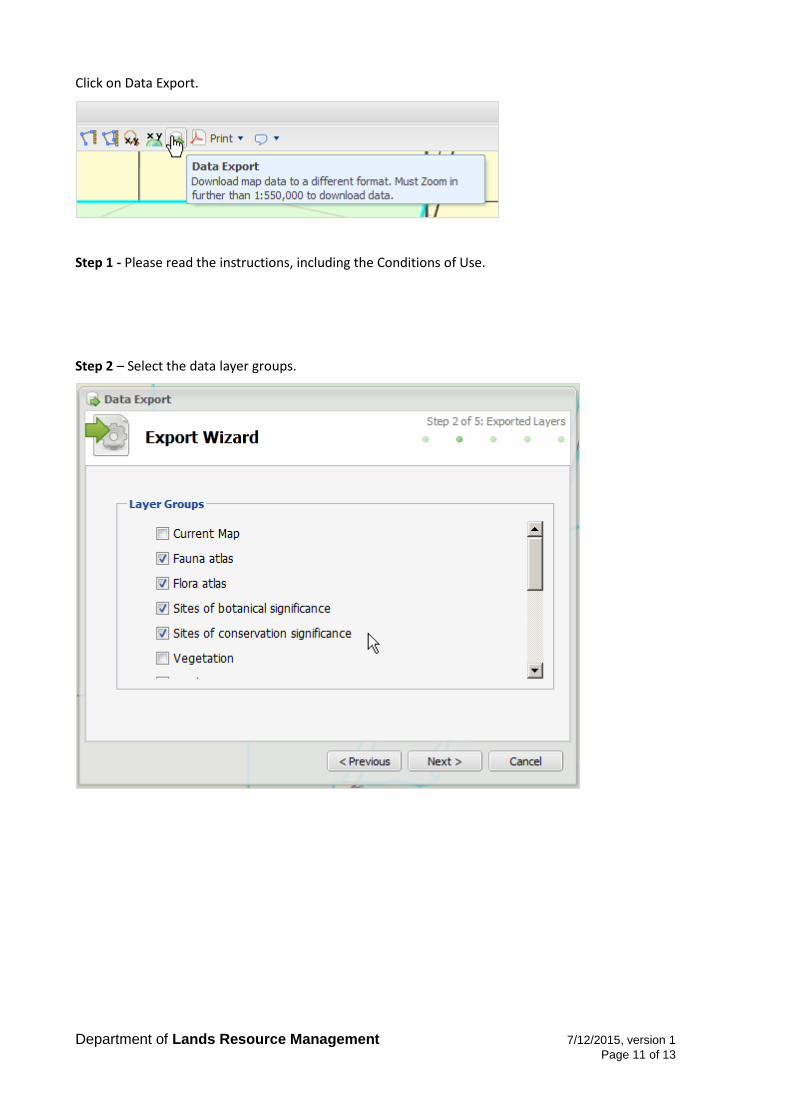
Click on Data Export.
Step 1 - Please read the instructions, including the Conditions of Use.
Step 2 – Select the data layer groups.

Department of Lands Resource Management 7/12/2015, version 1
Page 12 of 13
Step 3 – Select the desired format.
Step 4 – geometry clipping is relevant to exporting polygon data. Leave unchecked if in doubt.

Department of Lands Resource Management 7/12/2015, version 1
Page 13 of 13
Click to download the zip file to your computer.
Many of the functions described in this guide may be applicable to other data layers in NR Maps.
Please help us improve NR Maps. If you have any questions or comments, send an email using
the Feedback Link located at the top right of the NR Maps screen.