NQABA FINANCE 1 (RF) LIMITED
19
Debt Capital Markets Debt Capital Markets DCM Africa DCM Africa Kumeshen Naidoo Marcus Veller Tel: +27 11 895 6555 Tel: +27 11 895 7298 E-mail: [email protected] E-mail: [email protected] NQABA FINANCE 1 (RF) LIMITED INVESTOR REPORT 23 AUGUST 2018 TO 22 NOVEMBER 2018 Physical address: 15 Alice Lane, Sandown, Sandton 2196 South Africa Postal address: Private Bag X10056, Sandton 2146, South Africa
Transcript of NQABA FINANCE 1 (RF) LIMITED
Debt Capital Markets Debt Capital Markets
DCM Africa DCM Africa
Kumeshen Naidoo Marcus Veller
Tel: +27 11 895 6555 Tel: +27 11 895 7298
E-mail: [email protected] E-mail: [email protected]
NQABA FINANCE 1 (RF) LIMITED
INVESTOR REPORT
23 AUGUST 2018 TO 22 NOVEMBER 2018
Physical address: 15 Alice Lane, Sandown, Sandton 2196 South Africa
Postal address: Private Bag X10056, Sandton 2146, South Africa
Investor Report
for the period ending 22 November 2018
Index Page
Disclaimer 1
Counterparties and salient information 2
Assets: Collateral portfolio characteristics 3
Possessions 3
Related portfolio covenants 3
Related early amortisation event triggers 3
Portfolio stratification tables 4
Arrears analysis 7
Arrears reserve trigger 7
Early amortisation arrears trigger 7
Movement in properties classified as Litigations 7
Provisioning 7
Trends 8
Liabilities: Cumulative Note details 11
Note interest calculations 12
Interest swap calculations 12
Liquidity and redraw facilities 12
Early amortisation events (summary) 12
Principal deficiency ledger 13
Reserve funds 13
Cash flow statement 14
Priority of payments 14
Financial: Abridged statements of comprehensive income and financial position 15
Excess spread 15
Glossary Abridged glossary of definitions 16
Copies of Nqaba Investor Reports are available from the South African Securitisation Forum:
http://www.sasf.co.za/investorreporting.htm
Manager certification:
NQABA FINANCE 1 (RF) LIMITED
(Public company incorporated in the Republic of South Africa under number 2005/040050/06)
Disclaimer: Copyright 2018. Publisher: Absa Corporate and Investment Bank. All rights reserved
This document has been prepared by ABSA Corporate and Investment Bank (a division of ABSA Bank Limited) ("Absa"), and is provided to you for information
purposes only.
Neither Absa nor any of its subsidiaries, affiliates or ultimate holding company, nor any of the subsidiaries or affiliates of such holding company (the “Absa
Group”), nor any of the subsidiaries or affiliates of such holding company (the “Absa Group”), nor any of their respective directors, officers, employees,
representatives or agents, accepts any liability whatsoever for any direct, indirect or consequential losses (in contract, delict or otherwise) arising from the use of
this document or its contents or reliance on the information contained herein.
The information in this document is derived from sources which are regarded as accurate and reliable and Absa does not guarantee the accuracy and/or
completeness of said information. No responsibility for any error, omission or loss sustained by any person acting or refraining from acting as a result of this
document is accepted by Absa and/or the author/s of the material. Past performance is not an indication of future performance and future returns are not
guaranteed. It is recommended that independent detailed advice (i.e. tax, accounting, legal and financial advice) be obtained in each case prior to placing any
reliance or acting on the information contained in this document.
This report has been prepared for general communication and information purposes only and may not be construed as an offer to buy or sell or a solicitation of an
offer to buy or sell any financial instruments referred to herein, or to participate in any particular trading strategy in any jurisdiction in relation to such financial
instruments. Any additional information regarding any financial instruments and/or financial products reviewed in this report is available upon request. Any
unauthorised use or disclosure of this report is prohibited. Absa and/or its subsidiaries and/or affiliates may act as bankers, arrangers and/or advisors to issuers
and/or market makers in financial instruments issued by such issuers as listed in this publication.
This document is being made available in the Republic of South Africa to persons who have professional experience in, and whom Absa believe, to be sufficiently
knowledgeable to understand matters relating to investments.
Copyright of this document is owned by Absa. No part of this document may be reproduced in any manner without prior written permission of Absa. The contents
of this document are proprietary to Absa.
The author/s as listed in this publication certifies/certify that no part of its/their compensation was, is or will be, either directly or indirectly, related to the information
expressed in this document.
Absa Bank Limited, Registration Number 1986/004794/06, is an Authorised Financial Services Provider, Licence Number 292, and a Registered Credit Provider,
Registration Number NCRCP7.
1
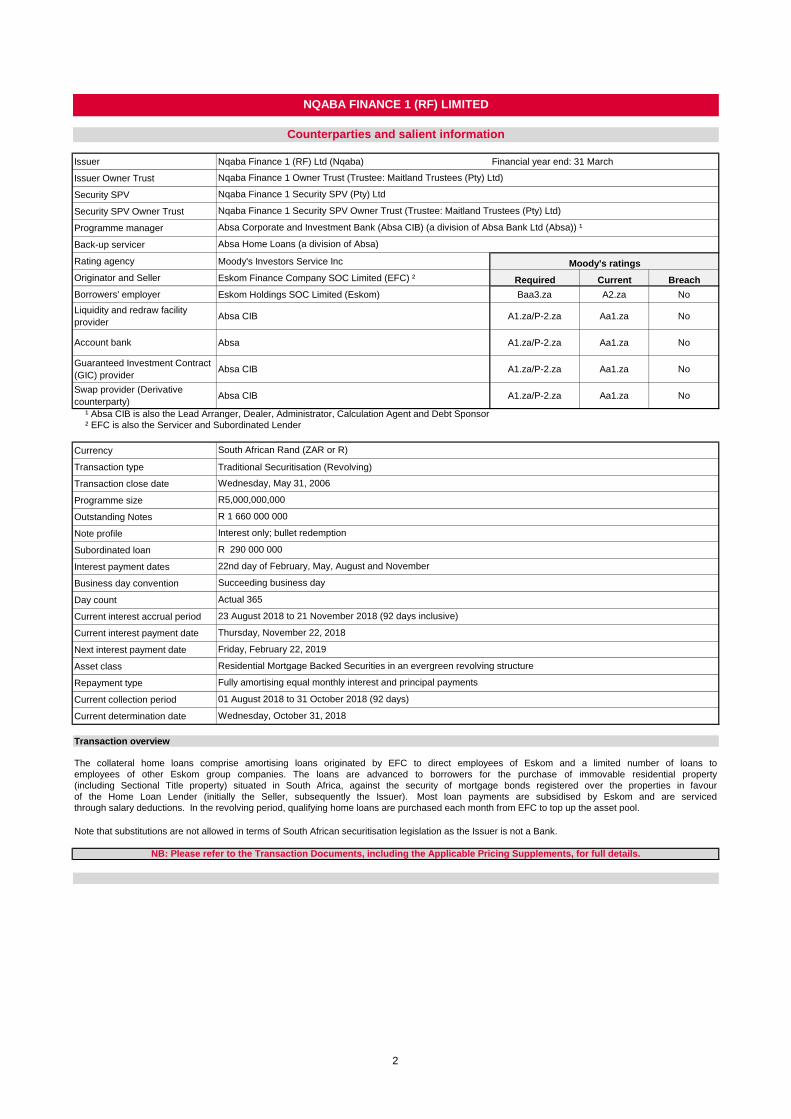
Issuer Nqaba Finance 1 (RF) Ltd (Nqaba) Financial year end: 31 March
Issuer Owner Trust
Security SPV
Security SPV Owner Trust
Programme manager
Back-up servicer
Rating agency Moody's Investors Service Inc
Originator and Seller Eskom Finance Company SOC Limited (EFC) ² Required Current Breach
Borrowers' employer Eskom Holdings SOC Limited (Eskom) Baa3.za A2.za No
Liquidity and redraw facility
providerAbsa CIB A1.za/P-2.za Aa1.za No
Account bank Absa A1.za/P-2.za Aa1.za No
Guaranteed Investment Contract
(GIC) providerAbsa CIB A1.za/P-2.za Aa1.za No
Swap provider (Derivative
counterparty)Absa CIB A1.za/P-2.za Aa1.za No
¹ Absa CIB is also the Lead Arranger, Dealer, Administrator, Calculation Agent and Debt Sponsor
² EFC is also the Servicer and Subordinated Lender
Currency
Transaction type Traditional Securitisation (Revolving)
Transaction close date
Programme size
Outstanding Notes
Note profile
Subordinated loan
Interest payment dates
Business day convention
Day count
Current interest accrual period
Current interest payment date
Next interest payment date
Asset class
Repayment type
Current collection period
Current determination date
Transaction overview
through salary deductions. In the revolving period, qualifying home loans are purchased each month from EFC to top up the asset pool.
Note that substitutions are not allowed in terms of South African securitisation legislation as the Issuer is not a Bank.
NB: Please refer to the Transaction Documents, including the Applicable Pricing Supplements, for full details.
South African Rand (ZAR or R)
Wednesday, May 31, 2006
R5,000,000,000
R 1 660 000 000
Interest only; bullet redemption
R 290 000 000
22nd day of February, May, August and November
Succeeding business day
23 August 2018 to 21 November 2018 (92 days inclusive)
Thursday, November 22, 2018
Friday, February 22, 2019
Actual 365
The collateral home loans comprise amortising loans originated by EFC to direct employees of Eskom and a limited number of loans to
employees of other Eskom group companies. The loans are advanced to borrowers for the purchase of immovable residential property
(including Sectional Title property) situated in South Africa, against the security of mortgage bonds registered over the properties in favour
of the Home Loan Lender (initially the Seller, subsequently the Issuer). Most loan payments are subsidised by Eskom and are serviced
NQABA FINANCE 1 (RF) LIMITED
Counterparties and salient information
Residential Mortgage Backed Securities in an evergreen revolving structure
Wednesday, October 31, 2018
Fully amortising equal monthly interest and principal payments
Nqaba Finance 1 Owner Trust (Trustee: Maitland Trustees (Pty) Ltd)
Nqaba Finance 1 Security SPV (Pty) Ltd
Nqaba Finance 1 Security SPV Owner Trust (Trustee: Maitland Trustees (Pty) Ltd)
Absa Corporate and Investment Bank (Absa CIB) (a division of Absa Bank Ltd (Absa)) ¹
Absa Home Loans (a division of Absa)
01 August 2018 to 31 October 2018 (92 days)
Moody's ratings
2
Collection period:
R Loans R Loans R Loans
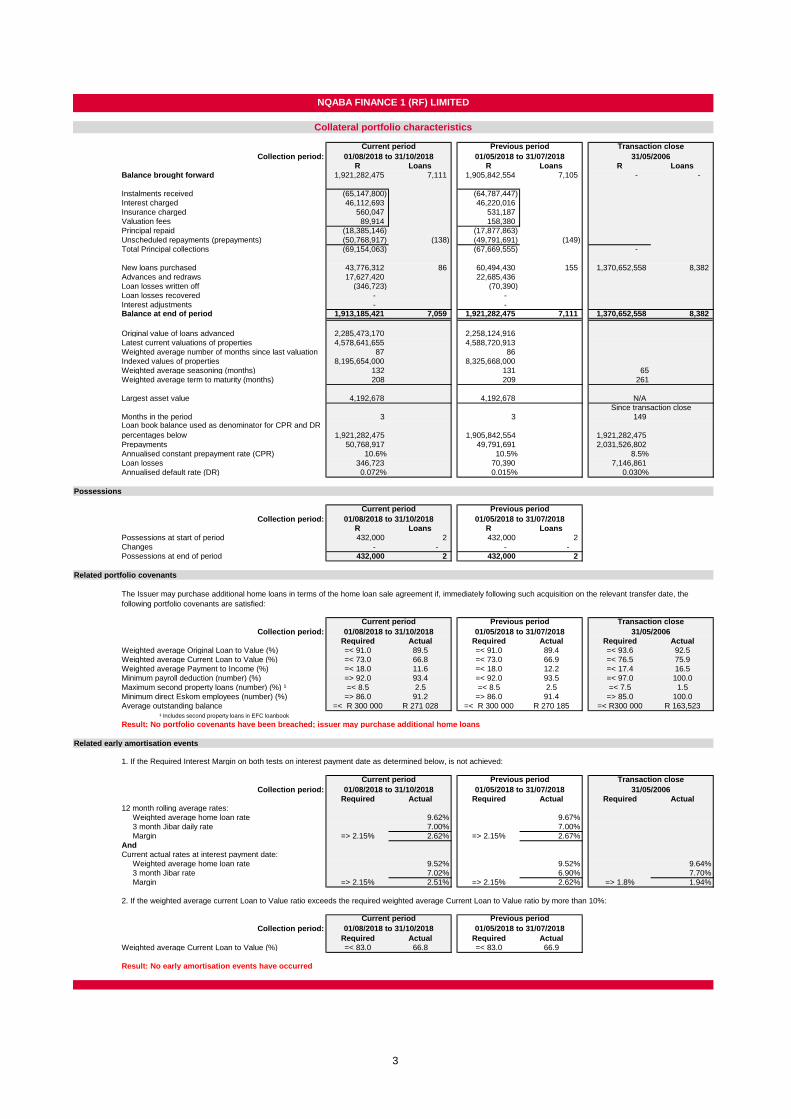
Balance brought forward 1,921,282,475 7,111 1,905,842,554 7,105 - -
Instalments received (65,147,800) (64,787,447)
Interest charged 46,112,693 46,220,016
Insurance charged 560,047 531,187
Valuation fees 89,914 158,380
Principal repaid (18,385,146) (17,877,863)
Unscheduled repayments (prepayments) (50,768,917) (138) (49,791,691) (149)
Total Principal collections (69,154,063) (67,669,555) -
New loans purchased 43,776,312 86 60,494,430 155 1,370,652,558 8,382
Advances and redraws 17,627,420 22,685,436
Loan losses written off (346,723) (70,390)
Loan losses recovered - -
Interest adjustments - - Balance at end of period 1,913,185,421 7,059 1,921,282,475 7,111 1,370,652,558 8,382
Original value of loans advanced 2,285,473,170 2,258,124,916
Latest current valuations of properties 4,578,641,655 4,588,720,913
Weighted average number of months since last valuation 87 86
Indexed values of properties 8,195,654,000 8,325,668,000
Weighted average seasoning (months) 132 131 65
Weighted average term to maturity (months) 208 209 261
Largest asset value 4,192,678 4,192,678 N/A
Months in the period 3 3 149 Loan book balance used as denominator for CPR and DR
percentages below 1,921,282,475 1,905,842,554 1,921,282,475
Prepayments 50,768,917 49,791,691 2,031,526,802
Annualised constant prepayment rate (CPR) 10.6% 10.5% 8.5%
Loan losses 346,723 70,390 7,146,861
Annualised default rate (DR) 0.072% 0.015% 0.030%
Possessions
Collection period:
R Loans R Loans
Possessions at start of period 432,000 2 432,000 2
Changes - - - -
Possessions at end of period 432,000 2 432,000 2
Related portfolio covenants
Collection period:
Required Actual Required Actual Required Actual
Weighted average Original Loan to Value (%) =< 91.0 89.5 =< 91.0 89.4 =< 93.6 92.5
Weighted average Current Loan to Value (%) =< 73.0 66.8 =< 73.0 66.9 =< 76.5 75.9
Weighted average Payment to Income (%) =< 18.0 11.6 =< 18.0 12.2 =< 17.4 16.5
Minimum payroll deduction (number) (%) => 92.0 93.4 =< 92.0 93.5 =< 97.0 100.0
Maximum second property loans (number) (%) ¹ =< 8.5 2.5 =< 8.5 2.5 =< 7.5 1.5
Minimum direct Eskom employees (number) (%) => 86.0 91.2 => 86.0 91.4 => 85.0 100.0
Average outstanding balance =< R 300 000 R 271 028 =< R 300 000 R 270 185 =< R300 000 R 163,523
¹ Includes second property loans in EFC loanbook
Result: No portfolio covenants have been breached; issuer may purchase additional home loans
Related early amortisation events
1. If the Required Interest Margin on both tests on interest payment date as determined below, is not achieved:
Collection period:
Required Actual Required Actual Required Actual
12 month rolling average rates:
Weighted average home loan rate 9.62% 9.67%
3 month Jibar daily rate 7.00% 7.00%
Margin => 2.15% 2.62% => 2.15% 2.67%
And
Current actual rates at interest payment date:
Weighted average home loan rate 9.52% 9.52% 9.64%
3 month Jibar rate 7.02% 6.90% 7.70%
Margin => 2.15% 2.51% => 2.15% 2.62% => 1.8% 1.94%
2. If the weighted average current Loan to Value ratio exceeds the required weighted average Current Loan to Value ratio by more than 10%:
Collection period:
Required Actual Required Actual
Weighted average Current Loan to Value (%) =< 83.0 66.8 =< 83.0 66.9
Result: No early amortisation events have occurred
Current period
01/08/2018 to 31/10/2018
Previous period
01/05/2018 to 31/07/2018
Current period
01/08/2018 to 31/10/2018
Previous period
01/05/2018 to 31/07/2018
Transaction close
31/05/2006
Current period
01/08/2018 to 31/10/2018
Previous period
01/05/2018 to 31/07/2018
Transaction close
31/05/2006
NQABA FINANCE 1 (RF) LIMITED
Collateral portfolio characteristics
The Issuer may purchase additional home loans in terms of the home loan sale agreement if, immediately following such acquisition on the relevant transfer date, the
following portfolio covenants are satisfied:
Current period
01/08/2018 to 31/10/2018
Previous period
01/05/2018 to 31/07/2018
Transaction close
31/05/2006
Current period
01/08/2018 to 31/10/2018
Previous period
01/05/2018 to 31/07/2018
Since transaction close
3
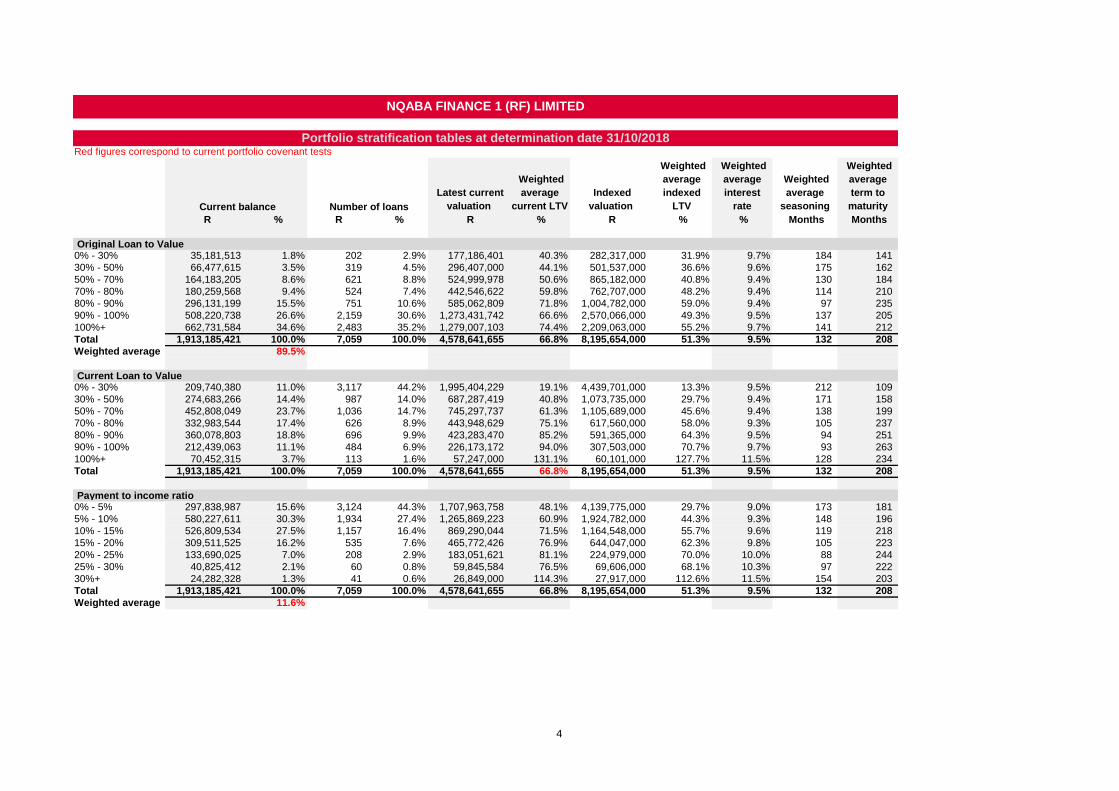
Red figures correspond to current portfolio covenant tests
Latest current
valuation
Weighted
average
current LTV
Indexed
valuation
Weighted
average
indexed
LTV
Weighted
average
interest
rate
Weighted
average
seasoning
Weighted
average
term to
maturity
R % R % R % R % % Months Months
Original Loan to Value0% - 30% 35,181,513 1.8% 202 2.9% 177,186,401 40.3% 282,317,000 31.9% 9.7% 184 141
30% - 50% 66,477,615 3.5% 319 4.5% 296,407,000 44.1% 501,537,000 36.6% 9.6% 175 162
50% - 70% 164,183,205 8.6% 621 8.8% 524,999,978 50.6% 865,182,000 40.8% 9.4% 130 184
70% - 80% 180,259,568 9.4% 524 7.4% 442,546,622 59.8% 762,707,000 48.2% 9.4% 114 210
80% - 90% 296,131,199 15.5% 751 10.6% 585,062,809 71.8% 1,004,782,000 59.0% 9.4% 97 235
90% - 100% 508,220,738 26.6% 2,159 30.6% 1,273,431,742 66.6% 2,570,066,000 49.3% 9.5% 137 205
100%+ 662,731,584 34.6% 2,483 35.2% 1,279,007,103 74.4% 2,209,063,000 55.2% 9.7% 141 212
Total 1,913,185,421 100.0% 7,059 100.0% 4,578,641,655 66.8% 8,195,654,000 51.3% 9.5% 132 208
Weighted average 89.5%
Current Loan to Value0% - 30% 209,740,380 11.0% 3,117 44.2% 1,995,404,229 19.1% 4,439,701,000 13.3% 9.5% 212 109
30% - 50% 274,683,266 14.4% 987 14.0% 687,287,419 40.8% 1,073,735,000 29.7% 9.4% 171 158
50% - 70% 452,808,049 23.7% 1,036 14.7% 745,297,737 61.3% 1,105,689,000 45.6% 9.4% 138 199
70% - 80% 332,983,544 17.4% 626 8.9% 443,948,629 75.1% 617,560,000 58.0% 9.3% 105 237
80% - 90% 360,078,803 18.8% 696 9.9% 423,283,470 85.2% 591,365,000 64.3% 9.5% 94 251
90% - 100% 212,439,063 11.1% 484 6.9% 226,173,172 94.0% 307,503,000 70.7% 9.7% 93 263
100%+ 70,452,315 3.7% 113 1.6% 57,247,000 131.1% 60,101,000 127.7% 11.5% 128 234
Total 1,913,185,421 100.0% 7,059 100.0% 4,578,641,655 66.8% 8,195,654,000 51.3% 9.5% 132 208
Payment to income ratio0% - 5% 297,838,987 15.6% 3,124 44.3% 1,707,963,758 48.1% 4,139,775,000 29.7% 9.0% 173 181
5% - 10% 580,227,611 30.3% 1,934 27.4% 1,265,869,223 60.9% 1,924,782,000 44.3% 9.3% 148 196
10% - 15% 526,809,534 27.5% 1,157 16.4% 869,290,044 71.5% 1,164,548,000 55.7% 9.6% 119 218
15% - 20% 309,511,525 16.2% 535 7.6% 465,772,426 76.9% 644,047,000 62.3% 9.8% 105 223
20% - 25% 133,690,025 7.0% 208 2.9% 183,051,621 81.1% 224,979,000 70.0% 10.0% 88 244
25% - 30% 40,825,412 2.1% 60 0.8% 59,845,584 76.5% 69,606,000 68.1% 10.3% 97 222
30%+ 24,282,328 1.3% 41 0.6% 26,849,000 114.3% 27,917,000 112.6% 11.5% 154 203
Total 1,913,185,421 100.0% 7,059 100.0% 4,578,641,655 66.8% 8,195,654,000 51.3% 9.5% 132 208
Weighted average 11.6%
Current balance Number of loans
NQABA FINANCE 1 (RF) LIMITED
Portfolio stratification tables at determination date 31/10/2018
4
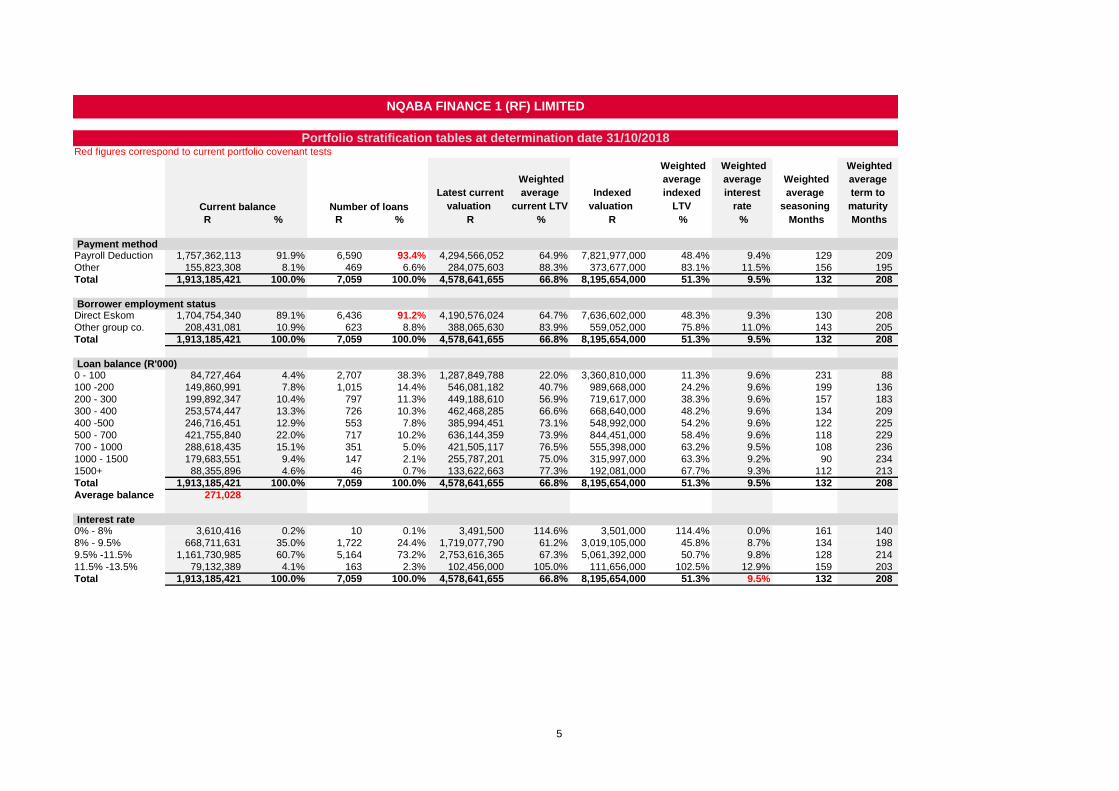
Red figures correspond to current portfolio covenant tests
Latest current
valuation
Weighted
average
current LTV
Indexed
valuation
Weighted
average
indexed
LTV
Weighted
average
interest
rate
Weighted
average
seasoning
Weighted
average
term to
maturity
R % R % R % R % % Months Months
Current balance Number of loans
NQABA FINANCE 1 (RF) LIMITED
Portfolio stratification tables at determination date 31/10/2018
Payment methodPayroll Deduction 1,757,362,113 91.9% 6,590 93.4% 4,294,566,052 64.9% 7,821,977,000 48.4% 9.4% 129 209
Other 155,823,308 8.1% 469 6.6% 284,075,603 88.3% 373,677,000 83.1% 11.5% 156 195
Total 1,913,185,421 100.0% 7,059 100.0% 4,578,641,655 66.8% 8,195,654,000 51.3% 9.5% 132 208
Borrower employment statusDirect Eskom 1,704,754,340 89.1% 6,436 91.2% 4,190,576,024 64.7% 7,636,602,000 48.3% 9.3% 130 208
Other group co. 208,431,081 10.9% 623 8.8% 388,065,630 83.9% 559,052,000 75.8% 11.0% 143 205
Total 1,913,185,421 100.0% 7,059 100.0% 4,578,641,655 66.8% 8,195,654,000 51.3% 9.5% 132 208
Loan balance (R'000)0 - 100 84,727,464 4.4% 2,707 38.3% 1,287,849,788 22.0% 3,360,810,000 11.3% 9.6% 231 88
100 -200 149,860,991 7.8% 1,015 14.4% 546,081,182 40.7% 989,668,000 24.2% 9.6% 199 136
200 - 300 199,892,347 10.4% 797 11.3% 449,188,610 56.9% 719,617,000 38.3% 9.6% 157 183
300 - 400 253,574,447 13.3% 726 10.3% 462,468,285 66.6% 668,640,000 48.2% 9.6% 134 209
400 -500 246,716,451 12.9% 553 7.8% 385,994,451 73.1% 548,992,000 54.2% 9.6% 122 225
500 - 700 421,755,840 22.0% 717 10.2% 636,144,359 73.9% 844,451,000 58.4% 9.6% 118 229
700 - 1000 288,618,435 15.1% 351 5.0% 421,505,117 76.5% 555,398,000 63.2% 9.5% 108 236
1000 - 1500 179,683,551 9.4% 147 2.1% 255,787,201 75.0% 315,997,000 63.3% 9.2% 90 234
1500+ 88,355,896 4.6% 46 0.7% 133,622,663 77.3% 192,081,000 67.7% 9.3% 112 213
Total 1,913,185,421 100.0% 7,059 100.0% 4,578,641,655 66.8% 8,195,654,000 51.3% 9.5% 132 208
Average balance 271,028
Interest rate0% - 8% 3,610,416 0.2% 10 0.1% 3,491,500 114.6% 3,501,000 114.4% 0.0% 161 140
8% - 9.5% 668,711,631 35.0% 1,722 24.4% 1,719,077,790 61.2% 3,019,105,000 45.8% 8.7% 134 198
9.5% -11.5% 1,161,730,985 60.7% 5,164 73.2% 2,753,616,365 67.3% 5,061,392,000 50.7% 9.8% 128 214
11.5% -13.5% 79,132,389 4.1% 163 2.3% 102,456,000 105.0% 111,656,000 102.5% 12.9% 159 203
Total 1,913,185,421 100.0% 7,059 100.0% 4,578,641,655 66.8% 8,195,654,000 51.3% 9.5% 132 208
5

Red figures correspond to current portfolio covenant tests
Latest current
valuation
Weighted
average
current LTV
Indexed
valuation
Weighted
average
indexed
LTV
Weighted
average
interest
rate
Weighted
average
seasoning
Weighted
average
term to
maturity
R % R % R % R % % Months Months
Current balance Number of loans
NQABA FINANCE 1 (RF) LIMITED
Portfolio stratification tables at determination date 31/10/2018
Seasoning0 - 12 months 19,854,019 1.0% 34 0.5% 40,006,000 72.3% 40,006,000 72.3% 9.2% 9 249
12 - 24 months 39,495,944 2.1% 64 0.9% 68,994,000 73.8% 68,989,000 73.8% 9.4% 19 281
24 - 36 months 53,135,631 2.8% 79 1.1% 88,739,500 72.3% 90,790,000 70.7% 9.4% 30 283
36 - 48 months 52,529,215 2.7% 84 1.2% 91,533,900 74.6% 99,922,000 68.0% 9.5% 43 268
48 - 60 months 59,836,491 3.1% 96 1.4% 106,552,750 73.2% 126,759,000 62.2% 9.3% 55 258
60 - 120 months 846,690,740 44.3% 1,883 26.7% 1,348,386,565 77.3% 1,817,695,000 58.8% 9.6% 92 238
120+ months 841,643,381 44.0% 4,819 68.3% 2,834,428,940 54.6% 5,951,493,000 39.1% 9.5% 197 161
Total 1,913,185,421 100.0% 7,059 100.0% 4,578,641,655 66.8% 8,195,654,000 51.3% 9.5% 132 208
RegionEastern Cape 98,048,823 5.1% 339 4.8% 233,585,540 71.7% 341,458,000 56.2% 9.8% 143 202
Free State 92,381,678 4.8% 379 5.4% 210,316,102 68.0% 338,209,000 51.6% 9.6% 126 215
Gauteng 792,436,805 41.4% 2,355 33.4% 1,831,684,377 65.3% 3,023,545,000 50.5% 9.4% 128 209
Kwazulu Natal 109,822,801 5.7% 473 6.7% 289,625,550 67.6% 541,893,000 52.0% 9.7% 145 201
Limpopo Province 71,648,411 3.7% 318 4.5% 170,424,387 64.8% 273,389,000 47.9% 9.7% 134 206
Mpumalanga 420,382,837 22.0% 1,884 26.7% 978,815,795 67.2% 1,888,932,000 51.4% 9.6% 133 207
North West 38,282,910 2.0% 180 2.5% 74,392,162 71.9% 160,648,000 51.0% 9.5% 135 203
Northern Cape 25,644,515 1.3% 155 2.2% 71,422,893 67.4% 116,215,000 50.2% 9.8% 133 206
Western Cape 264,536,641 13.8% 976 13.8% 718,374,848 67.9% 1,511,365,000 52.2% 9.6% 132 211
Total 1,913,185,421 100.0% 7,059 100.0% 4,578,641,655 66.8% 8,195,654,000 51.3% 9.5% 132 208
Property typeHouse (Freehold) 1,562,135,128 81.7% 5,988 84.8% 3,840,396,535 65.7% 6,974,506,000 50.2% 9.5% 137 203 Multi-unit (Sectional
Title) 274,344,081 14.3% 877 12.4% 493,166,173 75.4% 841,923,000 57.9% 9.5% 107 238
House (Complex) 7,884,170 0.4% 19 0.3% 15,905,000 61.2% 25,014,000 43.5% 9.5% 138 201
Small Holding 3,956,089 0.2% 14 0.2% 11,245,000 50.8% 17,554,000 34.7% 9.7% 126 174
Other 64,865,952 3.4% 161 2.3% 217,928,947 58.7% 336,657,000 49.5% 9.2% 104 215
Total 1,913,185,421 100.0% 7,059 100.0% 4,578,641,655 66.8% 8,195,654,000 51.3% 9.5% 132 208
6

R % % % R % % %
Fully performingCurrent 1,816,286,404 94.9% 6,785 96.1% 9.4% 1,823,241,379 94.9% 6,834 96.1% 9.4%
Non-delinquent0 - 1 months 10,551,296 0.6% 34 0.5% 11.7% 14,550,741 0.8% 39 0.5% 11.4%1 - 2 months 7,100,595 0.4% 24 0.3% 12.1% 7,042,527 0.4% 24 0.3% 11.9%2 - 3 months 7,324,605 0.4% 22 0.3% 12.1% 8,653,077 0.5% 21 0.3% 12.4%Total 24,976,495 1.3% 80 1.1% 11.9% 30,246,345 1.6% 84 1.2% 11.8%
Deteriorated3 - 4 months - 0.0% - 0.0% 0.0% - 0.0% - 0.0% 0.0%4 - 5 months 150,656 0.0% 2 0.0% 12.7% 1,028,804 0.1% 6 0.1% 11.8%5 - 6 months 101,753 0.0% 1 0.0% 12.5% 1,333,987 0.1% 3 0.0% 12.6%
6 - 12 months 1,805,837 0.1% 7 0.1% 12.6% 2,086,178 0.1% 9 0.1% 12.7%>12 months 3,524,428 0.2% 23 0.3% 7.3% 2,775,652 0.1% 24 0.3% 5.9%Total 5,582,675 0.3% 33 0.5% 9.3% 7,224,620 0.4% 42 0.6% 9.9%
DefaultedLitigation 30,207,483 1.6% 53 0.8% 12.5% 28,338,249 1.5% 48 0.7% 12.5%
Other categoriesDebt review - 0.0% - 0.0% 0.0% - 0.0% - 0.0% 0.0%Arrangement 34,259,984 1.8% 102 1.4% 12.6% 29,543,021 1.5% 96 1.4% 12.6%Third party attachment - 0.0% - 0.0% 0.0% - 0.0% - 0.0% 0.0%Properties sold 1,440,381 0.1% 4 0.1% 0.0% 2,256,861 0.1% 5 0.1% 0.0%Properties in possession 432,000 0.0% 2 0.0% 0.0% 432,000 0.0% 2 0.0% 0.0%Total 36,132,364 1.9% 108 1.5% 11.9% 32,231,882 1.7% 103 1.4% 11.5%
Total 1,913,185,421 100.0% 7,059 100.0% 9.5% 1,921,282,475 100.0% 7,111 100.0% 9.5%
Arrears reserve trigger
Aggregate principal balances on home loans as above A
Balances which are in arrears for more than 3 months B
Balances for which the Issuer has instituted legal proceedings C
Total arrears for calculation purposes D = B + C
Arrears % E = D / A
Arrears reserve trigger level percentage
Arrears reserve trigger level value
If arrears % (E) previously exceeded the trigger, check whether arrears have decreased to 1.5% No No
Arrears trigger event maintained Yes Yes
If Yes, calculation of arrears reserve required:
Original valuation of the related properties
Latest valuation of the related properties
Balances which are in arrears for more than 3 months B
60% of the lower of the original valuation and latest valuation F
Test difference between arrears and conservative value of related properties G = B - F
Arrears reserve required amount (if value greater, no cash reserve required) H
Quarter 10/31/2018 9/30/2018 8/31/2018
Changes in arrears reserve R R R R
Opening balance 2,942,559 3,222,539 2,823,823 2,942,559
Changes reflected in Priority of Payments (1,087,865) (1,367,845) 398,716 (118,736)
Closing balance H 1,854,694 1,854,694 3,222,539 2,823,823
Related early amortisation arrears trigger
Notes in issue
Trigger per cent
Trigger value I
Total arrears as defined above D
Headroom (deficit) 5,709,842 5,937,131
Early amortisation arrears trigger event (D > I) No No
Movement in properties clasified as Litigations
No of loans R No of loans R
Opening balance 48 28,338,249 47 27,752,058
Loans exit litigation -8 (4,212,277) -13 (6,497,816)
Loans enter litigation 13 4,970,567 14 5,943,241
Repayments (17,000) -
Advance 164,920 200,455
Interest 902,760 867,504
Loan losses - -
Valuation fees 5,425 19,608
Capitalised insurance 54,840 53,198
Closing balance 53 30,207,483 48 28,338,249
Provisions
in the tables above. The amounts shown in the company's Management Reports are:
Impairments applied to loan book excluding possessions
Impairments applied to possessions
Total impairments
10/31/2018 7/31/2018
2,942,559
2.50% 2.50%
10/31/2018 7/31/2018
R R
2,942,559
9,811,386 9,366,732
9,489,386 9,044,732
322,000 322,000
10/31/2018 7/31/2018
R R
41,500,000 41,500,000
35,790,158 35,562,869
1,660,000,000
1,854,694
5,582,675
6,213,302
12,996,500
1,660,000,000
1,854,694
2.00% 2.00%
38,263,708 38,425,650
3,727,981
7,224,620
7,136,768
15,397,500
4,282,061
1.87% 1.85%
5,582,675 7,224,620
30,207,483 28,338,249
R R
35,790,158 35,562,869
1,913,185,421 1,921,282,475
Nqaba establishes an allowance for impairment of the loan book that represents its estimate of incurred losses. This allowance consists of a specific loss component that
relates to individual exposure and a collective loss component in respect of losses that have been incurred but not yet identified. The provisions are not taken into account
NQABA FINANCE 1 (RF) LIMITED
Arrears analysis at determination date
Wednesday, October 31, 2018 Tuesday, July 31, 2018 WA
interest Loan balances Number of loans Loan balances Number of loans
WA interest
rate
An arrears reserve trigger event shall occur on any determination date where the aggregate principal balances of home loans
(i) which are in arrears for more than 3 months; and/or
(ii) in respect of which the Issuer has instituted legal proceedings for the recovery of amounts owing,
exceeds 2,5% of the aggregate principal balances of the home loans and shall cease when such percentage reduces to 1,5%;
10/31/2018 7/31/2018
7
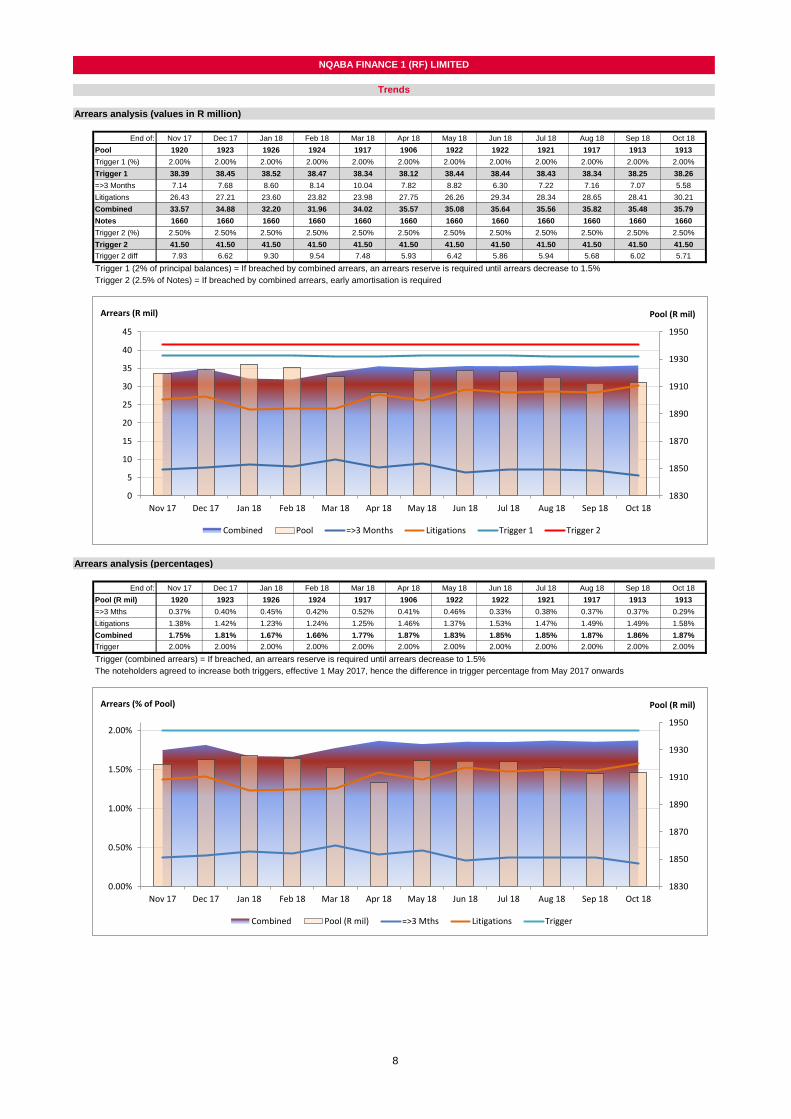
Arrears analysis (values in R million)
End of: Nov 17 Dec 17 Jan 18 Feb 18 Mar 18 Apr 18 May 18 Jun 18 Jul 18 Aug 18 Sep 18 Oct 18
Pool 1920 1923 1926 1924 1917 1906 1922 1922 1921 1917 1913 1913
Trigger 1 (%) 2.00% 2.00% 2.00% 2.00% 2.00% 2.00% 2.00% 2.00% 2.00% 2.00% 2.00% 2.00%
Trigger 1 38.39 38.45 38.52 38.47 38.34 38.12 38.44 38.44 38.43 38.34 38.25 38.26
=>3 Months 7.14 7.68 8.60 8.14 10.04 7.82 8.82 6.30 7.22 7.16 7.07 5.58
Litigations 26.43 27.21 23.60 23.82 23.98 27.75 26.26 29.34 28.34 28.65 28.41 30.21
Combined 33.57 34.88 32.20 31.96 34.02 35.57 35.08 35.64 35.56 35.82 35.48 35.79
Notes 1660 1660 1660 1660 1660 1660 1660 1660 1660 1660 1660 1660
Trigger 2 (%) 2.50% 2.50% 2.50% 2.50% 2.50% 2.50% 2.50% 2.50% 2.50% 2.50% 2.50% 2.50%
Trigger 2 41.50 41.50 41.50 41.50 41.50 41.50 41.50 41.50 41.50 41.50 41.50 41.50
Trigger 2 diff 7.93 6.62 9.30 9.54 7.48 5.93 6.42 5.86 5.94 5.68 6.02 5.71
Trigger 1 (2% of principal balances) = If breached by combined arrears, an arrears reserve is required until arrears decrease to 1.5%
Trigger 2 (2.5% of Notes) = If breached by combined arrears, early amortisation is required
Arrears analysis (percentages)
End of: Nov 17 Dec 17 Jan 18 Feb 18 Mar 18 Apr 18 May 18 Jun 18 Jul 18 Aug 18 Sep 18 Oct 18
Pool (R mil) 1920 1923 1926 1924 1917 1906 1922 1922 1921 1917 1913 1913
=>3 Mths 0.37% 0.40% 0.45% 0.42% 0.52% 0.41% 0.46% 0.33% 0.38% 0.37% 0.37% 0.29%
Litigations 1.38% 1.42% 1.23% 1.24% 1.25% 1.46% 1.37% 1.53% 1.47% 1.49% 1.49% 1.58%
Combined 1.75% 1.81% 1.67% 1.66% 1.77% 1.87% 1.83% 1.85% 1.85% 1.87% 1.86% 1.87%
Trigger 2.00% 2.00% 2.00% 2.00% 2.00% 2.00% 2.00% 2.00% 2.00% 2.00% 2.00% 2.00%
Trigger (combined arrears) = If breached, an arrears reserve is required until arrears decrease to 1.5%
The noteholders agreed to increase both triggers, effective 1 May 2017, hence the difference in trigger percentage from May 2017 onwards
NQABA FINANCE 1 (RF) LIMITED
Trends
1830
1850
1870
1890
1910
1930
1950
0.00%
0.50%
1.00%
1.50%
2.00%
Nov 17 Dec 17 Jan 18 Feb 18 Mar 18 Apr 18 May 18 Jun 18 Jul 18 Aug 18 Sep 18 Oct 18
Pool (R mil)Arrears (% of Pool)
Combined Pool (R mil) =>3 Mths Litigations Trigger
1830
1850
1870
1890
1910
1930
1950
0
5
10
15
20
25
30
35
40
45
Nov 17 Dec 17 Jan 18 Feb 18 Mar 18 Apr 18 May 18 Jun 18 Jul 18 Aug 18 Sep 18 Oct 18
Pool (R mil)Arrears (R mil)
Combined Pool =>3 Months Litigations Trigger 1 Trigger 2
8
NQABA FINANCE 1 (RF) LIMITED
Trends
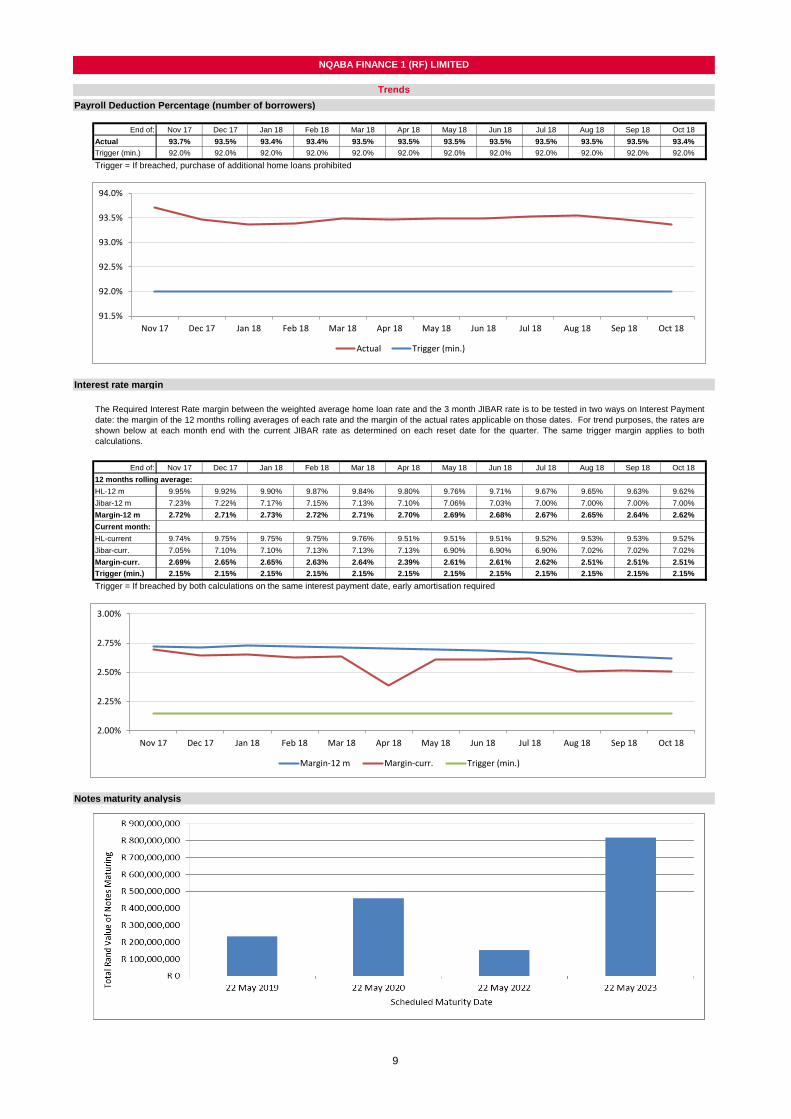
Payroll Deduction Percentage (number of borrowers)
End of: Nov 17 Dec 17 Jan 18 Feb 18 Mar 18 Apr 18 May 18 Jun 18 Jul 18 Aug 18 Sep 18 Oct 18
Actual 93.7% 93.5% 93.4% 93.4% 93.5% 93.5% 93.5% 93.5% 93.5% 93.5% 93.5% 93.4%
Trigger (min.) 92.0% 92.0% 92.0% 92.0% 92.0% 92.0% 92.0% 92.0% 92.0% 92.0% 92.0% 92.0%
Trigger = If breached, purchase of additional home loans prohibited
Interest rate margin
End of: Nov 17 Dec 17 Jan 18 Feb 18 Mar 18 Apr 18 May 18 Jun 18 Jul 18 Aug 18 Sep 18 Oct 18
12 months rolling average:
HL-12 m 9.95% 9.92% 9.90% 9.87% 9.84% 9.80% 9.76% 9.71% 9.67% 9.65% 9.63% 9.62%
Jibar-12 m 7.23% 7.22% 7.17% 7.15% 7.13% 7.10% 7.06% 7.03% 7.00% 7.00% 7.00% 7.00%
Margin-12 m 2.72% 2.71% 2.73% 2.72% 2.71% 2.70% 2.69% 2.68% 2.67% 2.65% 2.64% 2.62%
Current month:
HL-current 9.74% 9.75% 9.75% 9.75% 9.76% 9.51% 9.51% 9.51% 9.52% 9.53% 9.53% 9.52%
Jibar-curr. 7.05% 7.10% 7.10% 7.13% 7.13% 7.13% 6.90% 6.90% 6.90% 7.02% 7.02% 7.02%
Margin-curr. 2.69% 2.65% 2.65% 2.63% 2.64% 2.39% 2.61% 2.61% 2.62% 2.51% 2.51% 2.51%
Trigger (min.) 2.15% 2.15% 2.15% 2.15% 2.15% 2.15% 2.15% 2.15% 2.15% 2.15% 2.15% 2.15%
Trigger = If breached by both calculations on the same interest payment date, early amortisation required
Notes maturity analysis
The Required Interest Rate margin between the weighted average home loan rate and the 3 month JIBAR rate is to be tested in two ways on Interest Payment
date: the margin of the 12 months rolling averages of each rate and the margin of the actual rates applicable on those dates. For trend purposes, the rates are
shown below at each month end with the current JIBAR rate as determined on each reset date for the quarter. The same trigger margin applies to both
calculations.
91.5%
92.0%
92.5%
93.0%
93.5%
94.0%
Nov 17 Dec 17 Jan 18 Feb 18 Mar 18 Apr 18 May 18 Jun 18 Jul 18 Aug 18 Sep 18 Oct 18
Actual Trigger (min.)
2.00%
2.25%
2.50%
2.75%
3.00%
Nov 17 Dec 17 Jan 18 Feb 18 Mar 18 Apr 18 May 18 Jun 18 Jul 18 Aug 18 Sep 18 Oct 18
Margin-12 m Margin-curr. Trigger (min.)
9
NQABA FINANCE 1 (RF) LIMITED
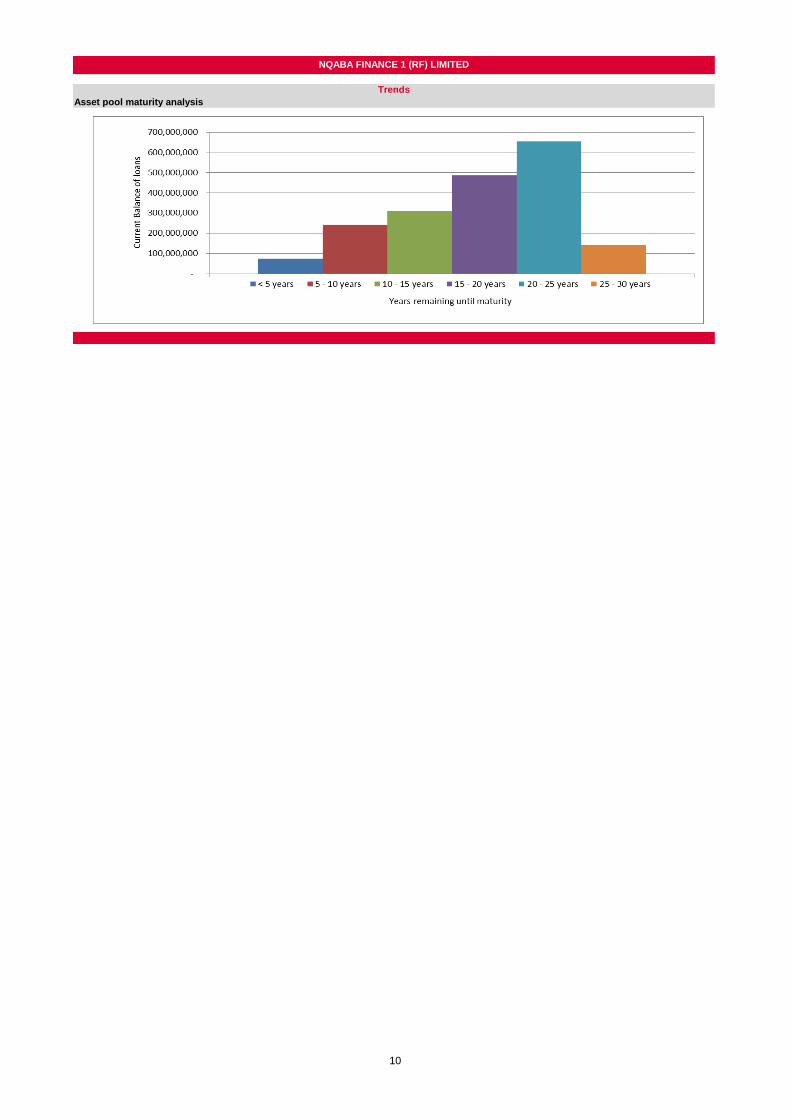
Trends
Asset pool maturity analysis
10

10/31/2018
Class
number
JSE
stock
code ISIN Issue date
Scheduled
maturity and
step-up date
Legal final
maturity
date
Tranche balance at
transaction close
Subsequent
tranches issued
Tranches
redeemed on
scheduled
maturity dates
Tranche
balance at end
of period
Original
rating at
issue date
Current rating
(31/05/2016)
Remaining
life on
scheduled
maturity
(years) Weighted
R R R R
A1 NQF1A1 ZAG000030701 31/05/2006 22/05/2009 22/05/2041 696,000,000 (696,000,000) - AAA(zaf)
A2 NQF1A2 ZAG000030735 31/05/2006 22/05/2011 22/05/2043 376,000,000 (376,000,000) - AAA(zaf)
A3 NQF1A3 ZAG000030685 31/05/2006 22/05/2011 22/05/2043 320,000,000 (320,000,000) - AAA(zaf)
A4 NQF1A4 ZAG000044520 28/09/2007 22/05/2010 22/05/2042 304,000,000 (304,000,000) - AAA(zaf)
A5 NQF1A5 ZAG000067760 22/05/2009 22/05/2010 22/05/2042 696,000,000 (696,000,000) - AAA(zaf)
A6 NQF1A6 ZAG000077546 24/05/2010 22/05/2011 22/05/2043 100,000,000 (100,000,000) - AAA(zaf)
A7 NQF1A7 ZAG000077553 24/05/2010 22/11/2011 22/11/2043 375,000,000 (375,000,000) - AAA(zaf)
A8 NQF1A8 ZAG000077561 24/05/2010 22/05/2012 22/05/2044 30,000,000 (30,000,000) - AAA(zaf)
A9 NQF1A9 ZAG000077579 24/05/2010 22/05/2013 22/05/2045 127,000,000 (127,000,000) - AAA(zaf)
A10 NQ1A10 ZAG000077686 24/05/2010 22/05/2020 22/05/2052 115,000,000 115,000,000 AAA(zaf) A1(sf) / Aaa.za(sf) 1.56 0.11
A11 NQ1A11 ZAG000085853 23/05/2011 22/05/2016 22/05/2048 205,000,000 (205,000,000) - AAA(zaf)
A12 NQ1A12 ZAG000085879 23/05/2011 22/05/2014 22/05/2046 318,000,000 (318,000,000) - AAA(zaf)
A13 NQ1A13 ZAG000085887 23/05/2011 22/05/2012 22/05/2044 273,000,000 (273,000,000) - AAA(zaf)
A14 NQ1A14 ZAG000090648 22/11/2011 22/05/2013 22/05/2045 375,000,000 (375,000,000) - AAA(zaf)
A15 NQ1A15 ZAG000095258 22/05/2012 22/05/2015 22/05/2047 303,000,000 (303,000,000) - AAA(zaf)
A16 NQ1A16 ZAG000105933 22/05/2013 22/05/2016 22/05/2048 200,000,000 (200,000,000) - AAA(zaf)
A18 NQ1A18 ZAG000115569 22/05/2014 22/05/2017 22/05/2049 318,000,000 (318,000,000) - AAA(zaf)
A19 NQ1A19 ZAG000126509 22/05/2015 22/05/2018 22/05/2050 303,000,000 (303,000,000) - AAA(zaf)
A21 NQ1A21 ZAG000136664 23/05/2016 22/05/2019 22/05/2051 210,000,000 210,000,000 AAA(zaf) A1(sf) / Aaa.za(sf) 0.56 0.07
A22 NQ1A22 ZAG000136722 22/05/2015 22/05/2017 22/05/2049 195,000,000 (195,000,000) - AAA(zaf)
A23 NQ1A23 ZAG000143983 22/05/2017 22/05/2018 22/05/2050 5,000,000 (5,000,000) - AAA(zaf)
A24 NQ1A24 ZAG000143991 22/05/2017 22/05/2020 22/05/2052 310,000,000 310,000,000 AAA(zaf) Aaa.za(sf) 1.56 0.29
A25 NQ1A25 ZAG000144007 22/05/2017 22/05/2022 22/05/2054 150,000,000 150,000,000 AAA(zaf) Aaa.za(sf) 3.56 0.32
A26 NQ1A26 ZAG000144155 22/05/2017 22/05/2018 22/05/2050 48,000,000 (48,000,000) - AAA(zaf) Aaa.za(sf)
A27 NQ1A27 ZAG000151531 22/05/2018 22/05/2023 22/05/2055 658,000,000 658,000,000 AAA(zaf) Aaa.za(sf) 4.56 1.81
Totals Class A 1,392,000,000 5,618,000,000 (5,567,000,000) 1,443,000,000
B1 NQF1B1 ZAG000030719 31/05/2006 22/05/2009 22/05/2041 32,000,000 (32,000,000) - AA(zaf)
B2 NQF1B2 ZAG000030743 31/05/2006 22/05/2011 22/05/2043 32,000,000 (32,000,000) - AA(zaf)
B3 NQF1B3 ZAG000044538 28/09/2007 22/05/2010 22/05/2042 14,000,000 (14,000,000) - AA(zaf)
B5 NQF1B5 ZAG000067778 22/05/2009 22/05/2010 22/05/2042 32,000,000 (32,000,000) - AA(zaf)
B6 NQF1B6 ZAG000077587 24/05/2010 22/05/2011 22/05/2043 8,000,000 (8,000,000) - AA(zaf)
B7 NQF1B7 ZAG000077595 24/05/2010 22/11/2011 22/11/2043 10,000,000 (10,000,000) - AA(zaf)
B9 NQF1B9 ZAG000077611 24/05/2010 22/05/2013 22/05/2045 30,000,000 (30,000,000) - AA(zaf)
B10 NQ1B10 ZAG000077702 24/05/2010 22/05/2020 22/05/2052 11,000,000 11,000,000 AA(zaf) A3(sf) / Aaa.za(sf) 1.56 0.01
B11 NQ1B11 ZAG000085861 23/05/2011 22/05/2014 22/05/2046 32,000,000 (32,000,000) - AA(zaf)
B12 NQ1B12 ZAG000085895 23/05/2011 22/05/2012 22/05/2044 8,000,000 (8,000,000) - AA(zaf)
B13 NQ1B13 ZAG000090655 22/11/2011 22/05/2013 22/05/2045 10,000,000 (10,000,000) - AA(zaf)
B14 NQ1B14 ZAG000095266 22/05/2012 22/05/2015 22/05/2047 8,000,000 (8,000,000) - AA(zaf)
B15 NQ1B15 ZAG000105966 22/05/2013 22/05/2018 22/05/2050 40,000,000 (40,000,000) - AA(zaf) A3(sf) / Aaa.za(sf)
B16 NQ1B16 ZAG000115577 22/05/2014 22/05/2017 22/05/2049 32,000,000 (32,000,000) - AA(zaf)
B17 NQ1B17 ZAG000126467 22/05/2015 22/05/2020 22/05/2050 8,000,000 8,000,000 AA(zaf) A3(sf) / Aaa.za(sf) 1.56 0.01
B19 NQ1B19 Private placement 22/05/2017 22/05/2018 22/05/2050 32,000,000 (32,000,000) - AAA(zaf) Aaa.za(sf)
B20 NQ1B20 ZAG000151549 22/05/2018 22/05/2023 22/05/2055 159,000,000 159,000,000 AAA(zaf) Aaa.za(sf) 4.56 0.44
Totals Class B 64,000,000 434,000,000 (320,000,000) 178,000,000
C1 NQF1C1 ZAG000030693 31/05/2006 22/05/2009 22/05/2041 32,000,000 (32,000,000) - A(zaf)
C2 NQF1C2 ZAG000030727 31/05/2006 22/05/2011 22/05/2043 32,000,000 (32,000,000) - A(zaf)
C3 NQF1C3 ZAG000044546 28/09/2007 22/05/2010 22/05/2042 14,000,000 (14,000,000) - A(zaf)
C5 NQF1C5 ZAG000067778 22/05/2009 22/05/2010 22/05/2042 32,000,000 (32,000,000) - A(zaf)
C6 NQF1C6 ZAG000077629 24/05/2010 22/05/2011 22/05/2043 5,000,000 (5,000,000) - A(zaf)
C7 NQF1C7 ZAG000077637 24/05/2010 22/11/2011 22/11/2043 13,000,000 (13,000,000) - A(zaf)
C9 NQF1C9 ZAG000077652 24/05/2010 22/05/2013 22/05/2045 12,000,000 (12,000,000) - A(zaf)
C10 NQ1C10 ZAG000077694 24/05/2010 22/05/2020 22/05/2052 5,000,000 5,000,000 A(zaf) Baa1(sf) / Aaa.za(sf) 1.56 0.00
C11 NQ1C11 ZAG000085903 23/05/2011 22/05/2014 22/05/2046 32,000,000 (32,000,000) - A(zaf)
C12 NQ1C12 ZAG000085911 23/05/2011 22/05/2012 22/05/2044 5,000,000 (5,000,000) - A(zaf)
C13 NQ1C13 ZAG000090630 22/11/2011 22/05/2013 22/05/2045 13,000,000 (13,000,000) - A(zaf)
C14 NQ1C14 ZAG000095241 22/05/2012 22/05/2015 22/05/2047 5,000,000 (5,000,000) - A+(zaf)
C15 NQ1C15 ZAG000105958 22/05/2013 22/05/2018 22/05/2050 25,000,000 (25,000,000) - A+(zaf) Baa1(sf) / Aaa.za(sf)
C16 NQ1C16 ZAG000115585 22/05/2014 22/05/2017 22/05/2049 32,000,000 (32,000,000) - A+(zaf) -
C17 NQ1C17 ZAG000126459 22/05/2015 22/05/2020 22/05/2050 5,000,000 5,000,000 A+(zaf) Baa1(sf) / Aaa.za(sf) 1.56 0.00
C19 NQ1C19 Private placement 22/05/2017 22/05/2018 22/05/2050 32,000,000 (32,000,000) - AAA(zaf) Aaa.za(sf)
Totals Class C 64,000,000 230,000,000 (284,000,000) 10,000,000
D1 NQF1D1 ZAG000030750 31/05/2006 22/05/2009 22/05/2041 24,000,000 (24,000,000) - BBB(zaf)
D2 NQF1D2 ZAG000030677 31/05/2006 22/05/2011 22/05/2043 24,000,000 (24,000,000) - BBB(zaf)
D3 NQF1D3 ZAG000044553 28/09/2007 22/05/2010 22/05/2042 11,000,000 (11,000,000) - BBB(zaf)
D4 NQF1D4 ZAG000077660 24/05/2010 22/05/2013 22/05/2045 30,000,000 (30,000,000) - BBB(zaf)
D5 NQF1D5 ZAG000077678 24/05/2010 22/05/2020 22/05/2052 5,000,000 5,000,000 BBB(zaf) Baa2(sf) / Aa1.za(sf) 1.56 0.00
D6 NQF1D6 ZAG000085929 23/05/2011 22/05/2016 22/05/2048 24,000,000 (24,000,000) - BBB(zaf)
D7 NQF1D7 ZAG000105974 22/05/2013 22/05/2018 22/05/2050 30,000,000 (30,000,000) - A-(zaf) Baa2(sf) / Aa1.za(sf)
D8 NQF1D8 ZAG000136656 23/05/2016 22/05/2019 22/05/2051 24,000,000 24,000,000 A-(zaf) Baa2(sf) / Aa1.za(sf) 0.56 0.01
Totals Class D 48,000,000 124,000,000 (143,000,000) 29,000,000
Totals all Notes 1,568,000,000 6,406,000,000 (6,314,000,000) 1,660,000,000 3.07
Pool factor: As all notes are bullet profile, the pool factor on each is 1 until redemption.
NQABA FINANCE 1 (RF) LIMITED
Cumulative Note details to Interest payment date 22/11/2018
11
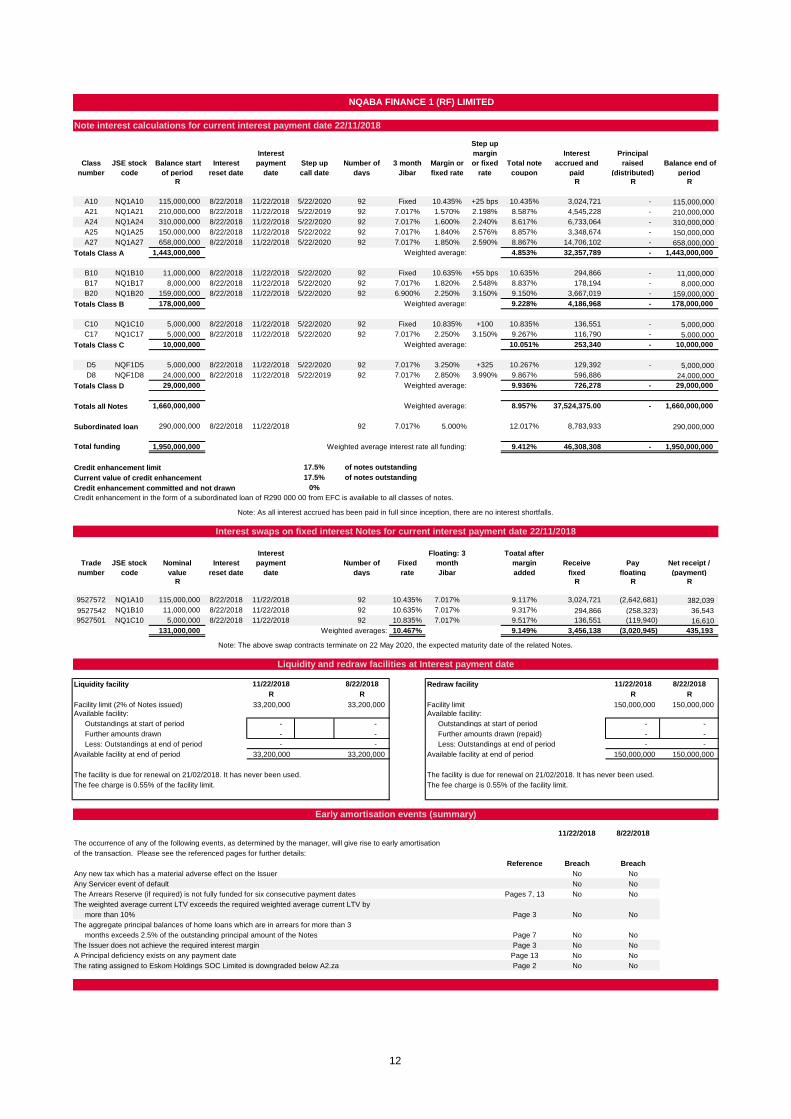
Note interest calculations for current interest payment date 22/11/2018
Class
number
JSE stock
code
Balance start
of period
Interest
reset date
Interest
payment
date
Step up
call date
Number of
days
3 month
Jibar
Margin or
fixed rate
Step up
margin
or fixed
rate
Total note
coupon
Interest
accrued and
paid
Principal
raised
(distributed)
Balance end of
period
R R R R
A10 NQ1A10 115,000,000 8/22/2018 11/22/2018 5/22/2020 92 Fixed 10.435% +25 bps 10.435% 3,024,721 - 115,000,000
A21 NQ1A21 210,000,000 8/22/2018 11/22/2018 5/22/2019 92 7.017% 1.570% 2.198% 8.587% 4,545,228 - 210,000,000
A24 NQ1A24 310,000,000 8/22/2018 11/22/2018 5/22/2020 92 7.017% 1.600% 2.240% 8.617% 6,733,064 - 310,000,000
A25 NQ1A25 150,000,000 8/22/2018 11/22/2018 5/22/2022 92 7.017% 1.840% 2.576% 8.857% 3,348,674 - 150,000,000
A27 NQ1A27 658,000,000 8/22/2018 11/22/2018 5/22/2020 92 7.017% 1.850% 2.590% 8.867% 14,706,102 - 658,000,000
Totals Class A 1,443,000,000 Weighted average: 4.853% 32,357,789 - 1,443,000,000
B10 NQ1B10 11,000,000 8/22/2018 11/22/2018 5/22/2020 92 Fixed 10.635% +55 bps 10.635% 294,866 - 11,000,000
B17 NQ1B17 8,000,000 8/22/2018 11/22/2018 5/22/2020 92 7.017% 1.820% 2.548% 8.837% 178,194 - 8,000,000
B20 NQ1B20 159,000,000 8/22/2018 11/22/2018 5/22/2020 92 6.900% 2.250% 3.150% 9.150% 3,667,019 - 159,000,000
Totals Class B 178,000,000 Weighted average: 9.228% 4,186,968 - 178,000,000
C10 NQ1C10 5,000,000 8/22/2018 11/22/2018 5/22/2020 92 Fixed 10.835% +100
bps
10.835% 136,551 - 5,000,000
C17 NQ1C17 5,000,000 8/22/2018 11/22/2018 5/22/2020 92 7.017% 2.250% 3.150% 9.267% 116,790 - 5,000,000
Totals Class C 10,000,000 Weighted average: 10.051% 253,340 - 10,000,000
D5 NQF1D5 5,000,000 8/22/2018 11/22/2018 5/22/2020 92 7.017% 3.250% +325
bps
10.267% 129,392 - 5,000,000
D8 NQF1D8 24,000,000 8/22/2018 11/22/2018 5/22/2019 92 7.017% 2.850% 3.990% 9.867% 596,886 24,000,000
Totals Class D 29,000,000 Weighted average: 9.936% 726,278 - 29,000,000
Totals all Notes 1,660,000,000 Weighted average: 8.957% 37,524,375.00 - 1,660,000,000
Subordinated loan 290,000,000 8/22/2018 11/22/2018 92 7.017% 5.000% 12.017% 8,783,933 290,000,000
Total funding 1,950,000,000 Weighted average interest rate all funding: 9.412% 46,308,308 - 1,950,000,000
Credit enhancement limit 17.5%
Current value of credit enhancement 17.5%
Credit enhancement committed and not drawn 0%
Trade
number
JSE stock
code
Nominal
value
Interest
reset date
Interest
payment
date
Number of
days
Fixed
rate
Floating: 3
month
Jibar
Toatal after
margin
added
Receive
fixed
Pay
floating
Net receipt /
(payment)
R R R R
9527572 NQ1A10 115,000,000 8/22/2018 11/22/2018 92 10.435% 7.017% 9.117% 3,024,721 (2,642,681) 382,039
9527542 NQ1B10 11,000,000 8/22/2018 11/22/2018 92 10.635% 7.017% 9.317% 294,866 (258,323) 36,543
9527501 NQ1C10 5,000,000 8/22/2018 11/22/2018 92 10.835% 7.017% 9.517% 136,551 (119,940) 16,610
131,000,000 Weighted averages: 10.467% 9.149% 3,456,138 (3,020,945) 435,193
Liquidity facility 11/22/2018 8/22/2018 Redraw facility 11/22/2018 8/22/2018
R R R R
Facility limit (2% of Notes issued) 33,200,000 33,200,000 Facility limit 150,000,000 150,000,000
Available facility: Available facility:
Outstandings at start of period - - Outstandings at start of period - -
Further amounts drawn - - Further amounts drawn (repaid) - -
Less: Outstandings at end of period - - Less: Outstandings at end of period - -
Available facility at end of period 33,200,000 33,200,000 Available facility at end of period 150,000,000 150,000,000
The facility is due for renewal on 21/02/2018. It has never been used. The facility is due for renewal on 21/02/2018. It has never been used.
The fee charge is 0.55% of the facility limit. The fee charge is 0.55% of the facility limit.
11/22/2018 8/22/2018
The occurrence of any of the following events, as determined by the manager, will give rise to early amortisation
of the transaction. Please see the referenced pages for further details:
Reference Breach Breach
Any new tax which has a material adverse effect on the Issuer No No
Any Servicer event of default No No
The Arrears Reserve (if required) is not fully funded for six consecutive payment dates Pages 7, 13 No No
The weighted average current LTV exceeds the required weighted average current LTV by
more than 10% Page 3
The aggregate principal balances of home loans which are in arrears for more than 3
months exceeds 2.5% of the outstanding principal amount of the Notes Page 7 No No
The Issuer does not achieve the required interest margin Page 3 No No
A Principal deficiency exists on any payment date Page 13 No No
The rating assigned to Eskom Holdings SOC Limited is downgraded below A2.za Page 2 No No
NQABA FINANCE 1 (RF) LIMITED
Credit enhancement in the form of a subordinated loan of R290 000 00 from EFC is available to all classes of notes.
of notes outstanding
of notes outstanding
Interest swaps on fixed interest Notes for current interest payment date 22/11/2018
Note: The above swap contracts terminate on 22 May 2020, the expected maturity date of the related Notes.
Note: As all interest accrued has been paid in full since inception, there are no interest shortfalls.
No No
Early amortisation events (summary)
Liquidity and redraw facilities at Interest payment date
12
11/22/2018 8/22/2018
R R
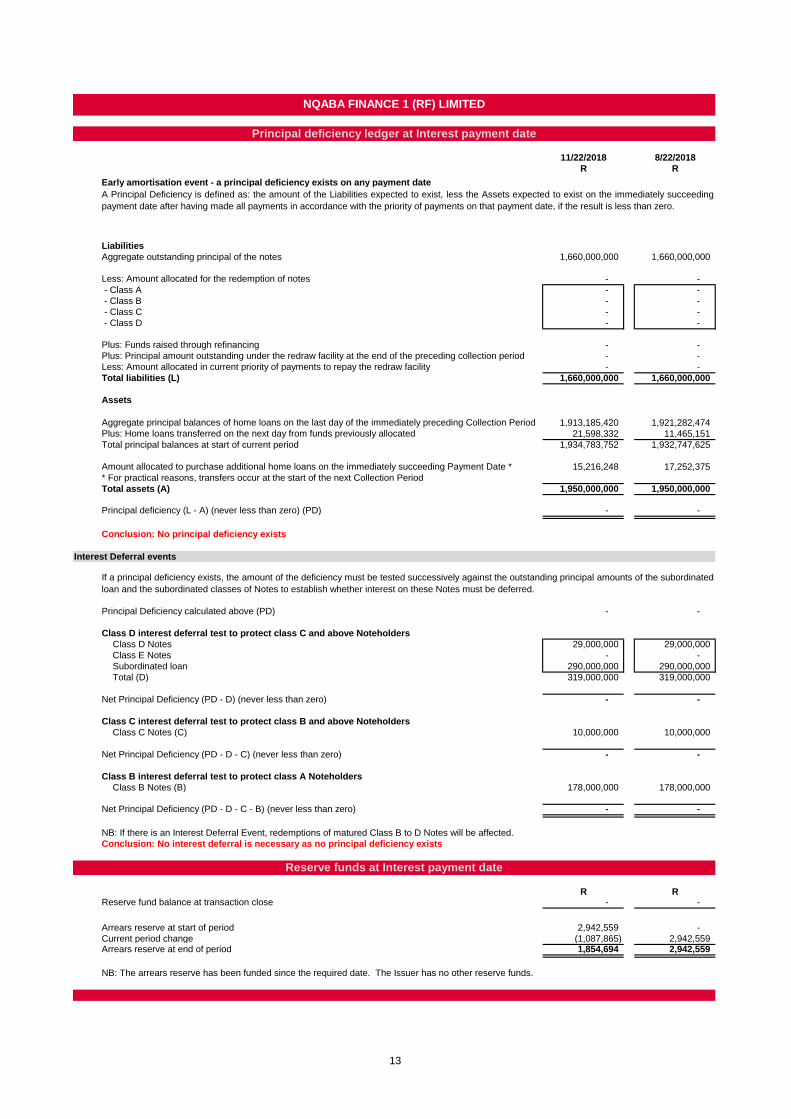
Early amortisation event - a principal deficiency exists on any payment date
Liabilities
Aggregate outstanding principal of the notes 1,660,000,000 1,660,000,000
Less: Amount allocated for the redemption of notes - -
- Class A - -
- Class B - -
- Class C - -
- Class D - -
Plus: Funds raised through refinancing - - Plus: Principal amount outstanding under the redraw facility at the end of the preceding collection period - - Less: Amount allocated in current priority of payments to repay the redraw facility - -
Total liabilities (L) 1,660,000,000 1,660,000,000
Assets
Aggregate principal balances of home loans on the last day of the immediately preceding Collection Period 1,913,185,420 1,921,282,474 Plus: Home loans transferred on the next day from funds previously allocated 21,598,332 11,465,151
Total principal balances at start of current period 1,934,783,752 1,932,747,625
Amount allocated to purchase additional home loans on the immediately succeeding Payment Date * 15,216,248 17,252,375
* For practical reasons, transfers occur at the start of the next Collection Period
Total assets (A) 1,950,000,000 1,950,000,000
Principal deficiency (L - A) (never less than zero) (PD) - -
Conclusion: No principal deficiency exists
Interest Deferral events
Principal Deficiency calculated above (PD) - -
Class D interest deferral test to protect class C and above Noteholders
Class D Notes 29,000,000 29,000,000
Class E Notes - -
Subordinated loan 290,000,000 290,000,000
Total (D) 319,000,000 319,000,000
Net Principal Deficiency (PD - D) (never less than zero) - -
Class C interest deferral test to protect class B and above Noteholders
Class C Notes (C) 10,000,000 10,000,000
Net Principal Deficiency (PD - D - C) (never less than zero) - -
Class B interest deferral test to protect class A Noteholders
Class B Notes (B) 178,000,000 178,000,000
Net Principal Deficiency (PD - D - C - B) (never less than zero) - -
NB: If there is an Interest Deferral Event, redemptions of matured Class B to D Notes will be affected.
Conclusion: No interest deferral is necessary as no principal deficiency exists
R RReserve fund balance at transaction close - -
Arrears reserve at start of period 2,942,559 -
Current period change (1,087,865) 2,942,559 Arrears reserve at end of period 1,854,694 2,942,559
NB: The arrears reserve has been funded since the required date. The Issuer has no other reserve funds.
A Principal Deficiency is defined as: the amount of the Liabilities expected to exist, less the Assets expected to exist on the immediately succeeding
payment date after having made all payments in accordance with the priority of payments on that payment date, if the result is less than zero.
NQABA FINANCE 1 (RF) LIMITED
Principal deficiency ledger at Interest payment date
Reserve funds at Interest payment date
If a principal deficiency exists, the amount of the deficiency must be tested successively against the outstanding principal amounts of the subordinated
loan and the subordinated classes of Notes to establish whether interest on these Notes must be deferred.
13
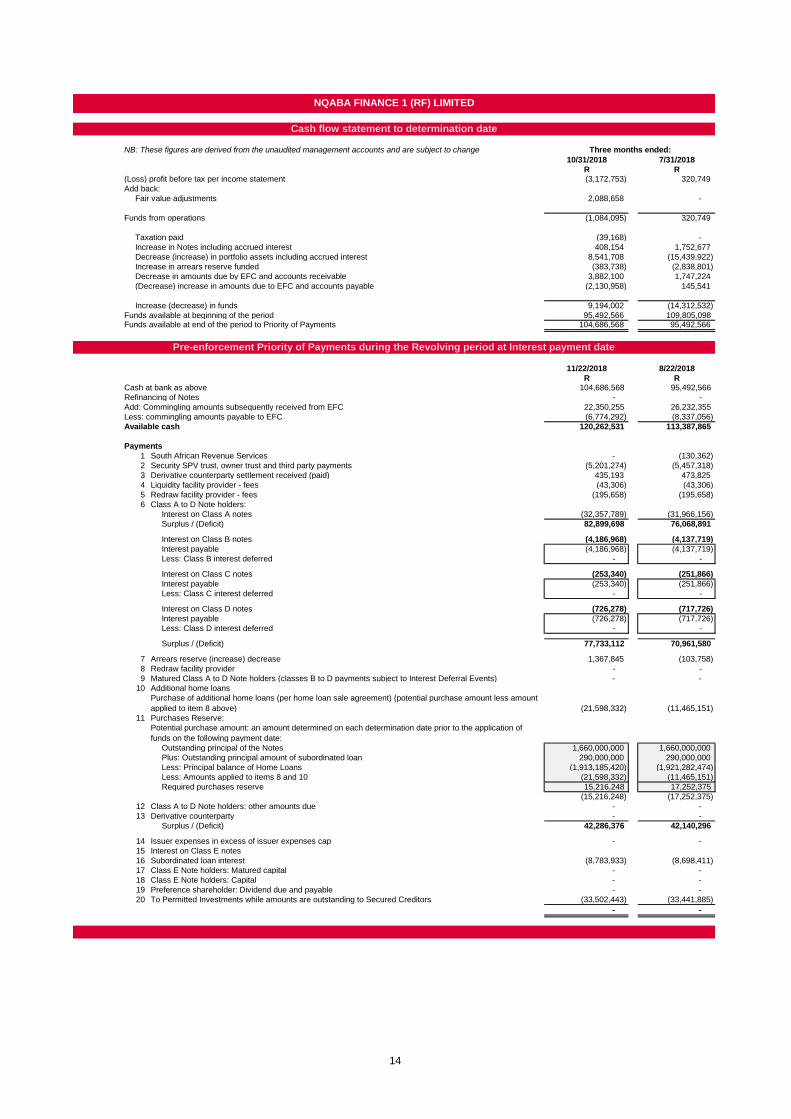
NB: These figures are derived from the unaudited management accounts and are subject to change
10/31/2018 7/31/2018
R R(Loss) profit before tax per income statement (3,172,753) 320,749
Add back:
Fair value adjustments 2,088,658 -
Funds from operations (1,084,095) 320,749
Taxation paid (39,168) -
Increase in Notes including accrued interest 408,154 1,752,677
Decrease (increase) in portfolio assets including accrued interest 8,541,708 (15,439,922)
Increase in arrears reserve funded (383,738) (2,838,801)
Decrease in amounts due by EFC and accounts receivable 3,882,100 1,747,224
(Decrease) increase in amounts due to EFC and accounts payable (2,130,958) 145,541
Increase (decrease) in funds 9,194,002 (14,312,532)
Funds available at beginning of the period 95,492,566 109,805,098 Funds available at end of the period to Priority of Payments 104,686,568 95,492,566
11/22/2018 8/22/2018
R RCash at bank as above 104,686,568 95,492,566
Refinancing of Notes - -
Add: Commingling amounts subsequently received from EFC 22,350,255 26,232,355
Less: commingling amounts payable to EFC (6,774,292) (8,337,056)
Available cash 120,262,531 113,387,865
Payments
1 South African Revenue Services - (130,362)
2 Security SPV trust, owner trust and third party payments (5,201,274) (5,457,318)
3 Derivative counterparty settlement received (paid) 435,193 473,825
4 Liquidity facility provider - fees (43,306) (43,306)
5 Redraw facility provider - fees (195,658) (195,658)
6 Class A to D Note holders:
Interest on Class A notes (32,357,789) (31,966,156)
Surplus / (Deficit) 82,899,698 76,068,891
Interest on Class B notes (4,186,968) (4,137,719)
Interest payable (4,186,968) (4,137,719)
Less: Class B interest deferred - -
Interest on Class C notes (253,340) (251,866)
Interest payable (253,340) (251,866)
Less: Class C interest deferred - -
Interest on Class D notes (726,278) (717,726)
Interest payable (726,278) (717,726)
Less: Class D interest deferred - -
Surplus / (Deficit) 77,733,112 70,961,580
7 Arrears reserve (increase) decrease 1,367,845 (103,758)
8 Redraw facility provider - -
9 Matured Class A to D Note holders (classes B to D payments subject to Interest Deferral Events) - -
10 Additional home loans
Purchase of additional home loans (per home loan sale agreement) (potential purchase amount less amount
applied to item 8 above) (21,598,332) (11,465,151)
11 Purchases Reserve:
Potential purchase amount: an amount determined on each determination date prior to the application of
funds on the following payment date:
Outstanding principal of the Notes 1,660,000,000 1,660,000,000
Plus: Outstanding principal amount of subordinated loan 290,000,000 290,000,000
Less: Principal balance of Home Loans (1,913,185,420) (1,921,282,474)
Less: Amounts applied to items 8 and 10 (21,598,332) (11,465,151)
Required purchases reserve 15,216,248 17,252,375
(15,216,248) (17,252,375)
12 Class A to D Note holders: other amounts due - -
13 Derivative counterparty - -
Surplus / (Deficit) 42,286,376 42,140,296
14 Issuer expenses in excess of issuer expenses cap - -
15 Interest on Class E notes
16 Subordinated loan interest (8,783,933) (8,698,411)
17 Class E Note holders: Matured capital - -
18 Class E Note holders: Capital - -
19 Preference shareholder: Dividend due and payable - -
20 To Permitted Investments while amounts are outstanding to Secured Creditors (33,502,443) (33,441,885)
- -
Three months ended:
Pre-enforcement Priority of Payments during the Revolving period at Interest payment date
Cash flow statement to determination date
NQABA FINANCE 1 (RF) LIMITED
14
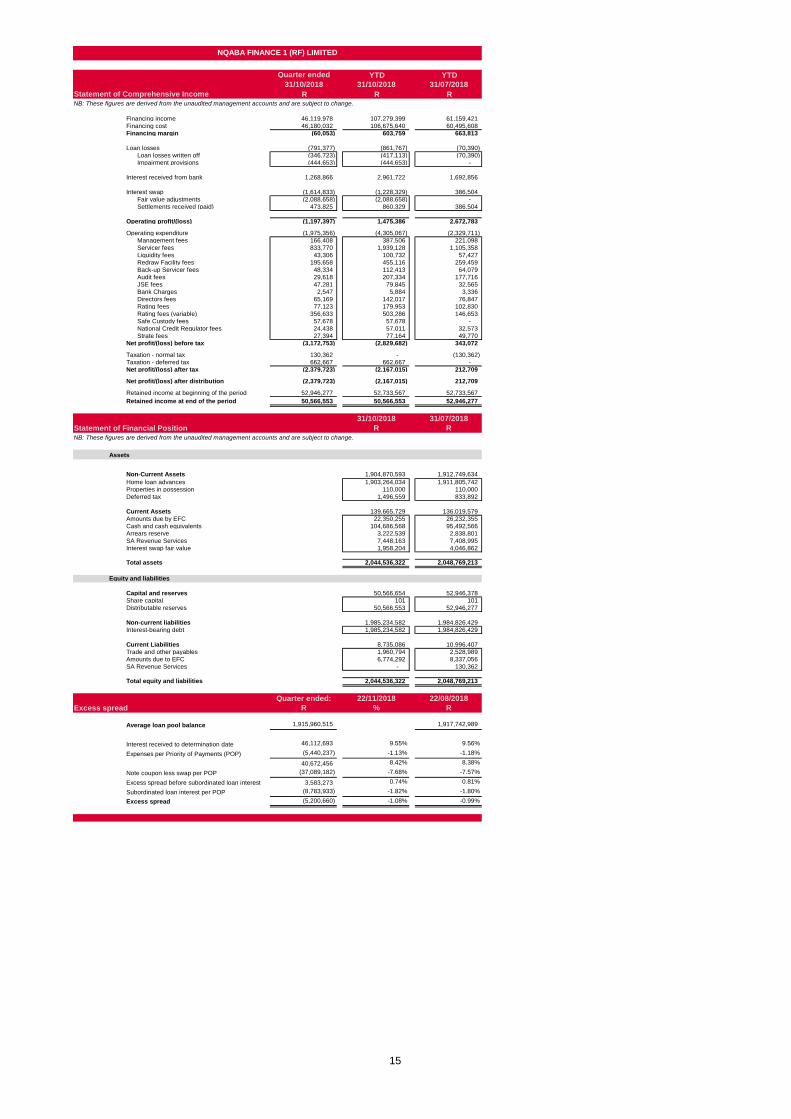
Quarter ended YTD YTD
31/10/2018 31/10/2018 31/07/2018
Statement of Comprehensive Income R R R NB: These figures are derived from the unaudited management accounts and are subject to change.
Financing income 46,119,978 107,279,399 61,159,421
Financing cost 46,180,032 106,675,640 60,495,608
Financing margin (60,053) 603,759 663,813
Loan losses (791,377) (861,767) (70,390)
Loan losses written off (346,723) (417,113) (70,390)
Impairment provisions (444,653) (444,653) -
Interest received from bank 1,268,866 2,961,722 1,692,856
Interest swap (1,614,833) (1,228,329) 386,504
Fair value adjustments (2,088,658) (2,088,658) -
Settlements received (paid) 473,825 860,329 386,504
Operating profit/(loss) (1,197,397) 1,475,386 2,672,783
Operating expenditure (1,975,356) (4,305,067) (2,329,711)
Management fees 166,408 387,506 221,098
Servicer fees 833,770 1,939,128 1,105,358
Liquidity fees 43,306 100,732 57,427
Redraw Facility fees 195,658 455,116 259,459
Back-up Servicer fees 48,334 112,413 64,079
Audit fees 29,618 207,334 177,716
JSE fees 47,281 79,845 32,565
Bank Charges 2,547 5,884 3,336
Directors fees 65,169 142,017 76,847
Rating fees 77,123 179,953 102,830
Rating fees (variable) 356,633 503,286 146,653
Safe Custody fees 57,678 57,678 -
National Credit Regulator fees 24,438 57,011 32,573
Strate fees 27,394 77,164 49,770
Net profit/(loss) before tax (3,172,753) (2,829,682) 343,072
Taxation - normal tax 130,362 - (130,362)
Taxation - deferred tax 662,667 662,667 -
Net profit/(loss) after tax (2,379,723) (2,167,015) 212,709
Net profit/(loss) after distribution (2,379,723) (2,167,015) 212,709
52,946,277 52,733,567 52,733,567
50,566,553 50,566,553 52,946,277
31/10/2018 31/07/2018
Statement of Financial Position R R
NB: These figures are derived from the unaudited management accounts and are subject to change.
Assets
Non-Current Assets 1,904,870,593 1,912,749,634
Home loan advances 1,903,264,034 1,911,805,742
Properties in possession 110,000 110,000
Deferred tax 1,496,559 833,892
Current Assets 139,665,729 136,019,579
Amounts due by EFC 22,350,255 26,232,355
Cash and cash equivalents 104,686,568 95,492,566
Arrears reserve 3,222,539 2,838,801
SA Revenue Services 7,448,163 7,408,995
Interest swap fair value 1,958,204 4,046,862
Total assets 2,044,536,322 2,048,769,213
Equity and liabilities
Capital and reserves 50,566,654 52,946,378
Share capital 101 101
Distributable reserves 50,566,553 52,946,277
Non-current liabilities 1,985,234,582 1,984,826,429
Interest-bearing debt 1,985,234,582 1,984,826,429
Current Liabilities 8,735,086 10,996,407
Trade and other payables 1,960,794 2,528,989
Amounts due to EFC 6,774,292 8,337,056
SA Revenue Services - 130,362
Total equity and liabilities 2,044,536,322 2,048,769,213
Quarter ended: 22/11/2018 22/08/2018
Excess spread R % R
Average loan pool balance 1,915,960,515 1,917,742,989
Interest received to determination date 46,112,693 9.55% 9.56%
Expenses per Priority of Payments (POP) (5,440,237) -1.13% -1.18%
40,672,456 8.42% 8.38%
Note coupon less swap per POP (37,089,182) -7.68% -7.57%
Excess spread before subordinated loan interest 3,583,273 0.74% 0.81%
Subordinated loan interest per POP (8,783,933) -1.82% -1.80%
Excess spread (5,200,660) -1.08% -0.99%
NQABA FINANCE 1 (RF) LIMITED
Retained income at beginning of the period
Retained income at end of the period
15
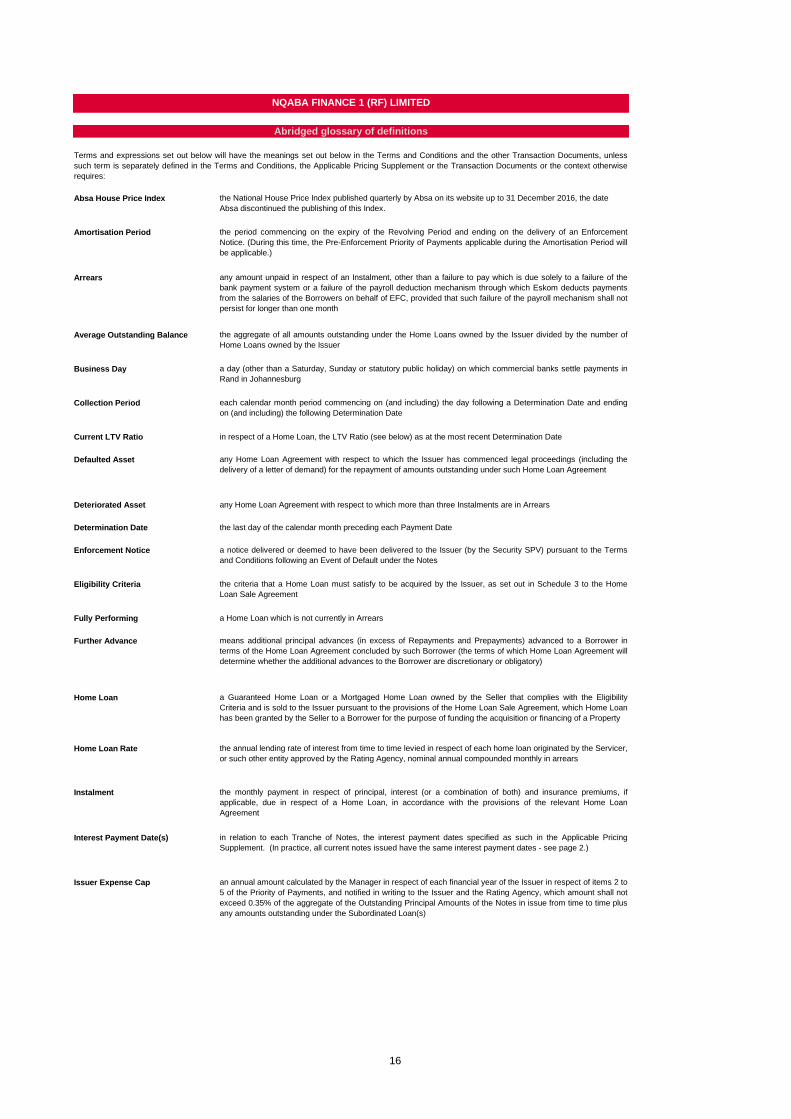
Absa House Price Index
Amortisation Period
Arrears
Average Outstanding Balance
Business Day
Collection Period
Current LTV Ratio in respect of a Home Loan, the LTV Ratio (see below) as at the most recent Determination Date
Defaulted Asset
Deteriorated Asset any Home Loan Agreement with respect to which more than three Instalments are in Arrears
Determination Date the last day of the calendar month preceding each Payment Date
Enforcement Notice
Eligibility Criteria
Fully Performing a Home Loan which is not currently in Arrears
Further Advance
Home Loan
Home Loan Rate
Instalment
Interest Payment Date(s)
Issuer Expense Cap
a notice delivered or deemed to have been delivered to the Issuer (by the Security SPV) pursuant to the Terms
and Conditions following an Event of Default under the Notes
a Guaranteed Home Loan or a Mortgaged Home Loan owned by the Seller that complies with the Eligibility
Criteria and is sold to the Issuer pursuant to the provisions of the Home Loan Sale Agreement, which Home Loan
has been granted by the Seller to a Borrower for the purpose of funding the acquisition or financing of a Property
NQABA FINANCE 1 (RF) LIMITED
Abridged glossary of definitions
the National House Price Index published quarterly by Absa on its website up to 31 December 2016, the date
Absa discontinued the publishing of this Index.
any amount unpaid in respect of an Instalment, other than a failure to pay which is due solely to a failure of the
bank payment system or a failure of the payroll deduction mechanism through which Eskom deducts payments
from the salaries of the Borrowers on behalf of EFC, provided that such failure of the payroll mechanism shall not
persist for longer than one month
an annual amount calculated by the Manager in respect of each financial year of the Issuer in respect of items 2 to
5 of the Priority of Payments, and notified in writing to the Issuer and the Rating Agency, which amount shall not
exceed 0.35% of the aggregate of the Outstanding Principal Amounts of the Notes in issue from time to time plus
any amounts outstanding under the Subordinated Loan(s)
Terms and expressions set out below will have the meanings set out below in the Terms and Conditions and the other Transaction Documents, unless
such term is separately defined in the Terms and Conditions, the Applicable Pricing Supplement or the Transaction Documents or the context otherwise
requires:
any Home Loan Agreement with respect to which the Issuer has commenced legal proceedings (including the
delivery of a letter of demand) for the repayment of amounts outstanding under such Home Loan Agreement
means additional principal advances (in excess of Repayments and Prepayments) advanced to a Borrower in
terms of the Home Loan Agreement concluded by such Borrower (the terms of which Home Loan Agreement will
determine whether the additional advances to the Borrower are discretionary or obligatory)
the annual lending rate of interest from time to time levied in respect of each home loan originated by the Servicer,
or such other entity approved by the Rating Agency, nominal annual compounded monthly in arrears
in relation to each Tranche of Notes, the interest payment dates specified as such in the Applicable Pricing
Supplement. (In practice, all current notes issued have the same interest payment dates - see page 2.)
the monthly payment in respect of principal, interest (or a combination of both) and insurance premiums, if
applicable, due in respect of a Home Loan, in accordance with the provisions of the relevant Home Loan
Agreement
the period commencing on the expiry of the Revolving Period and ending on the delivery of an Enforcement
Notice. (During this time, the Pre-Enforcement Priority of Payments applicable during the Amortisation Period will
be applicable.)
the aggregate of all amounts outstanding under the Home Loans owned by the Issuer divided by the number of
Home Loans owned by the Issuer
a day (other than a Saturday, Sunday or statutory public holiday) on which commercial banks settle payments in
Rand in Johannesburg
each calendar month period commencing on (and including) the day following a Determination Date and ending
on (and including) the following Determination Date
the criteria that a Home Loan must satisfy to be acquired by the Issuer, as set out in Schedule 3 to the Home
Loan Sale Agreement
16

NQABA FINANCE 1 (RF) LIMITED
Abridged glossary of definitions
Liquidity Facility
Liquidity Facility Limit
Liquidity Shortfall
LTV Ratio
Mandatory Redemption in part
(Amortisation Period)
Mandatory Redemption
following delivery of an
Enforcement Notice
Mortgage Bond
NACQ nominal annual compounded quarterly
Original LTV Ratio
Payment Date
Portfolio Covenants
Post-Enforcement Priority of
Payments
Potential Redraw Amount
Pre-Enforcement Priority of
Payments
Pre-Enforcement Priority of
Payments applicable during the
Amortisation Period
Pre-Enforcement Priority of
Payments applicable during the
Revolving Period
Prepayments
PTI Ratio
a committed Rand denominated short term loan facility, provided by the Liquidity Facility Provider in terms of the
Liquidity Facility Agreement
in respect of a Home Loan at any time, the aggregate monies which the Borrower is entitled to draw, and the
Home Loan Lender is obliged to advance, at such time in accordance with the provisions of the Home Loan
Agreement concluded by such Borrower
the order in which payments shall be made from the Transaction Account, after the delivery of an Enforcement
Notice, as set out in the Management Agreement
The Notes in all Tranches of Notes will be subject to mandatory redemption in part on each Interest Payment Date
during the Amortisation Period, in reducing order of rank (and pari passu if of equal rank) as determined by the
respective Classes of the Notes, to the extent permitted by and in accordance with the Priority of Payments
2% of the Outstanding Principal Amount of the Notes in issue from time to time, being the maximum aggregate
amount that can be drawn at any time under the Liquidity Facility
on any Payment Date, an amount equal to the sum of items 1 to 6 in the Pre-Enforcement Priority of Payments
applicable during the Revolving Period or an amount equal to the sum of items 1 to 6 in the Pre-Enforcement
Priority of Payments applicable during the Amortisation Period, as the case may be payable on such Payment
Date, less the cash available in the relevant Priority of Payments on such Payment Date to fund such expenses
in respect of a Home Loan, the loan to value ratio of such Home Loan, being the ratio of the total amount
outstanding under the Home Loan to the most recent value placed on the Property by an Accredited Valuer for the
purposes of valuing the Property relating to the relevant Home Loan
in respect of Mortgaged Home Loans, a first mortgage bond or sectional title bond on terms acceptable to the
Home Loan Lender, registered over the Property of the relevant Borrower in favour of the Home Loan Lender as
security for the obligations of such Borrower to the Home Loan Lender in relation to the Home Loan granted to
such Borrower
in respect of a Home Loan, the LTV Ratio as at origination of that Home Loan, or if such information is
unavailable, the greater of the Current LTV Ratio and the weighted average LTV Ratio in respect of Home Loans
where an Original LTV Ratio is available
the 22nd day of every month on which the Issuer pays, or makes provision for the payment of, amounts owing to
creditors of the Issuer
the criteria that the aggregate portfolio of Home Loans owned by the Issuer must satisfy, after the acquisition of
each Home Loan under the Home Loan Sale Agreement, as set out in Schedule 4 to the Home Loan Sale
Agreement
Upon the delivery of an Enforcement Notice (following the occurrence of an Event of Default), the Notes in all
Tranches of Notes will be immediately due and payable
the Pre-Enforcement Priority of Payments applicable during the Revolving Period and the Pre-Enforcement
Priority of Payments applicable during the Amortisation Period
the order in which payments shall be made from the Transaction Account during the Revolving Period and prior to
delivery of an Enforcement Notice pursuant to an Event of Default, as set out in the Management Agreement
principal repayments received under a Home Loan in excess of the minimum scheduled Instalments which a
Borrower is obliged to pay
payment to monthly income ratio, being the ratio of the minimum required Instalment payable under a Home Loan
Agreement to the combined gross monthly income of the Borrower concerned and such Borrower’s spouse and/or
live-in partner and/or any Surety for such Borrower or such other amount or person as the Rating Agency, upon
written request by the Issuer, confirms in writing will not adversely affect the then current Rating of the Notes
(which income comprises basic salary and travel allowance)
the order in which payments shall be made from the Transaction Account during the Amortisation Period and prior
to delivery of an Enforcement Notice pursuant to an Event of Default, as set out in the Management Agreement.
(See Mandatory Redemption in part above.)
17
NQABA FINANCE 1 (RF) LIMITED
Abridged glossary of definitions
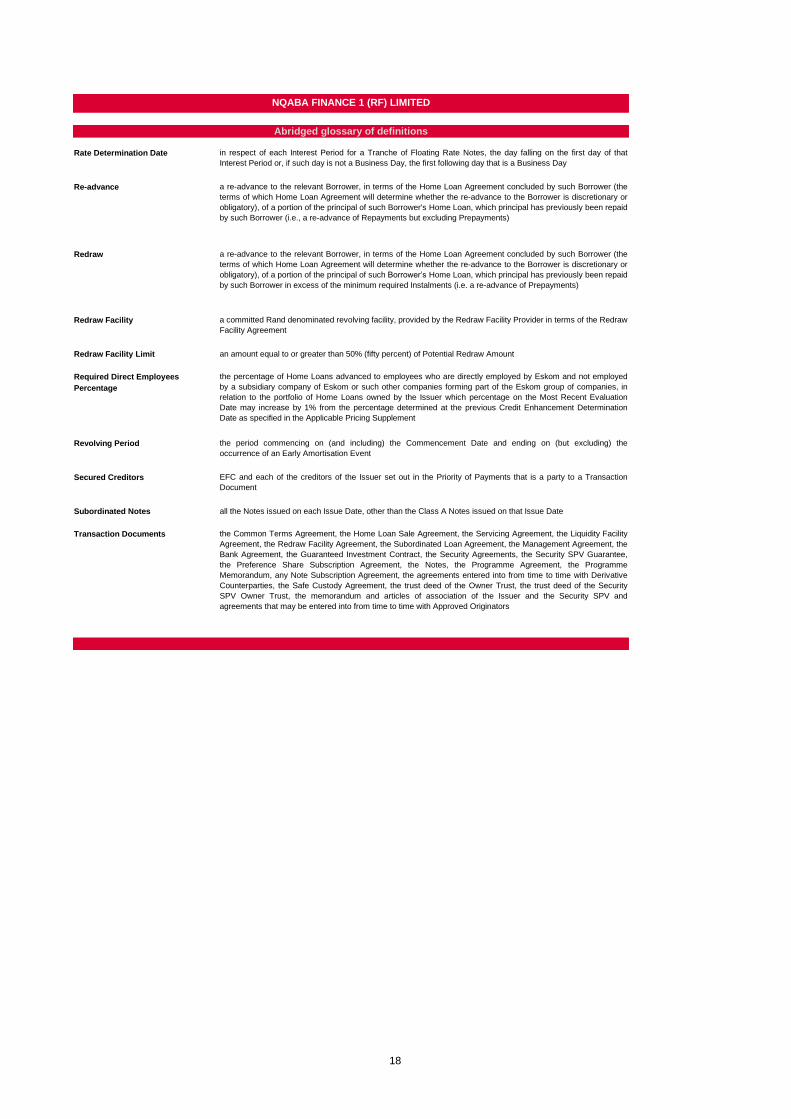
Rate Determination Date
Re-advance
Redraw
Redraw Facility
Redraw Facility Limit an amount equal to or greater than 50% (fifty percent) of Potential Redraw Amount
Required Direct Employees
Percentage
Revolving Period
Secured Creditors
Subordinated Notes all the Notes issued on each Issue Date, other than the Class A Notes issued on that Issue Date
Transaction Documents
the period commencing on (and including) the Commencement Date and ending on (but excluding) the
occurrence of an Early Amortisation Event
EFC and each of the creditors of the Issuer set out in the Priority of Payments that is a party to a Transaction
Document
the Common Terms Agreement, the Home Loan Sale Agreement, the Servicing Agreement, the Liquidity Facility
Agreement, the Redraw Facility Agreement, the Subordinated Loan Agreement, the Management Agreement, the
Bank Agreement, the Guaranteed Investment Contract, the Security Agreements, the Security SPV Guarantee,
the Preference Share Subscription Agreement, the Notes, the Programme Agreement, the Programme
Memorandum, any Note Subscription Agreement, the agreements entered into from time to time with Derivative
Counterparties, the Safe Custody Agreement, the trust deed of the Owner Trust, the trust deed of the Security
SPV Owner Trust, the memorandum and articles of association of the Issuer and the Security SPV and
agreements that may be entered into from time to time with Approved Originators
a re-advance to the relevant Borrower, in terms of the Home Loan Agreement concluded by such Borrower (the
terms of which Home Loan Agreement will determine whether the re-advance to the Borrower is discretionary or
obligatory), of a portion of the principal of such Borrower's Home Loan, which principal has previously been repaid
by such Borrower (i.e., a re-advance of Repayments but excluding Prepayments)
a re-advance to the relevant Borrower, in terms of the Home Loan Agreement concluded by such Borrower (the
terms of which Home Loan Agreement will determine whether the re-advance to the Borrower is discretionary or
obligatory), of a portion of the principal of such Borrower’s Home Loan, which principal has previously been repaid
by such Borrower in excess of the minimum required Instalments (i.e. a re-advance of Prepayments)
in respect of each Interest Period for a Tranche of Floating Rate Notes, the day falling on the first day of that
Interest Period or, if such day is not a Business Day, the first following day that is a Business Day
a committed Rand denominated revolving facility, provided by the Redraw Facility Provider in terms of the Redraw
Facility Agreement
the percentage of Home Loans advanced to employees who are directly employed by Eskom and not employed
by a subsidiary company of Eskom or such other companies forming part of the Eskom group of companies, in
relation to the portfolio of Home Loans owned by the Issuer which percentage on the Most Recent Evaluation
Date may increase by 1% from the percentage determined at the previous Credit Enhancement Determination
Date as specified in the Applicable Pricing Supplement
18