NPV Instructions for High Cost Pavement Treatments · SM018 NPV Instructions - 2 - Version 1 (June...
28
NPV Instructions for High Cost Pavement Treatments
-
Upload
vuongtuong -
Category
Documents
-
view
216 -
download
1
Transcript of NPV Instructions for High Cost Pavement Treatments · SM018 NPV Instructions - 2 - Version 1 (June...

NPV Instructions for High Cost Pavement Treatments

SM018 NPV Instructions
Table of Contents
1. Introduction to NPV...................................................................................................................... 1 1.1 Understanding the NPV Calculation ................................................................................. 3
2. Using the Right Data ................................................................................................................ 3
2.1 Site Information ................................................................................................................. 3 2.2 Understanding Maintenance History ................................................................................. 4
2.3 Year 0 Maintenance Quantities ......................................................................................... 4
2.4 Assessment of Year 1 Maintenance .................................................................................. 5
2.5 Future Maintenance Costs ................................................................................................. 5
2.5.1 Pre-Rehabilitation Maintenance Projection .................................................................... 5
2.5.2 Post-Renewal Maintenance Prediction ........................................................................... 6
3. Selecting the Right Options ...................................................................................................... 7
3.1 Do Minimum ..................................................................................................................... 7 3.2 Heavy Maintenance ........................................................................................................... 7
3.3 Renewal ............................................................................................................................. 8
3.4 Post Renewal Treatment Options and Timing .................................................................. 9
4. Travel Time Delay Costs .......................................................................................................... 9
5. Making Sense of NPV and EI Output ................................................................................... 10
5.1 Understanding the NPV Output ...................................................................................... 10 5.2 Understanding the Economic Indicator Output ............................................................... 12
5.3 Understanding the Travel Time Delay Cost Output ........................................................ 13
6. General Output Summary ..................................................................................................... 15
7. Understanding NPV Sensitivities........................................................................................... 16
Appendix 1 – Using the NPV Template .......................................................................................... 17
SM018 NPV Instructions
- 1 - Version 1 (June 2016)
1. Introduction to NPV
The whole reason for carrying out NPV analysis is to ensure the investor (NZ Transport Agency) optimise the return on their investment.
Before any pavement renewal is carried out, it must be justified as the lowest whole of life cost option.
Net Present Value (NPV) analysis is used to determine the difference between the present values of the various pavement treatment options available, over a 30 year analysis period. In essence it assesses which strategy (i.e. maintain, heavy maintenance, renewal) provides the best return on investment for the Agency, and its stakeholders.
Project level (i.e. treatment length) assessment is to be completed to demonstrate that other forms of maintenance and renewal are no longer economic and that the type and timing of the proposed option provides the least whole of life cost for the treatment length being assessed. This assessment will take place using the NPV template provided.
Example An example of this might be someone deciding which car to buy. Say there are two options; Option 1 is a standard petrol car and Option 2 is a new technology electric car. The purpose of the car (or practical level of service) in this case is getting from A to B, nothing more. This analysis excluded other externalities, like saving the environment from greenhouse gases etc. So, from an investment proposition, the decision boils down to which option results in the least whole of life costs. Option 1 – Petrol car
Purchase cost - $30,000 Assume 20,000km travelled each year, with petrol fixed at $2 per litre, and car efficiency being 10km per litre. Each year’s operational cost is 2,000 litres of petrol, or $4,000 worth of petrol. Routine maintenance is $500 per year, and periodic maintenance is $2,000 every 5 years for clutch or break repairs. Life of Car is 15 years Option 2 - Electric car Purchase cost - $45,000 Assume (as above) 20,000km travelled each year, with electricity cost at 15 cents a kWh, and car efficiency being 10km per 9.0kWh. Each year’s operational cost is 18,000kWh or $2,700 worth of electrical energy. Routine maintenance is $100 per year as the new technology has less moving parts, and periodic maintenance is $500 every 5 years as there is no clutch, and brakes are used to charge the batteries so less wear. Assume the life of the car is 15 years.
SM018 NPV Instructions
- 2 - Version 1 (June 2016)
Example (continued)
Whole of life cost analysis -
The whole of life cost outcome yields the following result –
For option 1, petrol car, the discounted total cost (or present value) is $74,471.
For option 2, electric car, the discounted total cost (or present value) is $70,263.
The Net Present Value (NPV) is the Present Value (PV) of Option 1 less the Present Value of Option 2, i.e. NPV = PV1 - PV2 = $74,471 - $70,263 = $4,208.
In other words on a whole of life basis it is more efficient (by $4,208 over the 15 years) to spend $45,000 on the electric car opposed to $30,000 on the petrol car option.
Note – we are assuming the car will be purchased in the next financial year (Year 1), similar to Pavement Rehabilitation being carried out in Year 1. To translate future dollars into today’s worth, a 6% discount factor is used
Year
Discount Factor
Option 1 - Petrol Car Option 2 - Electric car
Capital
Operational (Fuel)
Maintenance
Discounted Total Cost
Capital
Operational (Electricity)
Maintenance
Discounted Total Cost
0 1.0000 $0 $0
1 0.9434 $30,000 $4,000 $500 $32,547 $45,000 $2,700 $100 $45,094
2 0.8900 $4,000 $500 $4,005 $2,700 $100 $2,492
3 0.8396 $4,000 $500 $3,778 $2,700 $100 $2,351
4 0.7921 $4,000 $500 $3,564 $2,700 $100 $2,218
5 0.7473 $4,000 $500 $3,363 $2,700 $100 $2,092
6 0.7050 $4,000 $2,500 $4,582 $2,700 $600 $2,326
7 0.6651 $4,000 $500 $2,993 $2,700 $100 $1,862
8 0.6274 $4,000 $500 $2,823 $2,700 $100 $1,757
9 0.5919 $4,000 $500 $2,664 $2,700 $100 $1,657
10 0.5584 $4,000 $500 $2,513 $2,700 $100 $1,564
11 0.5268 $4,000 $2,500 $3,424 $2,700 $600 $1,738
12 0.4970 $4,000 $500 $2,236 $2,700 $100 $1,392
13 0.4688 $4,000 $500 $2,110 $2,700 $100 $1,313
14 0.4423 $4,000 $500 $1,990 $2,700 $100 $1,238
15 0.4173 $4,000 $500 $1,878 $2,700 $100 $1,168
Discounted Total Cost (or Present Value) $74,471 $70,263

SM018 NPV Instructions
- 3 - Version 1 (June 2016)
1.1 Understanding the NPV Calculation
The Transport Agency want a consistent approach to NPV analysis and have developed an analysis template for use by suppliers. These instructions provide guidance on the use of this NPV template.
A minimum of three different strategies must be compared and it is recommended that a further two options be used as follows:
Scenario Description
1 Do Minimum Compulsory
2 Heavy Maintenance (previously named Do Something) Compulsory
3 Renewal No.1 Compulsory
4 Renewal No.2 Recommended
5 Renewal No.3 Recommended
The NPV analysis will compare the investment costs, both due to maintenance and renewal, of each option over a 30 year period to determine the preferred option.
Due to the analysis period length, and to translate future dollars into todays worth, a 6% discount factor is used. This is as per the previous example and the factor is incorporated into the 30 year analysis tables on the ‘Template’ tab of the NPV spreadsheet.
Two ‘tests’ need to be passed in order for a treatment option to be considered, the NPV and the Economic Indicator (EI). Further guidance is provided on these below.
2. Using the Right Data
The accuracy of the NPV output is dependent on the quality of data used to inform it. Historically whilst every effort has been made to ensure the quality of RAMM data, some discrepancies will inevitably be found when completing the NPV template. Sensibility checks should be completed on all RAMM data used, and sanitized as appropriate with respect to its impact on the NPV analysis.
2.1 Site Information
The ‘Site Details’ tab of the NPV template needs to be populated with information from the Agency’s RAMM database. Required information includes;
Site Information (from the Treatment Length and Carriageway tables)
Historic maintenance quantities (from the Maintenance Cost table)
Surfacing History (from the Carriageway Surface table)
Condition (from the Treatment Length table)
Obtaining this data straight from RAMM can be carried out via SQL, or by manually extracting. Guidance on this is provided in Appendix 1.
In addition, contract specific information such as base unit rates for maintenance activities (which can predominantly be found in the contract Schedule of Prices) need to be entered.
SM018 NPV Instructions
- 4 - Version 1 (June 2016)
2.2 Understanding Maintenance History
The maintenance cost history used in this NPV analysis is a function of maintenance quantity history in RAMM, against current contract unit rates. This differs from previous years where actual historic costs were used in the NPV analysis, taking no account of changing contracts, maintenance strategies, and market rates.
The historic maintenance quantities used in the NPV analysis are very important, as they are the major factor in predicting future costs. Assessment of this data should be completed when extracting from RAMM, and as a minimum the following should be checked;
Make sure that all maintenance quantities used fall into the bounds of the treatment length being assessed. For example, some treatments may span multiple treatment lengths, crossing starts and ends. These quantities need to be adjusted to reflect the proportion of the treatment completed in the treatment length being analyzed.
Check maintenance activity units. Maintenance activities, and their associated costs, may be uploaded with various, and sometimes inappropriate units. Ideally these would be corrected before being loaded into RAMM, however this is occasionally not the case. Units and/or quantities may need to be adjusted to reflect this, if found to be incorrect.
Rework, in any form, should not be used as input to the NPV analysis. This can be difficult to establish, but if possible should be removed from the maintenance history.
The maintenance activity types should be checked to ensure appropriateness for including in NPV analysis. Only maintenance activities likely to be impacted by the selected treatment option have been included for population on the ‘Site Details’ tab
Extraordinarily high costs should be checked for appropriateness. These may be due to aggregated items or lengths that may need to be disaggregated for use in the NPV analysis.
The timing of historic renewals should be checked, i.e. inclusion of maintenance quantities from six years ago may not be appropriate if the site was resurfaced four years ago.
All records that are obviously erroneous and cannot be corrected should be discarded, e.g. negative costs and quantities.
These historic maintenance quantities, together with the assessed Year 1 maintenance requirements, will form the basis of the maintenance cost curve used to predict pre-renewal maintenance costs for the Do Minimum option, so will need to be sensible and defendable.
2.3 Year 0 Maintenance Quantities
The maintenance quantities used for Year 0 (the current financial year) will be made up of actual completed work and work required (within the same financial year) to maintain the site to the required levels of service. It is expected that quantities used will reflect ‘sunk’ (and/or unavoidable) work, which will not change depending on the future investment strategy (Do Minimum, Heavy Maintenance, or Renewal). Remember - the investment strategy will not be confirmed until towards the end of the financial year, following the RAPT review and Annual Plan Challenge Session, and so significant changes to the site’s maintenance strategy (depending on selected treatment option) is unrealistic.
Note that Year 0 costs are not included in the NPV analysis, except to inform the maintenance cost model.

SM018 NPV Instructions
- 5 - Version 1 (June 2016)
2.4 Assessment of Year 1 Maintenance
It is a requirement that Year 1 maintenance requirements are assessed appropriately and are realistic and defendable.
These assessed maintenance quantities need to be based on onsite inspection, reflecting pavement, surfacing and shoulder work that would genuinely be necessary to meet the required levels of service in Year 1 if the renewal option (or heavy maintenance option) does not proceed. This does not mean remedying all faults/defects identified within the treatment length. What it does mean is identifying any work required to keep the site safe and deliver the levels of services as prescribed within the Network Outcomes Contract. Furthermore, Year 1 maintenance quantities used for the NPV analysis should only be included if they will actually be completed if the Do Minimum is the option selected to proceed. These assessed maintenance requirements are to be marked out on the road and identified in the ‘Assessed Maintenance’ tab of the NPV template.
Typically, at least 5% of the treatment length will have been repaired or genuinely requires maintenance in the immediate future before a renewal will be justified.
Significant Year 1 assessed maintenance quantities compared to minimal historic completed maintenance will need review to determine whether this is a cyclical maintenance spike, a genuine indicator of end of pavement life, or an inflated and unrealistic assessment of maintenance needs.
Where reactive maintenance could have been avoided by undertaking proactive maintenance at an appropriate time, the reactive maintenance should not be used to determine the position on the Maintenance Activity Cost Model. The cost of intervening with proactive maintenance may be included.
2.5 Future Maintenance Costs
Section 5.2.3 from the Network Outcomes Contract states; “The Contractor shall develop, maintain and report on a model relevant to the Network that records historical maintenance activity at treatment-length level and predicts future maintenance needs. This model is to be used in renewal economic assessment and performance predictions. The Contractor shall maintain this model based on actual maintenance activity incurred within the Network. The model will be formally reviewed annually at a workshop with the Principal.”
Two maintenance costs (or quantity) prediction models are required for NPV analysis; to predict pre-renewal maintenance requirements for the Do Minimum option, and to predict post-renewal maintenance requirements for all options.
2.5.1 Pre-Rehabilitation Maintenance Projection
The NPV template has been developed to predict future, pre-pavement rehabilitation maintenance costs for the Do Minimum option, this is included in the ‘Do Min Cost Model’ tab.
Historic and assessed maintenance quantities are translated into costs by applying standard contract rates. Future costs are then projected by applying a linear trend equation.
The template calculates future costs and presents these in both tabular and graphical form.
SM018 NPV Instructions
- 6 - Version 1 (June 2016)
Note that this process is the default minimum standard for predicting pre-rehabilitation maintenance costs/quantities for the Do Minimum option. Alternative prediction models can be used, provided these can be justified and are able to be interrogated by the Asset Integrators.
For the Heavy Maintenance option; it is acknowledged that the timing and costs of future maintenance and/or renewal will greatly depend on the type (and expected life) of physical works planned, which will vary widely based on the site’s specific needs. A prediction model is unlikely to be accurate in this case and robust engineering judgement should be applied when predicting future costs.
It should be noted that for sites with multiple surfacing layers causing layer instability, widespread failure can occur quickly. Assessed maintenance costs for Year 0 and Year 1 in particular, can be expected to be higher than for sites with underlying pavement layer issues. This is because there is less variability in the top surface layer condition across the site.
2.5.2 Post-Renewal Maintenance Prediction
Future annual maintenance costs following completion of the proposed renewal options shall be supported by a maintenance activity cost model, developed as required in section 5.2.3 of the Network Outcomes Contract Maintenance Specification. Details on the network specific model’s development should be provided in the supplier’s Maintenance Management Plan and, when predicting future maintenance costs, should reflect;
type and design life of the proposed treatment option
type, timing and expected life of future renewal treatments (within the 30 year analysis period) such as resurfacing and possible pavement rehabilitation
network specific maintenance strategy
The model also needs to take into account;
as a minimum, a linear cost progression
pre-surfacing repairs
post resurfacing maintenance reset
historic maintenance requirements associated with various renewal treatments
dTIMS outputs
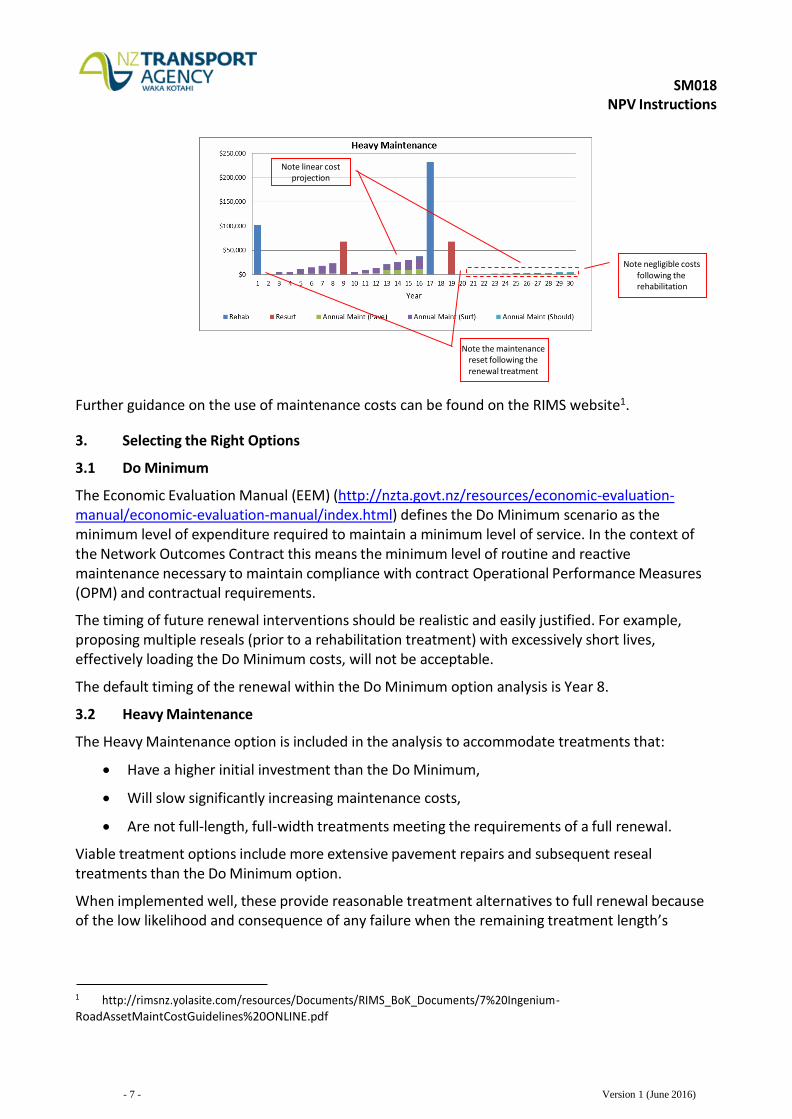
An example of how the maintenance costs might look alongside renewal treatments is shown below. This incorporates the maintenance resets following renewal treatments. The NPV Template also shows this graphically for each option assessed.
SM018 NPV Instructions
- 7 - Version 1 (June 2016)
Further guidance on the use of maintenance costs can be found on the RIMS website1.
3. Selecting the Right Options
3.1 Do Minimum
The Economic Evaluation Manual (EEM) (http://nzta.govt.nz/resources/economic-evaluation- manual/economic-evaluation-manual/index.html) defines the Do Minimum scenario as the minimum level of expenditure required to maintain a minimum level of service. In the context of the Network Outcomes Contract this means the minimum level of routine and reactive maintenance necessary to maintain compliance with contract Operational Performance Measures (OPM) and contractual requirements.
The timing of future renewal interventions should be realistic and easily justified. For example, proposing multiple reseals (prior to a rehabilitation treatment) with excessively short lives, effectively loading the Do Minimum costs, will not be acceptable.
The default timing of the renewal within the Do Minimum option analysis is Year 8.
3.2 Heavy Maintenance
The Heavy Maintenance option is included in the analysis to accommodate treatments that:
Have a higher initial investment than the Do Minimum,
Will slow significantly increasing maintenance costs,
Are not full-length, full-width treatments meeting the requirements of a full renewal.
Viable treatment options include more extensive pavement repairs and subsequent reseal treatments than the Do Minimum option.
When implemented well, these provide reasonable treatment alternatives to full renewal because of the low likelihood and consequence of any failure when the remaining treatment length’s
1 http://rimsnz.yolasite.com/resources/Documents/RIMS_BoK_Documents/7%20Ingenium- RoadAssetMaintCostGuidelines%20ONLINE.pdf
Note negligible costs following the rehabilitation
Note linear costprojection
Note the maintenancereset following therenewal treatment
SM018 NPV Instructions
- 8 - Version 1 (June 2016)
condition is generally sound. This approach is best suited to sites containing significant failure, but isolated to specific areas rather than being widespread throughout the entire site.
There can be significant benefits in delaying the full renewal of a pavement. A so called ‘holding treatment’ can often delay the full rehabilitation by 7 to 10 years, giving financial benefit by delaying the significant cost of a full rehabilitation treatment.
It is necessary to test whether a holding treatment has economic advantages over a full rehabilitation treatment, and to test whether the heavy maintenance option is the lowest whole of life cost option.
Some examples of Heavy Maintenance options are provided below, these are to provide guidance only and are by no means complete.
Isolated large digout repairs to address areas of significantly deteriorated pavement, in an otherwise sound site.
Stabilisation or rip and remake of one lane (or half a lane) to address rutting and rising maintenance costs in a heavily loaded lane, where the remaining area is generally OK.
Widespread waterblasting to address flushing, with isolated pavement repairs.
Combination sealing to address rutting.
Sandwich/bicouche sealing to address widespread binder rise/flushing.
Significant mill and inlay on asphalt site.
The Heavy Maintenance option is to be described and estimated in the ‘Estimates’ tab.
3.3 Renewal
Renewals in this context will typically be pavement rehabilitation treatments, however this also encompasses high cost (>$100K) surfacing treatments.
Pavement rehabilitation treatments are a full length, full width area wide pavement treatment, developed as the most effective and efficient pavement renewal option for the site being assessed. These will generally be followed by a period of negligible maintenance and a series of resurfacing treatments. As a guide; the three base treatments specified in the Network Outcomes Contract, modified to achieve a pavement suitable for the specific site can be used.
Other high costs treatments, considered as a renewal, will also be full length and full width, such as large asphaltic concrete surfacing renewals.
Up to three renewal options can be assessed within the NPV Template. At least one option is required, but it is recommended that three options are compared for completeness.
Improvement costs associated with the renewal option are to be excluded from the NPV analysis, as follows;
Seal widening
Safety improvements (e.g. guardrail, super elevation correction, traffic services, etc.)
Major drainage improvements (e.g. new culverts, changing from side drain to lined dish channel, etc.)
SM018 NPV Instructions
- 9 - Version 1 (June 2016)
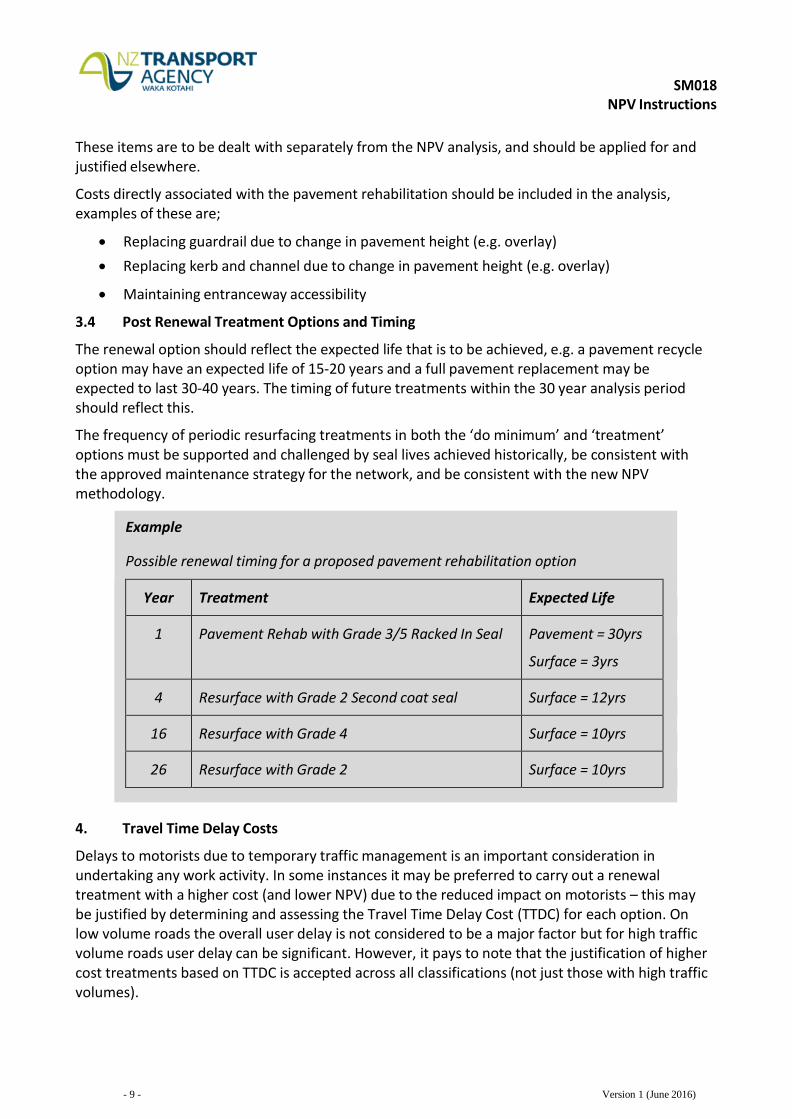
Example
Possible renewal timing for a proposed pavement rehabilitation option
These items are to be dealt with separately from the NPV analysis, and should be applied for and justified elsewhere.
Costs directly associated with the pavement rehabilitation should be included in the analysis, examples of these are;
Replacing guardrail due to change in pavement height (e.g. overlay)
Replacing kerb and channel due to change in pavement height (e.g. overlay)
Maintaining entranceway accessibility
3.4 Post Renewal Treatment Options and Timing
The renewal option should reflect the expected life that is to be achieved, e.g. a pavement recycle option may have an expected life of 15-20 years and a full pavement replacement may be expected to last 30-40 years. The timing of future treatments within the 30 year analysis period should reflect this.
The frequency of periodic resurfacing treatments in both the ‘do minimum’ and ‘treatment’ options must be supported and challenged by seal lives achieved historically, be consistent with the approved maintenance strategy for the network, and be consistent with the new NPV methodology.
Year Treatment Expected Life
1 Pavement Rehab with Grade 3/5 Racked In Seal Pavement = 30yrs
Surface = 3yrs
4 Resurface with Grade 2 Second coat seal Surface = 12yrs
16 Resurface with Grade 4 Surface = 10yrs
26 Resurface with Grade 2 Surface = 10yrs
4. Travel Time Delay Costs
Delays to motorists due to temporary traffic management is an important consideration in undertaking any work activity. In some instances it may be preferred to carry out a renewal treatment with a higher cost (and lower NPV) due to the reduced impact on motorists – this may be justified by determining and assessing the Travel Time Delay Cost (TTDC) for each option. On low volume roads the overall user delay is not considered to be a major factor but for high traffic volume roads user delay can be significant. However, it pays to note that the justification of higher cost treatments based on TTDC is accepted across all classifications (not just those with high traffic volumes).

SM018 NPV Instructions
- 10 - Version 1 (June 2016)
The TTDC is kept separate from the NPV costs and is not compulsory. It is only required for sites where the most economically preferred option (based on project and ongoing maintenance costs) may not be the overall preferred option, and is only used as a tool to assist in the investment decision making process when making the final selection between treatments.
The ‘D1-Do Min’, ‘D2-Heavy Maint’, ‘D3-Renewal1, ‘D4-Renewal2’ and ‘D5-Renewal3’ tabs within the NPV Template are to be used for determining the TTDC of each option.
5. Making Sense of NPV and EI Output
NPVs will be calculated for different investment strategies – this is to include testing different treatment types and design lives and varying the timing of the treatment.
In order to ensure that proposed investment strategies are appropriate, all option’s outputs go through two checkpoints, with a third where required:
Checkpoint No. 1: Net Present Value (NPV)
o Lowest whole of life cost
Checkpoint No. 2: Economic Indicator (EI)
o Long term savings vs short term costs
Checkpoint No. 3: Travel Time Delay Costs (TTDC)
o User travel time delay savings
The investment strategy with the lowest whole of life cost (the largest NPV), and meeting the EI requirements shall be the economically preferred option. However, an alternative renewal option with a higher cost and lower NPV may be justified based on having the least Travel Time Delay Costs, provided it passes checkpoints 1 and 2.
5.1 Understanding the NPV Output
Based on the information entered into the NPV template, the 30 year Present Values (PVs) calculated for each option are compared with the Do Minimum to calculate the NPV.
The formula for the NPV is:
NPV = PV30yr Do Minimum – PV30yr Option
The results can be interpreted as follows:
i. A negative NPV tells us that the proposed option is more expensive (less cost effective) than the Do Minimum over the 30 year period. In this case the Do Minimum is preferred over the option, and the option is rejected.
ii. A positive NPV tells us that the proposed option is more cost effective, by having less cost over the 30 year period, when compared to the Do Minimum. The higher the NPV, the more cost effective (and more preferred) the option is. However, it is important to note:
Whenever the PV of a Heavy Maintenance option is significantly lower (>25%) than the Do Minimum option, there is a chance that erroneous overstatement of the Do Minimum maintenance costs is causing the Heavy Maintenance option to appear better when it is not. Or, that the initial year’s maintenance costs of the Heavy
SM018 NPV Instructions
- 11 - Version 1 (June 2016)
Maintenance option are understated. This is considered to be a ‘false-positive’ result. In this case, reassessment of each option’s predicted costs is required and needs to be referenced to valid, robust evidence, before the Heavy Maintenance option is adopted.
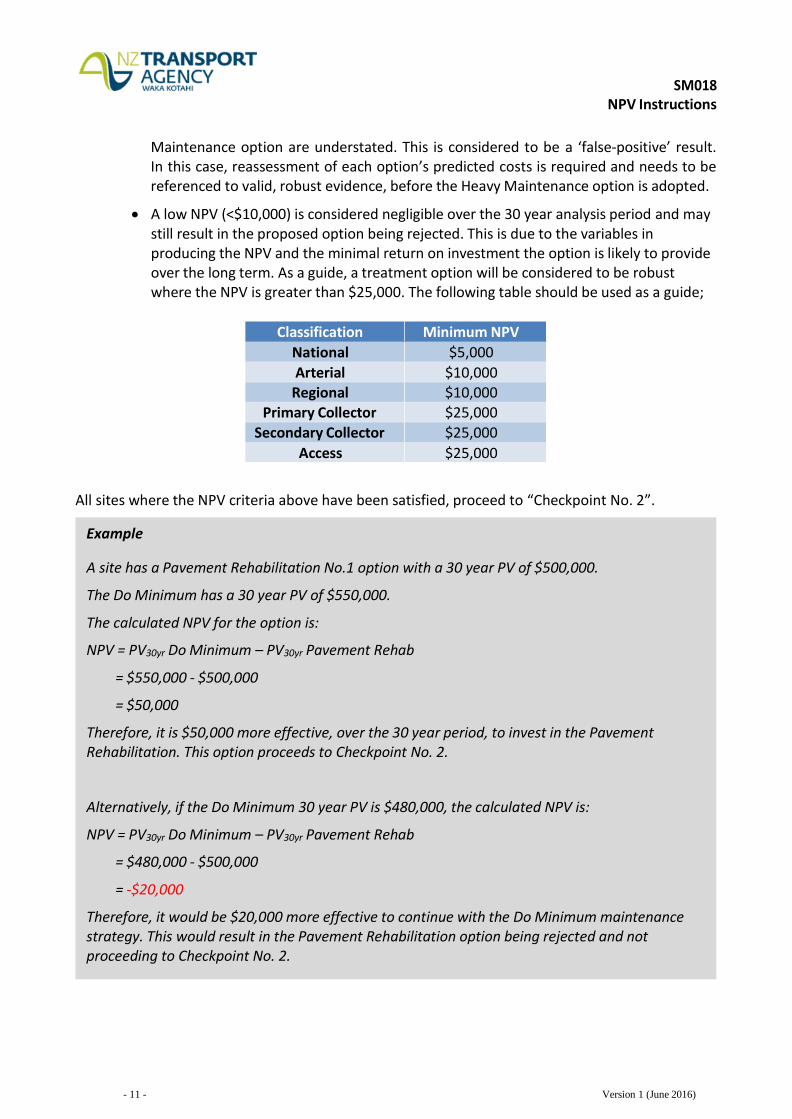
A low NPV (<$10,000) is considered negligible over the 30 year analysis period and may still result in the proposed option being rejected. This is due to the variables in producing the NPV and the minimal return on investment the option is likely to provide over the long term. As a guide, a treatment option will be considered to be robust where the NPV is greater than $25,000. The following table should be used as a guide;
Classification Minimum NPV
National $5,000
Arterial $10,000 Regional $10,000
Primary Collector $25,000
Secondary Collector $25,000
Access $25,000
All sites where the NPV criteria above have been satisfied, proceed to “Checkpoint No. 2”.
Example
A site has a Pavement Rehabilitation No.1 option with a 30 year PV of $500,000.
The Do Minimum has a 30 year PV of $550,000.
The calculated NPV for the option is:
NPV = PV30yr Do Minimum – PV30yr Pavement Rehab
= $550,000 - $500,000
= $50,000
Therefore, it is $50,000 more effective, over the 30 year period, to invest in the Pavement Rehabilitation. This option proceeds to Checkpoint No. 2.
Alternatively, if the Do Minimum 30 year PV is $480,000, the calculated NPV is:
NPV = PV30yr Do Minimum – PV30yr Pavement Rehab
= $480,000 - $500,000
= -$20,000
Therefore, it would be $20,000 more effective to continue with the Do Minimum maintenance strategy. This would result in the Pavement Rehabilitation option being rejected and not proceeding to Checkpoint No. 2.
SM018 NPV Instructions
- 12 - Version 1 (June 2016)
5.2 Understanding the Economic Indicator Output
The Economic Indicator (EI) has been incorporated into the NPV analysis to test the short term efficiency of the proposed option, as well as minimising the risk of the Agency funding a renewal with a ‘false positive’ NPV, ensuring that a minimum degree of confidence in the investment proposal is achieved.
The EI is the ratio of the option’s whole of life cost savings (30 year NPV) and the short term additional costs (7 year NPV) due to the initial investment in the option. In order for a treatment to be economically justified it will need to achieve a specified criteria of EI as well as demonstrating lowest whole-of-life cost. Satisfying this will also confirm that the treatment is the best use of the limited funds available for renewal treatments.
The formula for the EI is:
EI = Long term cost savings of doing the option (over 30 year period) Short term cost of choosing the option (over first 7 years)
EI = NPV30yr
PV7yr Option – PV7yr
Do Minimum
A negative EI means the Do Minimum costs for the first 7 years are greater than the option’s costs for the first 7 years, i.e. the option is cheaper in the short term as well as the long term. This is accepted, however a closer review of costs for both the Do Minimum and the option is required to confirm the assumptions are valid. If predicted costs are found to be unreliable, the proposed option may be rejected. Note that if the proposed Heavy Maintenance treatment provides similar Year 1 costs with increased short term cost savings, it should be considered the Do Minimum as you are effectively doing the minimum amount of work (or close to) to meet the required levels of service.
An EI between 0 and 0.8 shows that the long term cost savings are low when compared with the additional short term cost increase (or investment) i.e. the cost of the initial investment outweighs the long term savings. This also means that the cost savings will predominantly be found in the medium to long term.
An EI between 0.8 and 2 means that the short term additional costs due to investing in the proposed option are appropriate when considered against the long term cost savings i.e. the value proposition provides enough confidence that the option should be invested in.
An EI greater than 2 means that the short terms costs for the options are very similar, indicating the majority of cost savings are in the long term (for years 8 – 30) and either;
The predicted costs for the Do Minimum option have been exaggerated, making the proposed option much more attractive than is realistic.
The costs for the option proposed are too low and unrealistic. Note that if the proposed Heavy Maintenance treatment provides similar Year 1 costs and short term cost savings, it should be considered the Do Minimum as you are effectively doing the minimum amount of work (or close to) to meet the required levels of service.
SM018 NPV Instructions
- 13 - Version 1 (June 2016)
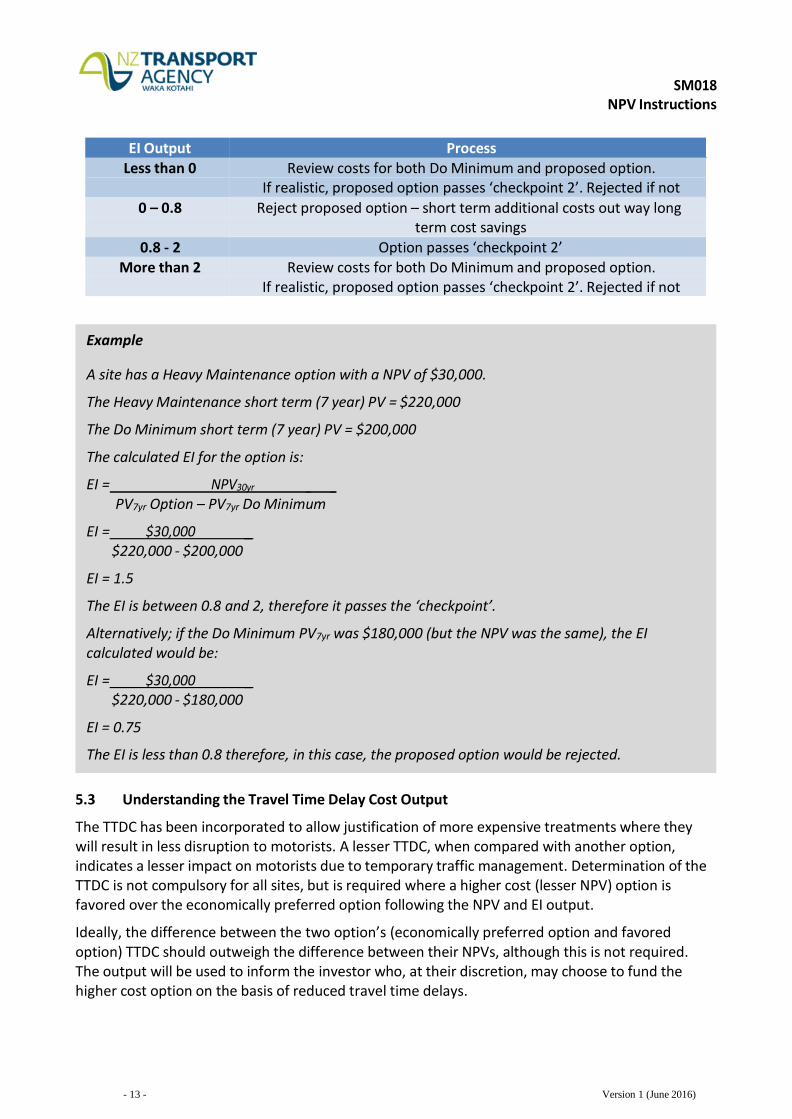
EI Output Process Less than 0 Review costs for both Do Minimum and proposed option.
If realistic, proposed option passes ‘checkpoint 2’. Rejected if not
0 – 0.8 Reject proposed option – short term additional costs out way long term cost savings
0.8 - 2 Option passes ‘checkpoint 2’ More than 2 Review costs for both Do Minimum and proposed option.
If realistic, proposed option passes ‘checkpoint 2’. Rejected if not
5.3 Understanding the Travel Time Delay Cost Output
The TTDC has been incorporated to allow justification of more expensive treatments where they will result in less disruption to motorists. A lesser TTDC, when compared with another option, indicates a lesser impact on motorists due to temporary traffic management. Determination of the TTDC is not compulsory for all sites, but is required where a higher cost (lesser NPV) option is favored over the economically preferred option following the NPV and EI output.
Ideally, the difference between the two option’s (economically preferred option and favored option) TTDC should outweigh the difference between their NPVs, although this is not required. The output will be used to inform the investor who, at their discretion, may choose to fund the higher cost option on the basis of reduced travel time delays.
Example
A site has a Heavy Maintenance option with a NPV of $30,000.
The Heavy Maintenance short term (7 year) PV = $220,000
The Do Minimum short term (7 year) PV = $200,000
The calculated EI for the option is:
EI = NPV30yr _ _
PV7yr Option – PV7yr Do Minimum
EI = $30,000 _ $220,000 - $200,000
EI = 1.5
The EI is between 0.8 and 2, therefore it passes the ‘checkpoint’.
Alternatively; if the Do Minimum PV7yr was $180,000 (but the NPV was the same), the EI calculated would be:
EI = $30,000 _ $220,000 - $180,000
EI = 0.75
The EI is less than 0.8 therefore, in this case, the proposed option would be rejected.
SM018 NPV Instructions
- 14 - Version 1 (June 2016)
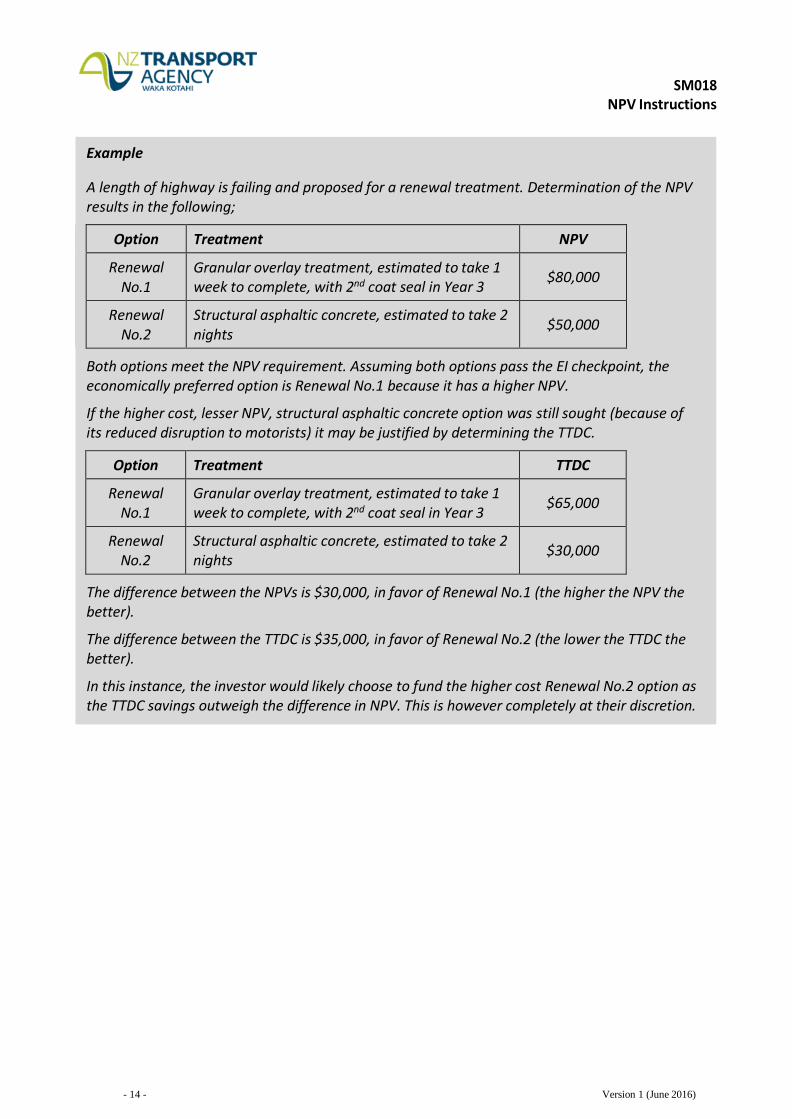
Example
A length of highway is failing and proposed for a renewal treatment. Determination of the NPV results in the following;
Option Treatment NPV
Renewal No.1
Granular overlay treatment, estimated to take 1 week to complete, with 2nd coat seal in Year 3
$80,000
Renewal No.2
Structural asphaltic concrete, estimated to take 2 nights
$50,000
Both options meet the NPV requirement. Assuming both options pass the EI checkpoint, the economically preferred option is Renewal No.1 because it has a higher NPV.
If the higher cost, lesser NPV, structural asphaltic concrete option was still sought (because of its reduced disruption to motorists) it may be justified by determining the TTDC.
Option Treatment TTDC
Renewal No.1
Granular overlay treatment, estimated to take 1 week to complete, with 2nd coat seal in Year 3
$65,000
Renewal No.2
Structural asphaltic concrete, estimated to take 2 nights
$30,000
The difference between the NPVs is $30,000, in favor of Renewal No.1 (the higher the NPV the better).
The difference between the TTDC is $35,000, in favor of Renewal No.2 (the lower the TTDC the better).
In this instance, the investor would likely choose to fund the higher cost Renewal No.2 option as the TTDC savings outweigh the difference in NPV. This is however completely at their discretion.
SM018 NPV Instructions
- 15 - Version 1 (June 2016)
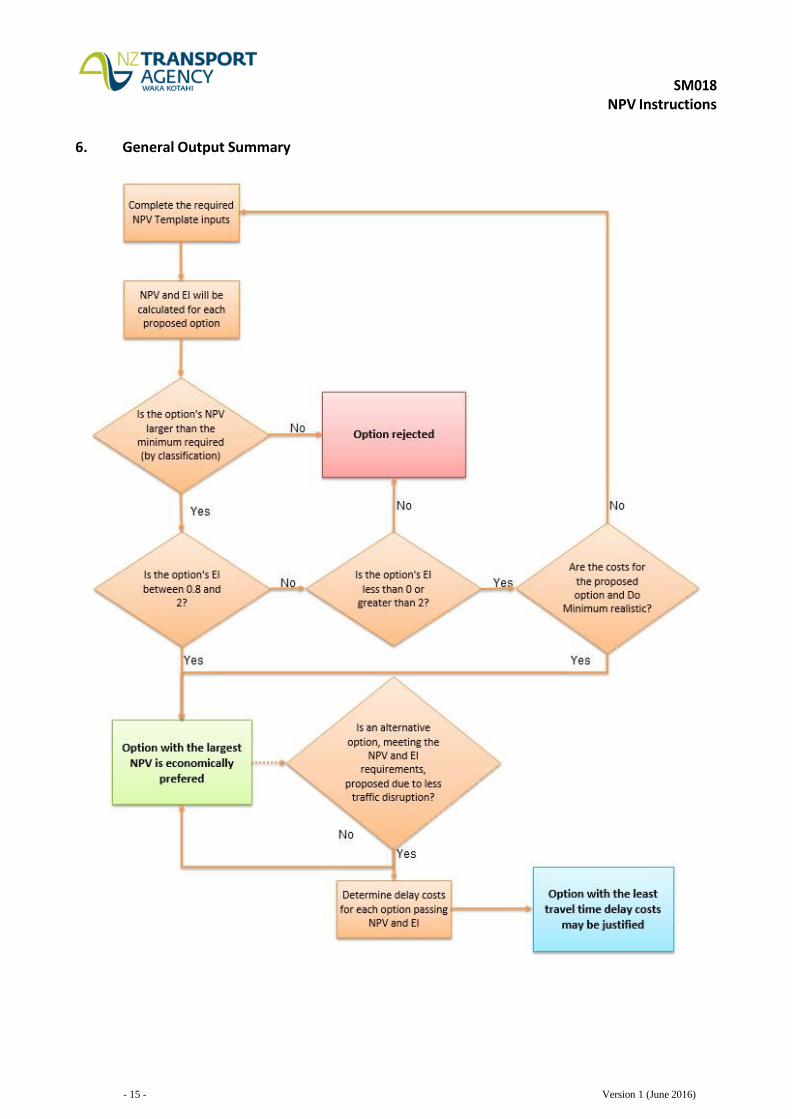
6. General Output Summary

SM018 NPV Instructions
- 16 - Version 1 (June 2016)
7. Understanding NPV Sensitivities
NPVs are sensitive to a large number of variables. The NPV Template includes a set of sensitivity “sliders” to test four key variables considered to have the largest impact on the NPV output. The following table explains how these key variables are tested in the ‘Sensitivity Sliders’ tab. It has purposefully been kept simple, but provides an indication of the NPV’s robustness i.e. will the NPV turn negative in the worst case scenarios?
Variable
Sensitivity Modelling Method Test Range
Minimum Maximum
Do Minimum maintenance cost
progression
Increase/decrease slope of maintenance cost progression to represent changing
deterioration rates
-20%
+20%
Year 1 Do Minimum maintenance costs
Increase/decrease assessed maintenance requirements to represent possible change in
maintenance needs
-20%
+20%
Year 1 Treatment cost (exc. Do Minimum)
Increase/decrease treatment cost to represent possible changes in construction cost and/or
design
-10%
+10%
Do Minimum rehab timing
Advance/defer rehabilitation timing to represent possible effectiveness of Do
Minimum strategy
-2yrs
+2yrs
To assess the overall best and worst case scenarios, all four variables should be applied using the sliders in the spreadsheet. The resulting impact on the preferred options NPV will also be shown on the ‘One Page Summary’ tab.
It should be noted that the sensitivity analysis tools incorporate the default maintenance cost progression within the spreadsheet. The ‘Sensitivity Sliders’ page will not accurately reflect the proposed scenarios if the default predicted Do Minimum maintenance costs in the template page are overwritten.
SM018 NPV Instructions
- 17 - Version 1 (June 2016)
Appendix 1 – Using the NPV Template
1. General
The NPV template includes the following worksheets:
Yellow tabs
These worksheets require input for all sites. Within these worksheets, the cells highlighted yellow are required fields and must be populated. NOTE: DO NOT CUT AND PASTE cells within these worksheets as this may affect some formulas. Information from other sources (e.g. RAMM outputs) can be copied and pasted into the appropriate cells within the NPV template.
Orange tabs
These worksheets contain Travel Time Delay Cost calculations. Within these worksheets, the cells highlighted yellow are required fields and must be populated.
Blue tabs
These worksheets are provided to give guidance and supporting information for the NPV process and do not require specific site input. They contain the following:
Process Summary – guidance on output and decision making
Sensitivity Sliders – an interactive page to test the site’s NPV sensitivities
Do Min Cost Model – shows the linear maintenance cost model progression.
2. Site Details
The ‘Site Details’ tab needs to be populated with information from the Agency’s RAMM database as well as contract specific information from the Contractor’s own asset management system.
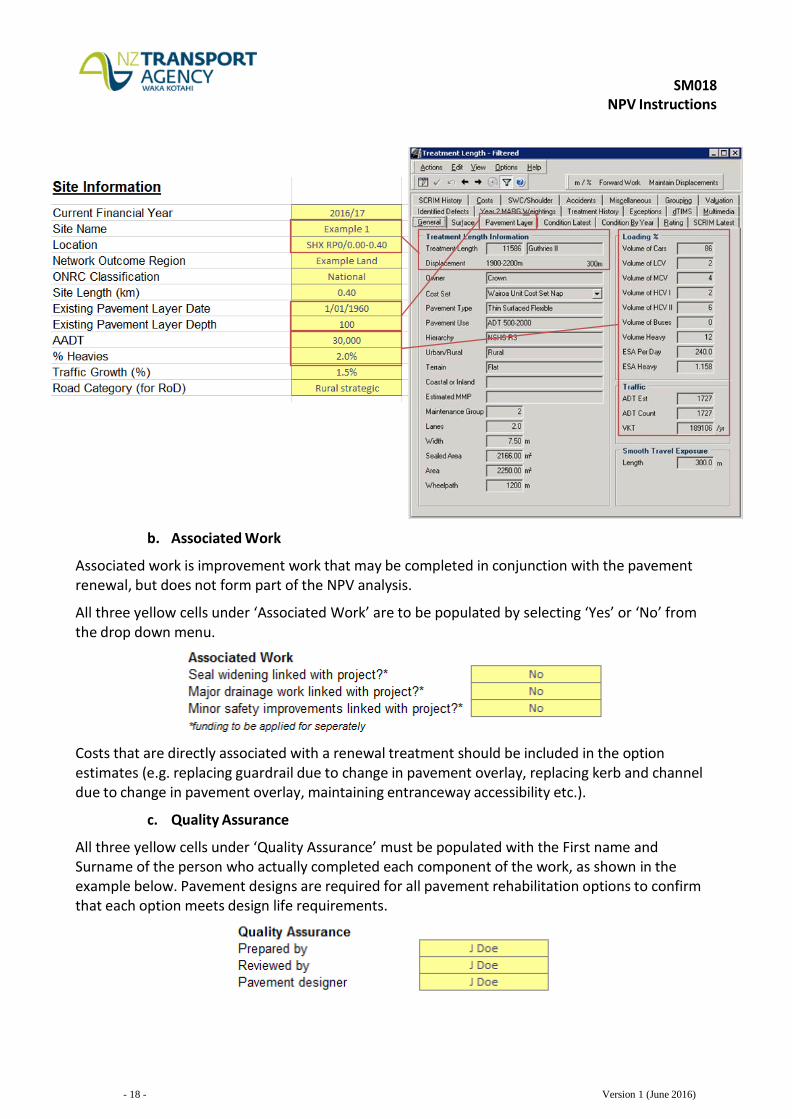
a. Site Information
Information required to populate the ‘Site Information’ is generally collated from the Treatment Length and Carriageway tables in RAMM. All yellow cells under ‘Site Information’ are to be populated, noting the following:
ONRC Classification and Road Category include dropdown menus that require selection of one option to populate the cell.
Traffic growth is to be predicted by the Contractor based on historic growth and any known future traffic changes.
SM018 NPV Instructions
- 18 - Version 1 (June 2016)
b. Associated Work
Associated work is improvement work that may be completed in conjunction with the pavement renewal, but does not form part of the NPV analysis.
All three yellow cells under ‘Associated Work’ are to be populated by selecting ‘Yes’ or ‘No’ from the drop down menu.
Costs that are directly associated with a renewal treatment should be included in the option estimates (e.g. replacing guardrail due to change in pavement overlay, replacing kerb and channel due to change in pavement overlay, maintaining entranceway accessibility etc.).
c. Quality Assurance
All three yellow cells under ‘Quality Assurance’ must be populated with the First name and Surname of the person who actually completed each component of the work, as shown in the example below. Pavement designs are required for all pavement rehabilitation options to confirm that each option meets design life requirements.
SM018 NPV Instructions
- 19 - Version 1 (June 2016)
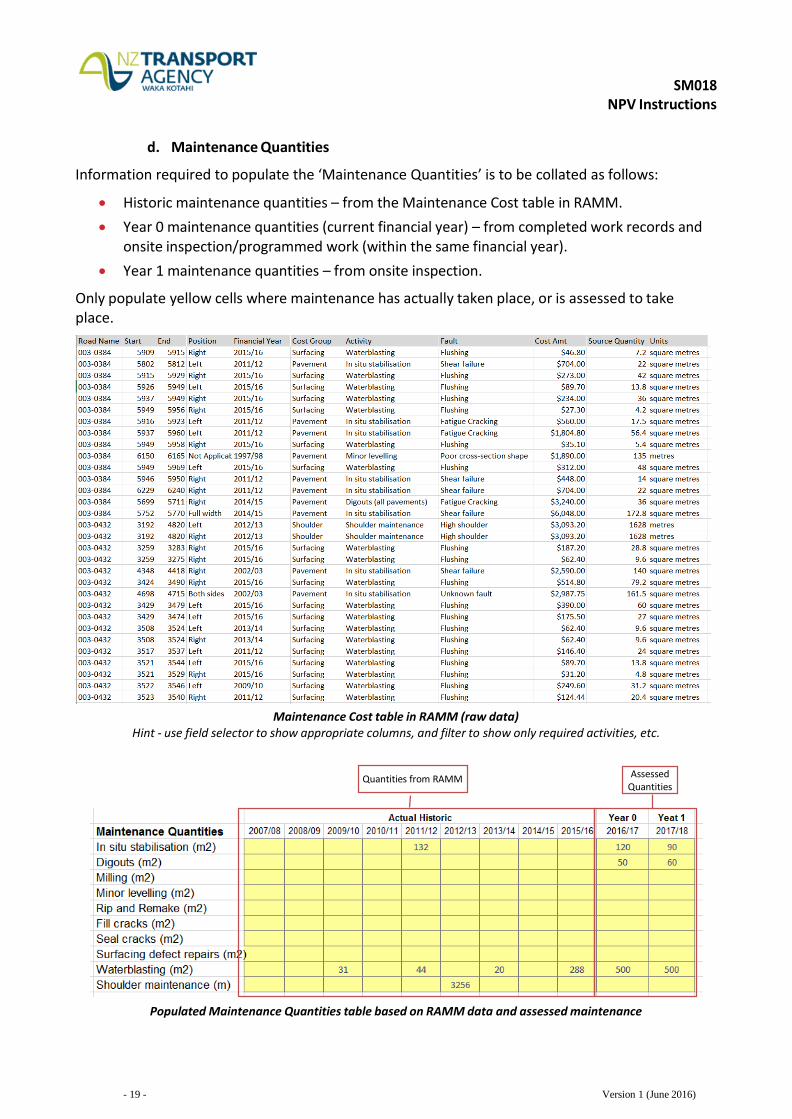
d. Maintenance Quantities
Information required to populate the ‘Maintenance Quantities’ is to be collated as follows:
Historic maintenance quantities – from the Maintenance Cost table in RAMM.
Year 0 maintenance quantities (current financial year) – from completed work records and onsite inspection/programmed work (within the same financial year).
Year 1 maintenance quantities – from onsite inspection.
Only populate yellow cells where maintenance has actually taken place, or is assessed to take place.
Maintenance Cost table in RAMM (raw data)
Hint - use field selector to show appropriate columns, and filter to show only required activities, etc.
Populated Maintenance Quantities table based on RAMM data and assessed maintenance
Quantities from RAMM Assessed Quantities
SM018 NPV Instructions
- 20 - Version 1 (June 2016)
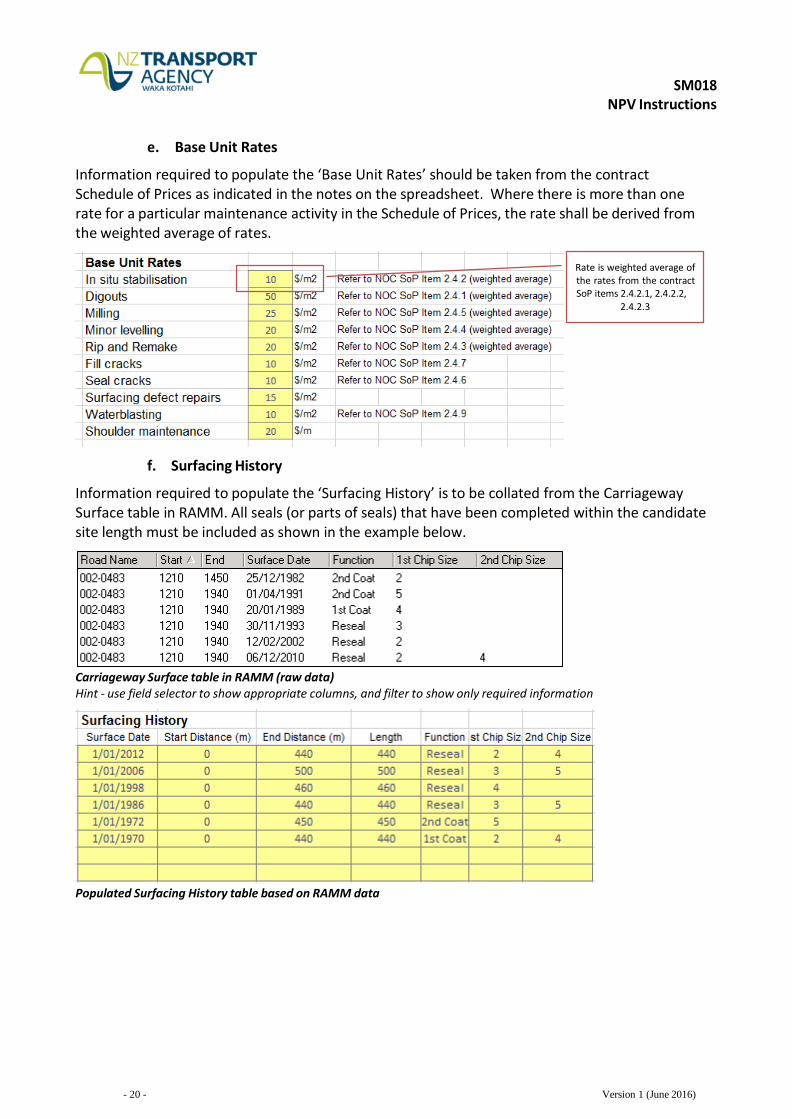
e. Base Unit Rates
Information required to populate the ‘Base Unit Rates’ should be taken from the contract Schedule of Prices as indicated in the notes on the spreadsheet. Where there is more than one rate for a particular maintenance activity in the Schedule of Prices, the rate shall be derived from the weighted average of rates.
f. Surfacing History
Information required to populate the ‘Surfacing History’ is to be collated from the Carriageway Surface table in RAMM. All seals (or parts of seals) that have been completed within the candidate site length must be included as shown in the example below.
Carriageway Surface table in RAMM (raw data) Hint - use field selector to show appropriate columns, and filter to show only required information
Populated Surfacing History table based on RAMM data
Rate is weighted average of the rates from the contract SoP items 2.4.2.1, 2.4.2.2,
2.4.2.3
SM018 NPV Instructions
- 21 - Version 1 (June 2016)
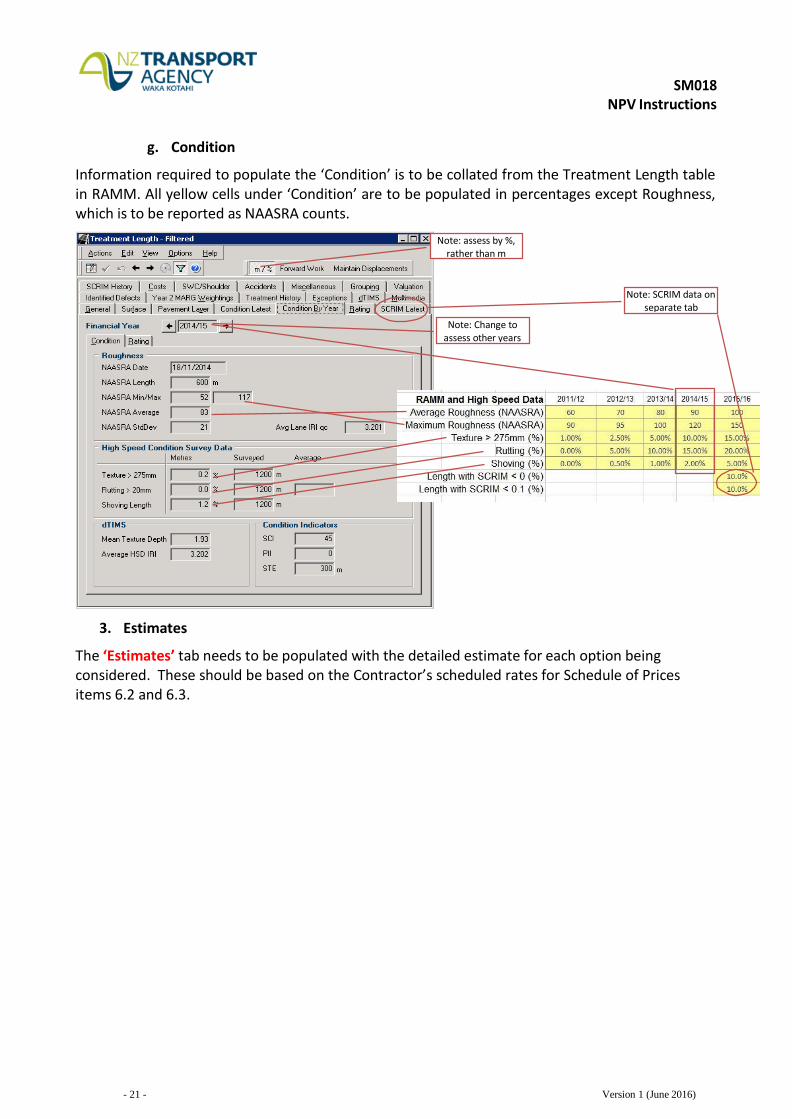
g. Condition
Information required to populate the ‘Condition’ is to be collated from the Treatment Length table in RAMM. All yellow cells under ‘Condition’ are to be populated in percentages except Roughness, which is to be reported as NAASRA counts.
3. Estimates
The ‘Estimates’ tab needs to be populated with the detailed estimate for each option being considered. These should be based on the Contractor’s scheduled rates for Schedule of Prices items 6.2 and 6.3.
Note: assess by %, rather than m
Note: SCRIM data on separate tab
Note: Change to assess other years
SM018 NPV Instructions
- 22 - Version 1 (June 2016)
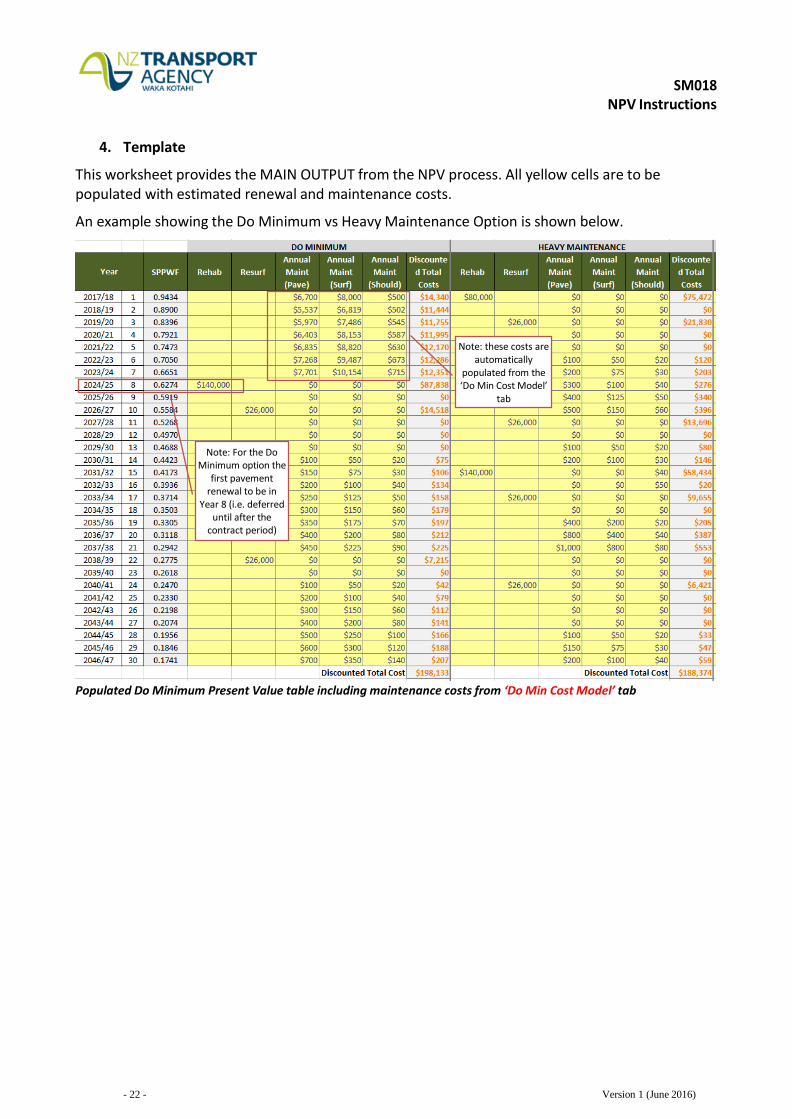
4. Template
This worksheet provides the MAIN OUTPUT from the NPV process. All yellow cells are to be populated with estimated renewal and maintenance costs.
An example showing the Do Minimum vs Heavy Maintenance Option is shown below.
Populated Do Minimum Present Value table including maintenance costs from ‘Do Min Cost Model’ tab
Note: these costs are automatically
populated from the ‘Do Min Cost Model’
tab
Note: For the Do Minimum option the
first pavement renewal to be in
Year 8 (i.e. deferred until after the
contract period)
SM018 NPV Instructions
- 23 - Version 1 (June 2016)
Output from Present Value tables showing overall NPV for Heavy Maintenance Option
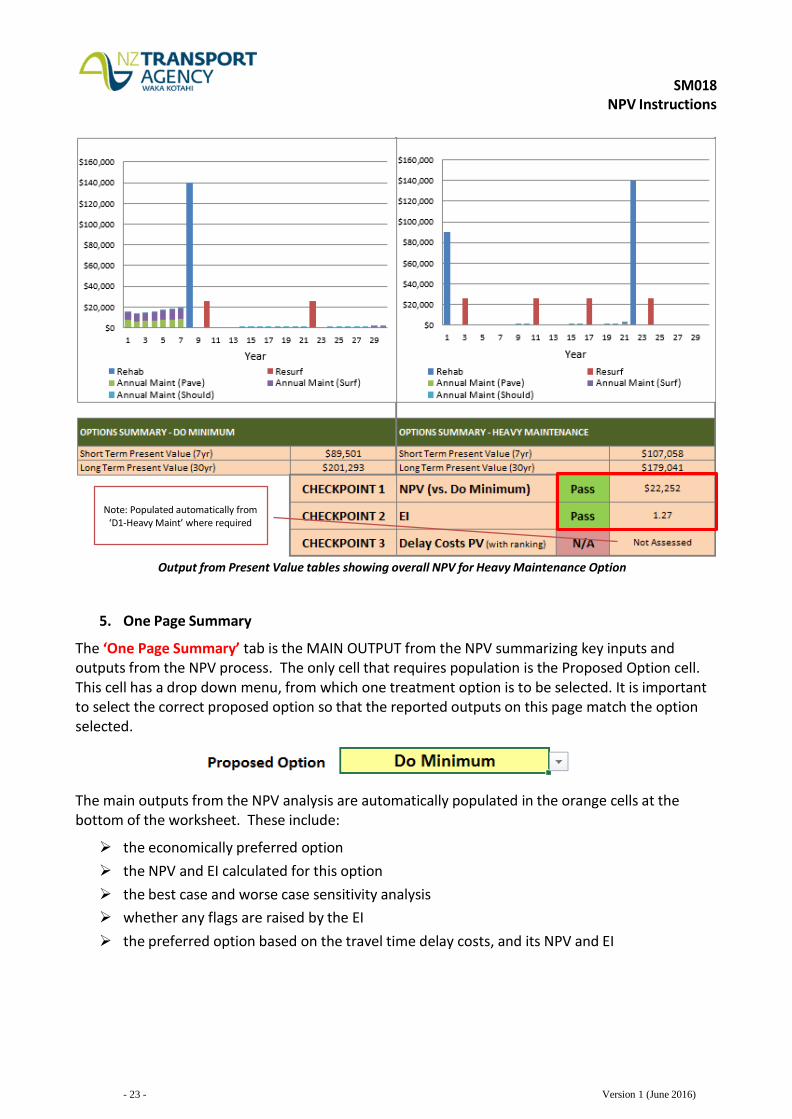
5. One Page Summary
The ‘One Page Summary’ tab is the MAIN OUTPUT from the NPV summarizing key inputs and outputs from the NPV process. The only cell that requires population is the Proposed Option cell. This cell has a drop down menu, from which one treatment option is to be selected. It is important to select the correct proposed option so that the reported outputs on this page match the option selected.
The main outputs from the NPV analysis are automatically populated in the orange cells at the bottom of the worksheet. These include:
the economically preferred option
the NPV and EI calculated for this option
the best case and worse case sensitivity analysis
whether any flags are raised by the EI
the preferred option based on the travel time delay costs, and its NPV and EI
Note: Populated automatically from
‘D1-Heavy Maint’ where required
SM018 NPV Instructions
- 24 - Version 1 (June 2016)
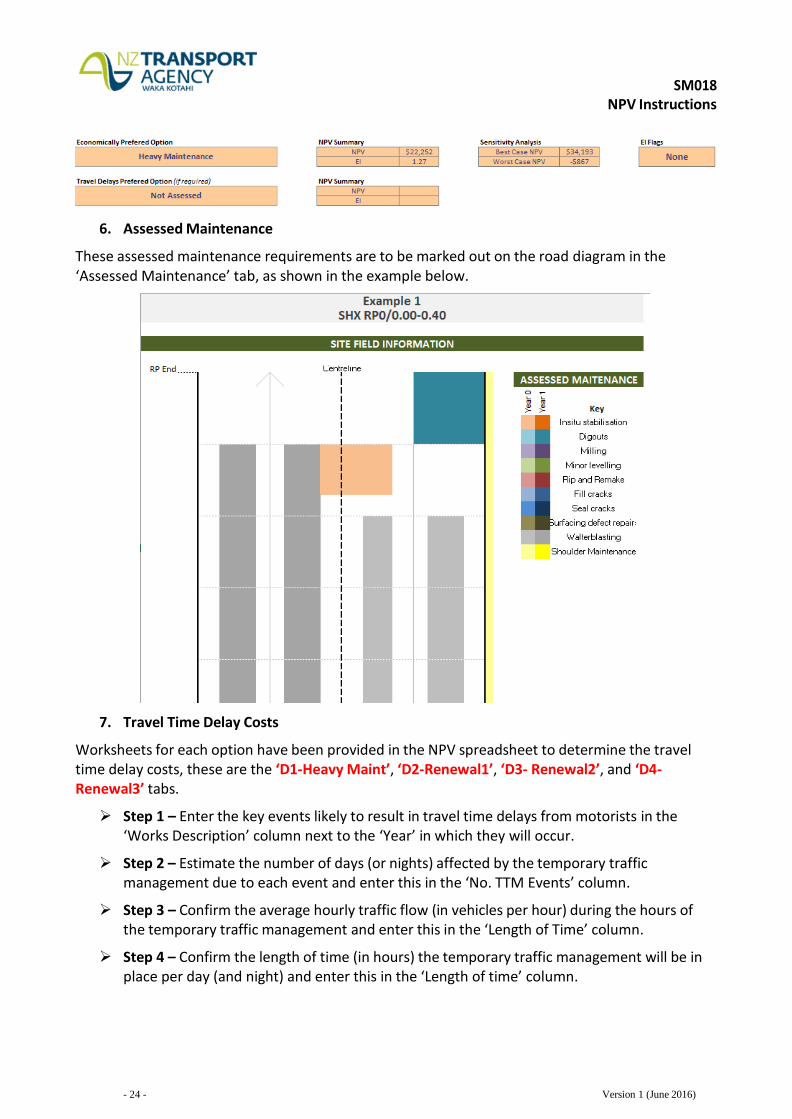
6. Assessed Maintenance
These assessed maintenance requirements are to be marked out on the road diagram in the ‘Assessed Maintenance’ tab, as shown in the example below.
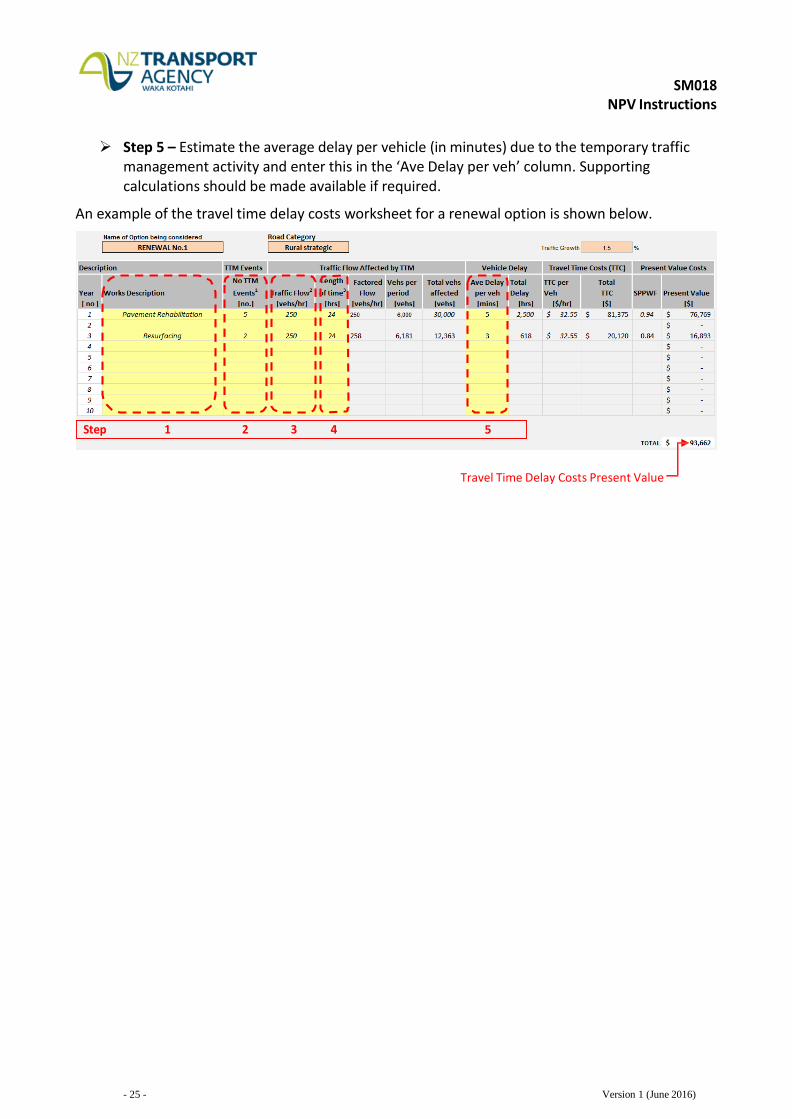
7. Travel Time Delay Costs
Worksheets for each option have been provided in the NPV spreadsheet to determine the travel time delay costs, these are the ‘D1-Heavy Maint’, ‘D2-Renewal1’, ‘D3- Renewal2’, and ‘D4- Renewal3’ tabs.
Step 1 – Enter the key events likely to result in travel time delays from motorists in the ‘Works Description’ column next to the ‘Year’ in which they will occur.
Step 2 – Estimate the number of days (or nights) affected by the temporary traffic management due to each event and enter this in the ‘No. TTM Events’ column.
Step 3 – Confirm the average hourly traffic flow (in vehicles per hour) during the hours of the temporary traffic management and enter this in the ‘Length of Time’ column.
Step 4 – Confirm the length of time (in hours) the temporary traffic management will be in place per day (and night) and enter this in the ‘Length of time’ column.
SM018 NPV Instructions
- 25 - Version 1 (June 2016)
Step 5 – Estimate the average delay per vehicle (in minutes) due to the temporary traffic management activity and enter this in the ‘Ave Delay per veh’ column. Supporting calculations should be made available if required.
An example of the travel time delay costs worksheet for a renewal option is shown below.
4 5
Travel Time Delay Costs Present Value
SM018 NPV Instructions
- 26 - Version 1 (June 2016)
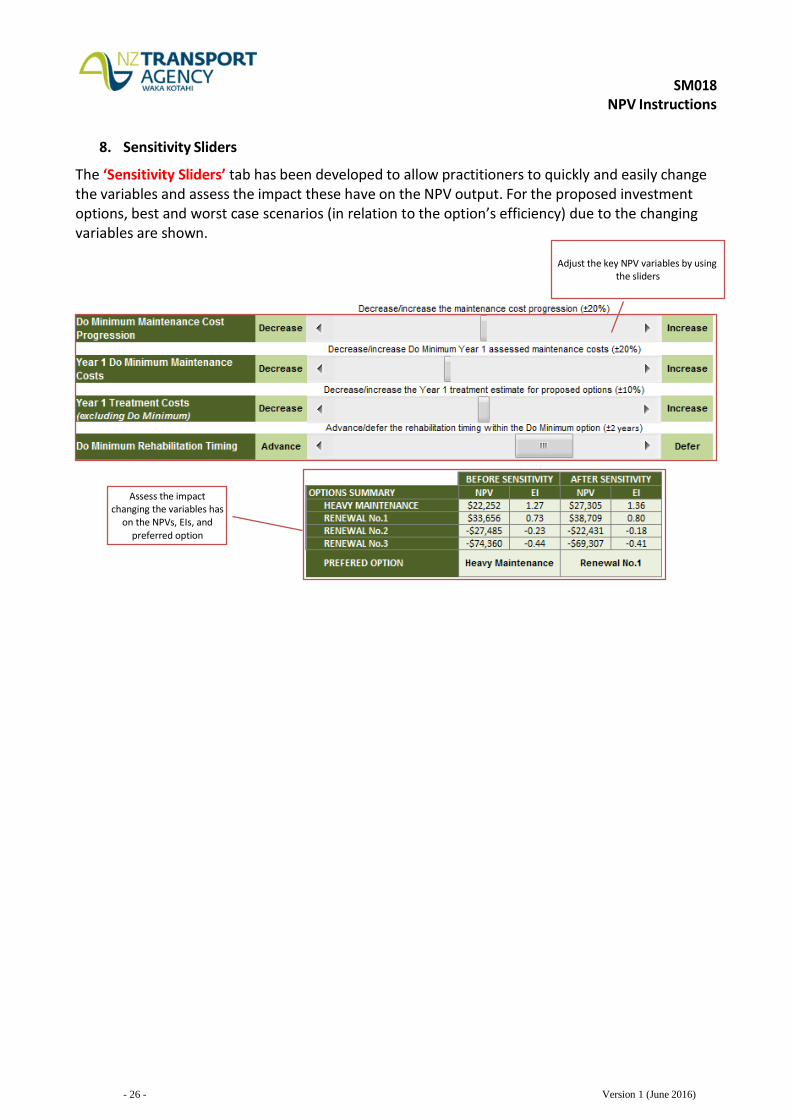
Adjust the key NPV variables by using
the sliders
8. Sensitivity Sliders
The ‘Sensitivity Sliders’ tab has been developed to allow practitioners to quickly and easily change the variables and assess the impact these have on the NPV output. For the proposed investment options, best and worst case scenarios (in relation to the option’s efficiency) due to the changing variables are shown.
Assess the impact changing the variables has
on the NPVs, EIs, and preferred option