NPS 1 NPS 2 Background Reserve MOS WLA 3 WLA 2 WLA1WLA1 North Canadian River Oklahoma River Shell...
51
NPS 1 NPS 2 Background Reserve MOS WLA 3 WLA 2 W L A 1 North Canadian River Oklahoma River Shell Creek Draft TMDLs For Bacteria PUBLIC MEETING PUBLIC MEETING
-
Upload
megan-hill -
Category
Documents
-
view
216 -
download
1
Transcript of NPS 1 NPS 2 Background Reserve MOS WLA 3 WLA 2 WLA1WLA1 North Canadian River Oklahoma River Shell...

NPS 1NPS 2
Background
Reserve
MOS
WLA 3
WLA 2
WLA1
North Canadian RiverOklahoma River
Shell Creek
Draft TMDLs For Bacteria
PUBLIC MEETINGPUBLIC MEETING

PUBLIC MEETINGPUBLIC MEETINGAgendaAgenda
• WELCOME
• INTRODUCTIONS
• STUDY OVERVIEW
• QUESTIONS
• COMMENTS

The Clean Water ActFirst Adopted 1972
Clean Water Goals:
July 1, 1983
Wherever attainable, Fishable Swimmable water quality
1985
Eliminate discharge of pollutants

How Do We Get There ???
Two Step Approach
• Technology-Based Limits For All Point Sources
• Additional Water Quality Based Controls To Meet Water Quality Standards

Identifying Problem Areas
Compare Monitoring Results
To
Water Quality Standards
Set Priorities
Compile Problem Areas And Priorities In the 303d
List

The TMDLAmount Of Pollution A Waterbody Can Receive Without Violating Water Quality StandardsPoint Sources
• Wasteload Allocations
Nonpoint Sources
Natural Background
• Load Allocations

The TMDL Pie
Total LoadAllocations
Total WasteloadAllocations
TotalUnallocated
NPS 1NPS 2
Background
Reserve
MOS
WLA 3
WLA 2
WLA1

Study OverviewsNorth Canadian River: Canton Dam to Yukon, including Shell Creek
Prepared by Parsons
And DEQPresented by Paul Yue
North Canadian River & Oklahoma River: Yukon to Dale
Prepared by ACOGPresented by John Harrington


Bacterial Standards
Bacteria Indicator
Standards(/100 ml)
Fecal Coliform 400
E-Coli 406
Enterococci 108

Monitoring Sites
NC02 NC05
NC03NC04
NC08
NC06
NC07
NC01
Shell Crk

Monitoring Data
• If more than 10% of data above the standards Problem
• North Canadian River (NC01)FC – 33% exceed
E-Coli – 13% exceedEnterococci – 94% exceed

NC02NC05
NC03
NC04
NC08
NC06
NC07
NC01
Shell Crk
FC – 33%EC – 13%
ENT – 94%
FC – 22%EC – 11%
ENT – 72% FC – 24%EC – 0%
ENT – 76%
FC – 67%EC – 6%
ENT – 89% FC – 47%EC – 6%
ENT – 82%


Monitoring Data
Fecal Coliform (NC01)(33% data above standard)
0
2000
4000
6000
8000
10000
12000
4/1/2003 6/1/2003 8/1/2003 10/1/2003 12/1/2003
Time
Fec
al C
olif
orm
(/1
00
ml)
Fecal Coliform Data Standard

Monitoring Data
Enterococci (NC01)(94% data above standard)
0
2,000
4,000
6,000
8,000
4/1/2003 6/1/2003 8/1/2003 10/1/2003 12/1/2003
Time
En
tero
cocc
i (/1
00
ml)
Enterococci Data Standard

Monitoring Data
Fecal Coliform (Shell Creek)(50% data above standard)
0
1000
2000
3000
4000
5000
6000
3/1/2000 8/1/2000 12/31/2000
6/2/2001 11/1/2001
4/3/2002
Time
Fe
ca
l Co
lifo
rm (
/10
0
ml)
Fecal Coliform Data Standard

Monitoring Data
Fecal Coliform (NC05)(67% data above standard)
0
10,000
20,000
30,000
40,000
50,000
4/1/2003 6/1/2003 8/1/2003 10/1/2003 12/1/2003
Time
Fec
al C
olif
orm
(/
100m
l)
Fecal Coliform Data Standard

Pollutant Sources
• Point Sources– Permitted discharge - Watonga– No-discharge facilities – 6– CAFOs - 4

Pollutant Sources
• Non-Point Sources– Livestock– Pets– Failing Septic Tanks– Wildlife
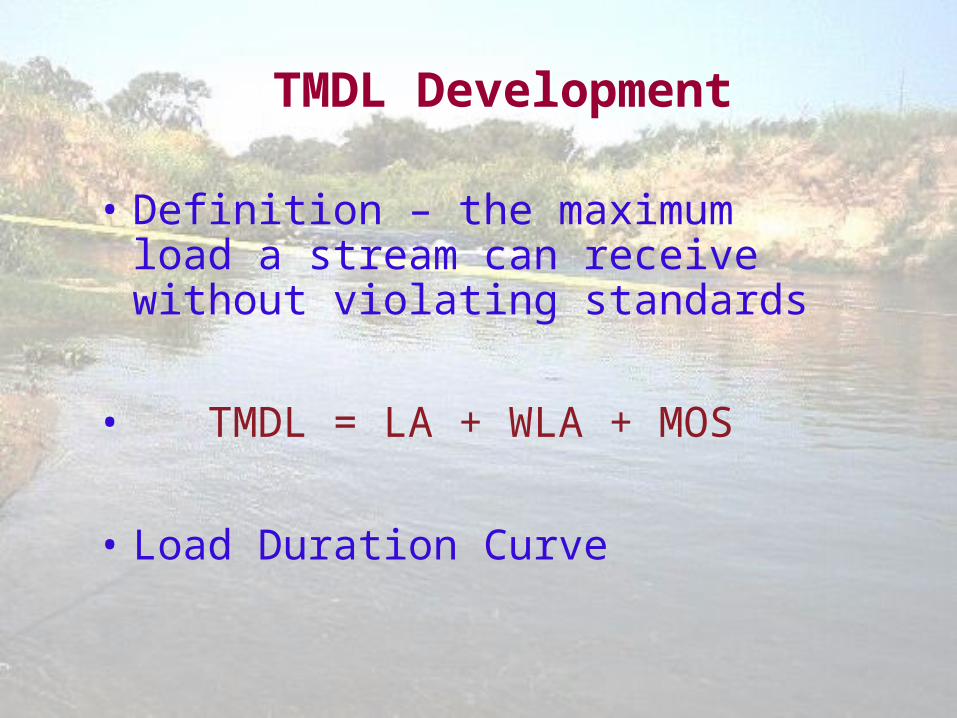
TMDL Development
• Definition – the maximum load a stream can receive without violating standards
• TMDL = LA + WLA + MOS
• Load Duration Curve

Load Duration Curve
• Step #1: Flow Duration Curve

Load Duration Curve
• Step #2: Load = C * Flow * Standard
Fecal Coliform Load Duration Curve 1990-2001, Station S-050
1.E+10
1.E+11
1.E+12
1.E+13
1.E+14
0 10 20 30 40 50 60 70 80 90 100
Flow Exceedance Percentile
Fe
cal C
olif
orm
Da
ily L
oa
d (
#/d
ay)
Load at WQ Criterion Load at WQ Target FC Observations 90 Percentile FC Load
46%68%
68%

North Canadian River
• Fecal Coliform - 88% Reduction

North Canadian River
• Enterococci - 89% Reduction

Shell Creek
• Fecal Coliform - 92% Reduction

Study OverviewsNorth Canadian River: Canton Dam to Yukon, including Shll Creek
Prepared by Parsons
And DEQPresented by Paul Yue
North Canadian River & Oklahoma River: Yukon to Dale
Prepared by ACOGPresented by John Harrington


Highway 81 El Reno Station
Rope Swing, Garth Brooks Blvd

Anderson Road, Oklahoma County
Dale, Oklahoma


Bacterial Standards
Bacteria Indicator
Standards(/100 ml)
Fecal Coliform 400
E-Coli 406
Enterococci 108

FECAL COLIFORM SUMMARY CHART

ENTEROCOCCI SUMMARY CHART

EL RENO STATION ENTEROCOCCI
REDUCTION GOAL: 95.6%

WHERE DO WE GO FROM HERE??

What Do the Municipalities Do???
Phase II Stormwater Program
Six “Minimum Control Measures”
Public Education and Outreach Public Participation and Involvement
Illicit Discharge Detection and Elimination
Best Management Practices – Illicit Discharge Detection, Erosion Control, Ordinances
Construction Site Runoff Control Post-Construction Runoff Control
Pollution Prevention and Good Housekeeping

ImplementationHow Can We Get There ???NonPoint Sources
• Voluntary Programs ONLY• Cost Share & Incentives
• Technical Assistance

ImplementationHow Can We Get There ???
Point Sources
CAFOs
• “No Discharge”
• Good Housekeeping BMPs

ImplementationHow Can We Get There ???
Point Sources
Wastewater Treatment Plants
• No Effect
• Current Limits = WQS
• Enforcement
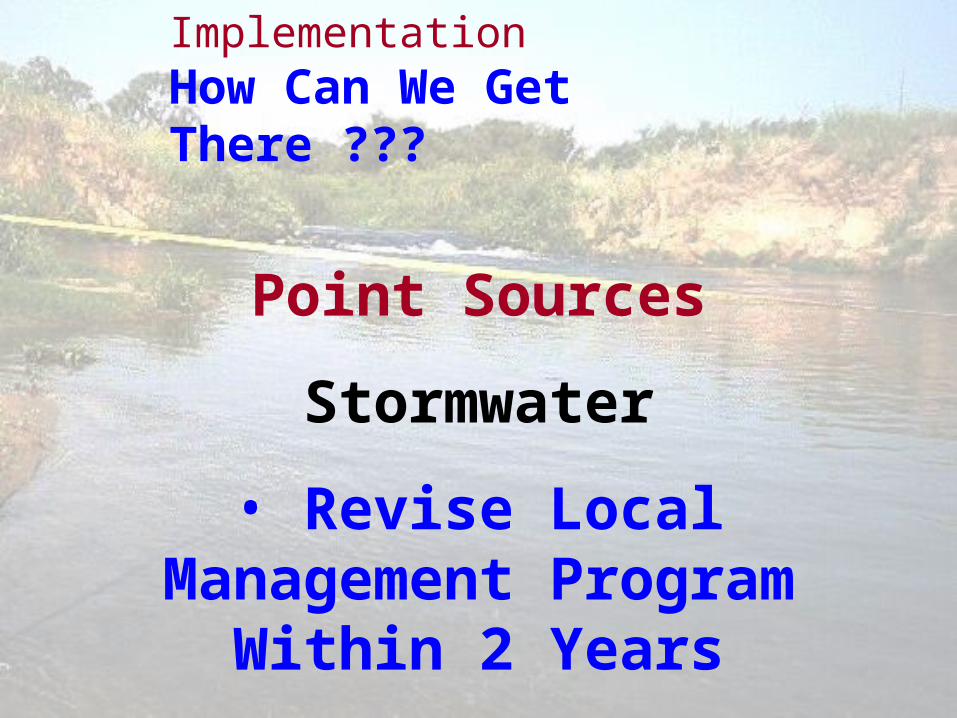
ImplementationHow Can We Get There ???
Point Sources
Stormwater
• Revise Local Management Program Within 2 Years
• Consider Listed BMPs

ImplementationHow Can We Get There ???
Point Sources
Stormwater
• Monitoring Program
• NO Numeric Effluent Limits

Stormwater PermitsWithin The Watershed
• Yukon
• Mustang
• Bethany
• Warr Acres
• Moore
• Del City
• Midwest City
• Oklahoma City
• Spencer
• Nicoma Park
• Choctaw
• ODOT
• OTA
• Tinker AFB

Example BMPsStormwater & NonPoint Source
Best Management Practice
ImpairmentSource Reported
EfficiencyRURAL URBAN
Animal waste management X X 75 %
Detention pond/basin X X 25 % - 51%
Fencing X 75 %
Filtration (e.g., sand filters) X X 30 % - 51%
Infiltration Basin X 50 %

Example BMPsStormwater & NonPoint Source
Best Management Practice
ImpairmentSource Reported
EfficiencyRURAL URBAN
Onsite treatment system installation X X
Porous pavement X 50 %
Rain gardenbio-retention basin
X 40 %
Retention ponds/basins X X 32 %
Riparian Buffer Zone X X 43 – 57 %

Example BMPsStormwater & NonPoint Source
Best Management Practice
ImpairmentSource Reported
EfficiencyRURAL URBAN
Septic system pump-out X X 5 %
Sewer line maintenance/sewer flushing
X
Stream bank protection and stabilization
X X 40 - 75 %
Vegetated filter strip X X
Wetland development or enhancement - including creation and restoration
X X 30 %

What Happens Next ?
• Comments Accepted Through April 21• Comment Responsiveness Summary
Late May• Final Draft Submitted For EPA Approval
Early June• Incorporate In Water Quality Management Plan
Includes Additional Public Participation

How To Provide Comments
Oral Comments Accepted This Evening
By Mail:Dr. Karen MilesWater Quality DivisionOklahoma Department of Environmental QualityP.O. Box 1677Oklahoma City, OK 73101-1677
By Email:[email protected]
Comments Must Be Received By
APRIL 21 !

QUESTIONS

COMMENTS

Thank You