NPOWER - Nielsenen-us.nielsen.com/sitelets/cls/documents/npower/tips/N...12 VISIT OR CALL...
18
NPOWER VIDEO ON DEMAND REPORT GUIDE SUMMER 2013
Transcript of NPOWER - Nielsenen-us.nielsen.com/sitelets/cls/documents/npower/tips/N...12 VISIT OR CALL...

N P O W E RVIDEO ON DEMAND REPORT GUIDESUMMER 2013
2 VISIT http://en-us.nielsen.com/sitelets/cls/npower.html OR CALL 1-800-423-4511 Copyright © 2013 The Nielsen Company
VIDEO ON DEMANDToday’s TV landscape allows networks to distribute their program content
on multiple platforms, including traditional TV, on-demand and digital
platforms. The terminology we use to differentiate between traditional TV
and non-traditional, on-demand viewing sources is linear versus non-linear.
With the proper subscriptions and encoding, NPOWER can now help you
take a look at how non-linear programming potentially impacts linear
viewing and vice versa.
3Copyright © 2013 The Nielsen Company
CONTENTSClick the blue links below to navigate directly to the content in this guide.
HOW DO I REPORT A COMBINED TOTAL
RATING POINT FOR VIDEO ON DEMAND
AND LINEAR? . . . . . . . . . . . . . . . . . . . . . . . . . . . . . . . . . . . . . . . . . . . . . . . 4-5
HOW DO I REPORT COMBINED AVERAGE
AUDIENCE METRICS FOR VIDEO ON DEMAND
AND LINEAR? ........................................................ 6-9
HOW DO I REPORT COMBINED REACH METRICS
FOR VIDEO ON DEMAND AND LINEAR?...... 10-11
DID MY LINEAR VIEWERS ALSO TUNE IN TO
MY VIDEO ON DEMAND CONTENT? .............12-13
HOW CAN I TRACK WHICH PROGRAMS MY
VIDEO ON DEMAND VIEWERS ARE TUNING IN
TO ON LINEAR, OR VICE VERSA?.................. 14-15
CAN I RUN VIDEO ON DEMAND USAGE IN
A TIME PERIOD REPORT? ...................................... 16
HOW DO I BREAK OUT REACH FOR RECENTLY
TELECAST VIDEO ON DEMAND? .......................... 17
4 VISIT http://en-us.nielsen.com/sitelets/cls/npower.html OR CALL 1-800-423-4511 Copyright © 2013 The Nielsen Company
REPORT GUIDE: VIDEO ON DEMAND
HOW DO I REPORT A COMBINED TOTAL RATING POINT FOR VIDEO ON DEMAND AND LINEAR?
This Total Rating Point is a sum of all Average Audience (AA) ratings and similar in concept to a Gross Rating Point which
is based on unduplicated reach metrics. All reports processed post May 2013 will receive the new calculation regardless of
the measurement interval selected, including historical back data. For clients looking to replicate the previously reported
AA, they should add the Total Rating Point and reference those values.
For a better understanding of the difference between a Total Rating Point and a Gross Rating Point, click the link to see the
comparison grid in the Video on Demand Frequently Asked Questions (FAQ).
Note: Total Rating Points are only available in the Program, Episode, and Trackage level, any other options will result in the
Total Rating Point column being omitted from the report.
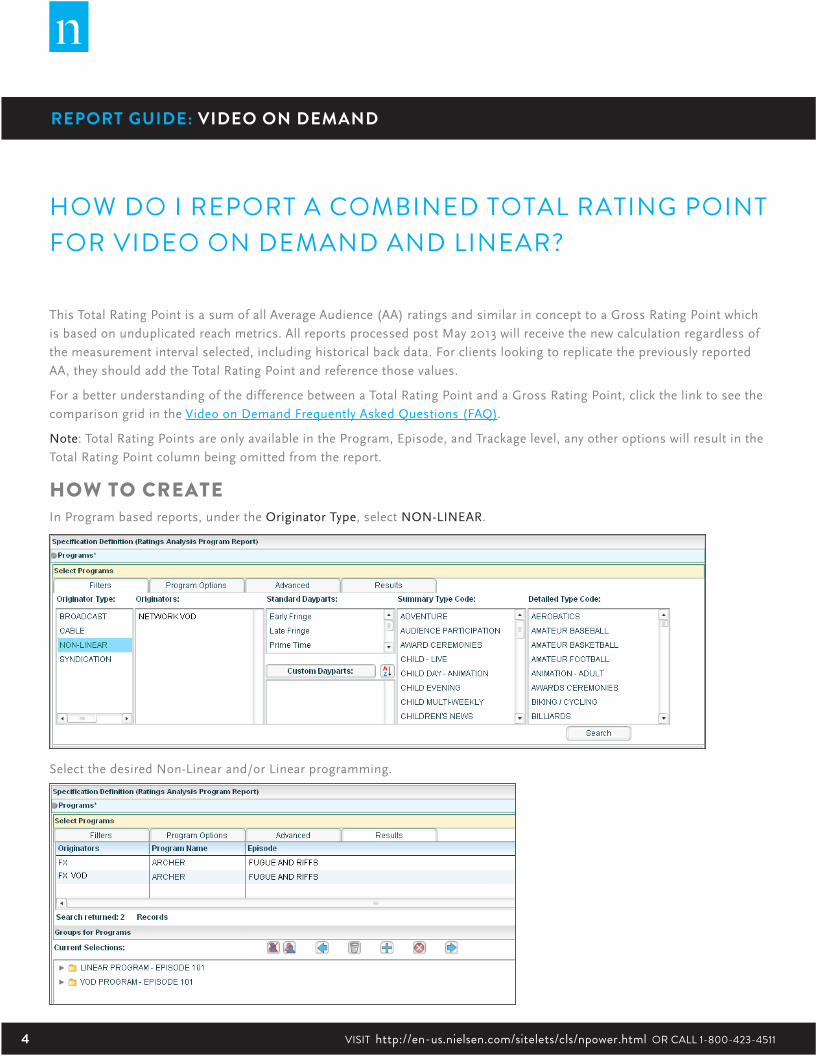
HOW TO CREATE In Program based reports, under the Originator Type, select NON-LINEAR.
Select the desired Non-Linear and/or Linear programming.
REPORT GUIDE: VIDEO ON DEMAND
5Copyright © 2013 The Nielsen Company
REPORT GUIDE: VIDEO ON DEMAND REPORT GUIDE: VIDEO ON DEMAND
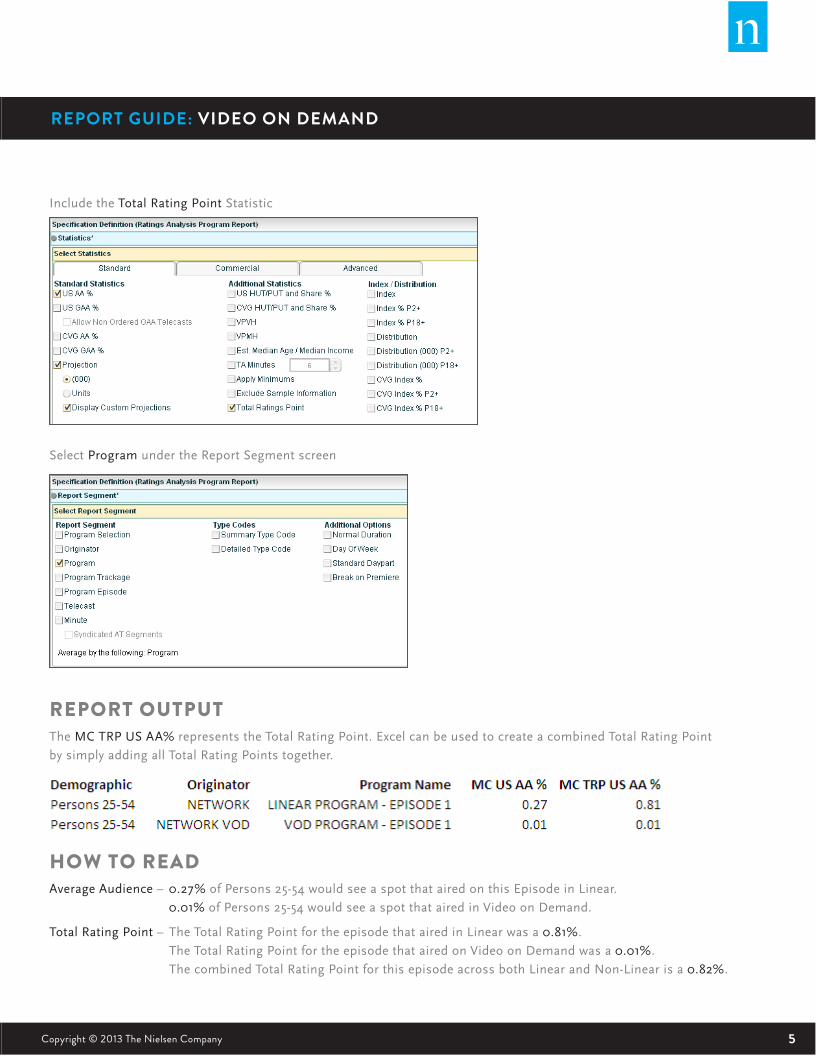
Include the Total Rating Point Statistic
Select Program under the Report Segment screen
REPORT OUTPUTThe MC TRP US AA% represents the Total Rating Point. Excel can be used to create a combined Total Rating Point
by simply adding all Total Rating Points together.
HOW TO READAverage Audience – 0.27% of Persons 25-54 would see a spot that aired on this Episode in Linear.
0.01% of Persons 25-54 would see a spot that aired in Video on Demand.
Total Rating Point – The Total Rating Point for the episode that aired in Linear was a 0.81%.
The Total Rating Point for the episode that aired on Video on Demand was a 0.01%.
The combined Total Rating Point for this episode across both Linear and Non-Linear is a 0.82%.
6 VISIT http://en-us.nielsen.com/sitelets/cls/npower.html OR CALL 1-800-423-4511 Copyright © 2013 The Nielsen Company
REPORT GUIDE: VIDEO ON DEMAND REPORT GUIDE: VIDEO ON DEMAND
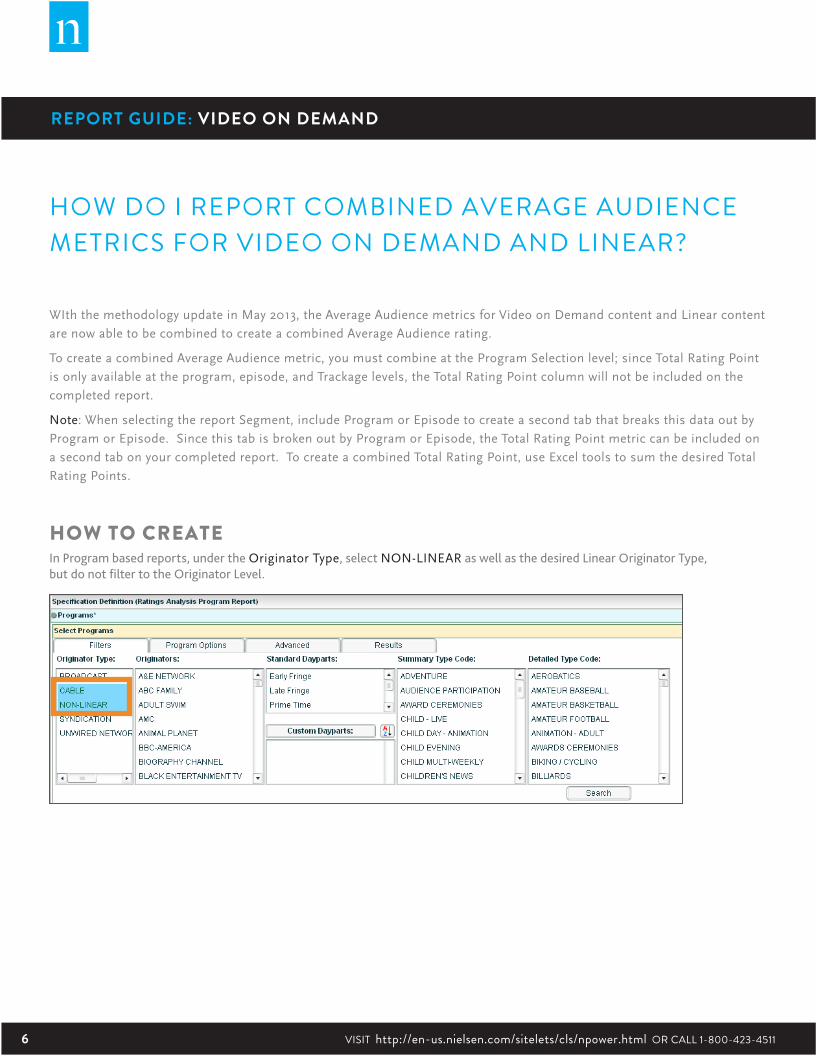
HOW DO I REPORT COMBINED AVERAGE AUDIENCE METRICS FOR VIDEO ON DEMAND AND LINEAR?
WIth the methodology update in May 2013, the Average Audience metrics for Video on Demand content and Linear content
are now able to be combined to create a combined Average Audience rating.
To create a combined Average Audience metric, you must combine at the Program Selection level; since Total Rating Point
is only available at the program, episode, and Trackage levels, the Total Rating Point column will not be included on the
completed report.
Note: When selecting the report Segment, include Program or Episode to create a second tab that breaks this data out by
Program or Episode. Since this tab is broken out by Program or Episode, the Total Rating Point metric can be included on
a second tab on your completed report. To create a combined Total Rating Point, use Excel tools to sum the desired Total
Rating Points.
HOW TO CREATE In Program based reports, under the Originator Type, select NON-LINEAR as well as the desired Linear Originator Type, but do not filter to the Originator Level.
7Copyright © 2013 The Nielsen Company
REPORT GUIDE: VIDEO ON DEMAND REPORT GUIDE: VIDEO ON DEMAND
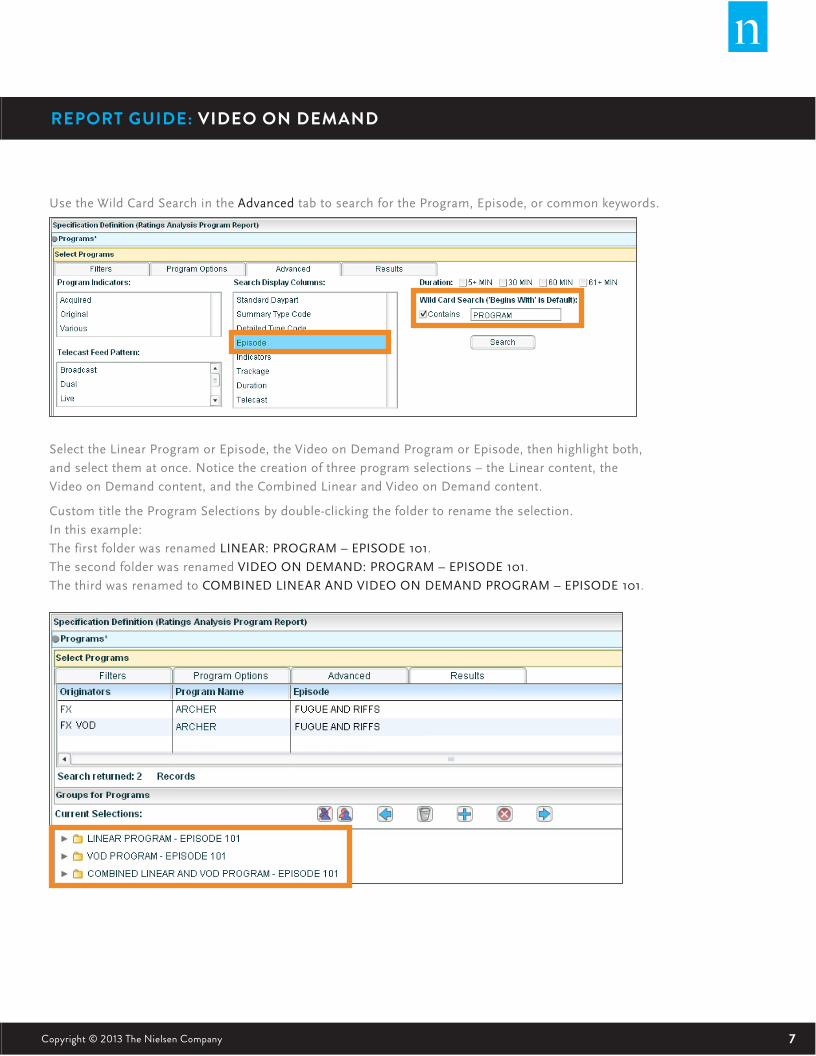
Use the Wild Card Search in the Advanced tab to search for the Program, Episode, or common keywords.
Select the Linear Program or Episode, the Video on Demand Program or Episode, then highlight both,
and select them at once. Notice the creation of three program selections – the Linear content, the
Video on Demand content, and the Combined Linear and Video on Demand content.
Custom title the Program Selections by double-clicking the folder to rename the selection.
In this example:
The first folder was renamed LINEAR: PROGRAM – EPISODE 101.
The second folder was renamed VIDEO ON DEMAND: PROGRAM – EPISODE 101.
The third was renamed to COMBINED LINEAR AND VIDEO ON DEMAND PROGRAM – EPISODE 101.

8 VISIT http://en-us.nielsen.com/sitelets/cls/npower.html OR CALL 1-800-423-4511 Copyright © 2013 The Nielsen Company
REPORT GUIDE: VIDEO ON DEMAND REPORT GUIDE: VIDEO ON DEMAND
Select Program Selection from the Report Segment screen.
Tip: Once Program Selection has been added, a second report can be run at the same time on the Program,
or Episode level by selecting the appropriate box, then adding a second selection. Each selection added will be
a separate tab on the exported Excel file.
REPORT OUTPUT
9Copyright © 2013 The Nielsen Company
REPORT GUIDE: VIDEO ON DEMAND REPORT GUIDE: VIDEO ON DEMAND
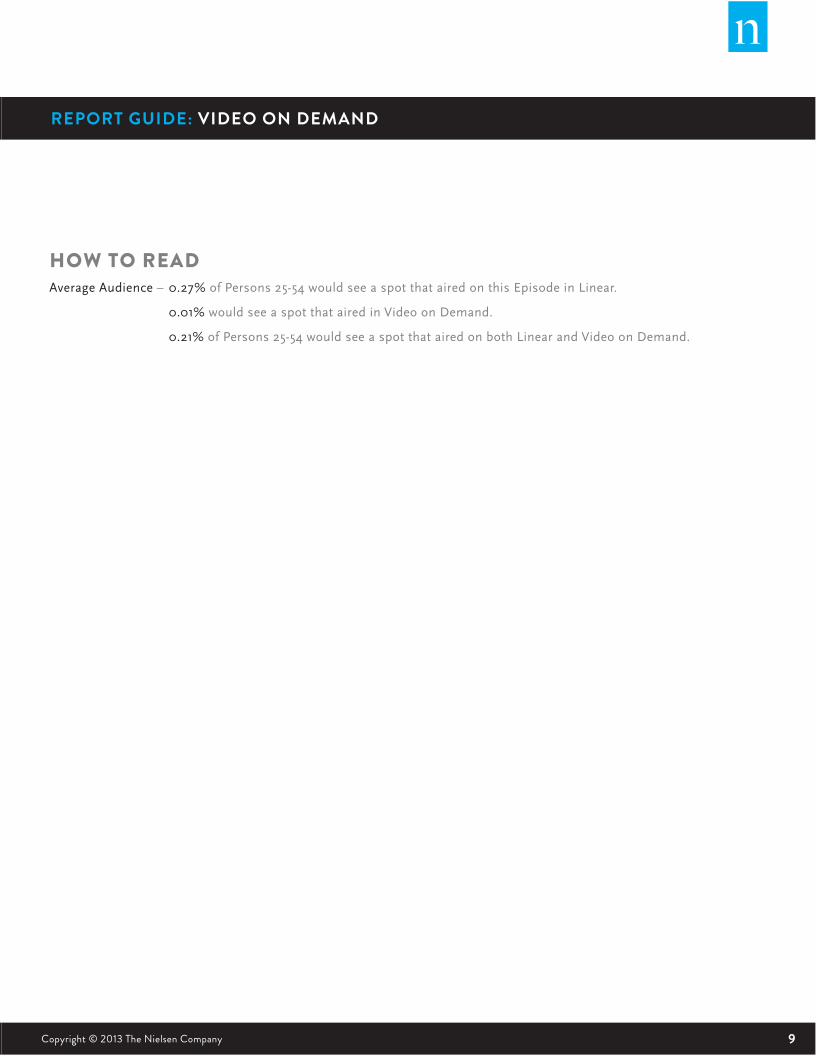
HOW TO READAverage Audience – 0.27% of Persons 25-54 would see a spot that aired on this Episode in Linear.
0.01% would see a spot that aired in Video on Demand.
0.21% of Persons 25-54 would see a spot that aired on both Linear and Video on Demand.
10 VISIT http://en-us.nielsen.com/sitelets/cls/npower.html OR CALL 1-800-423-4511 Copyright © 2013 The Nielsen Company
REPORT GUIDE: VIDEO ON DEMAND REPORT GUIDE: VIDEO ON DEMAND
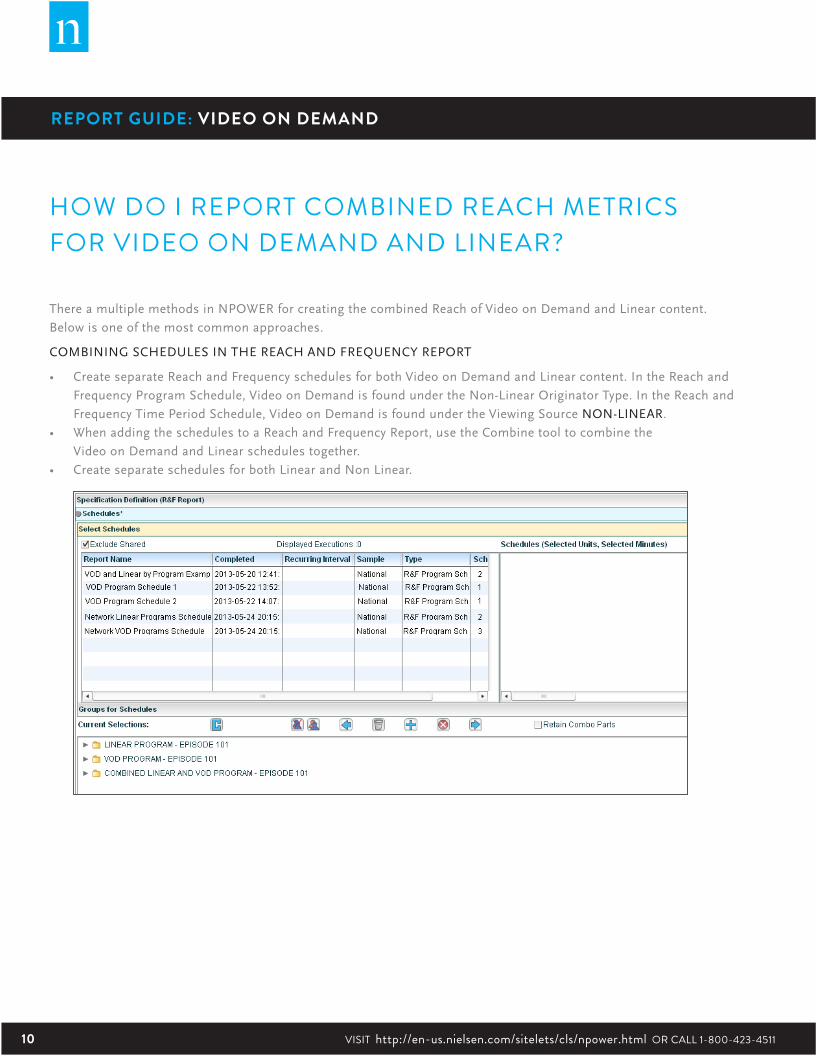
HOW DO I REPORT COMBINED REACH METRICS FOR VIDEO ON DEMAND AND LINEAR?
There a multiple methods in NPOWER for creating the combined Reach of Video on Demand and Linear content.
Below is one of the most common approaches.
COMBINING SCHEDULES IN THE REACH AND FREQUENCY REPORT
• Create separate Reach and Frequency schedules for both Video on Demand and Linear content. In the Reach and
Frequency Program Schedule, Video on Demand is found under the Non-Linear Originator Type. In the Reach and
Frequency Time Period Schedule, Video on Demand is found under the Viewing Source NON-LINEAR.
• When adding the schedules to a Reach and Frequency Report, use the Combine tool to combine the
Video on Demand and Linear schedules together.
• Create separate schedules for both Linear and Non Linear.
11Copyright © 2013 The Nielsen Company
REPORT GUIDE: VIDEO ON DEMAND REPORT GUIDE: VIDEO ON DEMAND
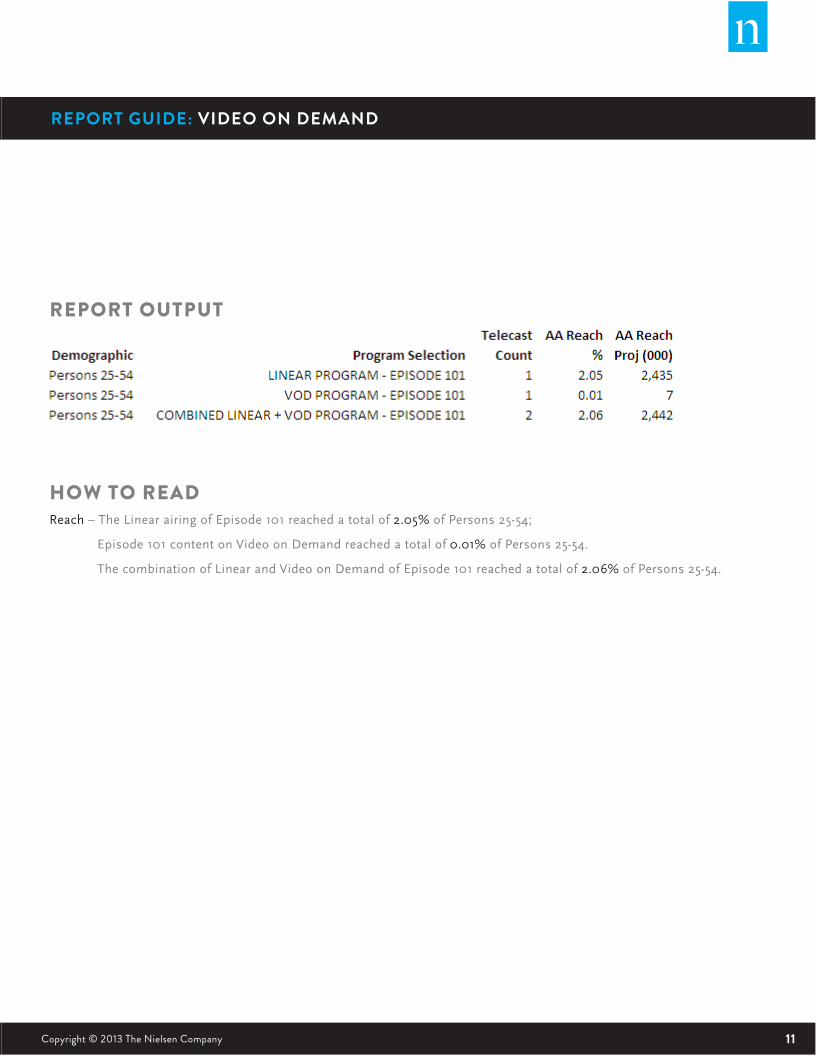
REPORT OUTPUT
HOW TO READReach – The Linear airing of Episode 101 reached a total of 2.05% of Persons 25-54;
Episode 101 content on Video on Demand reached a total of 0.01% of Persons 25-54.
The combination of Linear and Video on Demand of Episode 101 reached a total of 2.06% of Persons 25-54.
12 VISIT http://en-us.nielsen.com/sitelets/cls/npower.html OR CALL 1-800-423-4511 Copyright © 2013 The Nielsen Company
REPORT GUIDE: VIDEO ON DEMAND REPORT GUIDE: VIDEO ON DEMAND
DID MY LINEAR VIEWERS ALSO TUNE IN TO MY VIDEO ON DEMAND CONTENT?
There a multiple methods for creating a metric that reflect if Linear viewers also tune in to Video on Demand content.
Below is one of the more common approaches.
THE REACH AND FREQUENCY DUPLICATION REPORT
Create separate Reach and Frequency schedules for both Video on Demand and Linear content. In the Reach and Frequency
Program Schedule, Video on Demand is found under the Non-Linear Originator Type. In the Reach and Frequency Time
Period Schedule, Video on Demand is found under the Viewing Source NON-LINEAR.
Pull these schedules into a Duplication report
Tip: This same strategy can be used to analyze the relationship between Video on Demand viewers and Linear viewers.
A few ideas on how this might be used:
• Find duplication between those who viewed specific Program or Episode content via Linear and Non-Linear sources.
• Find duplication between those who tuned into a specific Linear Episode and those who viewed the previous episodes
on Video on Demand.
• Find duplication of those who tuned in to an entire season on Linear compared to those who viewed an entire season
on Video on Demand.
Example Scenario:
How many of the viewers of my Linear premier episode used Video on Demand to watch the previous episode?
13Copyright © 2013 The Nielsen Company
REPORT GUIDE: VIDEO ON DEMAND REPORT GUIDE: VIDEO ON DEMAND
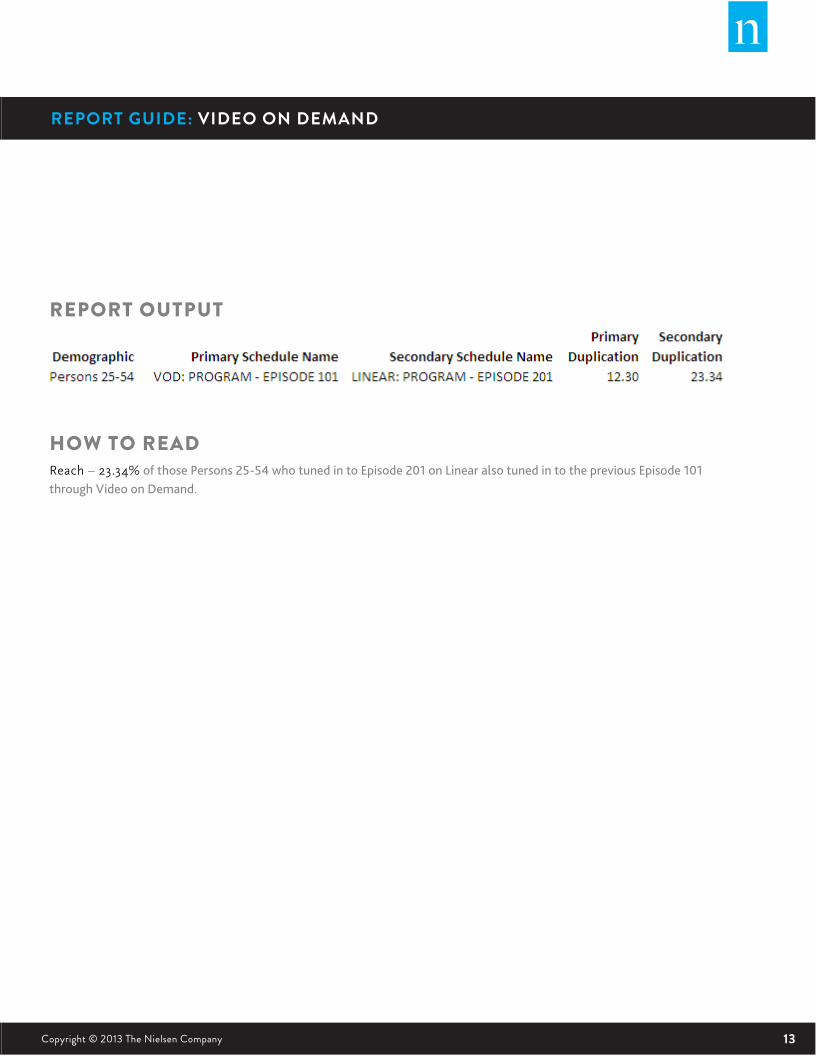
REPORT OUTPUT
HOW TO READReach – 23.34% of those Persons 25-54 who tuned in to Episode 201 on Linear also tuned in to the previous Episode 101 through Video on Demand.

14 VISIT http://en-us.nielsen.com/sitelets/cls/npower.html OR CALL 1-800-423-4511 Copyright © 2013 The Nielsen Company
REPORT GUIDE: VIDEO ON DEMAND REPORT GUIDE: VIDEO ON DEMAND
HOW CAN I TRACK WHICH PROGRAMS MY VIDEO ON DEMAND VIEWERS ARE TUNING IN TO ON LINEAR, OR VICE VERSA?
There a multiple methods for tracking what Linear programs Video On Demand viewers are tuning in to,
and vice versa. Below are two strategies.
STRATEGY 1 THE REACH AND FREQUENCY DUPLICATION REPORT
• Create a Reach and Frequency Program or Time Period schedule for the Video on Demand content by full program,
specific episode, or by entire Viewing Source. Create a separate Reach and Frequency Program Schedule broken out
by Program.
• Pull these schedules into a Duplication report; when looking at the output, use the Primary or Secondary Duplication.
REPORT OUTPUT
HOW TO READ Primary Duplication –
85.83% of those Persons 25-54 who tuned in to the Video on Demand for my network also tuned in to the Linear Program A.
0.30% of those Persons 25-54 who tuned in to Linear Program A tuned in to my Video on Demand content.
15Copyright © 2013 The Nielsen Company
REPORT GUIDE: VIDEO ON DEMAND REPORT GUIDE: VIDEO ON DEMAND
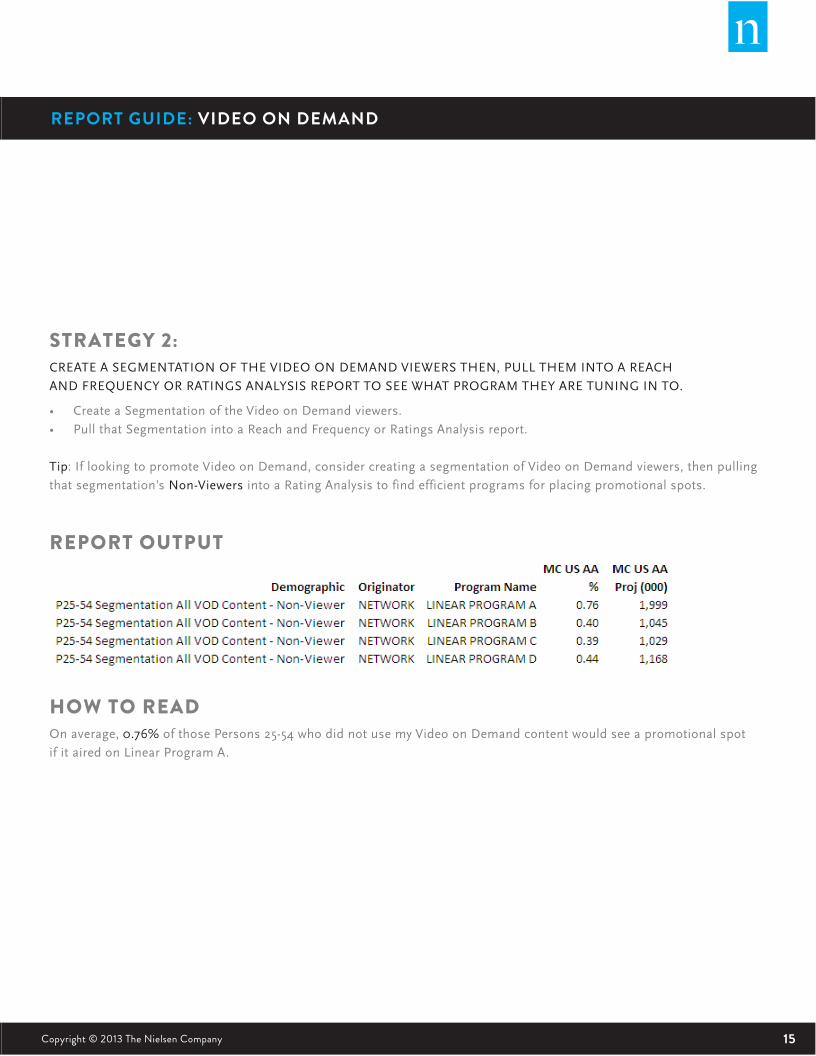
STRATEGY 2: CREATE A SEGMENTATION OF THE VIDEO ON DEMAND VIEWERS THEN, PULL THEM INTO A REACH
AND FREQUENCY OR RATINGS ANALYSIS REPORT TO SEE WHAT PROGRAM THEY ARE TUNING IN TO.
• Create a Segmentation of the Video on Demand viewers.
• Pull that Segmentation into a Reach and Frequency or Ratings Analysis report.
Tip: If looking to promote Video on Demand, consider creating a segmentation of Video on Demand viewers, then pulling
that segmentation’s Non-Viewers into a Rating Analysis to find efficient programs for placing promotional spots.
REPORT OUTPUT
HOW TO READOn average, 0.76% of those Persons 25-54 who did not use my Video on Demand content would see a promotional spot
if it aired on Linear Program A.
16 VISIT http://en-us.nielsen.com/sitelets/cls/npower.html OR CALL 1-800-423-4511 Copyright © 2013 The Nielsen Company
REPORT GUIDE: VIDEO ON DEMAND REPORT GUIDE: VIDEO ON DEMAND
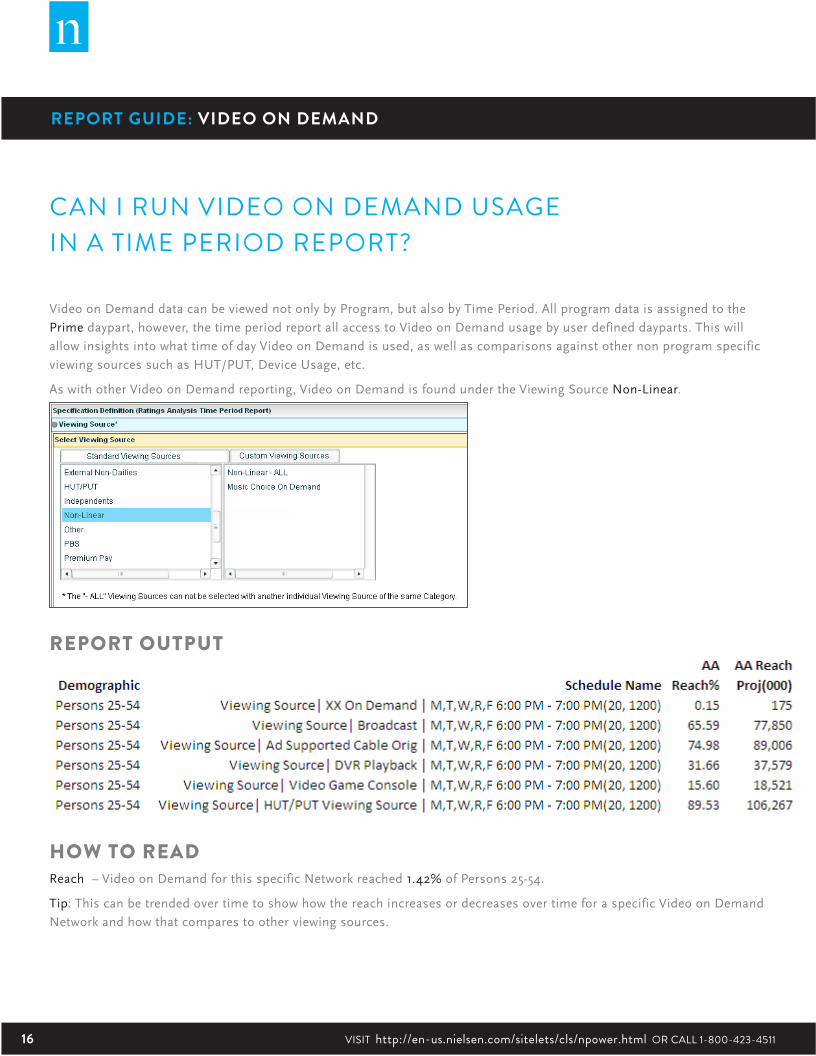
CAN I RUN VIDEO ON DEMAND USAGE IN A TIME PERIOD REPORT?
Video on Demand data can be viewed not only by Program, but also by Time Period. All program data is assigned to the
Prime daypart, however, the time period report all access to Video on Demand usage by user defined dayparts. This will
allow insights into what time of day Video on Demand is used, as well as comparisons against other non program specific
viewing sources such as HUT/PUT, Device Usage, etc.
As with other Video on Demand reporting, Video on Demand is found under the Viewing Source Non-Linear.
REPORT OUTPUT
HOW TO READ Reach – Video on Demand for this specific Network reached 1.42% of Persons 25-54.
Tip: This can be trended over time to show how the reach increases or decreases over time for a specific Video on Demand
Network and how that compares to other viewing sources.
17Copyright © 2013 The Nielsen Company
REPORT GUIDE: VIDEO ON DEMAND REPORT GUIDE: VIDEO ON DEMAND
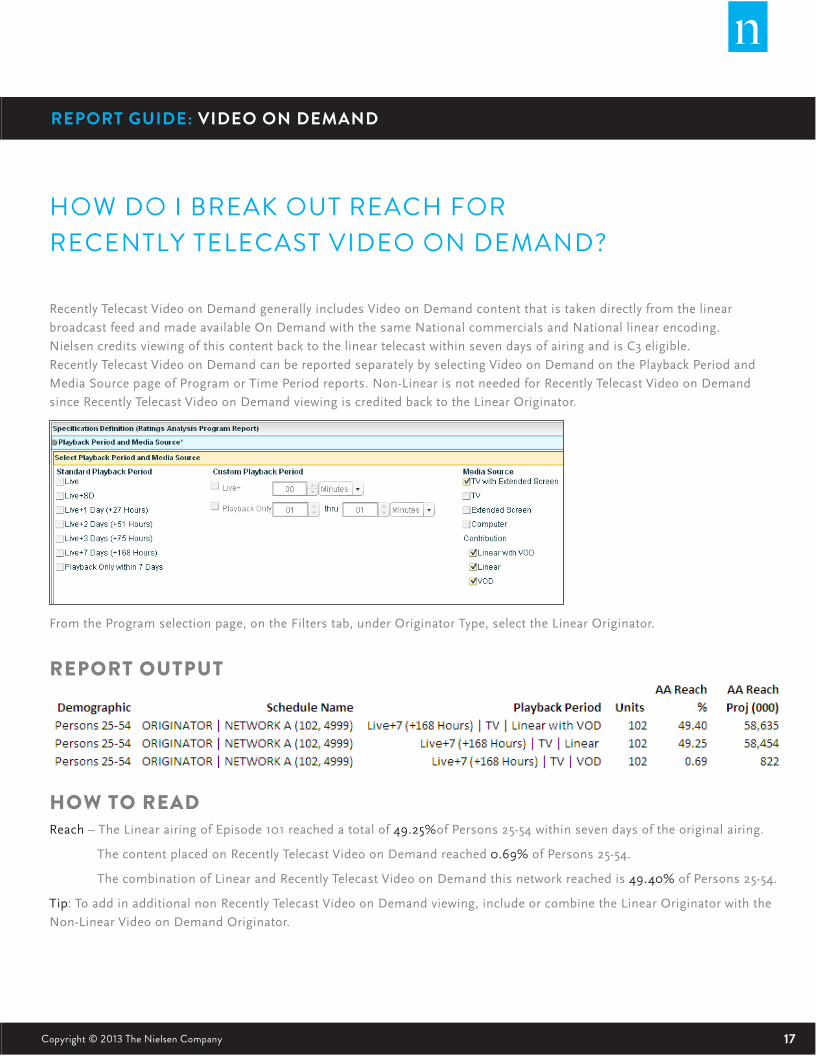
HOW DO I BREAK OUT REACH FOR RECENTLY TELECAST VIDEO ON DEMAND?
Recently Telecast Video on Demand generally includes Video on Demand content that is taken directly from the linear
broadcast feed and made available On Demand with the same National commercials and National linear encoding.
Nielsen credits viewing of this content back to the linear telecast within seven days of airing and is C3 eligible.
Recently Telecast Video on Demand can be reported separately by selecting Video on Demand on the Playback Period and
Media Source page of Program or Time Period reports. Non-Linear is not needed for Recently Telecast Video on Demand
since Recently Telecast Video on Demand viewing is credited back to the Linear Originator.
From the Program selection page, on the Filters tab, under Originator Type, select the Linear Originator.
REPORT OUTPUT
HOW TO READReach – The Linear airing of Episode 101 reached a total of 49.25%of Persons 25-54 within seven days of the original airing.
The content placed on Recently Telecast Video on Demand reached 0.69% of Persons 25-54.
The combination of Linear and Recently Telecast Video on Demand this network reached is 49.40% of Persons 25-54.
Tip: To add in additional non Recently Telecast Video on Demand viewing, include or combine the Linear Originator with the
Non-Linear Video on Demand Originator.

18 VISIT http://en-us.nielsen.com/sitelets/cls/npower.html OR CALL 1-800-423-4511
ABOUT NIELSEN Nielsen Holdings N.V. (NYSE: NLSN) is a global information and
measurement company with leading market positions in marketing
and consumer information, television and other media measurement,
online intelligence, mobile measurement, trade shows and related
properties. Nielsen has a presence in approximately 100 countries, with
headquarters in New York, USA and Diemen, the Netherlands.
For more information, visit www.nielsen.com.
Copyright © 2013 The Nielsen Company. All rights reserved. Nielsen and
the Nielsen logo are trademarks or registered trademarks of CZT/ACN
Trademarks, L.L.C. Other product and service names are trademarks or
registered trademarks of their respective companies.