NP-12-0023 June 5, 2012 10 CFR 52, Subpart A U. S. Nuclear ... · Enclosure 1 and Enclosure 2...
50
NP-12-0023 June 5, 2012 10 CFR 52, Subpart A U. S. Nuclear Regulatory Commission ATTN: Document Control Desk Washington, DC 20555-0001 Subject: Exelon Nuclear Texas Holdings, LLC Victoria County Station Early Site Permit Application Environmental Report – Response to ER RAI Letter No.7 Docket No. 52-042 References: (1) USNRC letter to Ms. Marilyn C. Kray, Environmental Request for Additional Information Letter No.7 Related to ESRP Sections 7.1 and 7.2 Postulated Accidents for Victoria County Station Early Site Permit Application, dated April 26, 2012 Exelon is responding to the following questions contained in NRC Request for Additional Information (RAI) letter No.7 (Reference 1): ESP EIS 7.10-1 (eRAI No.6373) ESP EIS 7.10-2 (eRAI No.6374) ESP EIS 7.10-3 (eRAI No.6375) Exelon’s responses to the above-referenced RAIs constitute a complete response to NRC RAI Letter No.7. The RAI responses comprise Attachments 1-3. Regulatory commitments are summarized in Attachment 4. Enclosure 1 and Enclosure 2 contain the documents being submitted in response to RAI ESP EIS 7.10-3 (Attachment 3). If additional information is required, please contact Joshua Trembley at (610) 765-5345. I declare under penalty of perjury that the foregoing is true and correct. Executed on the 5 th day of June, 2012. Respectfully, Marilyn C. Kray Vice President, Nuclear Project Development Attachments:
Transcript of NP-12-0023 June 5, 2012 10 CFR 52, Subpart A U. S. Nuclear ... · Enclosure 1 and Enclosure 2...

NP-12-0023 June 5, 2012 10 CFR 52, Subpart A U. S. Nuclear Regulatory Commission ATTN: Document Control Desk Washington, DC 20555-0001 Subject: Exelon Nuclear Texas Holdings, LLC
Victoria County Station Early Site Permit Application Environmental Report – Response to ER RAI Letter No.7 Docket No. 52-042
References: (1) USNRC letter to Ms. Marilyn C. Kray, Environmental Request for
Additional Information Letter No.7 Related to ESRP Sections 7.1 and 7.2 Postulated Accidents for Victoria County Station Early Site Permit Application, dated April 26, 2012
Exelon is responding to the following questions contained in NRC Request for Additional Information (RAI) letter No.7 (Reference 1):
ESP EIS 7.10-1 (eRAI No.6373) ESP EIS 7.10-2 (eRAI No.6374) ESP EIS 7.10-3 (eRAI No.6375)
Exelon’s responses to the above-referenced RAIs constitute a complete response to NRC RAI Letter No.7. The RAI responses comprise Attachments 1-3. Regulatory commitments are summarized in Attachment 4. Enclosure 1 and Enclosure 2 contain the documents being submitted in response to RAI ESP EIS 7.10-3 (Attachment 3). If additional information is required, please contact Joshua Trembley at (610) 765-5345. I declare under penalty of perjury that the foregoing is true and correct. Executed on the 5th day of June, 2012. Respectfully,
Marilyn C. Kray Vice President, Nuclear Project Development Attachments:

June 5, 2012 U. S. Nuclear Regulatory Commission Page 2 Attachments:
(1) Response to ESP EIS 7.10-1 (eRAI No.6373) (2) Response to ESP EIS 7.10-2 (eRAI No.6374) (3) Response to ESP EIS 7.10-3 (eRAI No.6375) (4) Summary of Commitments
Enclosures:
(1) 25352-000-M0C-HARA-00006 - Calculation Summary Report for ESP Environmental Report Accident Doses
(2) Calculation of Severe Accident Risks for the Proposed Exelon VCS ESP, Rev. 2, Tetra Tech, December 22, 2009
cc: USNRC, Director, Office of New Reactors/NRLPO (w/enclosures) USNRC, Project Manager, VCS, Division of New Reactor Licensing
(w/enclosures) USNRC, Environmental Project Manager, VCS, Division of New Reactor
Licensing (w/enclosures) USNRC Region IV, Regional Administrator (w/enclosures) Argonne National Laboratory, Project Manager, VCS (w/enclosures) EDMS

Request for Additional Information ESP EIS 7.10-1 Response NP-12-0023 Attachment 1 Page 1 of 1 ESP EIS 7.10-1 (eRAI No.6373): NRC Request: ESRP Section 7.1 directs the staff to review the applicant’s calculated dose consequences presented in the environmental report (ER). For each of the tables presented in ER Sections 7.1 and 7.2, no mention is made of which revision number(s) of the respective ALWR DCDs were used to arrive at the values listed in the tables. For each of the Advanced Light Water Reactor (ALWR) types (AP1000, APWR, ABWR, ESBWR), provide specific DCD Revision Numbers that were used in the analyses presented in ER Section 7.1 and 7.2. RAI Response: Specific DCD revision numbers that were used in the analyses for ER section 7.1 were added to the applicable tables in the ER as part of revision 1 of the ESP application. Revision 1 was submitted to the NRC on March 22, 2012. The ADAMS accession number for revision 1 of ER Chapter 7 is ML12131A101. As stated in ER section 7.2, the severe accident analysis is based on the ESBWR and ABWR designs. Section 7.2.1 states that details of the analysis for the ESBWR are found in the ESBWR PRA (GEH June 2009; see ER Subsection 7.2.6) and reported in the ESBWR Design Control Document (GEH Aug 2009; see ER Subsection 7.2.6), which is DCD revision 6. Section 7.2.1 also states that the ABWR analysis is reported in Chapter 19 of the ABWR DCD (GE Mar 1997; see ER Subsection 7.2.6), which is revision 4. The DCD revision numbers are currently listed in Subsection 7.2.6, the reference section of ER section 7.2. Associated ER revisions: There are no ER changes associated with this response.

Request for Additional Information ESP EIS 7.10-2 Response NP-12-0023 Attachment 2 Page 1 of 4 ESP EIS 7.10-2 (eRAI No.6374): NRC Request: (a) ESRP Section 7.1 directs the staff to review the applicant’s calculated dose consequences presented in the ER. ER Section 7.1.4 (Radiological Consequences) provides only one sentence to explain the values delineated in 64 tables (i.e., Tables 7.1-6 through 7.1-70). It states ...”Details about the methodology and assumptions pertaining to each of the accidents, such as activity release paths and the credited mitigation features, may be found in the design certification documents for each of the reactor technologies.” For the activity release values presented in ER Section 7.1, Tables 7.1-6 through 7.1-70, provide an expanded discussion of how these values were determined. (b) ESRP Section 7.1 directs the staff to review the applicant’s calculated dose consequences presented in the ER. Although the bounding radionuclide inventory is presented in Table 7.4-1 for transportation accidents, no such tables are provided in ER Section 7.1 for the bounding core inventories for each of the ALWR types being considered. For example, the specific sections, table numbers and revision numbers from the various DCDs should be specified so the staff can determine what radionuclide core inventories were used. For each reactor type, provide a clear indication of where the bounding core inventories came from by delineating specific sections and table numbers from the various DCDs. RAI Response: (a) Tables 7.1-6 through 7.1-70 contain source term and dose results for a spectrum of accidents for the four major ALWR designs. These values were obtained from the Design Control Documents (DCDs) for the AP1000, ESBWR, APWR and ABWR. Consistent with the approach taken in the Vogtle ESP, section 7.1.2, the basic scenario for each accident analyzed in the VCS ESPA is that some quantity of activity is released at the accident location inside a building and this activity is eventually released to the environment. The transport of activity within the plant is independent of the site and specific to the reactor design. Details about the methodologies and assumptions pertaining to each of the accidents, such as activity release pathways and credited mitigation features, are provided in the respective DCD. Revision 1 of the ESP application, which was submitted to the NRC on March 22, 2012, identifies the applicable DCDs and revision numbers associated with each table. Similar to the Vogtle ESP approach and NRC conclusions, the DBA analysis in the VCS ESP ER is based on the analysis performed for each of the reactor designs provided in the DCDs, with adjustment for VCS site specific characteristics. These analyses demonstrate that the environmental risks associated with DBAs for new reactors located at the VCS site would be small. On this basis, it can be concluded that the environmental consequences of DBAs at the VCS site would be of SMALL significance for new nuclear plants.

Request for Additional Information ESP EIS 7.10-2 Response NP-12-0023 Attachment 2 Page 2 of 4
(b) As stated in the response to (a) above, revision 1 of the ESP application, which was submitted to the NRC on March 22, 2012, identifies the applicable DCDs and revision numbers associated with each table. To support the NRC review of ER section 7.1, Exelon is providing a cross-reference table showing SSAR, ER and DCD table numbers for the applicable accidents (Table 1). It should be noted that the AP1000 source term information is not in DCD rev 17, but is included in Westinghouse Document LTR-CRA-10-35, Rev 1 (Table 1, Reference 1). Reference 1 was provided as Attachment A to Exelon Letter NP-11-0012, submitted to the NRC April 26, 2011 (Accession Number ML111370597).

Request for Additional Information ESP EIS 7.10-2 Response NP-12-0023 Attachment 2 Page 3 of 4 Table 1. Sources of Activity Releases in Victoria County ESP Application – ER 7.1 and SSAR 15 Design Accident ER Table SSAR
Table Source
AP1000 MSLB, Pre-Incident Spike 7.1-6 15.1-6 Ref 1
AP1000 MSLB, Accident-Initiated Spike 7.1-8 15.1-8 Ref 1 AP1000 Locked Rotor 7.1-10 15.1-10 Ref 1 AP1000 Rod Ejection 7.1-13 15.1-13 Ref 1 AP1000 Small Break Outside Containment 7.1-15 15.1-15 Ref 1 AP1000 SGTR, Pre-Incident Spike 7.1-17 15.1-17 Ref 1 AP1000 SGTR, Accident-Initiated Spike 7.1-19 15.1-19 Ref 1 AP1000 LOCA 7.1-21 15.1-21 Ref 1 AP1000 FHA 7.1-23 15.1-23 Ref 1
APWR MSLB, Pre-Incident Spike 7.1-25 15.1-25 Ref 2, Table 15A-27
APWR MSLB, Accident-Initiated Spike 7.1-27 15.1-27 Ref 2, Table 15A-26
APWR Locked Rotor 7.1-29 15.1-29 Ref 2, Table 15A-30
APWR Rod Ejection 7.1-31 15.1-31 Ref 2, Table 15A-31
APWR Small Break Outside Containment 7.1-33 15.1-33 Ref 2, Table 15A-33
APWR SGTR, Pre-Incident Spike 7.1-35 15.1-35 Ref 2, Table 15A-29
APWR SGTR, Accident-Initiated Spike 7.1-37 15.1-37 Ref 2, Table 15A-28
APWR LOCA 7.1-39 15.1-39 Ref 2, Table 15A-25
APWR FHA 7.1-41 15.1-41 Ref 2, Table 15A-32
ABWR MSLB 7.1-43 15.1-43 Ref 3, Table 15.6-6
ABWR Small Break Outside Containment 7.1-46 15.1-46 Ref 3, Table 15.6-2
ABWR LOCA 7.1-48 15.1-48 Ref 3, Tables 15.6-10, 15.6-12
ABWR Cleanup Water Line Break 7.1-50 15.1-50 Ref 3, Table 15.6-17
ABWR FHA 7.1-52 15.1-52 Ref 3, Table 15.7-10
ESBWR MSLB 7.1-54 15.1-54 Ref 4, Table 15.4-12
ESBWR Feedwater Line Break 7.1-57 15.1-57 Ref 4, Table 15.4-15
ESBWR Small Break Outside Containment, Pre-Incident Spike
7.1-60 15.1-60 Ref 4, Table 15.4-18a
ESBWR Small Break Outside Containment, Equilibrium Iodine Activity
7.1-62 15.1-62 Ref 4, Table 15.4-18b
ESBWR Cleanup Water Line Break 7.1-64 15.1-64 Ref 4, Table 15.4-22
ESBWR LOCA 7.1-67 15.1-67 Ref 4, Table 15.4-7a
ESBWR FHA 7.1-69 15.1-69 Ref 4, Table 15.4-3a

Request for Additional Information ESP EIS 7.10-2 Response NP-12-0023 Attachment 2 Page 4 of 4
Table 1 References:
1. Westinghouse Document LTR-CRA-10-35, Rev 1, corresponding to AP1000 DCD Rev 17, provided as Attachment A to Exelon Letter NP-11-0012, dated April 26, 2011 (Accession Number ML111370597).
2. APWR DCD Revision 2.
3. ABWR DCD Revision 4.
4. ESBWR DCD Revision 6.
Associated ESPA Revisions: There are no ER changes associated with this response.

Request for Additional Information ESP EIS 7.10-3 Response NP-12-0023 Attachment 3 Page 1 of 8 ESP EIS 7.10-3 (eRAI No.6375): NRC Request (a) ESRP Section 7.2 directs the staff to evaluate and independently confirm severe accident risks and analyses presented in the ER. Although four ALWR types are being considered for the VCS site, ER Section 7.2 only presents severe accident risks for two of the ALWR types being considered; namely, the ABWR and the ESBWR. No severe accident analyses are presented for the AP1000 and the APWR. The applicant justifies this by stating only “representative” accidents and not “bounding” severe accidents need to be considered. There is no mention that the severe accident risks for the AP1000 and APWR may be more bounding. Explain in detail the severe accident methodology of using a “representative accident” vs. a “bounding accident.” Additionally, clarify the statement in Section 7.2 that the severe accident risks for an ABWR or an ESBWR may not bound those for the APWR and AP1000 reactor types, particularly if one of those ALWRs, or the mPower Reactor, is selected at the COL stage. (b) ESRP Section 7.2 directs the staff to evaluate and independently confirm severe accident risks and analyses presented in the ER. For the severe accident risks presented in ER Section 7.2, Tables 7.2-1 and 7.2-2, it is not clear what input values were used and where they came from (i.e., ER and DCD Revision, Section and Table numbers) in terms of the severe accident source terms, population distributions, land-use data, surface water data, and economic costs. For the ABWR and ESBWR ALWR types, provide a clear reference (e.g., cross-reference table) of the source for the severe accident source terms, population distributions, land-use data, surface water data, and economic costs by delineating specific ER and DCD revisions, sections and table numbers. (c) ESRP Section 7.2 directs the staff to evaluate and independently confirm severe accident risks and analyses presented in the ER. ER Section 7.2 presents severe accident population dose risks for two of the ALWRs being considered. For the population dose risks provide in Section 7.2, Tables 7.2-1 and 7.2-2, provide a comparative analysis that demonstrates the “projected” 2010 Population Distribution is more conservative than the actual 2010 US Census data. (d) ESRP Section 7.1 and 7.2 directs the staff to evaluate the design basis accident and severe accident analyses and the associated dose consequences and health effects. The analyses summarized in ER Sections 7.1 and 7.2 rely on the two calculation packages delineated in the following calculational packages. Provide the following calculation package.
• Calculation Number 25352-000-MOC-HARA-0004, “ESP-ER Accident Doses,” Rev. 3, December 23, 2010.
• Road Map: “Calculation of Severe Accident Risks for the Proposed Exelon VCS ESP,” Rev. 2, by A. T. Toblin, Tetra Tech, December 22, 2009

Request for Additional Information ESP EIS 7.10-3 Response NP-12-0023 Attachment 3 Page 2 of 8 RAI Part (a) Response: Background The NRC regulations at 10 CFR 52.17, “Contents of Applications; technical Information”, state that an Early Site Permit (ESP) application site safety analysis report (SSAR) shall include:
“specific number, type, and thermal power of the facilities, or range of possible facilities, for which site may be used.” [52.17(a)(1)(i)]
Radiological consequence evaluation to show “site characteristics must
comply with Part 100” [52.17(a)(1)(ix)]: Guidance related to these regulations is contained in the Standard Review Plan (SRP), NUREG 0800, Chapter 15. Section 15.0.3, “Design Basis Accident Radiological Consequence Analysis for Advanced Light Water Reactors” recognizes that ESP applications may use a Plant Parameter Envelope (PPE) approach. A PPE is a set of plant design parameters that serve as a surrogate for actual reactor design information when a specific reactor design has not yet been selected for the proposed site. The PPE values are selected by the applicant to bound a range of possible current and future reactor designs that might be deployed at the proposed site. The PPE approach for an ESP allows consideration of existing reactor designs, as well as future advanced reactor designs for which detailed design information has not yet been developed. Therefore, reactor specific accident analyses (i.e., design basis accident analyses and severe accident analyses) provided in the ESP application SSAR are considered representative and used only to demonstrate site suitability. If a reactor design different from that evaluated in the ESP is selected, then the design specific accident analyses must be re-evaluated at the COL stage. Additionally, NEI 10-01, “Industry Guideline for Developing a Plant Parameter Envelope in Support of an Early Site Permit”, states that detailed, reactor design specific accident analyses are more appropriately performed at the Combined License (COL) stage when a technology is selected, and that an ESP applicant may develop representative evaluations of offsite doses at the EAB and LPZ in order to demonstrate that the proposed site characteristics are capable of meeting the siting requirements of 10CFR100. Consistent with NEI 10-01 industry guidance, final accident analyses are more appropriately performed at the COL application stage after a technology is selected and the plant configuration is known. Factors such as reactor release pathways, release rates, and radionuclide removal mechanisms are reactor-specific. Furthermore, it is not practical at the ESP stage to try to bound all reactors that could be selected at the COL application stage, since the PPE can accommodate numerous designs beyond the five designs that contributed to PPE development. Finally, DCDs are subject to revision or are under development (e.g., mPower). Existing ESPs issued by the NRC for the Clinton, North Anna, and Grand Gulf sites rely on the PPE accident analysis approach. These existing ESPs considered advance reactor designs not yet reviewed by the NRC (e.g., HTGRs, IRIS) and included a spectrum of representative DBA events that were not comprehensive for any reactor

Request for Additional Information ESP EIS 7.10-3 Response NP-12-0023 Attachment 3 Page 3 of 8 design. These applications similarly contained representative severe accident analyses that may not necessarily be bounding analyses. The NRC conclusions for severe accidents are similar for these ESPs using the PPE approach, and specific findings from the Clinton ESPA FEIS (NUREG-1815) are summarized as follows:
The NRC evaluated the environmental impacts of severe accidents based on characteristics of the ABWR and surrogate AP1000 reactor designs, and assumed for the purposes of the ESP that these impacts would bound the impacts of other potential reactor designs considered for the site.
The NRC conducted confirmatory analysis using the MACCS2 code. The results
indicated that the environmental risks associated with severe accidents for an advanced LWR located at the ESP site would be small compared to risks associated with operation of current-generation reactors at the ESP site and other sites. These risks are well below the NRC safety goals.
The NRC concluded that the probability weighted consequences of severe
accidents at the ESP site are of SMALL significance for an advanced LWR and that the ESP site is suitable for operation of an advanced LWR.
The environmental impacts of severe accidents for designs not evaluated in the
FEIS, including gas-cooled designs, are unresolved. Severe accident analyses would need to be completed at the COL stage if an unevaluated design were to be selected for the ESP site.
VCS ESP ER The VCS ESP application seeks to demonstrate that the proposed VCS site is suitable for new nuclear units. As stated in the VCS ESP ER Section 3.1, Exelon is not seeking approval for a specific reactor design(s) for the site at the ESP stage. The VCS ESP application use of representative accident analyses is consistent with the previously issued ESPs, and demonstrates that LWRs could be constructed at the VCS site without undue risk to the public or the environment. The five reactor designs described in ER Section 3.1 are possible designs that might be deployed at the site; however, the site would not be limited to these five designs. The VCS ESP PPE is based on the “surrogate plant design” defined by the envelope of the five designs. This envelope is expected to be bounded by the VCS site characteristics and site-related design parameters provided in Table 3.1-1. As described in ER Section 3.1, “This set of site characteristics and design parameters is not intended to limit the ESP to these designs, but rather to provide a broad overall outline of a representative design concept and to allow other potential designs to be included if they can be demonstrated to fall within these parameter values.” If other designs are not bounded then they would be re-evaluated at the COL stage. The VCS ESP application evaluation of the environmental impacts of severe accidents is based on the characteristics of the ESBWR and the ABWR reactor designs. These designs are considered representative of large LWR passive and non-passive safety system designs. These analyses demonstrate that the VCS site can meet 10 CFR 100 limits and NRC safety goals, and representative analyses are appropriate under NEPA. The results support finality of site selection, per 10CFR 51.50(b)(2).

Request for Additional Information ESP EIS 7.10-3 Response NP-12-0023 Attachment 3 Page 4 of 8 The results of the ESP analyses indicate that the environmental risks associated with severe accidents if an advanced LWR were to be located at the proposed VCS site would be small compared to risks associated with operation of current-generation reactors at the proposed VCS site and other sites. These risks are shown to be well below the NRC safety goals. On this basis, it is concluded that the probability weighted consequences of severe accidents at the proposed VCS site are of SMALL significance for an advanced LWR and that the proposed VCS site is suitable for operation of an advanced LWR. Accordingly, VCS ER section 7.2 adequately demonstrates via representative severe accident analyses that new nuclear units could be constructed and operated at the ESP site without undue risk to the public or the environment. The severe accidents evaluation conclusion states: “…the individual and societal risks for a severe accident from both the ESBWR and the ABWR reactors at the VCS site would be less than the NRC risk goals…” (ER p. 7.2-10). It is not practical to bound the accident analyses for all potential reactor types that could be selected at the COLA stage. Evaluation of postulated accidents for an ESPA using the PPE approach was tested on the Clinton, Grand Gulf, and North Anna ESPs. Exelon’s representative accident analyses are consistent with previous ESPs and demonstrate that the LWRs could be constructed at the site without undue risk to the public or the environment. Exelon will provide additional reactor-specific analyses at the COL stage (if not specifically evaluated in the ESPA) to demonstrate that the ESP findings remain valid. RAI Part (b) Response: Exelon provided the MACCS2 input files in letter NP-11-0032 (dated October 24, 2011). File names and parameter names identified below are from the MACCS2 files provided. Source Terms ABWR Source Terms ER Section 7.2 states that the MACCS2 input file ATMOS contains the core inventory, release fractions and geometry of the reactor and associated buildings. For the ABWR, DCD revision 4 (GE Mar 1997) Table 2A-6 contains the core inventory values, which were transferred to ATMOS data block RDCORINV. The release parameters are contained in DCD revision 4 Table 19E.3-6 and are transferred to ATMOS data blocks RDOLARM, RDPLUDUR, RDPDELAY and RERELFRC. ESBWR Source Terms Similarly for the ESBWR, the core inventory (RDCORINV) parameters are contained in DCD revision 6, Table 10.3-2 (GEH June 2009). Release parameter RDPDELAY is from Table 9-1, RDRELFRC is from Table 9-3 (see also GEH Aug 2009, Table 10.3-3a) and RDPLUDUR is set to 10 hours for each source term.

Request for Additional Information ESP EIS 7.10-3 Response NP-12-0023 Attachment 3 Page 5 of 8 Population Distribution The SECPOP2000 code was used to produce a basic MACCS2 site input file (SITE). The population data by distance and sector were then replaced by data from Table 2.5.1-1, “Current Populations and Projections by Sector to 2080” of the Environmental Report. Table 2.5.1-1 was generated by means of Geographical Information System software and then projected into the future by decade as described in detail in Section 2.5.1.1 of the ER. Year 2060 projected data were used in the severe accident analysis.
Land Use Data The MACCS2 SITE file also requires information on the distribution of agriculture. That information is available from the SECPOP2000 program, based on the 1997 National Census of Agriculture. However, Exelon over-wrote the SITE file with more recent data from the 2007 National Census of Agriculture for those counties within 50 miles of the VCS site. The actual data used have been provided in response to RAI 6369 (Exelon letter NP-12-0020, dated May 17, 2012) in a new table for ER Section 2.2 designated Table 2.2-5.
Surface Water Data Land fraction and watershed data in the MACCS2 SITE file are normally provided by SECPOP 2000; however, those values were overwritten using site-specific GIS mapping information. Specific nearby surface water bodies are identified in Section 7.2.3.2 of the ER. Economic Costs For the MACCS2 CHRONC file (*.CHR), selected economic data were obtained from the MACCS2 sample problem A. These cost data were determined in 1986 so Exelon escalated the data to October 2009 using the consumer price index ratio. Two CHR parameters were recalculated for this analysis. The parameter, CHVALWF, area-wide value of farm wealth (dollars/hectare), was calculated from 2007 Census of Agriculture county farm land, building and machinery value statistics, and county tax data. County data were apportioned by the fraction of each county within 50 miles of Exelon’s Victoria County site. The parameter, CHVALWNF, area-wide non-farm wealth (dollars/person), was similarly calculated. These two parameters were also escalated to October 2009 using the consumer price index. The SITE file also contains economic data, specifically the following: fraction of land devoted to farming in the region, fraction of farm production resulting from dairy production in the region, total annual farm sales for the region, farmland property values for the region, nonfarm property value for the region. These values were all calculated from the 2007 Census of Agriculture.

Request for Additional Information ESP EIS 7.10-3 Response NP-12-0023 Attachment 3 Page 6 of 8 RAI Part (b) Response References (as identified in the ESP ER): GE Mar 1997. General Electric Nuclear, ABWR Design Control Document, Revision 4, transmitted by letter March 28, 1997. GEH Aug 2009. GE Hitachi Nuclear Energy, ESBWR Design Control Document, Tier 2, Chapter 19, 26A6642BY, Revision 6, August 2009. GEH Jun 2009. GE Hitachi, ESBWR Design Certification Probabilistic Risk Assessment, NEDO-33201, Revision 4. NRC Accession Number ML092030199, June 26, 2009. RAI Part (c) Response: The population data used by Exelon for the severe accident analysis of Section 7.2 was taken from Table 2.5.1-1 [Typographical errors in Table 2.5.1-1 were corrected in Exelon’s response to Information Need HP-2 (Exelon 2012). The correct population data was used in the severe accident analysis.]. Table 2.5.1-1 data were based on U.S. Census data for the year 2000 and escalated through several decades. The accident analysis used the data for 2060 in the circular region surrounding the reactors from 0 to 50 miles. Subsequent to the analysis, census data for the year 2010 became available. To determine if Exelon’s previously projected 2060 population data were representative of 2060 population that could have been projected from actual 2010 data, Exelon performed a comparison of the previously projected 2010 data with the actual data for 2010. Because the 50-mile population used in the Section 7.2 analysis incorporated an estimate of transient members of the populations (1470 people), a new transient population was also calculated (2028 people). Exelon obtained 50-mile data for census block groups and then used Geographical Information System methods to convert that data to the populations within the 10-mile and 50-mile radii surrounding VCS. Next, Exelon compared the results to Table 2.5.1-1 with the following results.
Population Item Projected 2010 Value from Table 2.5.1-1 Actual 2010 Value
Percent Difference – Actual to Projected
10-mile population 7195 8040 11.7%
50-mile population 255,337 241,925 -5.3%
The severe accident analysis makes use of the entire 0-to-50-mile population; however, the population exposure is determined by the meteorology. Therefore, both direction and distance affect the dose-risk results. Generally, the closer population provides a more sensitive dose response. This suggests that the increase in the 0-to-10-mile population (actual versus projected) makes the dose-risk calculation non-conservative. However, the 10-to-50-mile population is 29 times larger than the 0-to-10-mile population, suggesting that the less-than-projected increase of the 0-to-50-mile population makes Exelon’s calculation conservative. Given these competing factors

Request for Additional Information ESP EIS 7.10-3 Response NP-12-0023 Attachment 3 Page 7 of 8 (direction, distance, population size), the data support a conclusion that had the analysis been performed based on 2010 census data, the results would not be greatly different than the results obtained from 2000 census data. Given that the ER analysis is intended to be representative (i.e., calculated for ABWR and ESBWR only) and not comprehensive across all potential reactor technologies that might be selected at the COL stage, Exelon believes that the results in Table 7.2-1 and 7.2-2 are appropriate for their intended purpose. Furthermore, the comparison to NRC safety goals in ER Table 7.2-3 indicates that Exelon’s proposed siting of the ESBWR and the ABWR would result in risk several orders of magnitude below the goals. These risk values further demonstrate that small changes in risk outcomes resulting from population uncertainties would not be expected to change the ER conclusions. Exelon has already committed to performing a new severe accident analysis at the COL stage should the ESP analysis not be bounding for the COL ER. Exelon also notes that actual 2010 populations in the region, in general, were less than projected based on the following data for nearby political jurisdictions:
Population Item Projected 2010 Value Table 2.5.1-4 of the ER Actual 2010 Value
Percent Difference – Actual to Projected
Calhoun County 2010 population 22,684 21,381 a -5.7%
DeWitt County 2010 population 20,832 20,097 a -3.5%
Goliad County 2010 population 7,416 7,210 a -2.8%
Jackson County 2010 population 15,571 14,075 a -9.6%
Refugio County 2010 population 8,365 7,383 a -11.7%
Victoria County 2010 population 94,143 86,793 a -7.8%
ROI 2010 population 169,011 156,939 b -7.1%
a. USCB 2010 b. sum of the six counties
Request for Additional Information ESP EIS 7.10-3 Response NP-12-0023 Attachment 3 Page 8 of 8 Part (c) Response References: Exelon 2012. Exelon Nuclear Texas Holdings, LLC letter to USNRC, Application for Early Site Permit for Victoria County Station, Environmental Report – Responses to ER Audit Information Needs, NP-12-0003, dated February 15, 2012. USCB 2010. U. S. Census Bureau, Collection of QuickFacts printouts on selected Texas entities, available at http://quickfacts.census.gov/qfd/states/, accessed December 14, 2011 RAI Part (d) Response: The following documents are provided as Enclosure 1 and Enclosure 2, respectively:
25352-000-M0C-HARA-00006 - Calculation Summary Report for ESP Environmental Report Accident Doses
Calculation of Severe Accident Risks for the Proposed Exelon VCS ESP,” Rev.
2, Tetra Tech, December 22, 2009 The above-referenced document numbered 25352-000-M0C-HARA-00006 is being provided in lieu of calculation 25352-000-MOC-HARA-0004, “ESP-ER Accident Doses,” Rev. 3, dated December 23, 2010. Exelon is not submitting the original calculation requested by the NRC because the document format is proprietary to Bechtel Power Corporation. Accordingly, document 25352-000-M0C-HARA-00006 is being provided to docket the technical content contained in calculation 25352-000-MOC-HARA-0004 in a non-proprietary format. Associated ESPA Revisions: As a result of the Part (a) response, ER Subsection 7.2.5 will be revised in a future revision of the ESPA as follows: 7.2.5 Conclusions The probability-weighted risk of fatalities (early and latent cancer) from a severe accident for the VCS site is reported in Table 7.2-2 as 1.2 × 10⁻⁶ fatalities per reactor year. The probability of an individual dying from any cancer from any cause is approximately 0.24 over a lifetime (ACS Mar 2008). Comparing this value to the 1.2 × 10⁻⁶ fatalities per reactor year indicates that individual risk is 0.0005 percent of the background risk. As reported in Table 7.2-3, the individual and societal risks for a severe accident from both the ESBWR and the ABWR reactors at the VCS site would be less than the NRC risk goals described in Subsection 7.2.4. Additional reactor-specific analyses will be performed at the COL stage (if not specifically evaluated in the ESPA) to demonstrate that the ESP findings remain valid. There are no ESPA revisions proposed in response to RAI part (b), (c), or (d).

NP-12-0023 Attachment 4
Page 1 of 1
ATTACHMENT 4
SUMMARY OF REGULATORY COMMITMENTS
(Exelon Letter to USNRC No. NP-12-0023, dated June 5, 2012) The following table identifies commitments made in this document. (Any other actions discussed in the submittal represent intended or planned actions. They are described to the NRC for the NRC’s information and are not regulatory commitments.)
COMMITMENT TYPE
COMMITMENT COMMITTED DATE ONE-TIME ACTION
(Yes/No) Programmatic
(Yes/No) ER Subsection 7.2.5 will be updated in a future revision of the ESPA to include the following commitment: additional reactor-specific analyses will be performed at the COL stage (if not specifically evaluated in the ESPA) to demonstrate that the ESP findings remain valid. [ESP EIS 7.10-3 (6375) response]
March 31, 2013
Yes
No

NP-12-0023 Enclosure 1
ENCLOSURE 1
25352-000-M0C-HARA-00006 - Calculation Summary Report for
ESP Environmental Report Accident Doses

• CALCULATION SUMMARY REPORT COVER SHEET ~ VICtoria County Station I Job No. 25352 Report. No. 25352-OO0-MOC-HARA-00006 I Sheet 1 of 23 Subject ESP Environmental Report Accident Doses I DIscIpline Mechanical
Contimed will PrelImInary
R8port 8tIIuI PrelmiIBlY Infonnation Contimed &Iper1eded Voided o.Ign.-lan 0 0 181 0 0 CompuI8r SCP PnlgIwnNo. VersIonReIaaIe 0peraIng SyIIem Prog~ 0 None NucIeIr Qudly ~ Aaqnaned QuaIty NonsaI'aty-ReI8 Clu.lllclllllfl 181 0 0
This is a summary report of Calculation 25352-00O-MOC-HARA-00004, Rev 003.
. ~
000 Initial issue 23 23 )ftK" ? \-J? 1A1V~ ',.-5/;J'<f/~ 'p I~ ToIIl No. Last - Bwa.t ApprovedI Rev. No. Reason fer Revision dSheeta Sl-.-tNo. By AccapIad Dal8
Record of RevisIons

Victoria County Station ESP ER Design Basis Accident Doses 25352-000-M0C-HARA-00006, 2 of 23
Calculation Summary Report Evaluation of Design Basis Accident Doses for
Victoria County Station Early Site Permit Application Environmental Report
1.0 Purpose In support of Victoria County Station Early Site Permit (ESP) Application, Environmental Report (ER) Section 7.1, calculate the design basis accident doses for the following reactor designs:
• AP1000
• APWR
• ABWR
• ESBWR
This report evaluates offsite dose consequences for siting purposes only.
2.0 References 2.1 Document APP-GW-GL-700, AP1000 Design Control Document, Tier 2 Material, Westinghouse
Electric Company, Rev 17.
2.2 Document MUAP-DC001, APWR Design Control Document for the US-APWR, Tier 2, Mitsubishi Heavy Industries, Ltd., Rev 2.
2.3 ABWR Design Control Document, Tier 2, GE Nuclear Energy, Rev 4.
2.4 Document 26A6642, ESBWR Design Control Document, Tier 2, GE-Hitachi Nuclear Energy, Rev 6.
2.5 Westinghouse Letter LTR-CRA-10-35, Subject: AP1000 Accident Doses and Releases as a Function of Time for DCD Rev. 17, Rev 1.
2.6 Response to Transmittal of Design Information TODI 25352-000-GRI-GEX-00324 (APWR), 10/20/09.
2.7 Response to Transmittal of Design Information TODI 25352-000-GRI-GEX-00328 (ESBWR), 11/23/09.
2.8 Calculation 25352-000-H0C-HMMD-00005, χ/Q Estimates for Accidental Releases for ESP Application, Rev 000.
2.9 NUREG-0800, Standard Review Plan for the Review of Safety Analysis Reports for Nuclear Power Plants, U.S. Nuclear Regulatory Commission, March 2007.
2.10 Regulatory Guide 1.183, Alternative Radiological Source Terms for Evaluating Design Basis Accidents at Nuclear Power Reactors, U.S. Nuclear Regulatory Commission, July 2000.
2.11 10 CFR 50.34, Code of Federal Regulations, “Contents of Applications; Technical Information.”

Victoria County Station ESP ER Design Basis Accident Doses 25352-000-M0C-HARA-00006, 3 of 23
3.0 Data 3.1 Site Atmospheric Dispersion Factors – The 50th percentile accident atmospheric dispersion
factors (χ/Q values) for the Victoria County Station site are shown in Table 3-1 [Ref 2.8].
3.2 DCD Atmospheric Dispersion Factors – The accident χ/Q values used to calculate design control document (DCD) doses are shown in Table 3-2 (AP1000), Table 3-3 (APWR), Table 3-4 (ABWR), and Table 3-5 (ESBWR).
3.3 DCD Accident Doses – DCD accident doses at the exclusion area boundary (EAB) and the low population zone (LPZ) are shown in Table 3-6 (AP1000), Table 3-7 (APWR), Table 3-4 (ABWR), and Table 3-8 (ESBWR). DCD doses are calculated based on the DCD χ/Q values listed in Section 3.2.
3.4 Dose Acceptance Criteria – The dose acceptance criterion for design basis accidents is 25 rem TEDE, in accordance with 10 CFR 50.34(a)(1)(ii) [Ref 2.11]. The calculated accident doses are also compared to the more restrictive criteria in the Standard Review Plan (SRP) of NUREG-0800 [Ref 2.9].

Victoria County Station ESP ER Design Basis Accident Doses 25352-000-M0C-HARA-00006, 4 of 23
Table 3-1. Site 50th Percentile Atmospheric Dispersion Factors
Location Time (hr) χ/Q (sec/m3)
EAB 0 - 2 8.85E-05
LPZ 0 - 8 5.30E-06
8 - 24 3.92E-06
24 - 96 2.05E-06
96 - 720 8.05E-07
Source: Ref 2.8, Sheet 9.
Table 3-2. AP1000 DCD Atmospheric Dispersion Factors
Location Time (hr) LOCA Other
EAB 0 - 2 5.1E-04 1.0E-03
LPZ 0 - 8 2.2E-04 5.0E-04
8 - 24 1.6E-04 3.0E-04
24 - 96 1.0E-04 1.5E-04
96 - 720 8.0E-05 8.0E-05
χ/Q (sec/m3)
Source: Ref 2.5. Note: The values in the “Other” column apply to all accidents other than LOCA.
Table 3-3. APWR DCD Atmospheric Dispersion Factors
Location Time (hr) χ/Q (sec/m3)
EAB 0 - 2 5.0E-04
LPZ 0 - 8 2.1E-04
8 - 24 1.3E-04
24 - 96 6.9E-05
96 - 720 2.8E-05
Source: APWR DCD [Ref 2.2], Table 15.0-13.

Victoria County Station ESP ER Design Basis Accident Doses 25352-000-M0C-HARA-00006, 5 of 23
Table 3-4. ABWR DCD Atmospheric Dispersion Factors and Doses
χ/Q Dose (Sv) DCD
Accident Time (hr) (sec/m3) W. Body Thyroid Table
Small Break Outside Containment 0 - 8 1.37E-03 9.4E-04 4.8E-02 15.6-3
Main Steam Pre-Incident Iodine Spike 0 - 2 1.37E-03 1.3E-02 5.1E-01 15.6-7
Line Break Equilibrium Iodine Activity 0 - 2 1.37E-03 6.2E-04 2.6E-02
Loss- EAB 0 - 2 1.37E-03 4.1E-02 1.9E+00 15.6-13
of- LPZ 0 - 8 1.56E-04 1.0E-02 3.1E-01
Coolant 8 - 24 9.61E-05 8.0E-03 2.0E-01
Accident 24 - 96 3.36E-05 1.1E-02 7.9E-01
96 - 720 7.42E-06 9.0E-03 1.1E+00
Cleanup Water Line Break 0 - 2 2.29E-02 2.8E-03 3.0E-01 15.6-18
Fuel Handling Accident 0 - 2 1.37E-03 1.2E-02 7.5E-01 15.7-11
Note: Data is from ABWR DCD [Ref 2.3] tables as indicated. A different χ/Q is selected for Cleanup Water Line Break than for other accidents because the DCD shows the same dose for both whole body and thyroid for a χ/Q of 1.37E-3 sec/m3 for this accident;
this is not reasonable.
Table 3-5. ESBWR DCD Atmospheric Dispersion Factors
Accident Location Time (hr) χ/Q (sec/m3) DCD Table
Loss-of- EAB 0 - 2 2.00E-03 15.4-5a
Coolant LPZ 0 - 8 1.90E-04
Accident 8 - 24 1.40E-04
24 - 96 7.50E-05
96 - 720 3.00E-05
Small Break EAB 0 - 2 2.00E-03 15.4-17
Outside LPZ 0 - 8 1.90E-04
Containment 8 - 24 1.40E-04
24 - 96 7.50E-05
96 - 720 3.00E-05
Other EAB 0 - 2 2.00E-03 15.4-2, 15.4-11
LPZ 0 - 8 1.90E-04 15.4-14, 15.4-21
Note: Data is from ESBWR DCD [Ref 2.4] tables as indicated.

Victoria County Station ESP ER Design Basis Accident Doses 25352-000-M0C-HARA-00006, 6 of 23
Table 3-6. AP1000 DCD Doses
DCD EAB Dose EAB Dose
Accident Page Time (hr) (rem TEDE) 0-8 hr 8-24 hr 24-96 hr 96-720 hr 0-720 hr DCD
Steam System Pre-Incident Spike 15.1-20 0 - 2 1.00E+00 5.81E-01 7.18E-02 1.08E-01 7.61E-01 8.00E-01
Piping Failure Accident Spike 15.1-20 0 - 2 1.10E+00 1.02E+00 3.77E-01 5.36E-01 1.93E+00 2.00E+00
Locked Rotor No Feedwater 15.3-10 0 - 2 8.00E-01 3.89E-01 3.89E-01 4.00E-01
Accident Feedwater Available 15.3-10 6 - 8 6.00E-01 7.52E-01 7.52E-01 8.00E-01
Rod Ejection Accident 15.4-37 0 - 2 3.60E+00 4.38E+00 7.85E-01 6.34E-02 2.02E-02 5.25E+00 5.50E+00
Small Break Outside Containment 15.6-5 0 - 2 2.10E+00 1.03E+00 1.03E+00 1.10E+00
Steam Generator Pre-Incident Spike 15.6-15 0 - 2 2.20E+00 1.16E+00 7.20E-02 1.23E+00 1.30E+00
Tube Rupture Accident Spike 15.6-15 0 - 2 1.10E+00 6.10E-01 1.68E-01 7.78E-01 8.00E-01
Loss-of-Coolant Accident 15.6-65 1.4 - 3.4 2.46E+01 2.17E+01 7.50E-01 2.93E-01 5.49E-01 2.33E+01 2.34E+01
Fuel Handling Accident 15.7-5 0 - 2 5.20E+00 2.59E+00 2.59E+00 2.60E+00
LPZ Dose (rem TEDE)
Note: EAB and total LPZ doses are from the DCD [Ref 2.1] pages as indicated.
Time-dependent LPZ doses are from Ref 2.5.
Table 3-7. APWR DCD Doses
DCD EAB Dose EAB Dose
Accident Page Time (hr) (rem TEDE) 0-8 hr 8-24 hr 24-96 hr 96-720 hr 0-720 hr DCD
Steam System Pre-Incident Spike 15.1-96 0 - 2 1.9E-01 1.0E-01 7.6E-03 1.1E-01 1.1E-01
Piping Failure Accident Spike 15.1-96 0 - 2 3.2E-01 2.1E-01 6.5E-02 2.8E-01 2.8E-01
Locked Rotor Accident 15.3-42 10 - 12 4.9E-01 4.4E-01 2.5E-01 6.9E-01 7.0E-01
Rod Ejection Accident 15.4-81 0 - 2 5.1E+00 3.2E+00 8.8E-01 1.6E-01 1.7E-01 4.4E+00 4.5E+00
Small Break Outside Containment 15.6-18 0 - 2 1.5E+00 6.0E-01 6.0E-01 6.0E-01
Steam Generator Pre-Incident Spike 15.6-37 0 - 2 3.6E+00 1.5E+00 2.0E-03 2.1E-04 1.7E-04 1.5E+00 1.5E+00
Tube Rupture Accident Spike 15.6-37 0 - 2 9.6E-01 4.1E-01 1.0E-02 2.1E-04 1.7E-04 4.2E-01 4.3E-01
Loss-of-Coolant Accident 15.6-107 0.5 - 2.5 1.3E+01 9.0E+00 1.2E+00 1.3E+00 1.4E+00 1.3E+01 1.3E+01
Fuel Handling Accident 15.7-5 0 - 2 3.3E+00 1.4E+00 1.4E+00 1.4E+00
LPZ Dose (rem TEDE)
Note: EAB doses are from the DCD [Ref 2.2] pages as indicated.
Time-dependent LPZ doses are from Ref 2.6.
Table 3-8. ESBWR DCD Doses
EAB Dose EAB Dose DCD
Accident Time (hr) (rem TEDE) 0-8 hr 8-24 hr 24-96 hr 96-720 hr Table
Fuel Handling Accident 0 - 2 4.1E+00 4E-01 15.4-4
Loss-of-Coolant Accident 2.3 - 4.3 2.2E+01 6.93E+00 4.54E+00 4.72E+00 4.56E+00 15.4-9
Main Steam Pre-Incident Iodine Spike 0 - 2 2.6E+00 2E-01 15.4-13
Line Break Equilibrium Iodine Activity 0 - 2 2E-01 1E-01
Feedwater Pre-Incident Iodine Spike 0 - 2 1.81E+01 1.7E+00 15.4-16
Line Break Equilibrium Iodine Activity 0 - 2 1.1E+00 1E-01
Small Break Outside Pre-Incident Iodine Spike 0 - 2 3.4E-01 15.4-19
Containment Equilibrium Iodine Activity 0 - 2 1E-01
Cleanup Water Pre-Incident Iodine Spike 0 - 2 6.9E+00 7E-01 15.4-23
Line Break Equilibrium Iodine Activity 0 - 2 4E-01 1E-01
1E-01
1E-01
LPZ Dose (rem TEDE)
Note: Doses are from the ESBWR DCD [Ref 2.4] tables as indicated except that LPZ time-dependent
doses for Loss-of-Coolant Accident are from Ref 2.7. Although LPZ doses for Small Break Outside Containment extend beyond 8 hr, the DCD does not provide time-dependent LPZ doses for this accident.

Victoria County Station ESP ER Design Basis Accident Doses 25352-000-M0C-HARA-00006, 7 of 23
4.0 Assumptions 4.1 Doses – It is assumed that the DCD doses may be applied to the Victoria County Station site
after adjusting for atmospheric dispersion. The dose at a receptor is calculated based on the amount of activity released to the environment, the dispersion of activity during the transport from the release point to the receptor, the breathing rate at the receptor, and the dose conversion factors. The only parameter that is site-specific is the dispersion. Hence, it is reasonable to adjust the DCD doses for site-specific χ/Q values.
5.0 Analysis Site-specific doses are calculated by adjusting the doses in the DCD to reflect site-specific atmospheric dispersion.
The ratios of site Χ/Q values to DCD Χ/Q values are shown in Table 5-1 (AP1000), Table 5-2 (APWR), Table 5-3 (ABWR), and Table 5-4 (ESBWR).
The DCD doses in Table 3-6 (AP1000), Table 3-7 (APWR), Table 3-4 (ABWR), and Table 3-8 (ESBWR) are multiplied by the χ/Q ratios to obtain site-specific doses:
( )( )χ/QDCDsite RatioDoseDose =
While EAB doses are for a two-hour period with a fixed χ/Q, the LPZ doses for some of the accidents extend beyond 8 hr to multiple χ/Q values. The adjustment by χ/Q ratio is done as a function of time for all designs except ESBWR Small Break Outside Containment, for which time-dependent LPZ doses are not available. For this accident, which extends beyond 8 hr, the DCD dose is multiplied by the maximum χ/Q ratio over the 30-day duration of the accident.
The resulting doses are shown in Table 5-5 to Table 5-15 (AP1000), Table 5-16 to Table 5-25 (APWR), Table 5-26 to Table 5-32 (ABWR), and Table 5-33 to Table 5-43 (ESBWR). The tables also show the applicable regulatory dose limits from the SRP.
The ABWR doses in the DCD are presented in the unit of Sv. These are converted into rem by multiplying by 100 rem/Sv. Since the ABWR DCD does not show total effective dose equivalent (TEDE) doses, the whole body and thyroid doses for the ABWR are converted into TEDE values by multiplying the thyroid dose by a weighting factor of 0.03 [Ref 2.10, Sheet 1.183-9] and adding the product to the whole body dose. This is shown in Table 5-32.

Victoria County Station ESP ER Design Basis Accident Doses 25352-000-M0C-HARA-00006, 8 of 23
Table 5-1. Ratios of Site to AP1000 DCD Atmospheric Dispersion Factors
χ/Q (sec/m3) Ratio
Accident Location Time (hr) DCD Site (Site/DCD)
LOCA EAB 0 - 2 5.1E-04 8.85E-05 1.74E-01
LPZ 0 - 8 2.2E-04 5.30E-06 2.41E-02
8 - 24 1.6E-04 3.92E-06 2.45E-02
24 - 96 1.0E-04 2.05E-06 2.05E-02
96 - 720 8.0E-05 8.05E-07 1.01E-02
Other EAB 0 - 2 1.0E-03 8.85E-05 8.85E-02
LPZ 0 - 8 5.0E-04 5.30E-06 1.06E-02
8 - 24 3.0E-04 3.92E-06 1.31E-02
24 - 96 1.5E-04 2.05E-06 1.37E-02
96 - 720 8.0E-05 8.05E-07 1.01E-02
Note: Site values in Table 3-1 are divided by the DCD values in Table 3-2.
Table 5-2. Ratios of Site to APWR DCD Atmospheric Dispersion Factors
Time χ/Q (sec/m3) Ratio
Location (hr) DCD Site (Site/DCD)
EAB 0 - 2 5.0E-04 8.85E-05 1.77E-01
LPZ 0 - 8 2.1E-04 5.30E-06 2.52E-02
8 - 24 1.3E-04 3.92E-06 3.02E-02
24 - 96 6.9E-05 2.05E-06 2.97E-02
96 - 720 2.8E-05 8.05E-07 2.88E-02
Note: Site values in Table 3-1 are divided by the DCD values in Table 3-3.

Victoria County Station ESP ER Design Basis Accident Doses 25352-000-M0C-HARA-00006, 9 of 23
Table 5-3. Ratios of Site to ABWR DCD Atmospheric Dispersion Factors
χ/Q (sec/m3) Ratio
Time (hr) DCD Site (Site/DCD)
EAB - Cleanup Water Line Break 0 - 2 2.29E-02 8.85E-05 3.86E-03
EAB - Other 0 - 2 1.37E-03 8.85E-05 6.46E-02
LPZ - Loss-of-Coolant Accident 0 - 8 1.56E-04 5.30E-06 3.40E-02
8 - 24 9.61E-05 3.92E-06 4.08E-02
24 - 96 3.36E-05 2.05E-06 6.10E-02
96 - 720 7.42E-06 8.05E-07 1.08E-01
LPZ - Cleanup Water Line Break 0 - 8 2.29E-02 5.30E-06 2.31E-04
LPZ - Other 0 - 8 1.37E-03 5.30E-06 3.87E-03
Note: The site values in Table 3-1 are divided by the DCD values in Table 3-4 to obtain ratios. The DCD does not provide LPZ doses for accidents other than LOCA. For these accidents,
the χ/Q ratio is obtained by dividing the site LPZ χ/Q for 0-8 hr by the DCD EAB χ/Q.
Table 5-4. Ratios of Site to ESBWR DCD Atmospheric Dispersion Factors
Ratio
Accident Location Time (hr) DCD Site (Site/DCD)
Loss-of-Coolant EAB 0 - 2 2.00E-03 8.85E-05 4.43E-02
Accident LPZ 0 - 8 1.90E-04 5.30E-06 2.79E-02
8 - 24 1.40E-04 3.92E-06 2.80E-02
24 - 96 7.50E-05 2.05E-06 2.73E-02
96 - 720 3.00E-05 8.05E-07 2.68E-02
Small Break EAB 0 - 2 2.00E-03 8.85E-05 4.43E-02
Outside LPZ 0 - 8 1.90E-04 5.30E-06 2.79E-02
Containment 8 - 24 1.40E-04 3.92E-06 2.80E-02
24 - 96 7.50E-05 2.05E-06 2.73E-02
96 - 720 3.00E-05 8.05E-07 2.68E-02
Other EAB 0 - 2 2.00E-03 8.85E-05 4.43E-02
LPZ 0 - 8 1.90E-04 5.30E-06 2.79E-02
χ/Q (sec/m3)
Note: Site values in Table 3-1 are divided by the DCD values in Table 3-5.

Victoria County Station ESP ER Design Basis Accident Doses 25352-000-M0C-HARA-00006, 10 of 23
Table 5-5. Doses for AP1000 Steam System Piping Failure with Pre-Incident Iodine Spike
χ/Q Ratio
Time (hr) EAB LPZ (Site/DCD) EAB LPZ
0 - 2 1.00E+00 8.85E-02 8.85E-02
0 - 8 5.81E-01 1.06E-02 6.16E-03
8 - 24 7.18E-02 1.31E-02 9.38E-04
24 - 96 1.08E-01 1.37E-02 1.48E-03
96 - 720 0.00E+00 1.01E-02 0.00E+00
Total 1.00E+00 7.61E-01 8.85E-02 8.57E-03
Limit 25 25
DCD Dose (rem TEDE) Site Dose (rem TEDE)
Note: The DCD doses from Table 3-6 are multiplied by the χ/Q ratios from Table 5-1.
Table 5-6. Doses for AP1000 Steam System Piping Failure with Accident-Initiated Iodine Spike
χ/Q Ratio
Time (hr) EAB LPZ (Site/DCD) EAB LPZ
0 - 2 1.10E+00 8.85E-02 9.74E-02
0 - 8 1.02E+00 1.06E-02 1.08E-02
8 - 24 3.77E-01 1.31E-02 4.93E-03
24 - 96 5.36E-01 1.37E-02 7.33E-03
96 - 720 0.00E+00 1.01E-02 0.00E+00
Total 1.10E+00 1.93E+00 9.74E-02 2.31E-02
Limit 2.5 2.5
DCD Dose (rem TEDE) Site Dose (rem TEDE)
Note: The DCD doses from Table 3-6 are multiplied by the χ/Q ratios from Table 5-1.
Table 5-7. Doses for AP1000 Locked Rotor Accident with No Feedwater
χ/Q Ratio
Time (hr) EAB LPZ (Site/DCD) EAB LPZ
0 - 2 8.00E-01 8.85E-02 7.08E-02
0 - 8 3.89E-01 1.06E-02 4.12E-03
8 - 24 0.00E+00 1.31E-02 0.00E+00
24 - 96 0.00E+00 1.37E-02 0.00E+00
96 - 720 0.00E+00 1.01E-02 0.00E+00
Total 8.00E-01 3.89E-01 7.08E-02 4.12E-03
Limit 2.5 2.5
DCD Dose (rem TEDE) Site Dose (rem TEDE)
Note: The DCD doses from Table 3-6 are multiplied by the χ/Q ratios from Table 5-1.

Victoria County Station ESP ER Design Basis Accident Doses 25352-000-M0C-HARA-00006, 11 of 23
Table 5-8. Doses for AP1000 Locked Rotor Accident with Feedwater Available
χ/Q Ratio
Time (hr) EAB LPZ (Site/DCD) EAB LPZ
6 - 8 6.00E-01 8.85E-02 5.31E-02
0 - 8 7.52E-01 1.06E-02 7.97E-03
8 - 24 0.00E+00 1.31E-02 0.00E+00
24 - 96 0.00E+00 1.37E-02 0.00E+00
96 - 720 0.00E+00 1.01E-02 0.00E+00
Total 6.00E-01 7.52E-01 5.31E-02 7.97E-03
Limit 2.5 2.5
Site Dose (rem TEDE)DCD Dose (rem TEDE)
Note: The DCD doses from Table 3-6 are multiplied by the χ/Q ratios from Table 5-1.
Table 5-9. Doses for AP1000 Rod Ejection Accident
χ/Q Ratio
Time (hr) EAB LPZ (Site/DCD) EAB LPZ
0 - 2 3.60E+00 8.85E-02 3.19E-01
0 - 8 4.38E+00 1.06E-02 4.64E-02
8 - 24 7.85E-01 1.31E-02 1.03E-02
24 - 96 6.34E-02 1.37E-02 8.66E-04
96 - 720 2.02E-02 1.01E-02 2.03E-04
Total 3.60E+00 5.25E+00 3.19E-01 5.78E-02
Limit 6.3 6.3
Site Dose (rem TEDE)DCD Dose (rem TEDE)
Note: The DCD doses from Table 3-6 are multiplied by the χ/Q ratios from Table 5-1.
Table 5-10. Doses for AP1000 Small Break Outside Containment
χ/Q Ratio
Time (hr) EAB LPZ (Site/DCD) EAB LPZ
0 - 2 2.10E+00 8.85E-02 1.86E-01
0 - 8 1.03E+00 1.06E-02 1.09E-02
8 - 24 0.00E+00 1.31E-02 0.00E+00
24 - 96 0.00E+00 1.37E-02 0.00E+00
96 - 720 0.00E+00 1.01E-02 0.00E+00
Total 2.10E+00 1.03E+00 1.86E-01 1.09E-02
Limit 2.5 2.5
Site Dose (rem TEDE)DCD Dose (rem TEDE)
Note: The DCD doses from Table 3-6 are multiplied by the χ/Q ratios from Table 5-1.

Victoria County Station ESP ER Design Basis Accident Doses 25352-000-M0C-HARA-00006, 12 of 23
Table 5-11. Doses for AP1000 Steam Generator Tube Rupture with Pre-Incident Iodine Spike
χ/Q Ratio
Time (hr) EAB LPZ (Site/DCD) EAB LPZ
0 - 2 2.20E+00 8.85E-02 1.95E-01
0 - 8 1.16E+00 1.06E-02 1.23E-02
8 - 24 7.20E-02 1.31E-02 9.41E-04
24 - 96 0.00E+00 1.37E-02 0.00E+00
96 - 720 0.00E+00 1.01E-02 0.00E+00
Total 2.20E+00 1.23E+00 1.95E-01 1.32E-02
Limit 25 25
Site Dose (rem TEDE)DCD Dose (rem TEDE)
Note: The DCD doses from Table 3-6 are multiplied by the χ/Q ratios from Table 5-1.
Table 5-12. Doses for AP1000 Steam Generator Tube Rupture with Accident-Initiated Iodine Spike
χ/Q Ratio
Time (hr) EAB LPZ (Site/DCD) EAB LPZ
0 - 2 1.10E+00 8.85E-02 9.74E-02
0 - 8 6.10E-01 1.06E-02 6.47E-03
8 - 24 1.68E-01 1.31E-02 2.20E-03
24 - 96 0.00E+00 1.37E-02 0.00E+00
96 - 720 0.00E+00 1.01E-02 0.00E+00
Total 1.10E+00 7.78E-01 9.74E-02 8.66E-03
Limit 2.5 2.5
DCD Dose (rem TEDE) Site Dose (rem TEDE)
Note: The DCD doses from Table 3-6 are multiplied by the χ/Q ratios from Table 5-1.
Table 5-13. Doses for AP1000 Loss-of-Coolant Accident
χ/Q Ratio
Time (hr) EAB LPZ (Site/DCD) EAB LPZ
1.4 - 3.4 2.46E+01 1.74E-01 4.27E+00
0 - 8 2.17E+01 2.41E-02 5.23E-01
8 - 24 7.50E-01 2.45E-02 1.84E-02
24 - 96 2.93E-01 2.05E-02 6.01E-03
96 - 720 5.49E-01 1.01E-02 5.52E-03
Total 2.46E+01 2.33E+01 4.27E+00 5.53E-01
Limit 25 25
DCD Dose (rem TEDE) Site Dose (rem TEDE)
Note: The DCD doses from Table 3-6 are multiplied by the χ/Q ratios from Table 5-1.
Victoria County Station ESP ER Design Basis Accident Doses 25352-000-M0C-HARA-00006, 13 of 23
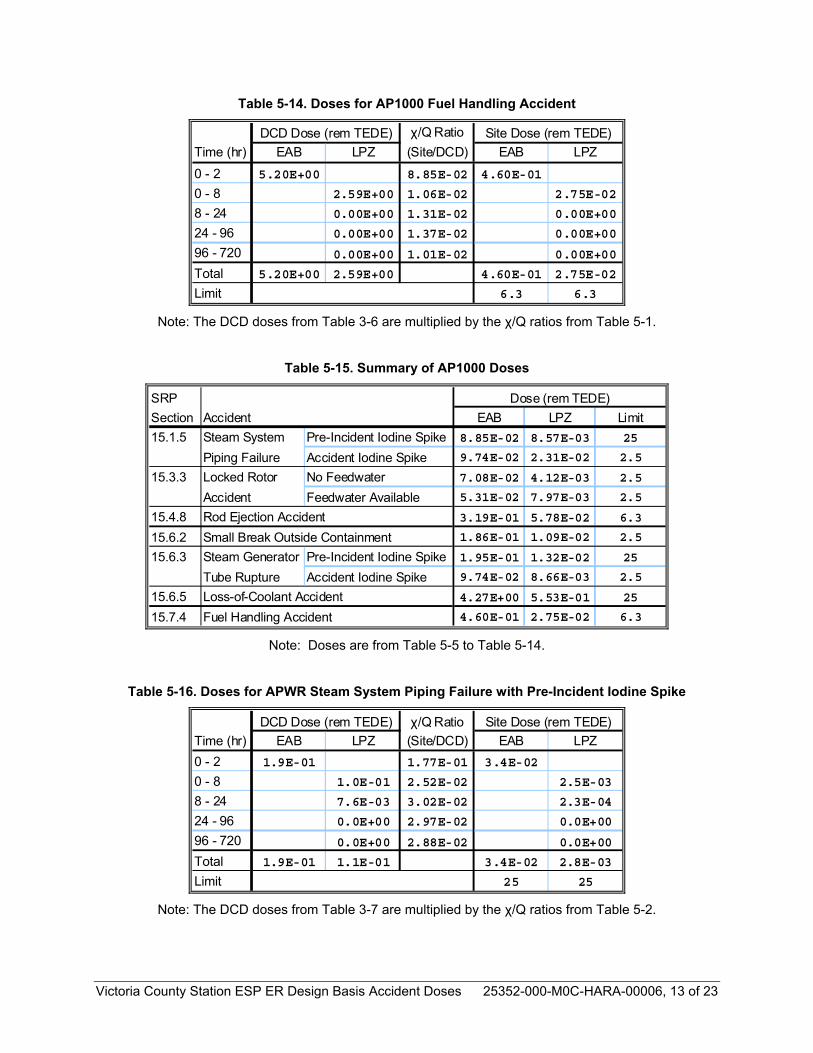
Table 5-14. Doses for AP1000 Fuel Handling Accident
χ/Q Ratio
Time (hr) EAB LPZ (Site/DCD) EAB LPZ
0 - 2 5.20E+00 8.85E-02 4.60E-01
0 - 8 2.59E+00 1.06E-02 2.75E-02
8 - 24 0.00E+00 1.31E-02 0.00E+00
24 - 96 0.00E+00 1.37E-02 0.00E+00
96 - 720 0.00E+00 1.01E-02 0.00E+00
Total 5.20E+00 2.59E+00 4.60E-01 2.75E-02
Limit 6.3 6.3
DCD Dose (rem TEDE) Site Dose (rem TEDE)
Note: The DCD doses from Table 3-6 are multiplied by the χ/Q ratios from Table 5-1.
Table 5-15. Summary of AP1000 Doses
SRP
Section Accident EAB LPZ Limit
15.1.5 Steam System Pre-Incident Iodine Spike 8.85E-02 8.57E-03 25
Piping Failure Accident Iodine Spike 9.74E-02 2.31E-02 2.5
15.3.3 Locked Rotor No Feedwater 7.08E-02 4.12E-03 2.5
Accident Feedwater Available 5.31E-02 7.97E-03 2.5
15.4.8 Rod Ejection Accident 3.19E-01 5.78E-02 6.3
15.6.2 Small Break Outside Containment 1.86E-01 1.09E-02 2.5
15.6.3 Steam Generator Pre-Incident Iodine Spike 1.95E-01 1.32E-02 25
Tube Rupture Accident Iodine Spike 9.74E-02 8.66E-03 2.5
15.6.5 Loss-of-Coolant Accident 4.27E+00 5.53E-01 25
15.7.4 Fuel Handling Accident 4.60E-01 2.75E-02 6.3
Dose (rem TEDE)
Note: Doses are from Table 5-5 to Table 5-14.
Table 5-16. Doses for APWR Steam System Piping Failure with Pre-Incident Iodine Spike
χ/Q Ratio
Time (hr) EAB LPZ (Site/DCD) EAB LPZ
0 - 2 1.9E-01 1.77E-01 3.4E-02
0 - 8 1.0E-01 2.52E-02 2.5E-03
8 - 24 7.6E-03 3.02E-02 2.3E-04
24 - 96 0.0E+00 2.97E-02 0.0E+00
96 - 720 0.0E+00 2.88E-02 0.0E+00
Total 1.9E-01 1.1E-01 3.4E-02 2.8E-03
Limit 25 25
DCD Dose (rem TEDE) Site Dose (rem TEDE)
Note: The DCD doses from Table 3-7 are multiplied by the χ/Q ratios from Table 5-2.

Victoria County Station ESP ER Design Basis Accident Doses 25352-000-M0C-HARA-00006, 14 of 23
Table 5-17. Doses for APWR Steam System Piping Failure with Accident-Initiated Iodine Spike
χ/Q Ratio
Time (hr) EAB LPZ (Site/DCD) EAB LPZ
0 - 2 3.2E-01 1.77E-01 5.7E-02
0 - 8 2.1E-01 2.52E-02 5.3E-03
8 - 24 6.5E-02 3.02E-02 2.0E-03
24 - 96 0.0E+00 2.97E-02 0.0E+00
96 - 720 0.0E+00 2.88E-02 0.0E+00
Total 3.2E-01 2.8E-01 5.7E-02 7.3E-03
Limit 2.5 2.5
Site Dose (rem TEDE)DCD Dose (rem TEDE)
.
Note: The DCD doses from Table 3-7 are multiplied by the χ/Q ratios from Table 5-2.
Table 5-18. Doses for APWR Locked Rotor Accident
χ/Q Ratio
Time (hr) EAB LPZ (Site/DCD) EAB LPZ
10 - 12 4.9E-01 1.77E-01 8.7E-02
0 - 8 4.4E-01 2.52E-02 1.1E-02
8 - 24 2.5E-01 3.02E-02 7.5E-03
24 - 96 0.0E+00 2.97E-02 0.0E+00
96 - 720 0.0E+00 2.88E-02 0.0E+00
Total 4.9E-01 6.9E-01 8.7E-02 1.9E-02
Limit 2.5 2.5
DCD Dose (rem TEDE) Site Dose (rem TEDE)
.
Note: The DCD doses from Table 3-7 are multiplied by the χ/Q ratios from Table 5-2.
Table 5-19. Doses for APWR Rod Ejection Accident
χ/Q Ratio
Time (hr) EAB LPZ (Site/DCD) EAB LPZ
0 - 2 5.1E+00 1.77E-01 9.0E-01
0 - 8 3.2E+00 2.52E-02 8.1E-02
8 - 24 8.8E-01 3.02E-02 2.7E-02
24 - 96 1.6E-01 2.97E-02 4.8E-03
96 - 720 1.7E-01 2.88E-02 4.9E-03
Total 5.1E+00 4.4E+00 9.0E-01 1.2E-01
Limit 6.3 6.3
Site Dose (rem TEDE)DCD Dose (rem TEDE)
Note: The DCD doses from Table 3-7 are multiplied by the χ/Q ratios from Table 5-2.

Victoria County Station ESP ER Design Basis Accident Doses 25352-000-M0C-HARA-00006, 15 of 23
Table 5-20. Doses for APWR Small Break Outside Containment
χ/Q Ratio
Time (hr) EAB LPZ (Site/DCD) EAB LPZ
0 - 2 1.5E+00 1.77E-01 2.7E-01
0 - 8 6.0E-01 2.52E-02 1.5E-02
8 - 24 0.0E+00 3.02E-02 0.0E+00
24 - 96 0.0E+00 2.97E-02 0.0E+00
96 - 720 0.0E+00 2.88E-02 0.0E+00
Total 1.5E+00 6.0E-01 2.7E-01 1.5E-02
Limit 2.5 2.5
Site Dose (rem TEDE)DCD Dose (rem TEDE)
.
Note: The DCD doses from Table 3-7 are multiplied by the χ/Q ratios from Table 5-2.
Table 5-21. Doses for APWR Steam Generator Tube Rupture with Pre-Incident Iodine Spike
χ/Q Ratio
Time (hr) EAB LPZ (Site/DCD) EAB LPZ
0 - 2 3.6E+00 1.77E-01 6.4E-01
0 - 8 1.5E+00 2.52E-02 3.8E-02
8 - 24 2.0E-03 3.02E-02 6.0E-05
24 - 96 2.1E-04 2.97E-02 6.2E-06
96 - 720 1.7E-04 2.88E-02 4.9E-06
Total 3.6E+00 1.5E+00 6.4E-01 3.8E-02
Limit 25 25
Site Dose (rem TEDE)DCD Dose (rem TEDE)
.
Note: The DCD doses from Table 3-7 are multiplied by the χ/Q ratios from Table 5-2.
Table 5-22. Doses for APWR Steam Generator Tube Rupture with Accident-Initiated Iodine Spike
χ/Q Ratio
Time (hr) EAB LPZ (Site/DCD) EAB LPZ
0 - 2 9.6E-01 1.77E-01 1.7E-01
0 - 8 4.1E-01 2.52E-02 1.0E-02
8 - 24 1.0E-02 3.02E-02 3.0E-04
24 - 96 2.1E-04 2.97E-02 6.2E-06
96 - 720 1.7E-04 2.88E-02 4.9E-06
Total 9.6E-01 4.2E-01 1.7E-01 1.1E-02
Limit 2.5 2.5
DCD Dose (rem TEDE) Site Dose (rem TEDE)
Note: The DCD doses from Table 3-7 are multiplied by the χ/Q ratios from Table 5-2.

Victoria County Station ESP ER Design Basis Accident Doses 25352-000-M0C-HARA-00006, 16 of 23
Table 5-23. Doses for APWR Loss-of-Coolant Accident
χ/Q Ratio
Time (hr) EAB LPZ (Site/DCD) EAB LPZ
0.5 - 2.5 1.3E+01 1.77E-01 2.3E+00
0 - 8 9.0E+00 2.52E-02 2.3E-01
8 - 24 1.2E+00 3.02E-02 3.6E-02
24 - 96 1.3E+00 2.97E-02 3.9E-02
96 - 720 1.4E+00 2.88E-02 4.0E-02
Total 1.3E+01 1.3E+01 2.3E+00 3.4E-01
Limit 25 25
DCD Dose (rem TEDE) Site Dose (rem TEDE)
.
Note: The DCD doses from Table 3-7 are multiplied by the χ/Q ratios from Table 5-2.
Table 5-24. Doses for APWR Fuel Handling Accident
χ/Q Ratio
Time (hr) EAB LPZ (Site/DCD) EAB LPZ
0 - 2 3.3E+00 1.77E-01 5.8E-01
0 - 8 1.4E+00 2.52E-02 3.5E-02
8 - 24 0.0E+00 3.02E-02 0.0E+00
24 - 96 0.0E+00 2.97E-02 0.0E+00
96 - 720 0.0E+00 2.88E-02 0.0E+00
Total 3.3E+00 1.4E+00 5.8E-01 3.5E-02
Limit 6.3 6.3
DCD Dose (rem TEDE) Site Dose (rem TEDE)
.
Note: The DCD doses from Table 3-7 are multiplied by the χ/Q ratios from Table 5-2.
Table 5-25. Summary of APWR Doses
DCD
Section Accident EAB LPZ Limit
15.1.5 Steam System Pre-Existing Iodine Spike 3.4E-02 2.8E-03 25
Piping Failure Accident Iodine Spike 5.7E-02 7.3E-03 2.5
15.3.3 Locked Rotor Accident 8.7E-02 1.9E-02 2.5
15.4.8 Rod Ejection Accident 9.0E-01 1.2E-01 6.3
15.6.2 Small Line Break Outside Containment 2.7E-01 1.5E-02 2.5
15.6.3 Steam Generator Pre-Existing Iodine Spike 6.4E-01 3.8E-02 25
Tube Rupture Accident Iodine Spike 1.7E-01 1.1E-02 2.5
15.6.5 Loss-of-Coolant Accident 2.3E+00 3.4E-01 25
15.7.4 Fuel Handling Accident 5.8E-01 3.5E-02 6.3
Dose (rem TEDE)
Note: Doses are from Table 5-16 to Table 5-24.

Victoria County Station ESP ER Design Basis Accident Doses 25352-000-M0C-HARA-00006, 17 of 23
Table 5-26. Doses for ABWR Small Break Outside Containment
DCD Dose (Sv) χ/Q Ratio Site Dose (rem)
Location Time (hr) W. Body Thyroid (Site/DCD) W. Body Thyroid
EAB 0 - 2 9.4E-04 4.8E-02 6.46E-02 6.1E-03 3.1E-01
LPZ 0 - 8 3.87E-03 3.6E-04 1.9E-02
Limit 2.5 30
Note: The DCD doses from Table 3-4 are multiplied by the χ/Q ratios from Table 5-3.
Table 5-27. Doses for ABWR Main Steam Line Break with Pre-Incident Iodine Spike
DCD Dose (Sv) χ/Q Ratio Site Dose (rem)
Location Time (hr) W. Body Thyroid (Site/DCD) W. Body Thyroid
EAB 0 - 2 1.3E-02 5.1E-01 6.46E-02 8.4E-02 3.3E+00
LPZ 0 - 8 3.87E-03 5.0E-03 2.0E-01
Limit 25 300
Note: The DCD doses from Table 3-4 are multiplied by the χ/Q ratios from Table 5-3.
Table 5-28. Doses for ABWR Main Steam Line Break with Equilibrium Iodine Activity
DCD Dose (Sv) χ/Q Ratio Site Dose (rem)
Location Time (hr) W. Body Thyroid (Site/DCD) W. Body Thyroid
EAB 0 - 2 6.2E-04 2.6E-02 6.46E-02 4.0E-03 1.7E-01
LPZ 0 - 8 3.87E-03 2.4E-04 1.0E-02
Limit 2.5 30
Note: The DCD doses from Table 3-4 are multiplied by the χ/Q ratios from Table 5-3.
Table 5-29. Doses for ABWR Loss-of-Coolant Accident
DCD Dose (Sv) χ/Q Ratio Site Dose (rem)
Location Time (hr) W. Body Thyroid (Site/DCD) W. Body Thyroid
EAB 0 - 2 4.1E-02 1.9E+00 6.46E-02 2.6E-01 1.2E+01
LPZ 0 - 8 1.0E-02 3.1E-01 3.40E-02 3.4E-02 1.1E+00
8 - 24 8.0E-03 2.0E-01 4.08E-02 3.3E-02 8.2E-01
24 - 96 1.1E-02 7.9E-01 6.10E-02 6.7E-02 4.8E+00
96 - 720 9.0E-03 1.1E+00 1.08E-01 9.8E-02 1.2E+01
Total 3.8E-02 2.4E+00 2.3E-01 1.9E+01
Limit 25 300
Note: The DCD doses from Table 3-4 are multiplied by the χ/Q ratios from Table 5-3.
Victoria County Station ESP ER Design Basis Accident Doses 25352-000-M0C-HARA-00006, 18 of 23
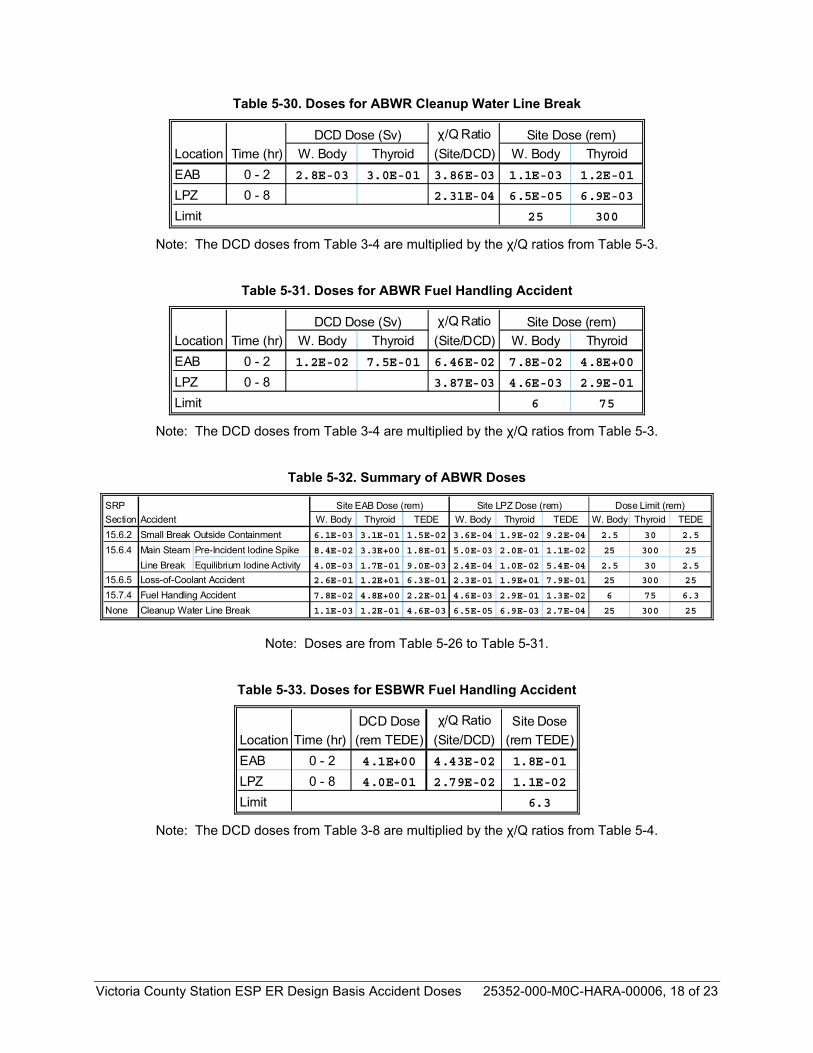
Table 5-30. Doses for ABWR Cleanup Water Line Break
DCD Dose (Sv) χ/Q Ratio Site Dose (rem)
Location Time (hr) W. Body Thyroid (Site/DCD) W. Body Thyroid
EAB 0 - 2 2.8E-03 3.0E-01 3.86E-03 1.1E-03 1.2E-01
LPZ 0 - 8 2.31E-04 6.5E-05 6.9E-03
Limit 25 300
Note: The DCD doses from Table 3-4 are multiplied by the χ/Q ratios from Table 5-3.
Table 5-31. Doses for ABWR Fuel Handling Accident
DCD Dose (Sv) χ/Q Ratio Site Dose (rem)
Location Time (hr) W. Body Thyroid (Site/DCD) W. Body Thyroid
EAB 0 - 2 1.2E-02 7.5E-01 6.46E-02 7.8E-02 4.8E+00
LPZ 0 - 8 3.87E-03 4.6E-03 2.9E-01
Limit 6 75
Note: The DCD doses from Table 3-4 are multiplied by the χ/Q ratios from Table 5-3.
Table 5-32. Summary of ABWR Doses
SRP Site EAB Dose (rem) Site LPZ Dose (rem)
Section Accident W. Body Thyroid TEDE W. Body Thyroid TEDE W. Body Thyroid TEDE
15.6.2 Small Break Outside Containment 6.1E-03 3.1E-01 1.5E-02 3.6E-04 1.9E-02 9.2E-04 2.5 30 2.5
15.6.4 Main Steam Pre-Incident Iodine Spike 8.4E-02 3.3E+00 1.8E-01 5.0E-03 2.0E-01 1.1E-02 25 300 25
Line Break Equilibrium Iodine Activity 4.0E-03 1.7E-01 9.0E-03 2.4E-04 1.0E-02 5.4E-04 2.5 30 2.5
15.6.5 Loss-of-Coolant Accident 2.6E-01 1.2E+01 6.3E-01 2.3E-01 1.9E+01 7.9E-01 25 300 25
15.7.4 Fuel Handling Accident 7.8E-02 4.8E+00 2.2E-01 4.6E-03 2.9E-01 1.3E-02 6 75 6.3
None Cleanup Water Line Break 1.1E-03 1.2E-01 4.6E-03 6.5E-05 6.9E-03 2.7E-04 25 300 25
Dose Limit (rem)
Note: Doses are from Table 5-26 to Table 5-31.
Table 5-33. Doses for ESBWR Fuel Handling Accident
DCD Dose χ/Q Ratio Site Dose
Location Time (hr) (rem TEDE) (Site/DCD) (rem TEDE)
EAB 0 - 2 4.1E+00 4.43E-02 1.8E-01
LPZ 0 - 8 4.0E-01 2.79E-02 1.1E-02
Limit 6.3
Note: The DCD doses from Table 3-8 are multiplied by the χ/Q ratios from Table 5-4.

Victoria County Station ESP ER Design Basis Accident Doses 25352-000-M0C-HARA-00006, 19 of 23
Table 5-34. Doses for ESBWR Loss-of-Coolant Accident
DCD Dose χ/Q Ratio Site Dose
Location Time (hr) (rem TEDE) (Site/DCD) (rem TEDE)
EAB 2.3 - 4.3 2.24E+01 4.43E-02 9.91E-01
LPZ 0 - 8 6.93E+00 2.79E-02 1.93E-01
8 - 24 4.54E+00 2.80E-02 1.27E-01
24 - 96 4.72E+00 2.73E-02 1.29E-01
96 - 720 4.56E+00 2.68E-02 1.22E-01
Total 2.08E+01 5.72E-01
Limit 25
Note: The DCD doses from Table 3-8 are multiplied by the χ/Q ratios from Table 5-4.
Table 5-35. Doses for ESBWR Main Steam Line Break with Pre-Incident Iodine Spike
DCD Dose χ/Q Ratio Site Dose
Location Time (hr) (rem TEDE) (Site/DCD) (rem TEDE)
EAB 0 - 2 2.6E+00 4.43E-02 1.2E-01
LPZ 0 - 8 2.0E-01 2.79E-02 5.6E-03
Limit 25
Note: The DCD doses from Table 3-8 are multiplied by the χ/Q ratios from Table 5-4.
Table 5-36. Doses for ESBWR Main Steam Line Break with Equilibrium Iodine Activity
DCD Dose χ/Q Ratio Site Dose
Location Time (hr) (rem TEDE) (Site/DCD) (rem TEDE)
EAB 0 - 2 2.0E-01 4.43E-02 8.9E-03
LPZ 0 - 8 1.0E-01 2.79E-02 2.8E-03
Limit 2.5
Note: The DCD doses from Table 3-8 are multiplied by the χ/Q ratios from Table 5-4.

Victoria County Station ESP ER Design Basis Accident Doses 25352-000-M0C-HARA-00006, 20 of 23
Table 5-37. Doses for ESBWR Feedwater Line Break with Pre-Incident Iodine Spike
DCD Dose χ/Q Ratio Site Dose
Location Time (hr) (rem TEDE) (Site/DCD) (rem TEDE)
EAB 0 - 2 1.8E+01 4.43E-02 8.0E-01
LPZ 0 - 8 1.7E+00 2.79E-02 4.7E-02
Limit 25
Note: The DCD doses from Table 3-8 are multiplied by the χ/Q ratios from Table 5-4.
Table 5-38. Doses for ESBWR Feedwater Line Break with Equilibrium Iodine Activity
DCD Dose χ/Q Ratio Site Dose
Location Time (hr) (rem TEDE) (Site/DCD) (rem TEDE)
EAB 0 - 2 1.1E+00 4.43E-02 4.9E-02
LPZ 0 - 8 1.0E-01 2.79E-02 2.8E-03
Limit 2.5
Note: The DCD doses from Table 3-8 are multiplied by the χ/Q ratios from Table 5-4.
Table 5-39. Doses for ESBWR Small Break Outside Containment with Pre-Incident Iodine Spike
DCD Dose χ/Q Ratio Site Dose
Location Time (hr) (rem TEDE) (Site/DCD) (rem TEDE)
EAB 0 - 2 3.4E-01 4.43E-02 1.5E-02
LPZ 0 - 720 1.0E-01 2.80E-02 2.8E-03
Limit 25
Note: The DCD doses from Table 3-8 are multiplied by the χ/Q ratios from Table 5-4. Since LPZ doses are not available as a function of time, the total DCD dose is multiplied by the maximum χ/Q ratio.
Table 5-40. Doses for ESBWR Small Break Outside Containment with Equilibrium Iodine Activity
DCD Dose χ/Q Ratio Site Dose
Location Time (hr) (rem TEDE) (Site/DCD) (rem TEDE)
EAB 0 - 2 1.0E-01 4.43E-02 4.4E-03
LPZ 0 - 720 1.0E-01 2.80E-02 2.8E-03
Limit 2.5
Note: The DCD doses from Table 3-8 are multiplied by the χ/Q ratios from Table 5-4. Since LPZ doses are not available as a function of time, the total DCD dose is multiplied by the maximum χ/Q ratio.

Victoria County Station ESP ER Design Basis Accident Doses 25352-000-M0C-HARA-00006, 21 of 23
Table 5-41. Doses for ESBWR Cleanup Water Line Break with Pre-Incident Iodine Spike
DCD Dose χ/Q Ratio Site Dose
Location Time (hr) (rem TEDE) (Site/DCD) (rem TEDE)
EAB 0 - 2 6.9E+00 4.43E-02 3.1E-01
LPZ 0 - 8 7.0E-01 2.79E-02 2.0E-02
Limit 25
Note: The DCD doses from Table 3-8 are multiplied by the χ/Q ratios from Table 5-4.
Table 5-42. Doses for ESBWR Cleanup Water Line Break with Equilibrium Iodine Activity
DCD Dose χ/Q Ratio Site Dose
Location Time (hr) (rem TEDE) (Site/DCD) (rem TEDE)
EAB 0 - 2 4.0E-01 4.43E-02 1.8E-02
LPZ 0 - 8 1.0E-01 2.79E-02 2.8E-03
Limit 2.5
Note: The DCD doses from Table 3-8 are multiplied by the χ/Q ratios from Table 5-4.
Table 5-43. Summary of ESBWR Doses
SRP
Section Accident EAB LPZ Limit
15.6.2 Small Break Outside Pre-Incident Iodine Spike 1.5E-02 2.8E-03 25
Containment Equilibrium Iodine Activity 4.4E-03 2.8E-03 2.5
15.6.4 Main Steam Pre-Incident Iodine Spike 1.2E-01 5.6E-03 25
Line Break Equilibrium Iodine Activity 8.9E-03 2.8E-03 2.5
15.6.5 Loss-of-Coolant Accident 9.9E-01 5.7E-01 25
15.7.4 Fuel Handling Accident 1.8E-01 1.1E-02 6.3
None Feedwater Pre-Incident Iodine Spike 8.0E-01 4.7E-02 25
Line Break Equilibrium Iodine Activity 4.9E-02 2.8E-03 2.5
None Cleanup Water Pre-Incident Iodine Spike 3.1E-01 2.0E-02 25
Line Break Equilibrium Iodine Activity 1.8E-02 2.8E-03 2.5
Dose (rem TEDE)
Note: Doses are from Table 5-33 to Table 5-42.

Victoria County Station ESP ER Design Basis Accident Doses 25352-000-M0C-HARA-00006, 22 of 23
6.0 Results & Conclusions The design basis accidents doses for the AP1000, APWR, ABWR, and the ESBWR are summarized in Table 6-1. In addition to meeting the 25 rem TEDE limit of 10 CFR 50.34(a)(1)(ii), the doses also meet the accident-specific dose limits of the SRP. EAB doses are for the two-hour period yielding the maximum dose.

Victoria County Station ESP ER Design Basis Accident Doses 25352-000-M0C-HARA-00006, 23 of 23
Table 6-1. Summary of Accident Doses
SRP DCD
Section Accident Design Section EAB LPZ Limit
15.1.5 Steam System Pre-Incident AP1000 15.1.5 8.9E-02 8.6E-03 25
Piping Failure Iodine Spike APWR 15.1.5 3.4E-02 2.8E-03
Accident-Initiated AP1000 15.1.5 9.7E-02 2.3E-02 2.5
Iodine Spike APWR 15.1.5 5.7E-02 7.3E-03
15.3.3 Locked Rotor No Feedwater AP1000 15.3.3 7.1E-02 4.1E-03 2.5
Accident Feedwater Available AP1000 15.3.3 5.3E-02 8.0E-03
Locked Rotor Accident APWR 15.3.3 8.7E-02 1.9E-02
15.4.8 Rod Ejection Accident AP1000 15.4.8 3.2E-01 5.8E-02 6.3
APWR 15.4.8 9.0E-01 1.2E-01
15.6.2 Small Break Outside Containment AP1000 15.6.2 1.9E-01 1.1E-02 2.5
APWR 15.6.2 2.7E-01 1.5E-02
ABWR 15.6.2 1.5E-02 9.2E-04
Small Break Pre-Incident Iodine Spike ESBWR 15.4.8 1.5E-02 2.8E-03 25
Outside Ctmt Equilibrium Iodine Activity ESBWR 15.4.8 4.4E-03 2.8E-03 2.5
15.6.3 Steam Pre-Incident AP1000 15.6.3 1.9E-01 1.3E-02 25
Generator Iodine Spike APWR 15.6.3 6.4E-01 3.8E-02
Tube Accident-Initiated AP1000 15.6.3 9.7E-02 8.7E-03 2.5
Rupture Iodine Spike APWR 15.6.3 1.7E-01 1.1E-02
15.6.4 Main Pre-Incident ABWR 15.6.4 1.8E-01 1.1E-02 25
Steam Iodine Spike ESBWR 15.4.5 1.2E-01 5.6E-03
Line Equilibrium ABWR 15.6.4 9.0E-03 5.4E-04 2.5
Break Iodine Activity ESBWR 15.4.5 8.9E-03 2.8E-03
15.6.5 Loss-of-Coolant Accident AP1000 15.6.5 4.3E+00 5.5E-01 25
APWR 15.6.5 2.3E+00 3.4E-01
ABWR 15.6.5 6.3E-01 7.9E-01
ESBWR 15.4.4 9.9E-01 5.7E-01
15.7.4 Fuel Handling Accident AP1000 15.7.4 4.6E-01 2.7E-02 6.3
APWR 15.7.4 5.8E-01 3.5E-02
ABWR 15.7.4 2.2E-01 1.3E-02
ESBWR 15.4.1 1.8E-01 1.1E-02
None Feedwater Pre-Incident Iodine Spike ESBWR 15.4.7 8.0E-01 4.7E-02 25
Line Break Equilibrium Iodine Activity ESBWR 15.4.7 4.9E-02 2.8E-03 2.5
None Cleanup Water Line Break ABWR 15.6.6 4.6E-03 2.7E-04 25
Cleanup Water Pre-Incident Iodine Spike ESBWR 15.4.9 3.1E-01 2.0E-02 25
Line Break Equilibrium Iodine Activity ESBWR 15.4.9 1.8E-02 2.8E-03 2.5
Dose (rem TEDE)

NP-12-0023 Enclosure 2
ENCLOSURE 2
Calculation of Severe Accident Risks for the Proposed Exelon VCS ESP, Rev. 2, Tetra Tech, December 22, 2009
1
Calculation of Severe Accident Risks for the Proposed Exelon Victoria County Site ESP – Rev.2
December 22, 2009
Prepared for:
Bechtel
Prepared by:
Alan Toblin Tetra Tech
Aiken, South Carolina

2
Approval Page
Calculation of Severe Accident Risks for the Proposed Exelon Victoria County Site ESP – Rev.2
December 22, 2009

3
Calculation of Severe Accident Risks for the Proposed Exelon Victoria County Site ESP – Rev.2
Exelon has proposed the construction and operation of two new nuclear reactor electric generating units at the Victoria County, Texas site. Those units would be of new design. As part of the Early Site Permit submittal supporting this proposed action, the risks from hypothetical severe accidents releasing nuclear material from a single reactor core into the environment have been calculated. Two different reactor types have been analyzed as examples to demonstrate the acceptability of the Victoria County site. The analysis and results are described in Chapter 7 of the Environmental Report. Those results are documented in this calculation package.
The calculation package presents the detailed information, including data input and output, for each of the following sub-analyses which support the overall accident analysis:
• Meteorology (wind speed, wind direction, precipitation, atmospheric stability)
• Population
• Agriculture and Economy
• Evacuation
• MACCS2 input files (calculation of conditional accident impacts)
• MACCS2 output files and Risks
Meteorology (all supporting files are in the \met folder of this package)
Sequential hourly onsite data (wind speed, wind direction, stability class, and precipitation) for two one-year periods, 7/1/07-6/30/08 and 7/1/08-6/30/09 were supplied by Murray and Trettel. They supplied the files VICT070810METER MACCS.TXT and VICT080910M.MACCS, which are formatted as MACCS2 input files for each one-year period. They also supplied VICTORIA SITE HOURLY JUL07JUNE08.TXT, which includes an expanded parameter list of hourly onsite met measurements. One data entry in the 2007-08 MACCS2 input file, stability class for day 58 (2/27/08), hour 10 was missing; that data was confirmed missing in the hourly text file. An interpolated stability class of E (denoted in the file by the number 5) was inserted into the MACCS2 input file for that hour.

4
There were 81 hours with missing data in the supplied 2008-09 MACCS input file; most of those hours were filled in manually using interpolation and consideration of the corresponding 60-meter parameter value (see the expanded list of hourly onsite data parameters in VICTORIA 07-08_06-09 DATA.TXT). The block of missing 2008-09 data from day 147 hour 11 through day 148 hour 15 was filled in by copying the onsite data from the corresponding 2007-08 hours.
The last line of the edited MACCS2 input files contain the seasonal morning and afternoon mixing height at the Victoria County site. Values for those parameters were taken from “Mixing Heights, Wind Speeds, and Potential for Urban Air Pollution Throughout the Contiguous United States,” Holzworth, 1972, USEPA. That reference is not available electronically. The edited Murray & Trettel files were denoted as V0708.MET and V0809.MET. The latter was found to result in slightly larger population-dose and -cost risks (see MACCS2 Output Files) and was used as the base case meteorology.
A longer meteorological data base, encompassing January 2003 - June 2008, was obtained from the National Climatic Data Center (NCDC) for Victoria Airport. The EPA program PCRAMMET (see http://www.epa.gov/scram001/metobsdata_procaccprogs.htm) was used to reduce the Victoria Airport data to a form that could be used as input to MACCS2. A sub-directory, /AIRPORT, under the /MET directory (folder) contains the NCDC supplied met data (chiefly files VICT0308.NCD and VICT0308.PRE), intermediate files obtained from them (e.g., VICT0308.CC, VICT0308.CL,VICT0308.SP, VICT0308.DR ), the input file to PCRAMMET (VICT0308.144), and the output file from PCRAMMET (VICT0308.ISC). The five annual (2003-2007) MACCS2 met input files, VICTAP??.MET (where ?? is the last two digits of the year) are in the \MET folder. The MACCS met input file VICTAP78.MET, also in the \MET folder, incorporates the airport met data from July 2007 through July 2008; that period corresponds with one of the onsite met data periods. An explanation of each step used in converting the NCDC data to MACCS2 input, including inputs, outputs and computer codes, are contained in the READ.ME file in the \AIRPORT sub-directory under the \MET directory. The last line of each airport MACCS2 met input file contains the seasonal morning and afternoon mixing height at the Victoria County site. Those values were taken from “Mixing Heights, Wind Speeds, and Potential for Urban Air Pollution Throughout the Contiguous United States,” Holzworth, 1972, USEPA. That reference is not available electronically.
Population (all supporting files are in the \pop folder of this package)
The SECPOP2000 code was used to produce a basic MACCS2 site input file. The basic MACCS2 site file, EXSECP.SIT, includes the population distribution for the 50-miles surrounding the site (site latitude/longitude coordinates in file EXELON VICTORIA

5
SITE COORDINATES.EML) based on accessing the code’s 2000 national census data base.
Using surrounding county population growth rates, POPULATION PROJECTION-VICTORIA-REV1 (011108).XLS shows the counties and their fraction within the 50-mile area, the GIS was used in projecting the population distribution at 10-year intervals. Those projections are shown in the SECTOR POPALL worksheet of POPULATION PROJECTION-VICTORIA-REV1 (011108).XLS. That worksheet includes contributions from transient populations (see worksheet TRANSIENT_POP) along with the resident population distribution. The 2060 population projection was used for the subsequent impact analysis. The MACCS2 site file, with the projected 2060 population replacing the 2000 census population, is EX2060R1.SIT. An additional site file, EX2060R2.SIT, adds 100 to the 2060 population projection in each of two locations, NNE sector between 2 and 3 miles and the NE sector between 2 and 3 miles. The agricultural production and economic data in the latter two files are described in the next section (Agriculture and Economy).
Agriculture and Economy (all supporting files are in the \econ folder of this package)
The MACCS2 site file described above requires information on the distribution of agriculture and associated economics. That information is available from the SECPOP2000 program based on the 1997 national agriculture census. However, more recent data, 2007 National Census of Agriculture county data for those counties within 50 miles of the Exelon site, was used. That data, along with county areas, population, 2007 total county property values and references to the original data sources are included in EXELON-CENSUS-2007.XLS, worksheet=CENSUS07; that worksheet is saved as the text file EXCENS07.PRN. The distribution of the MACCS2 required agriculture and economic data was derived from the .XLS file, considering the fraction of each county within the 50-mile model domain and within each of its 160 sub-areas (16 directions * 10 distances). The areas of each county within each sub-area are given in POPULATION PROJECTION VICTORIA-REV1 (011108).XLS (in the \pop folder), worksheet=COUNTY FRACTIONS. The essential parts of that worksheet are saved as the text file CNTYFRAC.PRN. The fortran program PRN2SIT (source and executable, .FOR and .EXE) uses that .PRN file together with EXCENS07.PRN and produces PRN2SIT.OUT. The latter contains inputs required by MACCS2 in a format that can be directly inserted into that program’s site file. Those inputs include spatial distributions of land fraction and 50-mile farmland devoted to specified crop types (e.g., grains, leafy vegetables). Associated economic data, distributed about the site analogously to the population, includes total farm sales, farm sales from dairy production, fraction of land

6
devoted to farming, etc. This information was inserted into the site files in the \pop folder described previously (see Population).
Additional area-wide economic data is contained in the MACCS2 input file EXEL.CHR. Much of this data is based on the MACCS sample problem A. The latter was formulated in 1986; data such as cost for a relocated person and farmland decontamination costs were escalated to October 2009 using the consumer price index ratio. Economic data updated from the sample problem in this way is clearly labeled in the chronic (.chr) file.
Two other parameters in the .CHR file were recalculated for this analysis. The parameter chvalwf, area-wide value of farm wealth (dollars/hectare), was calculated from 2007 National Agriculture Census county farm land, building and machinery value statistics. County data was apportioned by the fraction of each county within 50 miles of Exelon’s Victoria County site; the calculation and result (and reference for source data) is in EXELON-CENSUS-2007.XLS, worksheet=VALWF-VALWNF. The parameter chvalwnf, area-wide non-farm wealth (dollars/person), was similarly calculated in the .XLS file based on 2007 Texas property valuations by county. Those valuations are in COUNTY PROPERTY VALUES 2007.XLS, as referenced in ANNUAL PROPERTY TAX REPORT – FOCUS ON COUNTY TAXES – TAX YEAR 2007.MHT. These two parameters were also escalated to October 2009 using the consumer price index.
Evacuation (all supporting files are in the \evac folder of this package)
At the time of this study, a site evacuation-time analysis was not available. It was, therefore, conservatively assumed that there would be no evacuation of the surrounding population at the time of a hypothesized accident release. The assumption of no evacuation (zero evacuation speed) is included in the MACCS2 input file, EXEL.ERL.
MACCS2 Input Files (all supporting files are in the \input folder of this package)
The MACCS2 input files include those used in the model’s early module (.erl extension), chronic module (.chr) and atmospheric module (.atm). The site and meteorological files required to run the model are included in the \pop and \met folders. The base files have the filenames EXEL.ERL, EXEL.CHR, EXAB.ATM (ABWR), EXES.ATM (ESBWR) and are based on the corresponding MACCS sample problem A file, supplied with the model. EXEL.ERL differences from the sample file include incorporation of zero evacuation speed (described above) and use of ISCORS, 2002 fatal cancer dose risk factor (.0006 fatal cancers per rem for dose < 20 rem). EXEL.CHR incorporates the inflation of 1986 sample file costs (as described previously under the Agriculture and Economy heading).

7
ABWR
EXAB.ATM incorporates specifics from the ABWR-DCD accident analysis including wake effect parameters (containment building size), core inventory, power level, and source terms. Specific references to DCD Chapters 2 and 19, included here as ABWR CH-2.PDF and ABWR CH-19.PDF, are noted in the .ATM file. Release source terms (release fractions) are from Table 19E.3-6 of ABWR CH-19.PDF; the values in that table are different (for three of the release case) than those in Table 2A-15 of ABWR CH-2.PDF. The former is used because it results in greater dose and cost risks than the latter.
Files EXABGRND.ATM, EXABMOC.ATM, and EXABNORN.ATM are included. These files were used for sensitivity analyses of releases at ground-level (base case is release near top of containment), the middle of the containment, and measured meteorology in the 40-50 mile population ring (base case is constant meteorology with continuous rain in that ring to assure conservative plume exposure within 50-miles). BAT files are also included which execute the MACCS2 model for each of the cases. RUN.BAT executes the base case, RUNSENS.BAT executes the sensitivity cases, and RUNVAP.BAT executes the base case using Victoria Airport met data for each of the five years (2003-2007) plus the period 7/07-6/08 (see Meteorology section, above). RUNR2.BAT is analogous to RUN.BAT, with EX2060R2.SIT replacing EX2060R1.SIT, the base case site file (see Population section, above). RUNALL.BAT executes each of the aforementioned BAT files. The BAT files assume that RUNMAX2.BAT (included here) and the MACCS2 model execution and database files (not included in this package) are in a \MACCS2 folder.
ESBWR
EXES.ATM incorporates specifics from the GE-Hitachi accident analysis including wake effect parameters (containment building size), core inventory, power level, and source terms. Specific references to Chapter 10 of Revision 4 of the ESBWR PRA (_10 REV 4 RBO_061909.PDF) and Chapter 3 of the Revision 6 ESBWR DCD, included here as 26A6642AJ_REV06_ESBWR_DCD_TIER_2_SECTIONS_03-1_TO_03-8.PDF are noted in the .ATM file.
Release fractions are from PRA Chapter 9, Table 9-3 (_09 REV 4[1].1 SOURCE TERMS_RBO.PDF) and are saved together with release timing (i.e., start and end time of release relative to time of initial core damage) in RELFRACS.CSV. Chemical inventories were taken from the accident sequence maap file (see DCD Table 10.3-3a), T_AT_NIN_TSL2X_R1.TAB (the core chemical inventory is the same for all accident sequences) and included in the fortran program READRELF.EXE (source code READRELF.FOR), which converts RELFRACS.CSV to ATMOS.INP. The latter file, which is MACCS input file compatible, was directly inserted into the MACCS2 input file EXES.ATM.

8
Files EXESMOC.ATM, EXESTOC.ATM, EXES01MW.ATM, EXES10MW.ATM, EXTOC1MW and EXESNORN.ATM are included. These files were used for sensitivity analyses of releases at the middle of the containment, top of the containment (base case is ground level release), releases with 1 and 10 MW of heat per release segment (base case is 0 heat), release at top of containment with 1 MW of heat release, and measured meteorology in the 40-50 mile population ring (base case is constant meteorology with continuous rain in that ring to assure conservative plume exposure within 50-miles). The .BAT files used for executing the ABWR cases are also applicable to the ESBWR cases.
MACCS2 Output Files and Risk (all supporting files are in the \output folder of this package)
The MACCS2 output files, created from the input files described above, are denoted as EXaabbbb.OUT (base case where aa=AB for ABWR or ES for ESBWR and bbbb=0708 or 0809, the meteorology data period), EXaacc.OUT (where cc=03, 04, 05, 06, or 07 denoting Victoria Airport Met data for 2003-2007. cc=78 denotes airport data for July 2007-June 2008), EXaadddd (where dddd= GRND, MOC, TOC, NORN, 01MW, or 10MW corresponding to the sensitivity .ATM files described in the Input section, above), EXTOC1MW (for ESBWR only, corresponding to GEs PRA Base Case-2) and R2aa0809 (where R2 designates use of the site file EX2060R2.SIT in place of the base case site file, EX2060R1.SIT. The site files are described in the Population section). Two fortran programs, READOTaa.FOR, were created (READOTAB and READOTES differ only in their data statement that incorporates sequence frequencies) to read the MACCS2 results of interest from each of the hypothesized releases from each of the output files. READOTaa.IN lists the output files (.out extension assumed) to be read. READOTaa.RSK displays output parameters of interest including the conditional 50-mile population dose, economic costs, early fatalities, and late (cancer) fatalities, for each modeled release for each of the output files.
The accident risks are the conditional results multiplied by the accident frequencies. ABWR frequencies are given in Table 19E.3-6 of SSAR 19_E3.PDF (Section 19E.3 of the ABWR Standard Safety Analysis Report, Amendment 31); ESBWR frequencies are given in Table 10.3-3a of _10 REV 4 RBO_061909.PDF (in the \Input folder) . Those frequencies are incorporated into READOTAB and READOTES risks, which are displayed in parentheses adjacent to the corresponding source term category consequence in the program output. The total risk (sum of the individual risks) is given at the bottom of each column of individual source term category release risks and each total risk is also listed beneath the total dose risk column for each output.

9
The fortran program, READOTE1.FOR (same as READOTES, input file READOTES.IN), reads the MACCS2 results of interest from each of the hypothesized releases from each of the ESBWR output files. That program assumes that the entire release category frequency is assigned to each of the dual sources (e.g., BOCa and BOCb) in a category (five of the ten release categories have dual sources). READOTES.IN lists the output files (.out extension assumed) to be read. READOTE1.RSK displays output parameters of interest including the sequence and total conditional 50-mile population dose, economic costs, early fatalities, and late (cancer) fatalities, for each modeled release for each of the output files. Sequence and total risks are presented for the assumed frequency allocation. READOTE2.FOR (input file READOUT.IN) and READOTE2.RSK are analogous to the corresponding READOTE1 files, but with each dual source release category’s entire frequency assigned to the source term with the greater population-dose; the results in READOTE2.RSK are those reported in the ESP. READOTE3.XLS (worksheet= MAX SOURCE RISK) compares the two conservative results: 1) each category represented by the greater population-dose source (i.e., READOTE2) and 2) each risk metric being represented by the category’s source that yields the greater value of that metric (i.e., the maximum risk metric from READOTE1); it is seen that assumption #1 (READOTE2) leads to practically the same risks as assumption #2.
SENSIT2 WITH % CHANGES FROM BASE.XLS gives the population dose and cost-risk differences of each of the sensitivity cases from the base case. The risks in that spreadsheet come from READOTE2.RSK.The accident risks are the conditional results multiplied by the GE-Hitachi supplied frequencies in, for example, PRA Table 10.3-3a. Those frequencies are incorporated into READOTE2.FOR and the risks are displayed in parentheses adjacent to the corresponding source term category impact in READOTE2.RSK. The total risk (sum of the individual risks) is given at the bottom of each column of individual source term category release risks and each total risk is also listed beneath the total dose risk column for each output.